That's the question you should be asking yourself.
Our market is incredibly diverse and rapidly changing. Values vary not just by neighborhood but by street. Your home isn't necessarily worth what your neighbors' home is. It's the current market that sets the value of your home.
So, do you know what your home is worth in today's market?
Icanhelp...
Contact me for a confidential, no obligation assessment of your home's value.
MoreBuyersAreMakingMoves IsItTimeToSell?
More people are taking steps to buy a home. And, if you’ve been waiting for the right time to move, this may be the sign you’ve been looking for.
For the past few years, a lot of would-be homebuyers hit pause on their plans. With rising mortgage rates and affordability challenges, buying just didn’t seem doable. But now, more of them are getting back out there. That’s because they’re getting used to the fact that this may be the new normal for the market – especially as forecasts show mortgage rates may be starting to stabilize.
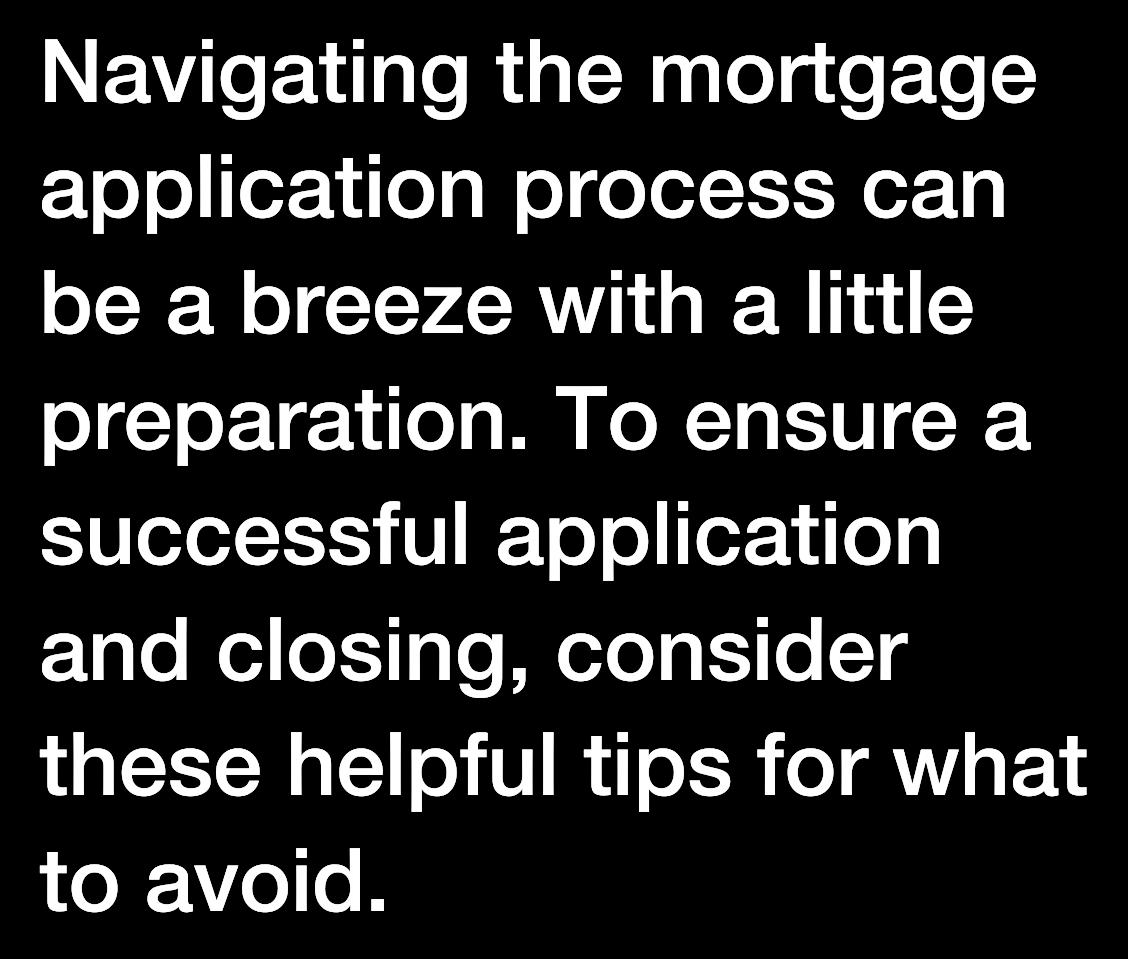
Smart Strategies for a Mortgage Application
Avoid paying off debts or collections without professional advice.
Don't have your credit report pulled too many times - this can hurt your credit score. 3 4 5 6 1 2
Always consult your mortgage professional before making large financial moves. Use verified funds for deposits to prevent closing delays.
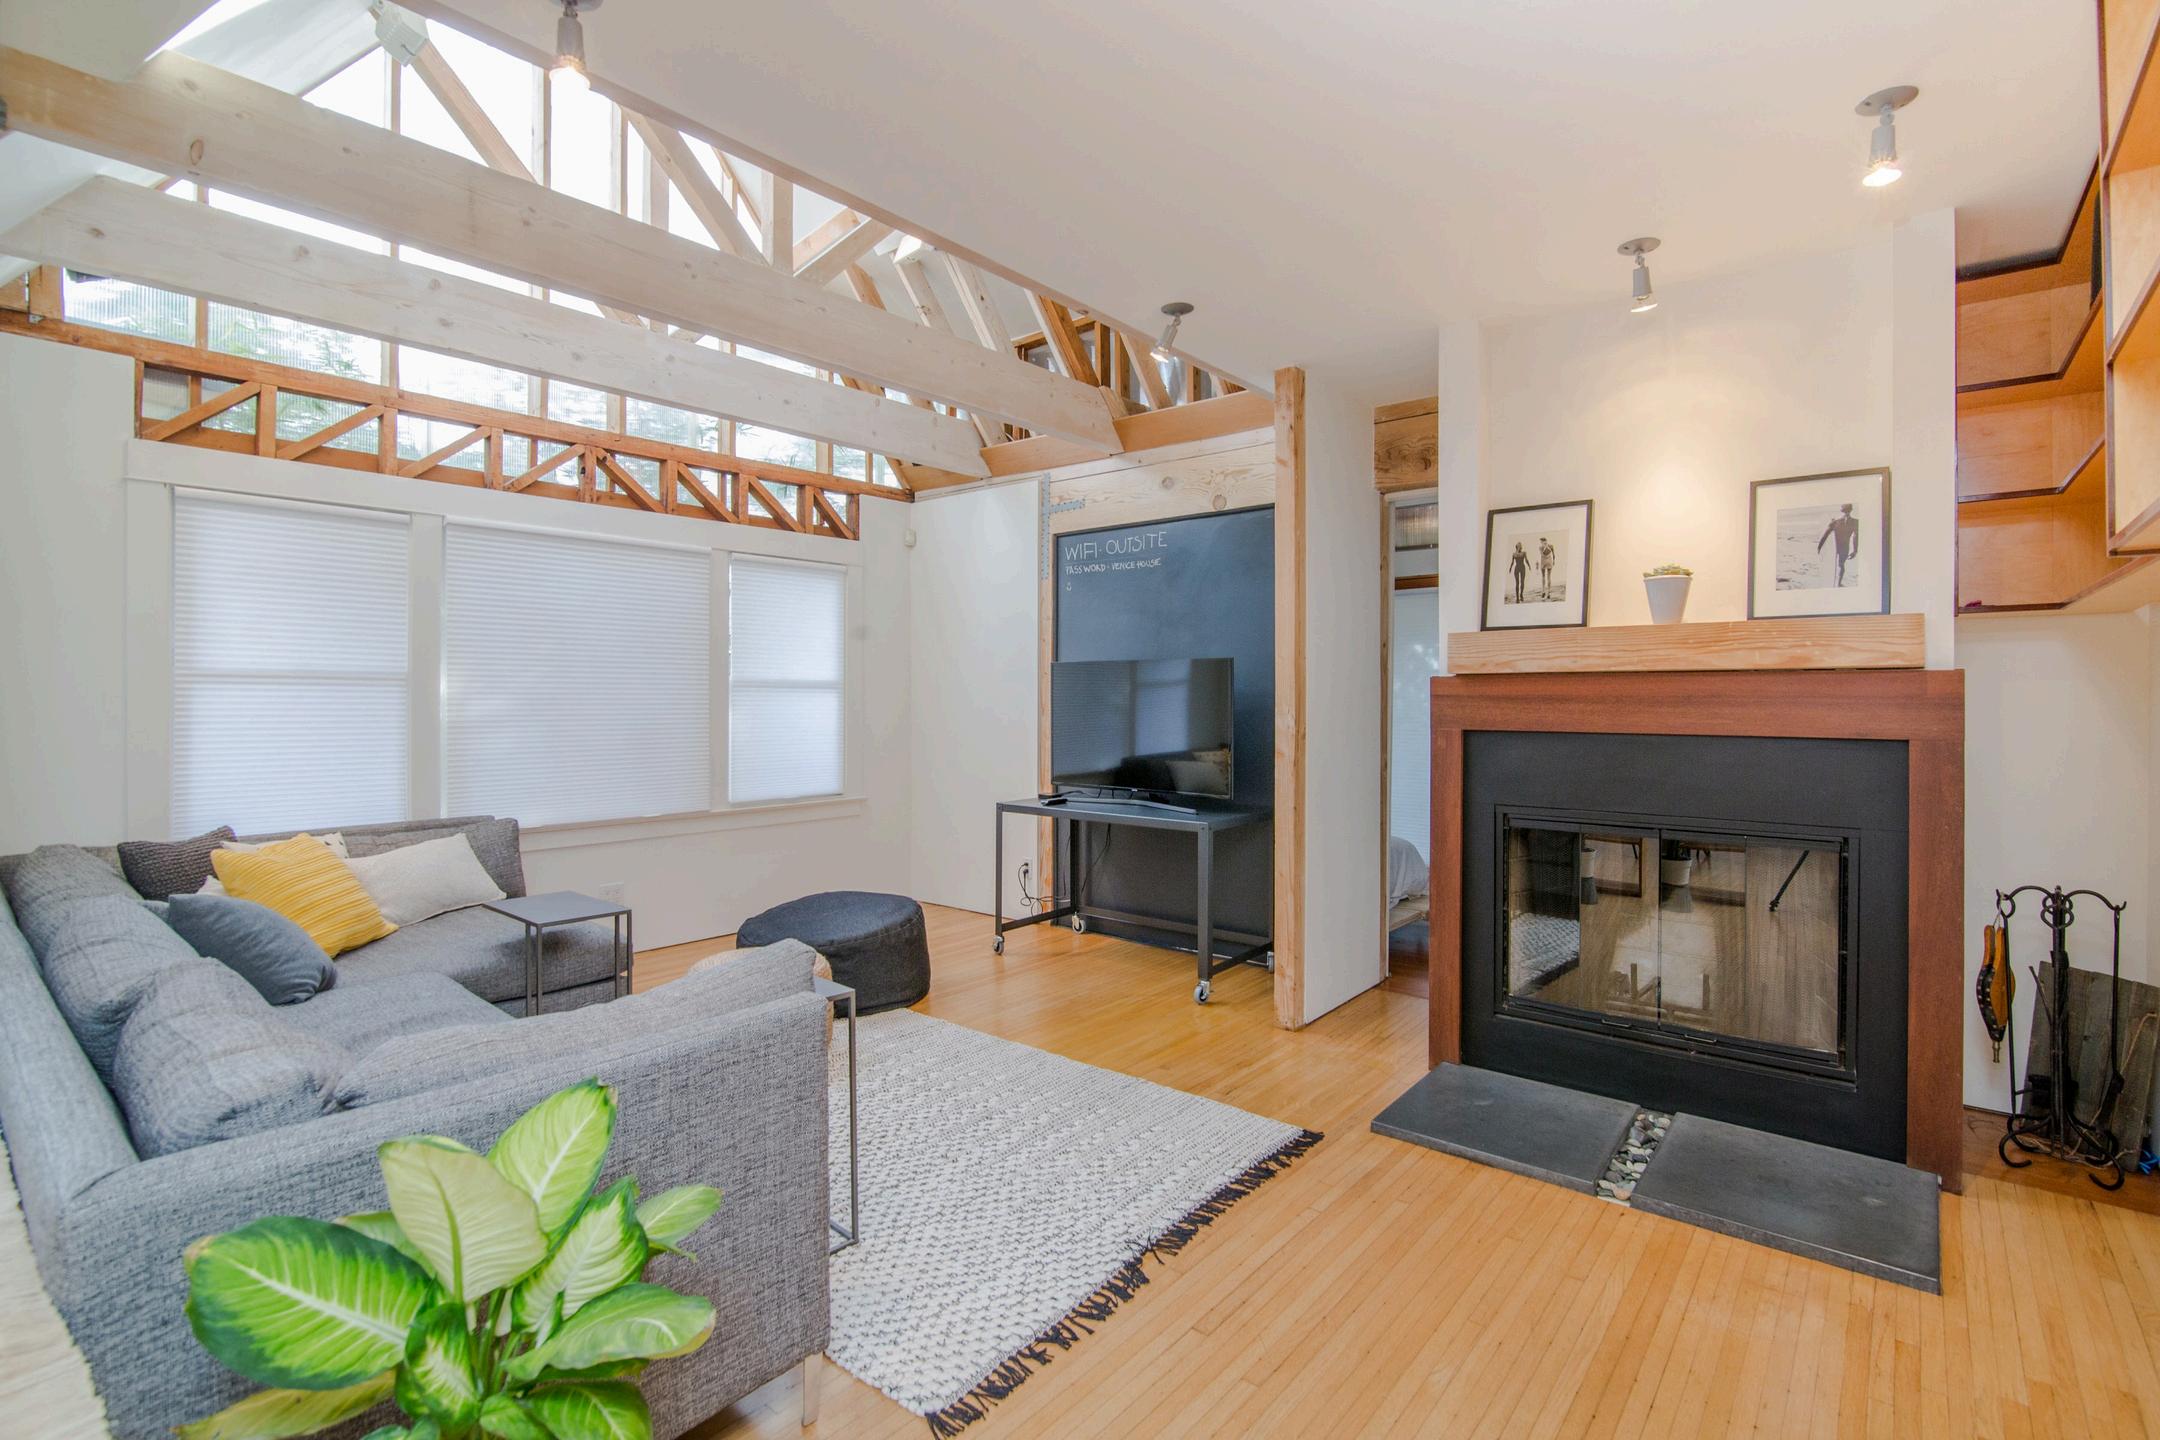
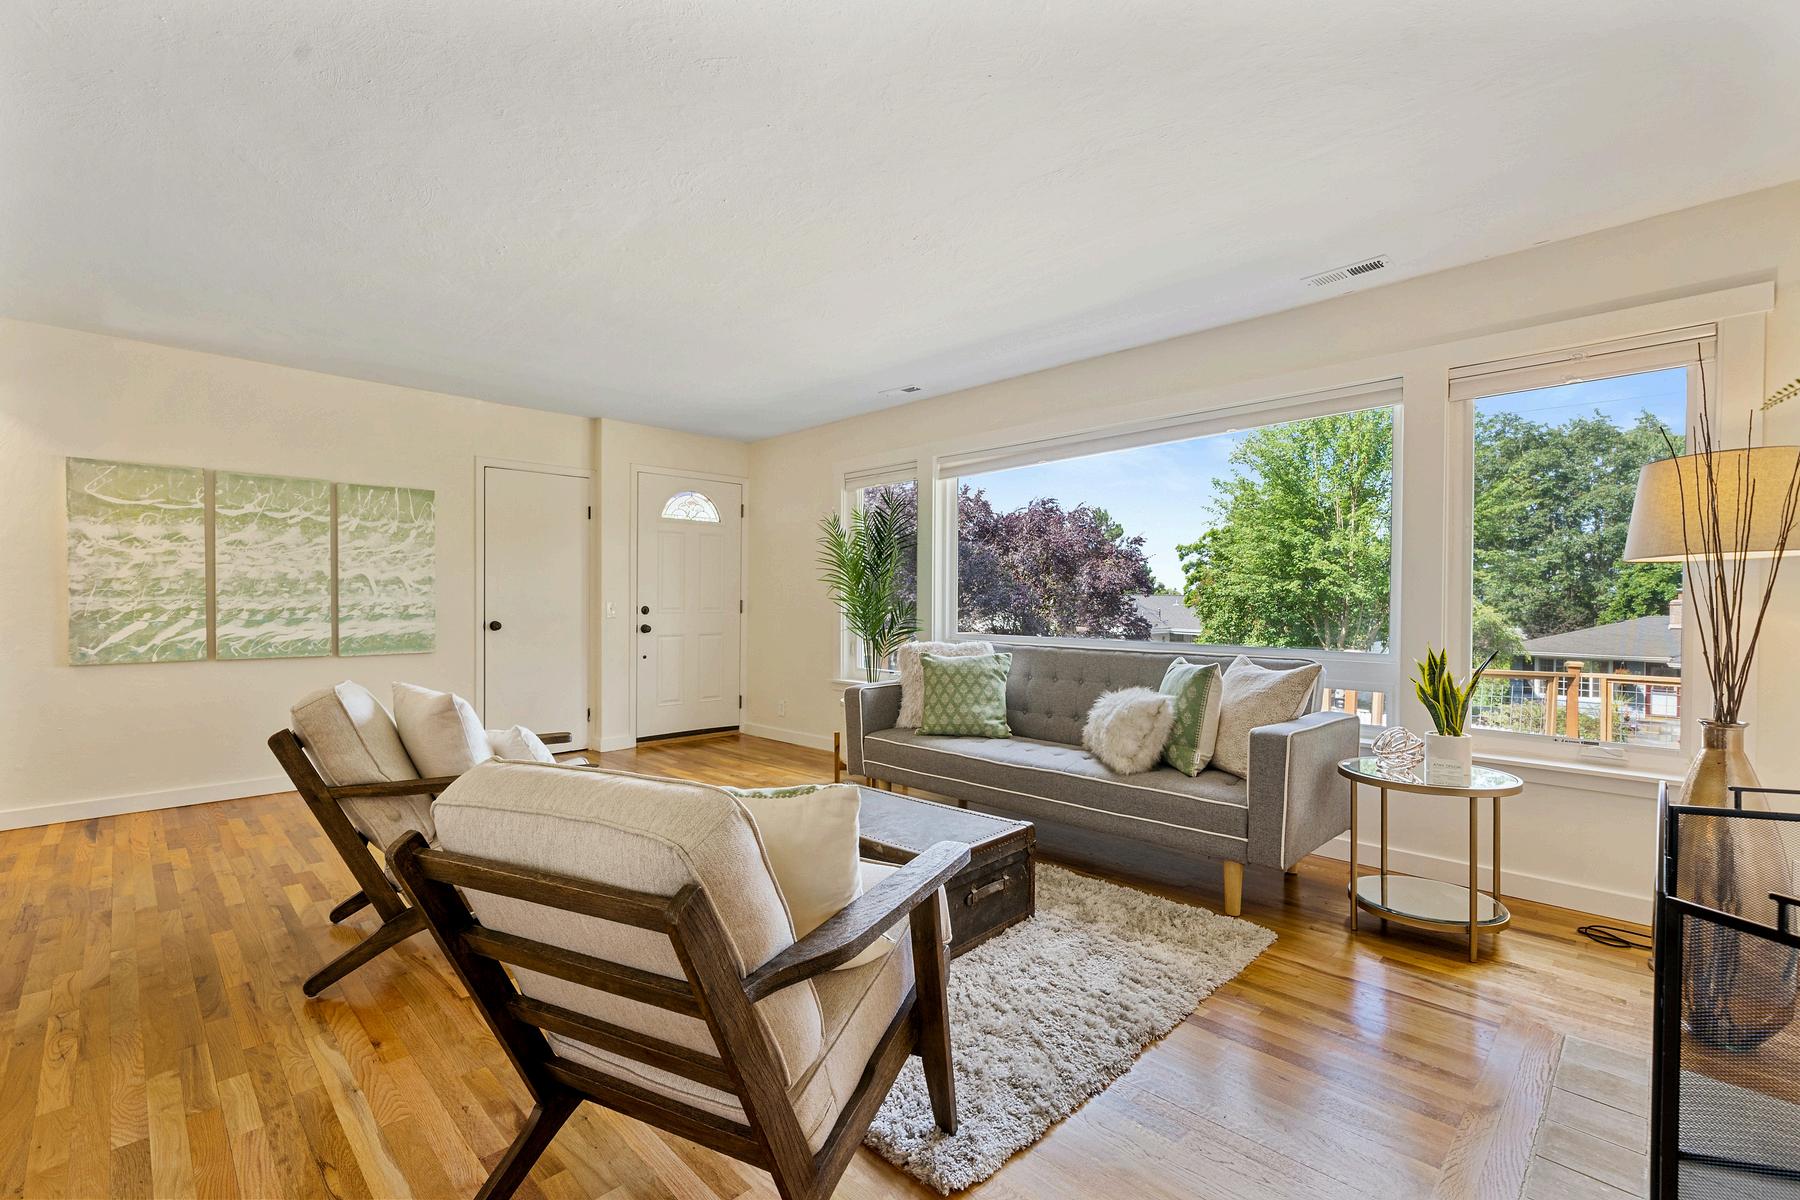
HomeRenovationsThatCanMakea BIG IMPACT AccordingtoExperts
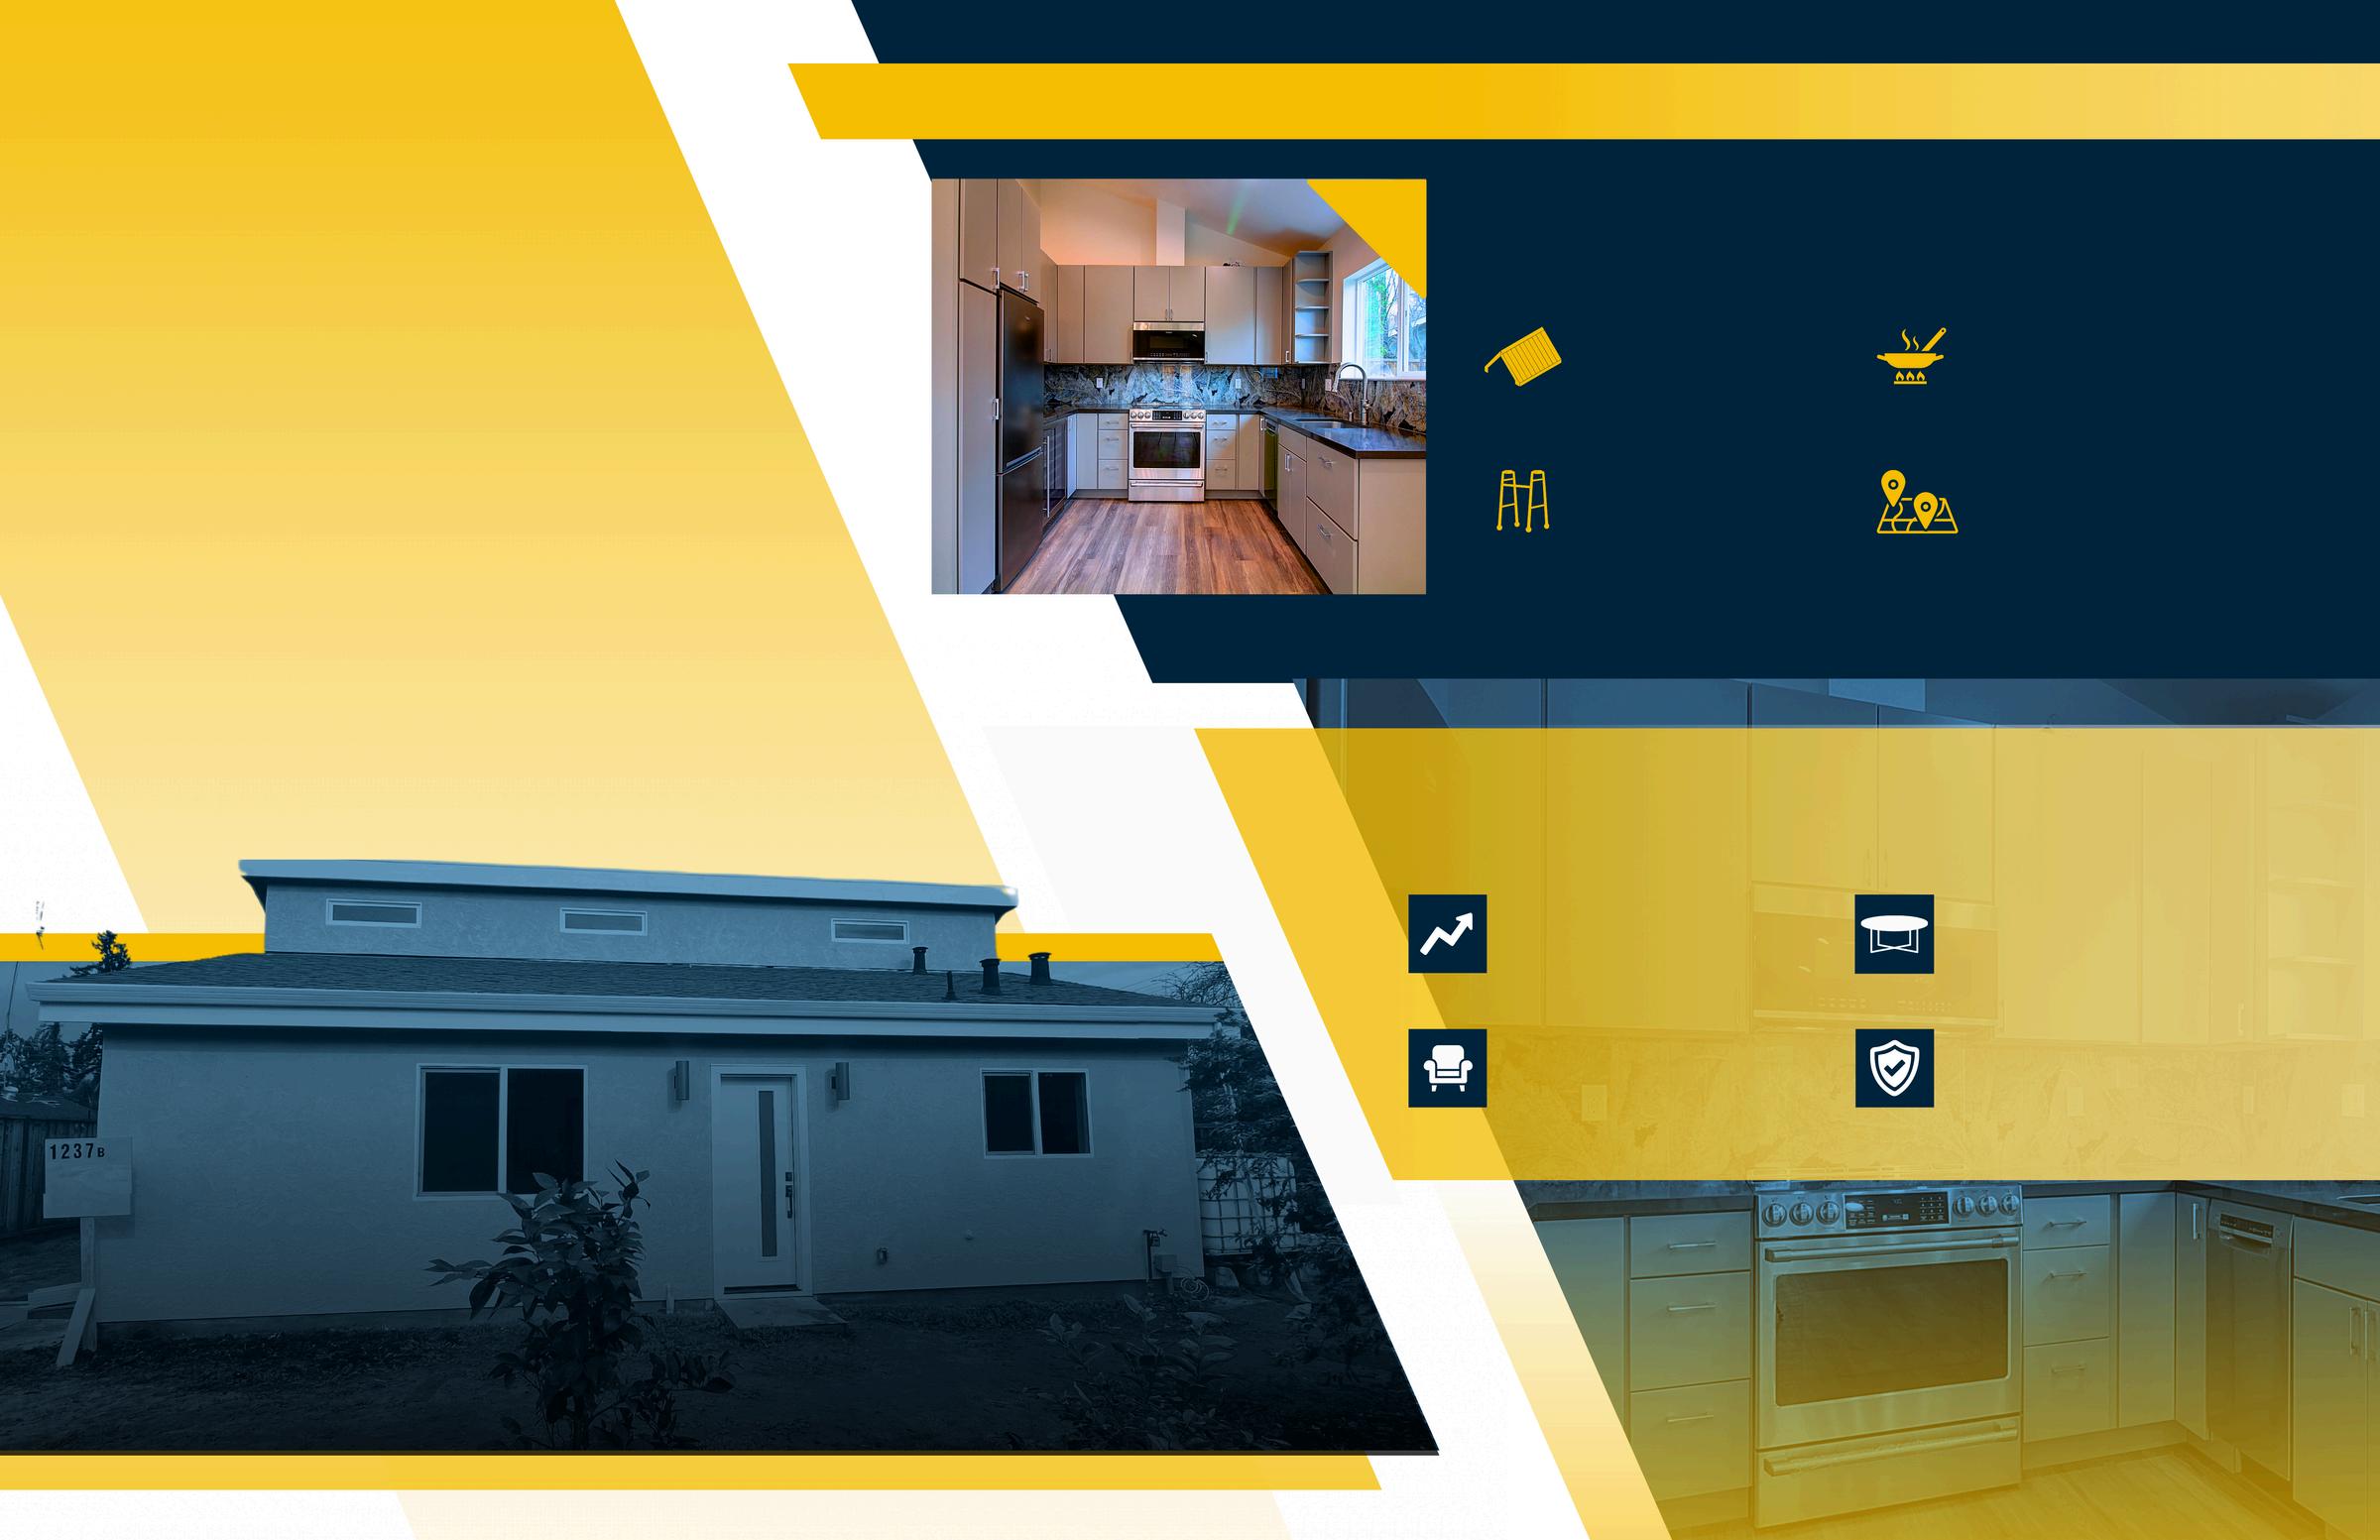
Enhancing Property Value and Family Living Space with an Acton ADU
The Anenberg-Essert family in Campbell collaborated with Acton ADU to create a versatile, comfortable, and valuable addition to their property. This ADU project is a shining example of how a well-designed accessory dwelling unit can increase property value and serve a family’s unique needs.
GoalsandVision
The family envisioned an ADU that would function as an independent living space for family members, enhance their property’s worth, and provide seamless integration with the main home They wanted a space that balanced privacy with connectivity, feeling like a natural extension of their residence
Design and Construction Details
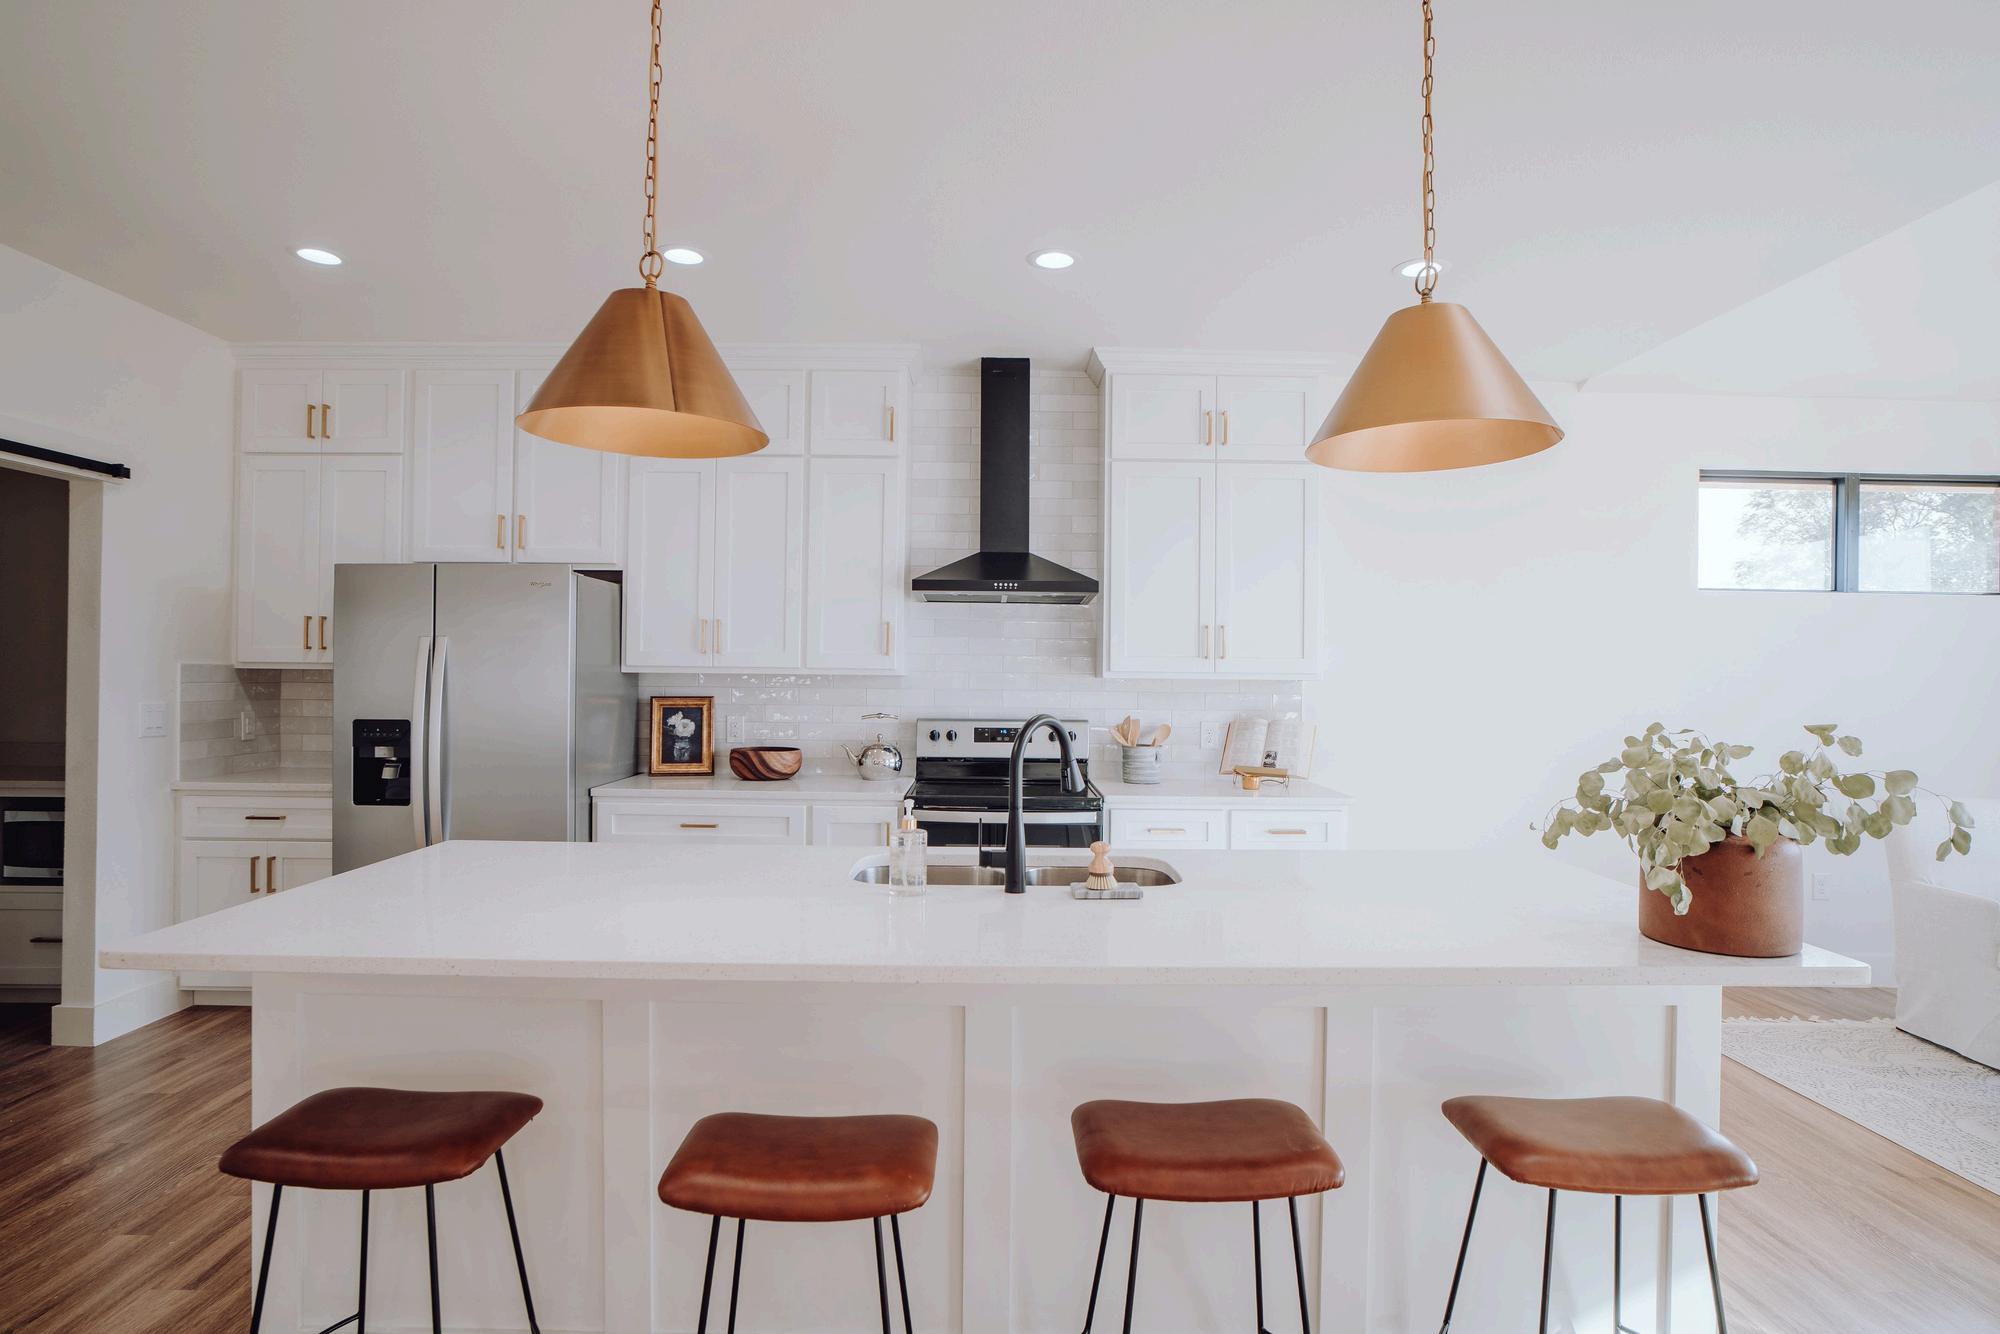
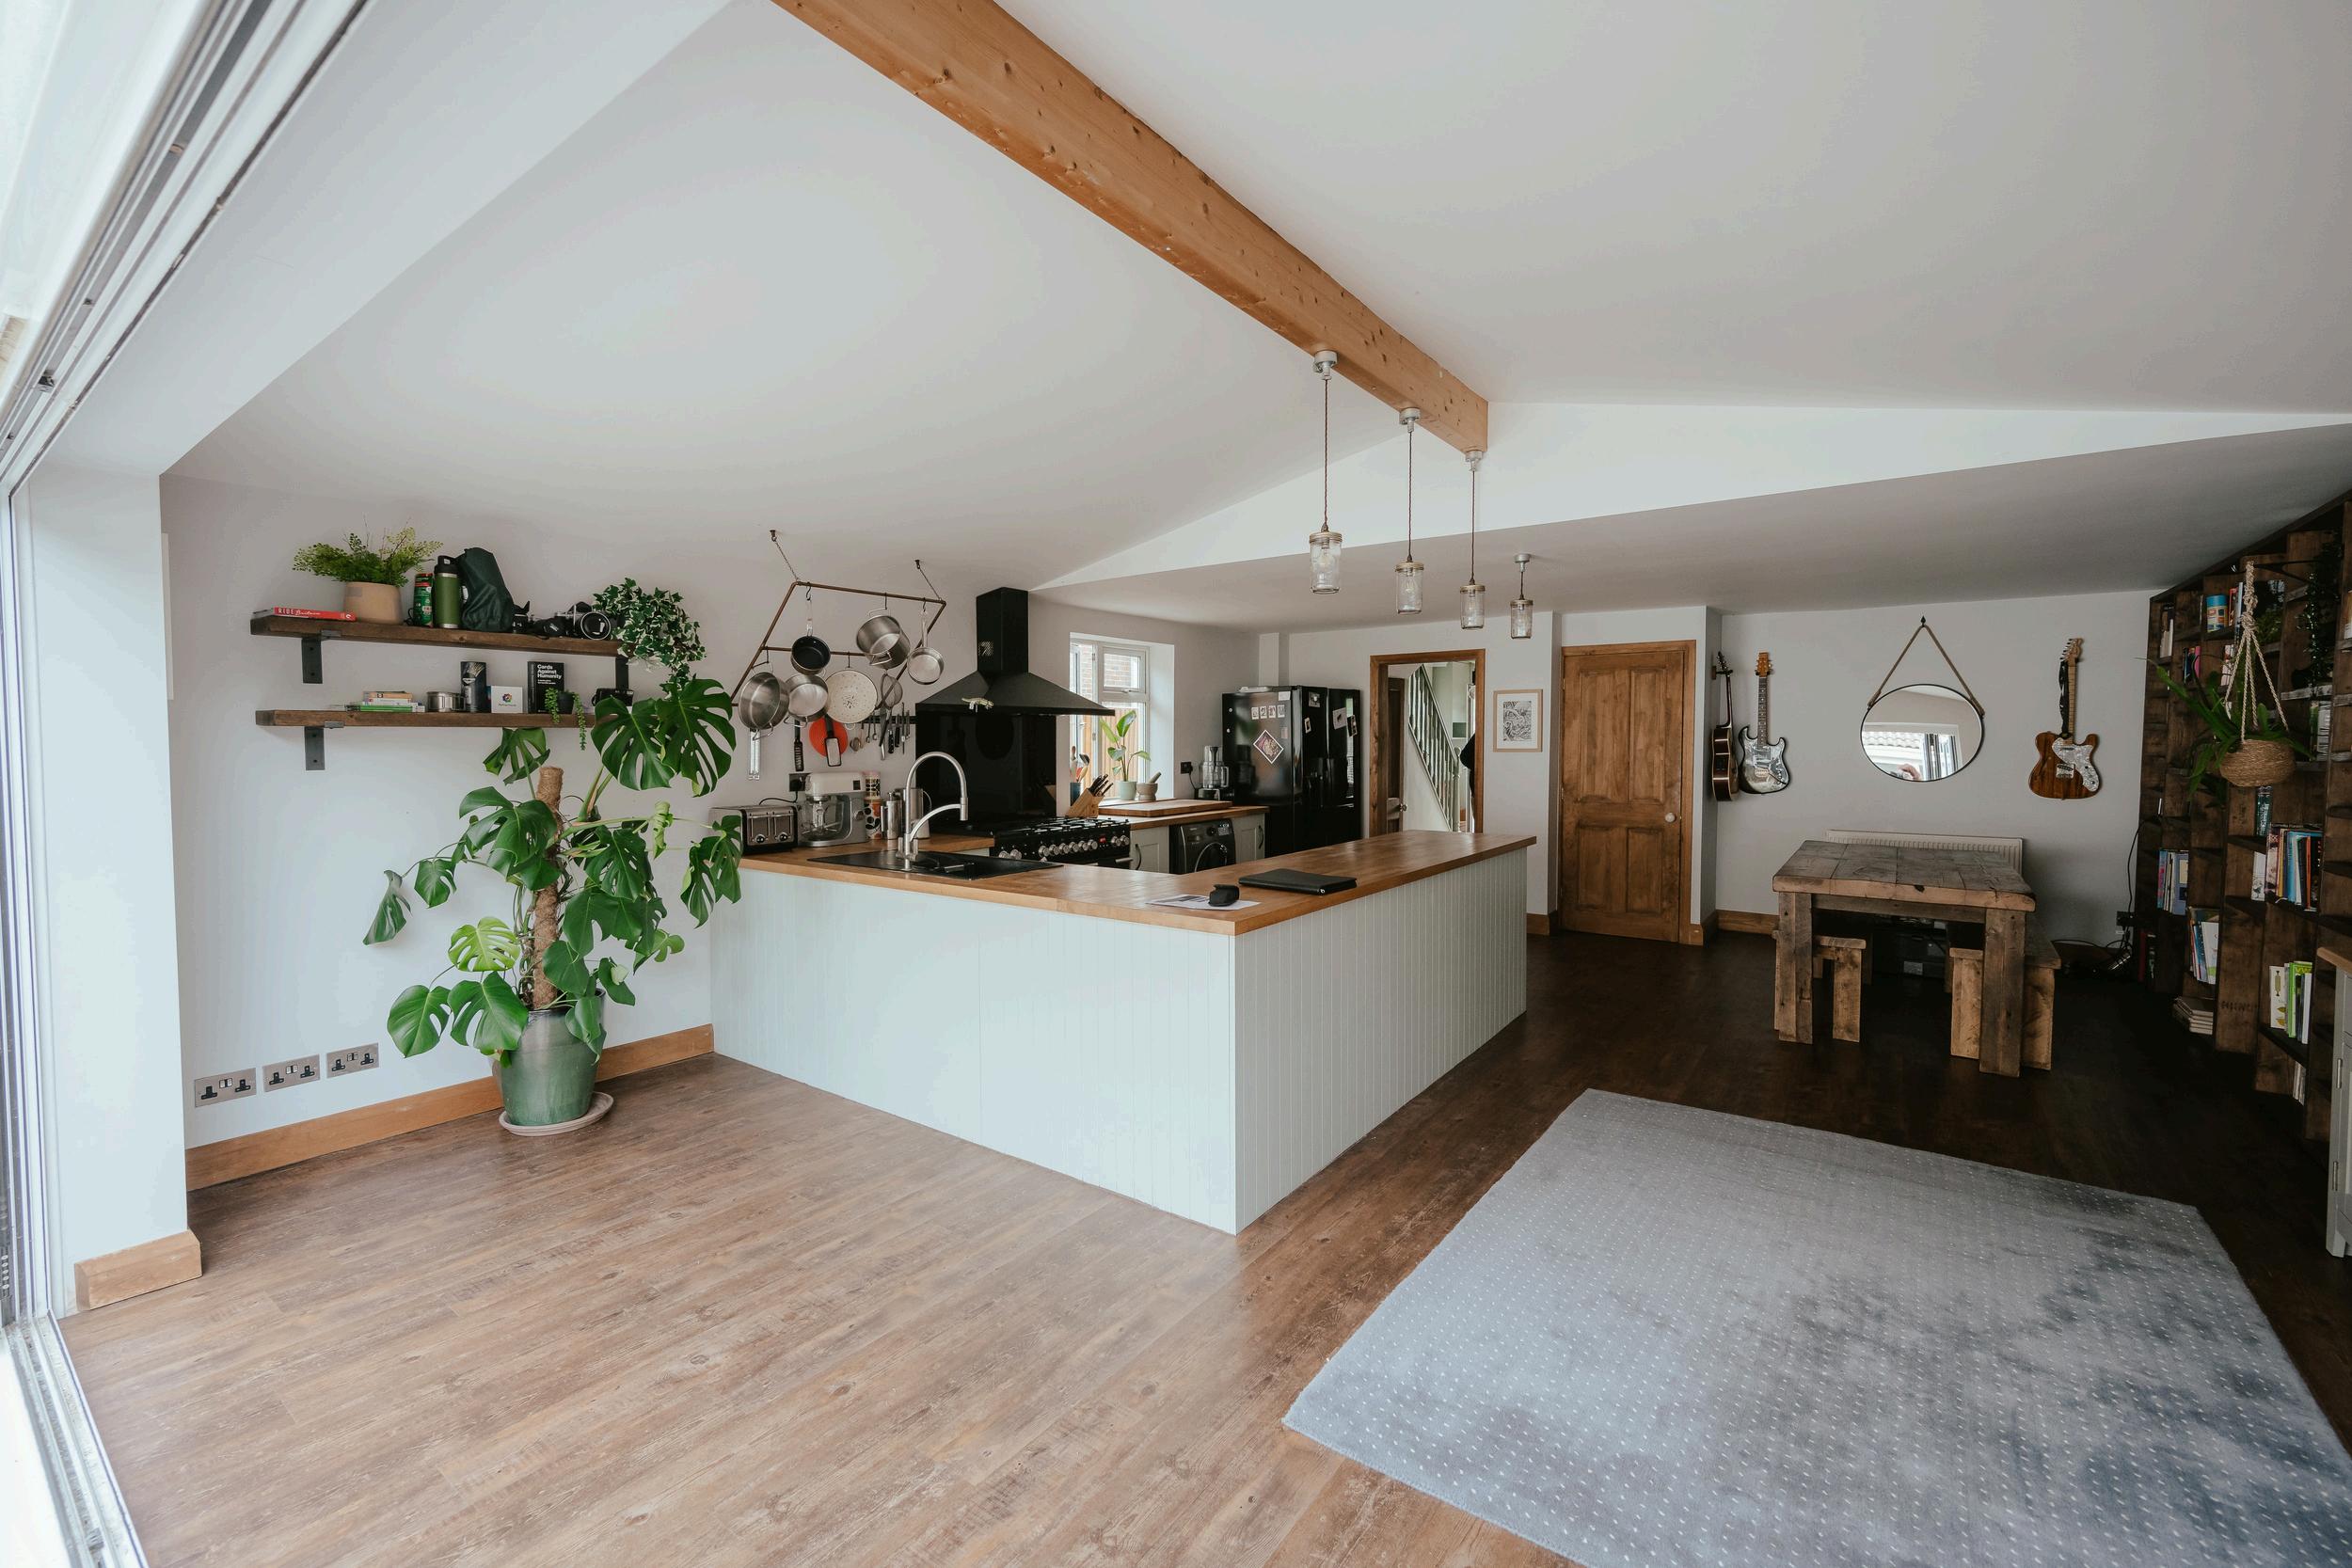
Constructed at 747 square feet, this ADU was designed with modern, high-quality finishes to serve both aesthetic and practical needs. Key features include:
Vaulted Ceilings
Creates a spacious, open atmosphere
Senior-Friendly Living
Safe, independent space for elderly family members
Fully Equipped Kitchen
Modern amenities for everyday convenience
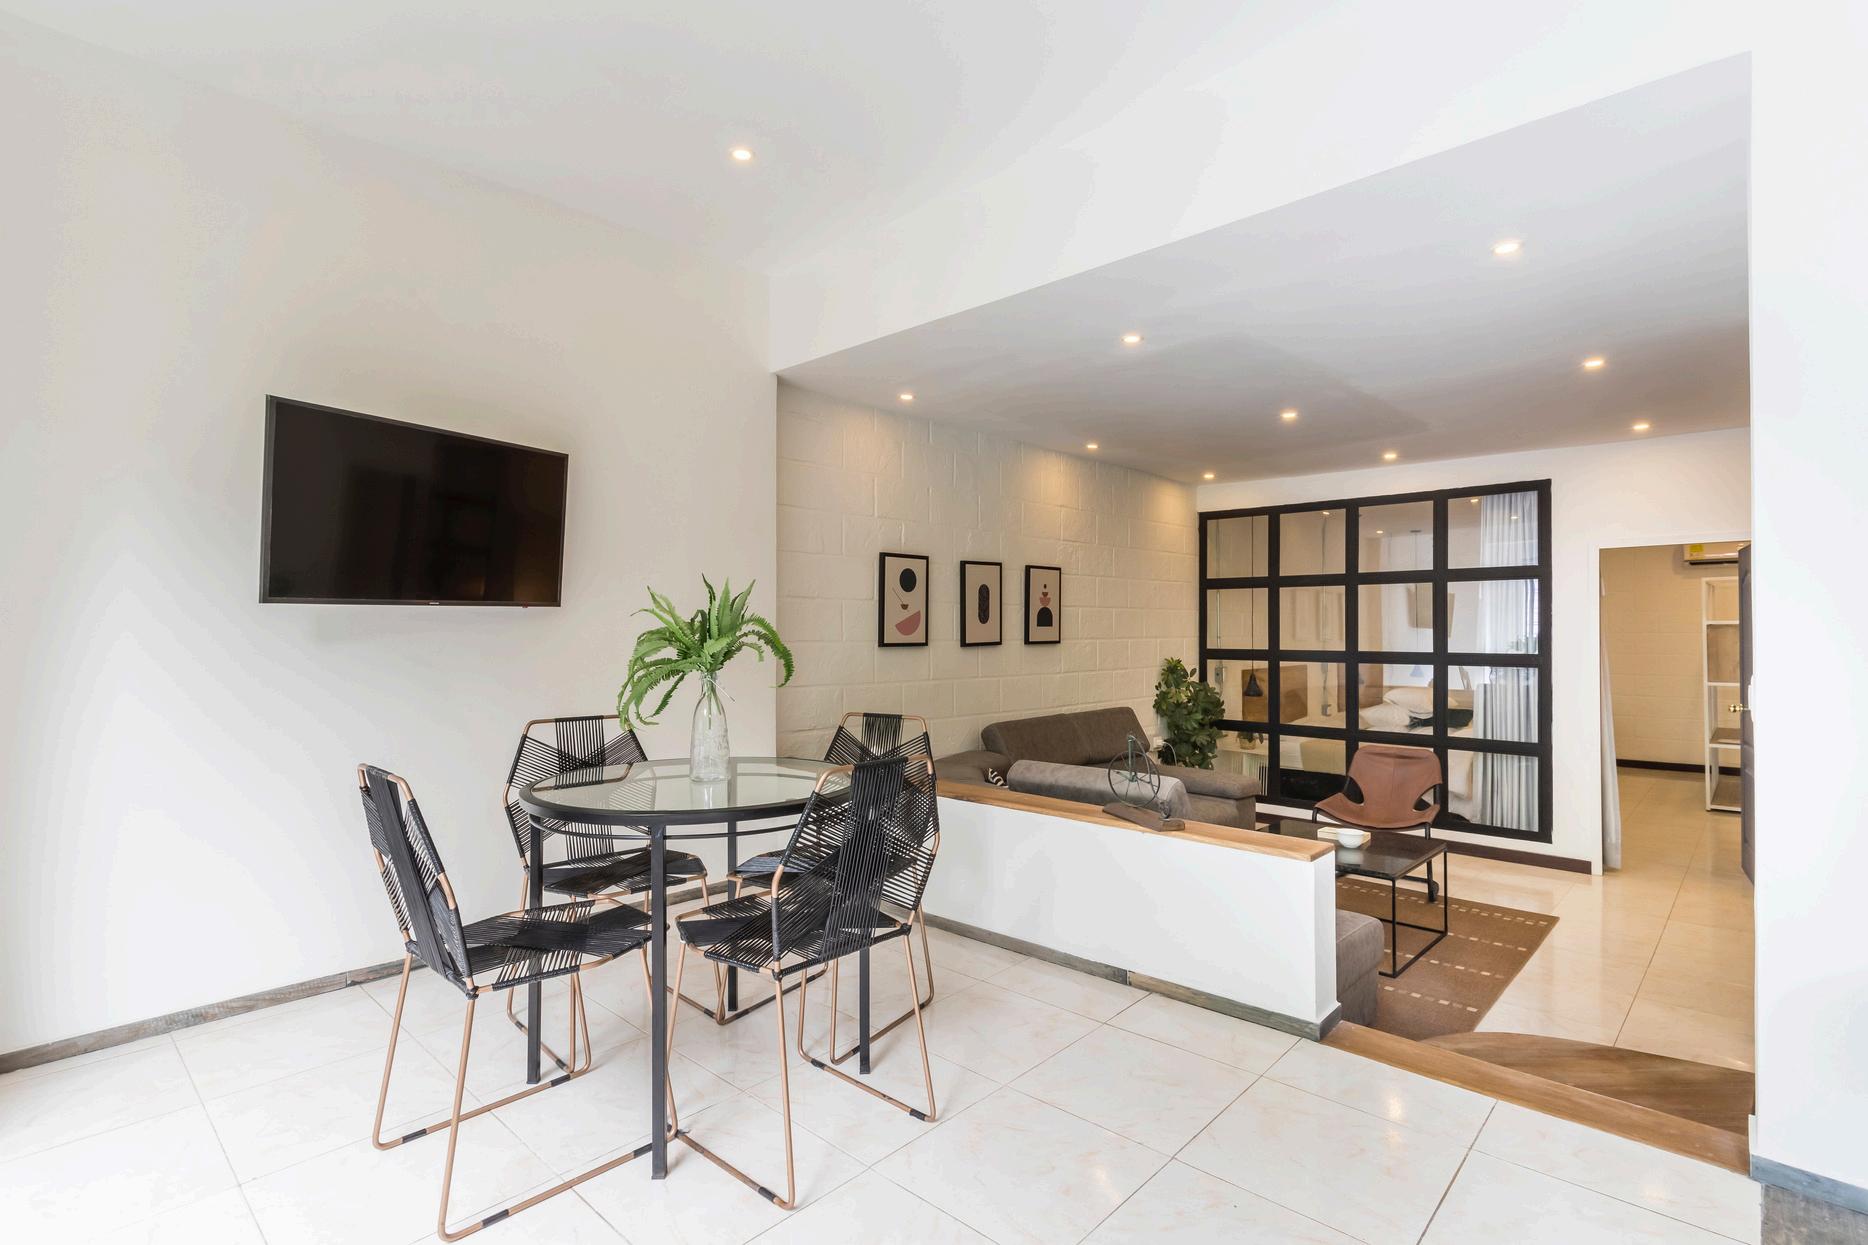
Open Living Area
Multipurpose area for relaxation and entertainment
Results and Impact
The completion of the Anenberg-Essert ADU led to several valuable outcomes:
Increased Property Value
The ADU addition significantly boosted property value
Flexible Living Space
A versatile space for family, guests, or as a rental
Modern Comforts
High-end finishes and amenities enhance both function and style.
Enhanced Family Living
The ADU enriches the AnenbergEssert family’s home with both privacy and connection
VENDOR DIRECTORY
When it comes to home ownership, knowing who you can trust is crucial. That's why we've curated a select list of trusted vendors who are ready to help with your home goals.
H Family Homes
s nventory
11 Sold Listings
$1.7M Median Sale Price
.8% vs List
24 Avg Days on Market
from Broker Metrics, includes all single-family homes, condos and California Area from February 2024 to February 2025. This may data, and may vary from the time the data was gathered. All data is not guaranteed. DRE# 01345026. Copyright KW Advisors Fremont 2025. Each office is independently owned and operated.
35
New Listings
15
Sold Listings
1.9
Months of Inventory
$980K
Median Sale Price
107.6%
Median Sale vs List
13 Avg Days on Market
FEBRUARY 2024 - FEBRUARY 2025
Single-Family Homes
Last 12 months, year-over-year.
Condos & Townhomes
Last 12 months, year-over-year
Median SalesPrice
Single-Family Homes
The median sale price has increased from $1 7m last February 2024, to $1 78m as of February 2025
Condos & Townhomes
The median sale price has decreased from $1 1m last February 2024, to $980k as of February 2025
AVGDays OntheMarket
Single-Family Homes
The average time spent on the market went up from 10 days last February 2024, to 24 days as of February 2025
Condos & Townhomes
The average time spent on the market went down from 15 days in February 2024, to 13 days as of February 2025.
Overbids
Single-Family Homes
The overbid percentage has increased from 108 5% last February 2024, to 109% a year later
Condos & Townhomes
The overbid percentage has increased from 107% last February 2024, to 107.6% a year later.
Frem
What's in
There were 16 providing 1 mo new listings, a of $1.7m. The 107.5%, with a
There were 13 sale, providing 62 new listings price of $886k was at 102.2% market.
110 New Listings
52 Sold Listings
1 Month of Inventory
$1.7M Median Sale Price
107.5%
Median Sale vs List
10 Avg Days on Market
and may data is Fremont
Condo & Town 62 New Listings
Median Sale Price 102.2% Median Sale vs List 17 Avg Days on Market 28 Sold Listings
2 Months of Inventory
FEBRUARY 2024 - FEBRUARY 2025
INGS FOR SALE SOLD LISTINGS
amily Homes months, year-over-year. & Townhomes months, year-over-year
Median SalesPrice
Single-Family Homes
The median sale price has decreased from $1 7125m last February 2024, to $1 712m as of February 2025
Condos & Townhomes
The median sale price has decreased from $960k last February 2024, to $886k as of February 2025
AVGDays OntheMarket
Single-Family Homes
The average time spent on the market remained the same from 10 days last February 2024, to 10 days as of February 2025
Condos & Townhomes
The average time spent on the market went up from 16 days in February 2024, to 17 days as of February 2025.
Overbids
Single-Family Homes
The overbid percentage has decreased from 109 1% last February 2024, to 107 5% a year later
Condos & Townhomes
The overbid percentage has increased from 101.5% last February 2024, to 102.2% a year later.
Newark
What's in the Newark data?
There were 48 single-family homes for sale, providing 0.8 months of inventory. There we new listings, and 19 homes sold at a median of $1.3m. The median overbid percentage w 102.5%, with an average of 18 days on the m
There were 35 condo and townhome units fo sale, providing 2.6 months of inventory. Ther were 16 new listings and 2 units sold at a me sale price of $1.1m. The median overbid percentage was at 102.8%, with an average o days on the market.
30 New Listings
Homes
19 Sold Listings
0.8 Months of Inventory
$1.3M
Median Sale Price
102.5%
Median Sale vs List
18 Avg Days on Market
sourced from Broker Metrics, includes all single-family homes, condos and the California Area from February 2024 to February 2025. This may minary data, and may vary from the time the data was gathered. All data is reliable but not guaranteed. DRE# 01345026. Copyright KW Advisors Fremont 2025. Each office is independently owned and operated.
16
New Listings
2
Sold Listings
2.6
Months of Inventory
$1.1M
Median Sale Price
102.8%
Median Sale vs List
15 Avg Days on Market
FEBRUARY 2024 - FEBRUARY 2025
NGS FOR SALE SOLD LISTINGS
amily Homes months, year-over-year. & Townhomes months, year-over-year
Median SalesPrice
Single-Family Homes
The median sale price has increased from $1 35m last February 2024, to $1 36m as of February 2025
Condos & Townhomes
The median sale price has increased from $770k last February 2024, to $1 1m as of February 2025
AVGDays OntheMarket
Single-Family Homes
The average time spent on the market went up from 6 days last February 2024, to 18 days as of February 2025
Condos & Townhomes
The average time spent on the market went up from 13 days in February 2024, to 15 days as of February 2025.
Overbids
Single-Family Homes
The overbid percentage has decreased from 105 4% last February 2024, to 102 5% a year later
Condos & Townhomes
The overbid percentage has decreased from 107.9% last February 2024, to 102.8% a year later.
UnionCity
What's in the Union City data?
There were 49 single-family homes for sale, providing 0.9 months of inventory. There were 26 new listings, and 17 homes sold at a median price of $1.6m. The median overbid percentage was at 109.1%, with an average of 15 days on the market.
There were 29 condo and townhome units for sale, providing 2.5 months of inventory. There were 12 new listings and 4 units sold at a median sale price of $822k. The median overbid percentage was at 103.2%, with an average of 24 days on the market.
SFH
Single-Family Homes
26 New Listings
17 Sold Listings
0.9 Months of Inventory
$1.6M
Median Sale Price
109.1%
Median Sale vs List
15 Avg Days on Market
The data, sourced from Broker Metrics, includes all single-family homes, condos and townhomes in the California Area from February 2024 to February 2025. This may include preliminary data, and may vary from the time the data was gathered. All data is deemed reliable but not guaranteed. DRE# 01345026. Copyright KW Advisors Fremont 2025. Each office is independently owned and operated.
12
New Listings
4
Sold Listings
2.5
Months of Inventory
$822K
Median Sale Price
103.2%
Median Sale vs List
24 Avg Days on Market
FEBRUARY 2024 - FEBRUARY 2025 LISTINGS FOR SALE
Single-Family Homes
Last 12 months, year-over-year.
Condos & Townhomes
Last 12 months, year-over-year
Median SalesPrice
Single-Family Homes
The median sale price has increased from $1 4m last February 2024, to $1 6m as of February 2025
Condos & Townhomes
The median sale price has increased from $598k last February 2024, to $822k as of February 2025
AVGDays OntheMarket
Single-Family Homes
The average time spent on the market went up from 10 days last February 2024, to 15 days as of February 2025
Condos & Townhomes
The average time spent on the market went up from 12 days in February 2024, to 24 days as of February 2025.
Overbids
Single-Family Homes
The overbid percentage has increased from 107% last February 2024, to 109 1% a year later
Condos & Townhomes
The overbid percentage has increased from 102.8% last February 2024, to 103.2% a year later.
Hayw
What's in the
There were 127 single providing 1.8 months new listings, and 34 h of $986k. The median 104.2%, with an avera
There were 85 condo sale, providing 2.8 mo were 40 new listings a sale price of $705k. T percentage was at 98 days on the market.
64 New Listings
34 Sold Listings
1.8 Months of Inventory
$986K Median Sale Price
104.2% Median Sale vs List
22 Avg Days on Market
single-family homes, condos and 2024 to February 2025. This may the data was gathered. All data is Copyright KW Advisors Fremont 2025. Each office is independently owned and operated.
40
New Listings
20 Sold Listings
2.8
Months of Inventory
$705K
Median Sale Price 98.7%
Median Sale vs List 19 Avg Days on Market
FEBRUARY 2024 - FEBRUARY 2025
Family Homes
2 months, year-over-year.
s & Townhomes
2 months, year-over-year
Median SalesPrice
Single-Family Homes
The median sale price has decreased from $1m last February 2024, to $986k as of February 2025
Condos & Townhomes
The median sale price has decreased from $785k last February 2024, to $705k as of February 2025
AVGDays OntheMarket
Single-Family Homes
The average time spent on the market went up from 17 days last February 2024, to 22 days as of February 2025
Condos & Townhomes
The average time spent on the market went down from 33 days in February 2024, to 19 days as of February 2025.
Overbids
Single-Family Homes
The overbid percentage has increased from 103 6% last February 2024, to 104 2% a year later
Condos & Townhomes
The overbid percentage has decreased from 103.8% last February 2024, to 98.7% a year later.
Castro Valley
What's in the Castro Valley data?
There were 48 single-family homes for sale, providing 0.8 months of inventory. There were 31 new listings, and 17 homes sold at a median price of $1.2m. The median overbid percentage was at 101 5%, with an average of 18 days on the market
There were 27 condo and townhome units for sale, providing 3.3 months of inventory. There were 10 new listings and 4 units sold at a median sale price of $682k. The median overbid percentage was at 101.1%, with an average of 36 days on the market.
SFH
Single-Family Homes
31 New Listings
17 Sold Listings
0.8 Months of Inventory
$1.2M
Median Sale Price
101.5%
Median Sale vs List
18 Avg Days on Market
The data, sourced from Broker Metrics, includes all single-family homes, condos and townhomes in the California Area from February 2024 to February 2025. This may include preliminary data, and may vary from the time the data was gathered. All data is deemed reliable but not guaranteed. DRE# 01345026. Copyright KW Advisors Fremont 2025. Each office is independently owned and operated.
New Listings
3.3 Months of Inventory $682K Median Sale Price 101.1% Median Sale vs List 36 Avg Days on Market 4 Sold Listings
CastroValley
FEBRUARY 2024 - FEBRUARY 2025
LISTINGS FOR SALE SOLD LISTINGS
Single-Family Homes
Last 12 months, year-over-year.
Condos & Townhomes
Last 12 months, year-over-year
Median SalesPrice
Single-Family Homes
The median sale price has increased from $1 24m last February 2024, to $1 28m as of February 2025
Condos & Townhomes
The median sale price has decreased from $857k last February 2024, to $682k as of February 2025
AVGDays OntheMarket
Single-Family Homes
The average time spent on the market remained the same from 18 days last February 2024, to 18 days as of February 2025
Condos & Townhomes
The average time spent on the market went up from 9 days in February 2024, to 36 days as of February 2025.
Overbids
Single-Family Homes
The overbid percentage has decreased from 104% last February 2024, to 101 5% a year later
Condos & Townhomes
The overbid percentage has increased from 93.2% last February 2024, to 101.1% a year later.
San Leandro
What's in the San Leandro
data?
There were 78 single-family homes for sale, providing 1.3 months of inventory. There were 41 new listings, and 28 homes sold at a median price of $864k. The median overbid percentage was at 104%, with an average of 16 days on the market
There were 33 condo and townhome units for sale, providing 5.8 months of inventory. There were 16 new listings and 7 units sold at a median sale price of $510k. The median overbid percentage was at 101.5%, with an average of 46 days on the market.
SFH
Single-Family Homes
41 New Listings
28 Sold Listings
1.3 Months of Inventory
$864K Median Sale Price
104%
Median Sale vs List
16 Avg Days on Market
The data, sourced from Broker Metrics, includes all single-family homes, condos and townhomes in the California Area from February 2024 to February 2025. This may include preliminary data, and may vary from the time the data was gathered. All data is deemed reliable but not guaranteed. DRE# 01345026. Copyright KW Advisors Fremont 2025. Each office is independently owned and operated.
New Listings
7 Sold Listings
5.8
Months of Inventory
$510K
Median Sale Price
101.5%
Median Sale vs List 46 Avg Days on Market
SanLeandro
FEBRUARY 2024 - FEBRUARY 2025
LISTINGS FOR SALE SOLD LISTINGS
Single-Family Homes
Last 12 months, year-over-year.
Condos & Townhomes
Last 12 months, year-over-year
Median SalesPrice
Single-Family Homes
The median sale price has decreased from $875k last February 2024, to $864k as of February 2025
Condos & Townhomes
The median sale price has decreased from $580k last February 2024, to $510k as of February 2025
AVGDays OntheMarket
Single-Family Homes
The average time spent on the market went up from 11 days last February 2024, to 16 days as of February 2025
Condos & Townhomes
The average time spent on the market went up from 19 days in February 2024, to 46 days as of February 2025.
Overbids
Single-Family Homes
The overbid percentage has increased from 101 1% last February 2024, to 104% a year later
Condos & Townhomes
The overbid percentage has decreased from 103.8% last February 2024, to 101.5% a year later.
Tri-Cit
What's in the Tri-C
There were 265 single-family providing 1 month of invento new listings, and 88 homes s of $1.6m. The median overbi 106.9%, with an average of 1
There were 194 condo and to sale, providing 2.2 months of were 90 new listings and 34 sale price of $977k The med percentage was at 102.4%, w days on the market.
166 New Listings
1 Month of Inventory
106.9% Median Sale vs List
88 Sold Listings
$1.6M Median Sale Price
13 Avg Days on Market
single-family homes, condos and February 2025. This may was gathered. All data is KW Advisors Fremont
90
New Listings
& Townhomes
34 Sold Listings
2.2
Months of Inventory
$977K
Median Sale Price
102.4%
Median Sale vs List 18 Avg Days on Market
FEBRUARY 2024 - FEBRUARY 2025
TINGS FOR SALE SOLD LISTINGS
Family Homes
months, year-over-year. & Townhomes
months, year-over-year
Median SalesPrice
Single-Family Homes
The median sale price has increased from $1 5m last February 2024, to $1 6m as of February 2025
Condos & Townhomes
The median sale price has increased from $892k last February 2024, to $977k as of February 2025
AVGDays OntheMarket
Single-Family Homes
The average time spent on the market went up from 10 days last February 2024, to 13 days as of February 2025
Condos & Townhomes
The average time spent on the market went up from 15 days in February 2024, to 18 days as of February 2025.
Overbids
Single-Family Homes
The overbid percentage has decreased from 108 2% last February 2024, to 106 9% a year later
Condos & Townhomes
The overbid percentage has decreased from 102.5% last February 2024, to 102.4% a year later.
Plea
What's in
There were 101 providing 1.4 m new listings, an of $1.6m. The m 99.6%, with an a
There were 41 c sale, providing 1 were 17 new lis sale price of $9 percentage was days on the ma
62 New Listings
28 Sold Listings
1.4 Months of Inventory
$1.6M Median Sale Price
99.6% Median Sale vs List
17 Avg Days on Market
includes all single-family homes, condos and February 2024 to February 2025. This may from the time the data was gathered. All data is 01345026. Copyright KW Advisors Fremont 2025. Each office is independently owned and operated.
Listings
Listings
Median SalesPrice
Single-Family Homes
The median sale price has decreased from $1 8m last February 2024, to $1 6m as of February 2025
Condos & Townhomes
The median sale price has increased from $746k last February 2024, to $910k as of February 2025
AVGDays OntheMarket
Single-Family Homes
The average time spent on the market went up from 14 days last February 2024, to 17 days as of February 2025
Condos & Townhomes
The average time spent on the market went up from 9 days in February 2024, to 29 days as of February 2025.
Overbids
Single-Family Homes
The overbid percentage has increased from 98 8% last February 2024, to 99 6% a year later
Condos & Townhomes
The overbid percentage has decreased from 102% last February 2024, to 100.2% a year later.
SanRamon
What's in the San Ramon data?
There were 63 single-family homes for sale, providing 1.5 months of inventory. There were 38 new listings, and 11 homes sold at a median price of $1.9m. The median overbid percentage was at 98.7%, with an average of 13 days on the market.
There were 59 condo and townhome units for sale, providing 4.5 months of inventory. There were 30 new listings and 8 units sold at a median sale price of $1.2m. The median overbid percentage was at 100.9%, with an average of 19 days on the market.
SFH
Single-Family Homes
38 New Listings
11 Sold Listings
1.5 Months of Inventory
$1.9M
Median Sale Price
98.7%
Median Sale vs List
13 Avg Days on Market
The data, sourced from Broker Metrics, includes all single-family homes, condos and townhomes in the California Area from February 2024 to February 2025. This may include preliminary data, and may vary from the time the data was gathered. All data is deemed reliable but not guaranteed. DRE# 01345026. Copyright KW Advisors Fremont 2025. Each office is independently owned and operated.
30
New Listings
8
Sold Listings
4.5
Months of Inventory
$1.2M
Median Sale Price
100.9%
Median Sale vs List
19 Avg Days on Market
FEBRUARY 2024 - FEBRUARY 2025
ISTINGS FOR SALE SOLD LISTINGS
le-Family Homes
12 months, year-over-year.
dos & Townhomes
12 months, year-over-year
Median SalesPrice
Single-Family Homes
The median sale price has increased from $1 8m last February 2024, to $1 9m as of February 2025
Condos & Townhomes
The median sale price has increased from $1 1m last February 2024, to $1 2m as of February 2025
AVGDays OntheMarket
Single-Family Homes
The average time spent on the market went down from 16 days last February 2024, to 13 days as of February 2025
Condos & Townhomes
The average time spent on the market went down from 22 days in February 2024, to 19 days as of February 2025.
Overbids
Single-Family Homes
The overbid percentage has decreased from 105 2% last February 2024, to 98 7% a year later
Condos & Townhomes
The overbid percentage has decreased from 102.8% last February 2024, to 100.9% a year later.
Liverm
What's in the Liver
There were 131 single-family providing 1.1 months of inve new listings, and 50 homes s of $1.3m. The median overbi 103.9%, with an average of 1
There were 39 condo and tow sale, providing 0.9 months of were 19 new listings and 10 sale price of $728k. The med percentage was at 98.2%, wi days on the market.
88 New Listings
1.1 Months of Inventory
103.9% Median Sale vs List
50 Sold Listings
$1.3M Median Sale Price
10 Avg Days on Market
homes, condos and February 2025. This may was gathered. All data is KW Advisors Fremont
19
New Listings
10
Sold Listings
0.9
Months of Inventory
$728K
Median Sale Price 98.2%
Median Sale vs List
16 Avg Days on Market
Livermore
FEBRUARY 2024 - FEBRUARY 2025
LISTINGS FOR SALE SOLD LISTINGS
Single-Family Homes
Last 12 months, year-over-year.
Condos & Townhomes
Last 12 months, year-over-year
Median SalesPrice
Single-Family Homes
The median sale price has decreased from $1 31m last February 2024, to $1 3m as of February 2025
Condos & Townhomes
The median sale price has decreased from $755k last February 2024, to $728k as of February 2025
AVGDays OntheMarket
Single-Family Homes
The average time spent on the market went down from 25 days last February 2024, to 10 days as of February 2025
Condos & Townhomes
The average time spent on the market went down from 21 days in February 2024, to 16 days as of February 2025.
Overbids
Single-Family Homes
The overbid percentage has increased from 103 6% last February 2024, to 103 9% a year later
Condos & Townhomes
The overbid percentage has decreased from 101.3% last February 2024, to 98.2% a year later.
Cupertino
What's in the Cupertino data?
There were 59 single-family homes for sale, providing 1.4 months of inventory. There were 34 new listings, and 8 homes sold at a median price of $3.8m. The median overbid percentage was at 120.4%, with an average of 7 days on the market.
There were 28 condo and townhome units for sale, providing 1.3 months of inventory. There were 15 new listings and 7 units sold at a median sale price of $1.8m. The median overbid percentage was at 104.9%, with an average of 8 days on the market.
SFH
Single-Family Homes
34 New Listings
8 Sold Listings
1.4 Months of Inventory
$3.8M
Median Sale Price
120.4%
Median Sale vs List
7 Avg Days on Market
The data, sourced from Broker Metrics, includes all single-family homes, condos and townhomes in the California Area from February 2024 to February 2025. This may include preliminary data, and may vary from the time the data was gathered. All data is deemed reliable but not guaranteed. DRE# 01345026. Copyright KW Advisors Fremont 2025. Each office is independently owned and operated.
Condo & Townhomes
15
New Listings
7 Sold Listings
1.3
Months of Inventory
$1.8M
Median Sale Price
104.9%
Median Sale vs List
8 Avg Days on Market
Cupertino
FEBRUARY 2024 - FEBRUARY 2025
LISTINGS FOR SALE SOLD LISTINGS
Single-Family Homes
Last 12 months, year-over-year.
Condos & Townhomes
Last 12 months, year-over-year
Median SalesPrice
Single-Family Homes
The median sale price has increased from $3 3m last February 2024, to $3 8m as of February 2025
Condos & Townhomes
The median sale price has increased from $1 4m last February 2024, to $1 8m as of February 2025
AVGDays OntheMarket
Single-Family Homes
The average time spent on the market remained the same from 7 days last February 2024, to 7 days as of February 2025
Condos & Townhomes
The average time spent on the market went down from 13 days in February 2024, to 8 days as of February 2025.
Overbids
Single-Family Homes
The overbid percentage has increased from 110 4% last February 2024, to 120 4% a year later
Condos & Townhomes
The overbid percentage has decreased from 105.5% last February 2024, to 104.9% a year later.
Oakland
What's in the Oakland data?
There were 642 single-family homes for sale, providing 2.6 months of inventory. There were 280 new listings, and 116 homes sold at a median price of $995k. The median overbid percentage was at 110.8%, with an average of 25 days on the market.
There were 282 condo and townhome units for sale, providing 4 8 months of inventory There were 100 new listings and 34 units sold at a median sale price of $506k. The median overbid percentage was at 98.3%, with an average of 62 days on the market.
SFH
Single-Family Homes
280 New Listings
116 Sold Listings
2.6 Months of Inventory
$995K
Median Sale Price
110.8%
Median Sale vs List
25 Avg Days on Market
The data, sourced from Broker Metrics, includes all single-family homes, condos and townhomes in the California Area from February 2024 to February 2025. This may include preliminary data, and may vary from the time the data was gathered. All data is deemed reliable but not guaranteed. DRE# 01345026. Copyright KW Advisors Fremont 2025. Each office is independently owned and operated.
100 New Listings
34 Sold Listings
4.8
Months of Inventory
$506K Median Sale Price 98.3%
Median Sale vs List 62 Avg Days on Market
FEBRUARY 2024 - FEBRUARY 2025
Median SalesPrice
Single-Family Homes
The median sale price has increased from $860k last February 2024, to $995k as of February 2025
Condos & Townhomes
The median sale price has decreased from $640k last February 2024, to $506k as of February 2025
AVGDays OntheMarket
Single-Family Homes
The average time spent on the market went down from 28 days last February 2024, to 25 days as of February 2025
Condos & Townhomes
The average time spent on the market went up from 30 days in February 2024, to 62 days as of February 2025.
Overbids
Single-Family Homes
The overbid percentage has increased from 110 6% last February 2024, to 110 8% a year later
Condos & Townhomes
The overbid percentage has decreased from 99% last February 2024, to 98.3% a year later.