
Reducing beef production costs through swath grazing forage blends during winter
Lead Scientist – Dr. Obioha Durunna Duration – 2021 to 2024
Background
The competitiveness of the cow-calf and stocker operations is enhanced by adequate winter feeding and supplementation strategies. Feed costs could exceed 60% of variable costs in beef operations, especially when delivered to the animals. Therefore, plans that minimize extra costs will improve beef producers' bottom line. Extended grazing systems are associated with a reduced cost of production. Swath grazing is a method of extending grazing and can incorporate simple stands (monocultures) or diverse mixtures. Forage mixtures can perform different roles at harvest in delivering a complementary balance of nutrients to the animals, especially in the winter. Besides their nutritional benefits, weed resistance, improved soil health, and optimized water and light usage are other potential benefits derived from forage mixtures. The blend would also increase flexibility and reduce production risk for forage availability during winter.
Objectives
This 3-year project aims to (1) Evaluate whether a diverse forage mixture constructed to meet the nutritional requirements of growing steers will improve forage yield and availability, forage quality, intake, and growth performance in a winter swath grazing system. Can the forage blend strategy be an alternative to conventional cereal monocultures? (2): The study will determine the production costs and profitability of the simple and complex forage systems. (3) Update the adoption rate of swath and residue grazing in western Canada. In the long term, the results from this project will enable producers to make informed decisions on adopting the strategy that suits their operations and goals. Adopting the forage blend strategy could reduce the need for additional protein energy and other nutrient supplements, thereby reducing the cost of beef production during winter. (4) Evaluate technologies that would enhance animal management (determine/predict performance and control movement)
Materials and Methods
The trial is conducted on a thirty-acre site (divided into six paddocks) where forage blend (SWB) from Union Forage is being compared to SO1-oats (SOO). The paddocks (three each) were randomly assigned to either SWB or SOO. In the first year (2021), Soil samples were collected from random GPS locations from different soil profiles, including 0-3”, 3-6”, 6-12”, and 12-24” for soil quality and health (such as nitrates, carbon, and total organic carbon, infiltration, compaction, and bulk density). On June 2, 2021, May 31, 2022 and June 1, 2023, the entire plot was sprayed with Glyphosate only at 840 g ae/ac. The paddocks were seeded on June 4, 2021, June 7, 2022 and June 6, 2023. Emergence counts were done on day 10 (June 14, 2021, June 17, 2022 and June 16, 2023) and day 21 (June 25, 2021, June 28, 2022 and June 27, 2023) post-seeding. Other activities, including biomass samplings collected at the soft and hard dough stages, are shown in Table 1 In both years, swathing was done on allplotsexcept about30-ftstripsinSWBpaddocks (stockpiled,STP)toprovideknowledgeofpotentialadditional growth capacity with the forage blends, especially with later rains. The regrowth from both treatments and the STP was sampled after a month of swathing to evaluate yield and quality. In both years, forty-two and sixty crossbred steers (seven per paddock in 2021 and 10 per paddock in 2022 and 2023) were randomly assigned into
either SWB or SOO, balancing for body weight and genomic breed composition. The steers acclimatized to their paddocks, electric fences, and treatments. During grazing, the electric cross-fences were moved 40ft every 3 to 6 days to limit the access to swaths and ensure better swath utilization. Windbreaks and free-choice minerals were availablein all paddocks. Bodyweights weredeterminedovertwo consecutivedays at thestartand end ofgrazing and two-week intervals throughout the grazing period. At the start of the trial, steers (2 in 2021, 5 in 2022, 6 in 2023) in each paddock were fitted with rumen pH/temperature boluses (Moonsyst, Ireland). Initial and final ultrasound measures of body fat (backfat, rumpfat, intramuscular fat, and ribeye area) were also taken. 5 and 9 steers were fitted with NoFence GPS collars in 2022 and 2023, respectively, to assess the potential of the technology for the management and movement of animals as they grazed the swath windrows.
Table 1: Timelines on the activities for the project.
Activity 2021 - 2022 2022 - 2023 2023 - 2024 Seeding June 4 June 7 June 6 Emergence Counts June 14, 25 June 17, 28 June 16, 27 Soft dough biomass sampling August 3 August 26 August 29 Hard dough biomass sampling August 17 September 1 September 5 Swathing 1 August 19 September 2 September 6 Stockpiled and
sampling September 2 October 4 October 3 Final Swathing 2, 3, 6 September 14 October 5 October 4 Day 1, 2 trial November 1, 2 November 14, 15 November 1, 2 Insertion of Boluses November 3 November 15 November 7 Ultrasound 1 October 19 October 24 October 23 Installation of NoFence Collars - November 30 November 16 Weighing Nov 2, 16; Dec 1, 15, 29; Jan 12, 26 Nov 30; Dec 14, 28; Jan 11 Nov 1, 15, 29; Dec 13, 27; Jan 10, 24; Feb 7 Ultrasound 2 January 26 January 24 February 8 Grazing end; days January 26, 2022; 87 January 20, 2023; 67 Feb 7, 2024; 99
regrowth biomass
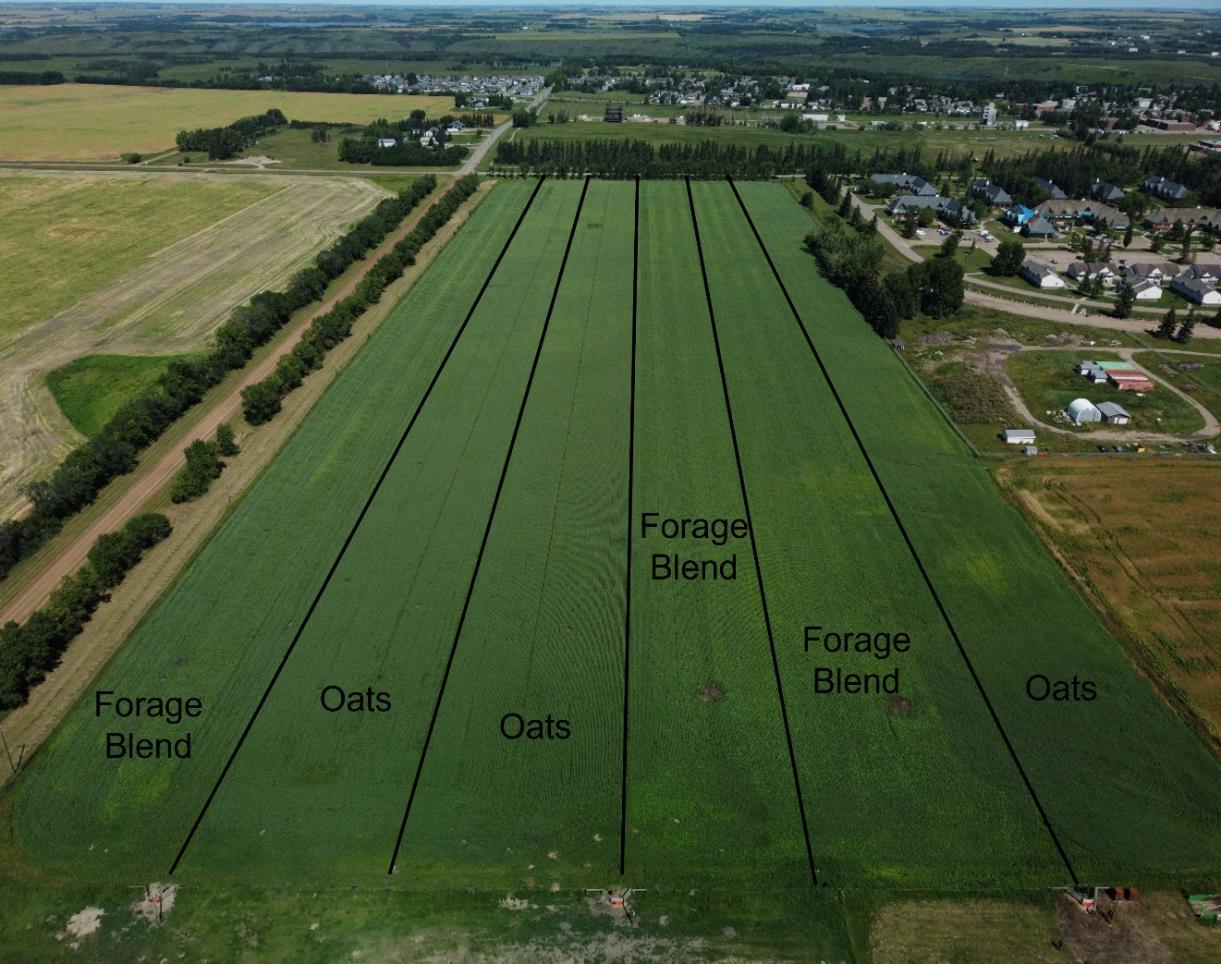
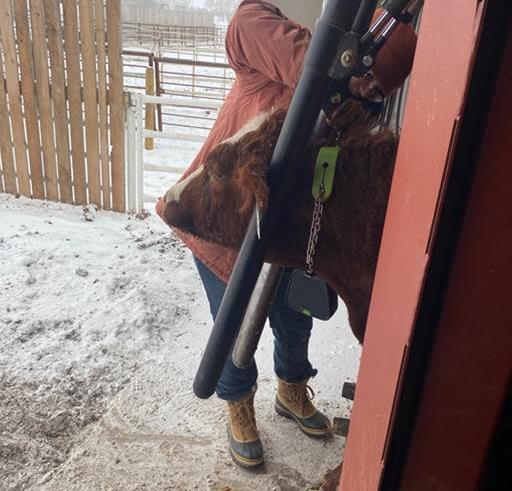
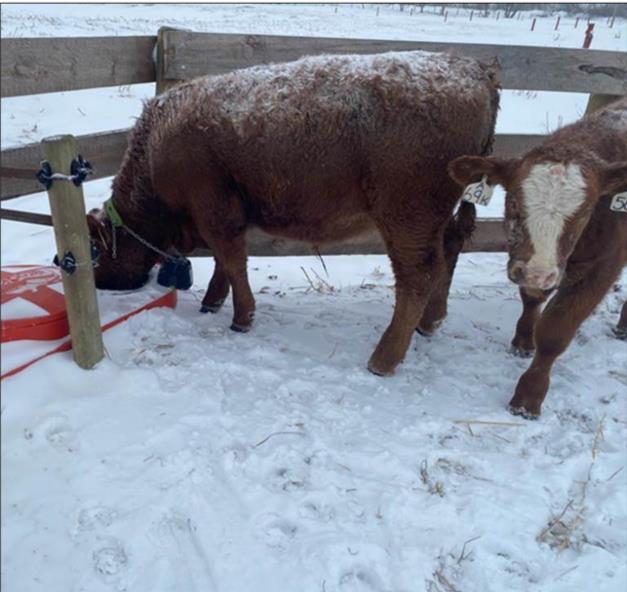 Figure 1: Layout of the paddocks
Table 2. Monthly sum and long-term average precipitation and monthly mean and long-term temperature at Vermilion, AB, during 2021/2022, 2022/2023 and 2023/2024
Source: VermilionAGDM
Table 3: Forage yield (Kg DM Ha-1) from the treatments at different stages
Forage Blend: oats, turnips, rape, and forage peas; T = Treatment; T*Y = Treatment by year
Table 4: Forage yield (KgDMha) of the individual forage species in the forage blend
The yield of the species compositions of the blend at soft and hard
Results
Months Monthly Precipitation (mm) Monthly Mean Temperature (°C) 20212022 20222023 20232024 Average 20212022 20222023 20232024 Average April 1.9 13.5 19.2 11.5 3.8 1.6 2.8 2.7 May 62.2 40.8 11.1 30 10.2 10.6 15.8 12.2 June 65.4 115.9 56.1 79.1 18.4 15.6 17.6 17.2 July 7.2 49.4 63.7 40.1 19.5 17.9 17 18.1 August 44.6 40.3 76.1 53.7 17.5 18.6 16.5 17.5 September 14.9 1.5 18.2 11.5 12.2 13.3 12.2 12.6 October 2.9 0.5 3.6 2.3 3.9 7.0 4.1 5.0 November 13.7 26.4 1.6 13.9 -3.6 -8.4 -1.9 -4.6 December 24 22.6 4.9 17.2 -17.2 -18.1 -4.6 -13.3 January 25.7 8.3 10.6 14.9 -12.7 -10.3 -15.5 12.8 February 14 4.2 15.8 11.3 -11.9 -11.3 -8.1 10.4 March 11 2.8 -4.5 -9.9 Total 287.5 326.2 35.6 26.6
Stages Oats Blend Overall p-value 2021 2022 2023 2021 2022 2023 Oat Blend Y T Y*T SD 4491c 9175a 9622a 3806c 6748b 7213b 7763a 5923b <.0001 <.0001 0.0768 HD 6198b 9475a 11036a 4873b 6603b 7014b 8903a 6163b <.0001 <.0001 0.0523 Regrowth 35.2b 25 8b 41.3b 1305.4a 210.1b 427.9b 34.1b 647.8a 0.0450 0.0029 0.0459
P-value Year Stage Oat Turnip Rape Pea Weed SEM T S T*S 2021 SD 742.9a 479.6abc 140.6cd 72.1d 33.8d 78.71 <.0001 0.1485 0.8799 HD 831.7a 558.8ab 295.1bcd 137.2cd 20.4d 2022 SD 1681.4a 254.7b 294.2b 349.1b 23.9b 211.92 <.0001 0.6490 0.8396 HD 1724.0a 137.0b 185.7b 589.2b 278.6b 2023 SD 1750.8a 548.2b 45.0b 169.4b 48.9b 115.38 <.0001 0.6766 0.8877 HD 1612.3a 449.4b 88.5b 150.8b 106.9b
was significant (p<0.05)
dough stages
The soft dough (SD) and hard dough (HD); Treatment (T); stage (S)
Year Variables Oat Blend p-value SD HD SD HD SEM T S S*T 2021 Crude Protein 11.17 10.28 10.18 9.58 0.790 0.3931 0.4550 0.9299 ADF 30.09 25.61 25.93 27.03 1.266 0.3674 0.2725 0.0944 NDF 54.87a 44.92b 41.26b 40.46b 2.133 0.0004 0.0039 0.1093 TDN 65.46 68.95 68.70 67.84 0.987 0.3683 0.2725 0.0943 Starch 7.40b 17.76a 6.10b 11.82ab 1.717 0.0354 0.0039 0.1085 Fat 4.18 4.26 2.78 3.70 0.545 0.0410 0.7078 0.8258 NEM 1.61 1.71 1.71 1.68 0.029 0.0013 0.7081 0.7589 Calcium 0.24 0.25 0.69 0.60 0.116 0.0013 0.7081 0.7589 Phosphorus 0.15 0.16 0.23 0.24 0.027 0.0005 0.1296 0.1720 Potassium 1.77 1.66 2.29 2.20 0.224 0.0199 0.9466 0.5811 Magnesium 0.18 0.21 0.32 0.38 0.045 0.0042 0.1409 0.4086 RFV 111.02b 143.37ab 155.64a 158.31a 9.363 0.0036 0.0262 0.3140 Sulphur 0.15b 0.19b 0.41a 0.30ab 0.036 0.0002 0.6976 0.1327 2022 Crude Protein 12.60 9.01 12.04 10.02 0.988 0.8260 0.0101 0.4352 ADF 32.19 30.43 32.10 28.92 1.118 0.4830 0.0391 0.5331 NDF 50.98a 49.50ab 48.39ab 45.72b 1.328 0.0262 0.1348 0.6593 TDN 63.83 65.20 63.90 66.37 0.871 0.4837 0.0391 0.5337 Starch 17.36ab 21.47a 14.08b 19.61a 1.355 0.0725 0.0020 0.6070 Fat 3.74 4.21 3.67 3.92 0.150 0.2326 0.0265 0.4794 NEM 1.57 1.61 1.57 1.64 0.025 0.5393 0.0345 0.5393 Calcium 0.25 0.23 0.42 0.42 0.052 0.0024 0.8988 0.8488 Phosphorus 0.27ab 0.23b 0.31a 0.28ab 0.013 0.0059 0.0104 0.7999 Potassium 2.53 2.53 2.82 2.32 0.178 0.2514 0.0284 0.6510 Magnesium 0.16ab 0.15b 0.21a 0.19ab 0.015 0.0050 0.2452 0.9144 RFV 116.76b 122.78ab 124.19ab 135.59a 4.607 0.0400 0.0731 0.5662 Sulphur 0.19 0.21 0.26 0.25 0.026 0.0562 0.7548 0.5750 2023 Crude Protein 7.40 7.51 8.59 9.22 0.525 0.0121 0.4862 0.6291 ADF 28.14a 24.92b 28.00a 26.85ab 0.756 0.2490 0.0091 0.1858 NDF 46.8a 46.0ab 42.6ab 41.6b 1.269 0.0028 0.4791 0.9266 TDN 67.0b 69.5a 67.1b 68.0ab 0.589 0.2497 0.0091 0.1861 Starch 19.98ab 23.36a 16.97b 18.07b 1.079 0.0010 0.0514 0.3038 Fat 3.81ab 4.48a 3.53b 4.28ab 0.195 0.2282 0.0017 0.8429 NEM 1.66b 1.73a 1.66b 1.69ab 0.017 0.2680 0.0084 0.1960 Calcium 0.23b 0.20b 0.52a 0.57a 0.049 <.0001 0.7736 0.4297 Phosphorus 0.27c 0.28bc 0.31ab 0.33a 0.010 0.0002 0.1578 0.9321 Potassium 1.94ab 1.85b 2.47ab 2.50a 0.161 0.0014 0.8538 0.6901 Magnesium 0.16b 0.16b 0.20ab 0.22a 0.012 0.0002 0.2773 0.3401 RFV 133.23 141.42 146.83 153.49 5.518 0.0307 0.1936 0.8921 Sulphur 0.17b 0.17b 0.26a 0.30a 0.019 <.0001 0.2377 0.2377
Table 5: Nutritive Values of the Forage Systems
Table 6: Nutrient composition of each forage species in the blend at the hard dough stage
Year Variable Oat Rape Turnip Pea Weed p-value 2021 Crude Protein 9.18b±1.54 16.77ab±5.77 18.59a±6.06 18.11a±1.20 11.77ab 0.1219 ADF 26.48a±3.07 16.13c±2.34 16.63bc±2.86 21.59ab±2.30 23.44ab 0.0072 NDF 47.58a±2.70 18.95d±2.70 20.57d±3.09 29.59c±1.97 37.90b <.0001 TDN 68.27c±2.39 76.33a±1.82 75.94ab±2.23 72.08bc±1.80 70.64bc 0.0073 Starch 17.97a±1.03 9.08c±2.78 5.89c±0.90 13.17b±2.13 14.80ab 0.0004 Fat 3.45ab±1.07 4.38a±0.53 3.38ab±0.84 2.92b±0.39 2.70b 0.2296 NEM 1.69b±0.07 1.93a±0.05 1.92a±0.07 1.80b±0.05 1.76b 0.0064 Calcium 0.22b±0.04 1.27a±0.05 1.16a±0.88 1.01ab±0.33 0.65ab 0.1383 Phosphorus 0.19a±0.02 0.22a±0.02 0.19a±0.15 0.26a±0.07 0.23a 0.8158 Potassium 1.51a±0.06 2.95a±0.30 2.16a±1.67 1.79a±0.56 2.14a 0.4188 Magnesium 0.18b±0.04 0.77a±0.22 0.47ab±0.35 0.39ab±0.12 0.37ab 0.0937 RFV 134c±11.86 380a±58.46 349a±57.30 227b±10.33 173.38bc 0.0005 Sulphur 0.18b±0.04 0.86a±0.15 0.52ab±0.40 0.31b±0.04 0.39ab 0.0365 2022 Crude Protein 8.50b±1.43 15.94a±6.46 13.62ab±3.50 16.98a±1.47 9.67ab 0.0400 ADF 27.40b±3.36 19.78c±2.38 20.58c±1.19 31.77ab±2.02 36.54a 0.0005 NDF 46.61a±4.30 23.10c±2.44 21.50c±1.89 38.67b±1.68 42.12ab <.0001 TDN 67.56b±2.62 73.49a±1.85 72.87a±0.93 64.16bc±1.58 60.44c 0.0005 Starch 24.79a±2.93 7.12c±1.71 7.69c±2.99 15.27b±6.34 1.90c <.0001 Fat 4.15a±0.60 2.92b±0.64 2.42bc±0.47 1.56c±0.42 1.67bc 0.0009 NEM 1.67b±0.07 1.84a±0.06 1.83a±0.03 1.58bc±0.05 1.47c 0.0005 Calcium 0.19d±0.02 1.43b±0.50 1.71ab±0.19 0.72c±0.08 2.08a <.0001 Phosphorus 0.27b±0.03 0.33ab±0.03 0.36a±0.10 0.25b±0.04 0.24b 0.1306 Potassium 1.67b±0.20 4.16a±0.23 4.08a±0.92 1.81b±0.57 4.02a <.0001 Magnesium 0.15c±0.01 0.41a±0.08 0.48a±0.11 0.24bc±0.01 0.35ab 0.0001 RFV 136b±16.87 299a±39.47 317a±30.50 155b±10.52 133.48b <.0001 Sulphur 0.18b±0.03 0.73a±0.18 0.71a±0.14 0.20b±0.01 0.34b <.0001 2023 Crude Protein 7.05c±1.08 6.34c±1.08 13.06b±1.08 18.40a±1.08 8.06bc 0.0003 ADF 25.44c±1.13 47.73a±1.13 22.02c±1.13 23.06c±1.13 34.51b <.0001 NDF 46.71b±1.72 59.87a±1.72 24.39c±1.72 29.05c±1.72 49.72ab <.0001 TDN 69.09a±0.88 51.72c±0.88 71.74a±0.88 70.94a±0.88 62.02b <.0001 Starch 22.78a±0.75 1.32d±0.92 5.60c±0.75 12.88b±0.75 11.21b <.0001 Fat 4.11b±0.73 10.52a±0.73 2.09b±0.73 2.58b±0.73 4.04b 0.0003 NEM 1.72a±0.03 1.21c±0.03 1.79a±0.03 1.77a±0.03 1.51b <.0001 Calcium 0.21c±0.07 0.76b±0.07 1.68a±0.07 0.78b±0.07 1.01b <.0001 Phosphorus 0.29b±0.02 0.27b±0.02 0.42a±0.02 0.28b±0.02 0.34ab 0.0009 Potassium 1.89b±0.12 2.02b±0.12 4.58a±0.12 2.01b±0.12 2.46b <.0001 Magnesium 0.15c±0.02 0.27b±0.02 0.41a±0.02 0.25bc±0.02 0.29ab 0.0002 RFV 139c±8.70 81d±8.70 274a±8.70 228b±8.70 116cd <.0001 Sulphur 0.17c±0.03 0.44b±0.03 0.66a±0.03 0.25c±0.03 0.23bc <.0001
The nutrient compositions of the forage species in the blend at soft and hard dough stages were significant (p<0.05)
Table
The protein content of the residues in the second year was significant (p<0.05)
Variable Hard Dough Stockpiled Regrowth Residue p-value Crude Protein 10.02b±4.25 9.61b±3.04 17.29a±6.76 6.51c±1.38 <.0001 Sol Protein 48.06b±25.01 63.43a±3.79 53.02ab±1.03 21.28c±2.26 <.0001 ADF 28.92b±2.38 28.98b±1.79 15.56c±0.64 45.21a±2.26 <.0001 NDF 45.72b±2.75 46.22b±2.72 18.20c±1.55 66.64a±3.94 <.0001 TDN 66.37b±1.85 66.33b±1.40 76.78a±0.50 53.68c±1.76 <.0001 Calcium 0.42c±0.17 0.41c±0.13 1.28a±0.19 0.62b±0.16 <.0001 Phosphorus 0.28b±0.03 0.31b±0.02 0.39a±0.07 0.18c±0.04 <.0001 Potassium 2.32b±0.57 1.92b±0.43 2.91a±0.47 0.85c±0.32 <.0001 Magnesium 0.19bc±0.05 0.26b±0.09 0.64a±0.11 0.17c±0.04 <.0001 RFV 136b±11.36 134b±8.47 394a±33.84 75.28c±6.38 <.0001 Sulphur 0.25b±0.09 0.32b±0.13 0.89a±0.17 0.12c±0.04 <.0001 Copper 3.27b±0.45 5.24a±1.67 6.71a±1.32 2.98b±0.97 <.0001 NEM 1.64b±0.06 1.64b±0.04 1.94a±0.02 1.27c±0.05 <.0001
Table 7: 2022 Nutrient composition of the blend at different stages
Variables Oat Blend p-value Crude Protein 5.15±1.16 6.51±1.38 0.0006 Sol Protein 23.14±2.49 21.28±2.26 0.0095 ADF 44.14±3.67 45.21±2.26 0.2260 NDF 68.94±5.00 66.64±3.94 0.0824 TDN 54.52±2.86 53.68±1.76 0.2256 Calcium 0.26±0.05 0.62±0.16 <.0001 Phosphorus 0.13±0.03 0.18±0.04 <.0001 Potassium 1.06±0.29 0.85±0.32 <.0192 Magnesium 0.11±0.02 0.17±0.04 <.0001 RFV 74.24±9.82 75.28±6.38 0.6641 Sulphur 0.09±0.02 0.12±0.04 0.0010 Copper 2.60±1.07 2.98±0.97 0.2013 NEM 1.29±0.08 1.27±0.05 0.2322 NEG 0.57±0.08 0.55±0.05 0.2322 Fat 2.95±0.74 2.41±0.73 0.0143 Sugar 4.45±6.07 3.93±0.81 0.6826 Starch 7.04±3.28 5.14±2.67 0.0332
8: 2022 Swath residue quality of the treatments
Table 9: Steer performance within different treatment groups
Table 9:
Table 10. Cost analysis of oat monoculture and polycrop forage systems over 3 yr Oat Polycrop Notes
oat)
Stages Oats Blend Overall p-value 2021 2022 2023 2021 2022 2023 Oat Blend Y T Y*T Start wt. (lb.) 530.17b 621.85a 623.28a 526.36b 621.85a 613.50a 591.77 587.23 <.0001 0.6572 0.9224 End wt. (lb.) 654.72c 716.04bc 799.67a 674.08c 693.28c 778.12ab 723.48 715.16 <.0001 0.4654 0.2469 ADG (lb/d) 1.45b 1.41b 1.78a 1.72ab 1.41b 1.66ab 1.55 1.48 <.0001 0.2852 0.0028 Rump fat 0.0319ab -0.0083c 0.0087bc 0.0495a -0.0107c 0.0178abc 0.0189 0.0108 0.0002 0.2549 0.5002 Rib fat 0.0162bc 0.0164bc 0.0450a 0.0257ab -0.0055c 0.0356ab 0.0259 0.0186 <.0001 0.1146 0.0334 Ribeye area 1.7476ab 0.0119cd 0.7519bc 2.2143a -0.3722d 0.5630cd 0.8371 0.1285 <.0001 0.1772 0.8486 IMF -0.1605b 0.1167ab 0.3462a -0.0729ab 0.1800ab 0.3530a 0.1008 0.1534 0.0018 0.5278 0.9165
Treatment 2021(lbs) 2022(lbs) 2023(lbs) 2021($/lb) 2022($/lb) 2023($/lb) 2021($) 2022($) 2023($) Oats_Blend 40 40 40 0.22 0.40 0.31 8.80 16.00 12.40 Forage Peas 10 10 10 0.70 0.70 0.70 7.00 7.00 7.00 Forage Blend 5 5 5 5.49 5.49 5.49 27.45 27.45 27.45 Total Blend 43.25 50.45 46.85 Total Oats 30.80 56.00 43.40
Seeding rates and costs
.……$
157kg/ha × $0.55/kg (monocrop
Oat 86.35 24.75 45kg/ha × $0.55/kg (polycrop) Pea 16.94 11kg/ha × $1.54/kg Brassica 14.94 6kg/ha × $2.49/kg Seed Cost (a) 86.35 56.63 Pre-Seed Glyphosate (b) 27.80 27.80 1.65L/ha (0.67L/ac) × $16.80/L Pro-Till 54.34 54.34 Local custom rate Spraying 18.53 18.53 Local custom rate Seeding 64.22 64.22 Local custom rate Swathing 34.58 34.58 Local custom rate Equipment Cost (c) 171.67 171.67 Total Swath Production Costs d=a+b+c 285.82 256.10 Cost per kg DM 0.034 0.043 Total Swath Costs ÷ DM Yield per ha Swath cost per head per day 0.79 0.71 Total Swath Costs/#days/9 hd Swath cost per kg gain 1.156 1.120 Cost per head per day/ADG
per ha…….
Variables Weeks Oat Blend p-value Warning 1 11.67b ± 4.04 23.67a ± 1.53 0.009 2 63.00 ± 42.79 99.33 ± 64.83 0.46 3 17.00 ± 13.00 15.33 ± 9.29 0.86 4 69.00 ± 45.64 69.67 ± 47.27 0.99 5 27.67 ± 11.85 35.00 ± 37.64 0.76 6 60.00 ± 3.61 70.00 ± 63.66 0.79 7 11.67 ± 14.15 1.33 ± 2.31 0.28 Shocks 1 5.33b ± 2.08 12.00a ± 1.73 0.01 2 30.33 ± 23.44 38.67 ± 22.03 0.68 3 3.67 ± 4.04 2.67 ± 3.79 0.77 4 17.00 ± 18.19 17.33 ± 8.62 0.98 5 5.33 ± 4.51 10.33 ± 14.47 0.59 6 9.33 ± 4.16 9.00 ± 11.27 0.96 7 5.67 ± 9.82 0.00 ± 0.00 0.37 Variables Weeks Oat Blend p-value Escape 1 - -2 2.67 ± 3.06 10.00 ± 13.23 0.40 3 1.33 ± 2.31 0.00 ± 0.00 0.37 4 2.67 ± 4.62 0.00 ± 0.00 0.37 5 0.00 ± 0.00 2.33 ± 4.04 0.37 6 - -7 6.67 ± 11.55 0.00 ± 0.00 0.37 Battery % 1 97.11 ± 0.13 97.02 ± 0.18 0.52 2 96.53 ± 0.23 96.43 ± 0.25 0.63 3 95.57 ± 0.29 95.42 ± 0.26 0.53 4 95.11 ± 0.46 94.73 ± 0.49 0.39 5 96.10 ± 0.12 95.66 ± 0.67 0.33 6 95.51 ± 0.31 94.82 ± 0.68 0.18 7 95.30 ± 0.36 94.45 ± 0.68 0.13
Table 11: 2022 NoFence Data comparison between treatments
Conclusion
The study established that the forage blend supported weaned calves’ growth as the conventional methods; therefore, forage blends can be an alternative forage source in a winter swath grazing system However, the information from the second and third-year biomass yields showed that the amount of precipitation and volunteer seeds (from the previous year) may affect the relative botanical composition of the swaths and animal performance. The blend significantly has a better relative feed value compared to oat monoculture. The high battery power levels and recharging abilities of the collars during the winter suggest that the technology can be effective in frigid temperatures and cloudy days.