RURAL

2 0 2 0 LAND
& TITLE
DISCOVER THE BEST IN RURAL LIVING WWW
A TEAM WITH ROCK STAR REAL ESTATE, BROKERAGE
REAL ESTATE MARKET REPORT
LANDANDTITLE CA GREATER GOLDEN HORSESHOE AREA AIMEE WESSON & JP GULBIS

CONTENTS 3 2020 MARKET OVERVIEW 5 FACTORS INFLUENCING PRICE INCREASES 6 GREATER GOLDEN HORSESHOE AVERAGE SALES PRICES 7 HISTORICAL DATA & INFORMATION (6 YRS) 9 BUY YOUR HOME WITH US 10 AVERAGE PRICE BY ACREAGE 11 WHAT IS TO COME IN 2021
2020 RURAL HOME MARKET REPORT
2020 was a remarkable year for real estate.
Many thought the global pandemic would lead to a serious downturn in the real estate market. It appears the opposite happened.
Compared to previous years, month over month, appreciation rates, low inventory levels and sales price records were shattered in 2020.
For rural homes and hobby farms specifically, across the Greater Golden Horseshoe, property values were up about 18% from the previous year (2019).
Inventory remained low, which it has been for some time. A trend that is forecast by CREA to continue into 2021. Interestingly, there was a significant number of rural homes that had not sold in 2019 but were relisted in 2020 (sometimes at a higher price) where they then sold very quickly.
Low inventory, low-interest rates and easy access to credit fueled the fire for competition across the province. Even buyers looking for homes at the higher price points (i.e. over $1,000,000), saw bidding wars and houses selling for well over the asking price.
For rural homes and country properties, the average sales to list price ratio was just over 110%. This is quite impressive considering rural homes are often priced higher, on average, than other residential properties.
In this report, we cover relevant statistics to help you get an idea of how the 2020 rural real estate market performed and hopefully prepare you for what is to come in 2021.
This report delves into 2020 rural home statistics and some of the factors that likely led to this, frankly, crazy market and why we are likely to see it continue in 2021.
2 0 2 0 : A R E C O R D B R E A K I N G Y E A R
INFO LAND & TITLE | 3


47 110% 2020RURALHOMEMARKET REPORT I N F O LAND & TITLE | 4 S O M E B R I E F S T A T S F O R R U R A L H O M E S Average Days of Market List To Sales Price Ratio Days % Increase in Sold Listings 33% Average Appreciation Rate Compared to 2019 18% Highest Sale in 2020 $7.2 Million Non Farm or Development Land Compared to 2019 *Best Performing Areas Areas That Had The Quickest Sales Compared to 2019 *based on percentage increase in sale price, average sale price, list to sales price rations & number of sold listings S I M C O E W A T E R L O O D U R H A M K . L A K E S N O R T H U M B E R L A N D Average Appreciation Rate 2015 - 2020 60% 42 Dufferin KLakes Peel Simcoe Waterloo Average DOM 40 40 45 37
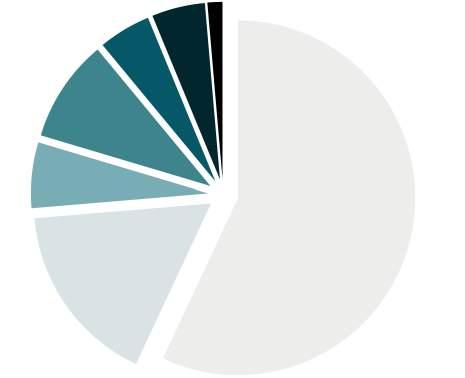
FACTORS THAT INFLUENCED PRICE INCREASES IN RURAL HOMES
OTHER FACTORS
%

LOW INTEREST RATES
With low interest rates we have seen both an increase in buyer activity and a willingness of buyers to pay more for their home In part, this is a reason for buyers looking to country properties and hobby farms as an option Competition between buyers has been strong for these properties and interest rates have a part to play
LOW INVENTORY
We are unquestionably in a seller's market There are few good properties to choose from and when one pops up, there are many other buyers looking for the same type of home And are ready to compete for it This lack of inventory and high demand is a huge driving factor in the prices we have been seeing
THE EFFECTS OF COVID-19
In an effort to keep money flowing through the economy during a pandemic, banks have lowered, and maintained low interest rates
The ability to work from home has allowed people to look elsewhere for a home, not just in major cities They can buy homes in the countryside (and they have been doing just that)
POPULATION GROWTH
Population growth, mainly due to immigration levels will continue to put pressure on the real estate market if inventory remains low
Although COVID restricted the number of newcomers in 2020, with a forecasted 401,000 newcomers for 2021 this pressure will likely continue Simple economics says increased demand with limited supply will result in increased prices
Land is a finite resource - we all know this The more we develop, slowly but surely we see less vacant land And it isn’t just in downtown or suburban areas Farm land outside of the protected greenbelt is slowly eaten away to make way for paved roads and rows of identical homes But even this development can't keep up with demand As this happens prices of both land and homes will continue to rise
Having to stay at home had more people looking at their home as a place to recreate Buying a country home or hobby farm allowed for opportunities to have more space, spend times outdoors and focus on hobbies
As you'll see from increased average sales prices, interest in cottage country surged as travel restrictions prevented people from freely travelling A desire to buy a cottage as a rental investment or as a home to enjoy as an alternative to travelling was at a high level which hasn't been seen in some time
LAND & LAND PRICES
LAND & TITLE | 5 I N F O T Y P I C A L F A C T O R S & C O V I D
GREATERGOLDENHORSESHOE
2020 Average Sales Price for Rural Homes in 15 regions and counties in the Greater Golden Horseshoe.

BRANT WELLINGTON DUFFERIN
M A P 2 0 2 0 A V E R A G E H O M E P R I C E S LAND & TITLE | 6 NIAGARA HALDIMAND HAMILTON HALTON WATERLOO PEEL DURHAM YORK SIMCOE NORTHUMBERLAND PETERBOROUGH KAWARTHA LAKES $957,941 Lake Ontario Georgian Bay Lake Simcoe Lake Erie $713,595 $1,116,155 $975,026 $1,295,102 $1,147,673 $1,102,473 $1,501,613 $750,336 $1,899,496 $1,098,228 $706,223 $779,678 $2,073,654 $1,146,000
HISTORICALTRENDSINTHERURAL REALESTATEMARKET


%
LOCATION 5 YEAR APPRECIATION 2015 2016 2017 2018 2019 2020 A S N A P S H O T O F T H E L A S T 6 Y E A R S D A T A 1,113,947 733,628 763,505 877,124 939,347 976,200 904,656 865,125 995,147 1,147,673 1,462,785 1,102,473 975,026 WATERLOO HAMILTON DUFFERIN BRANT SIMCOE NIAGARA PETERBOROUGH WELLINGTON NORTHUMBERLAND HALDIMAND KAWATHA LAKES 34% YORK 51% PEEL HALTON DURHAM 35% 77% 1,548,737 1,877,765 2,284,653 2,659,586 2,073,654 1,936,921 1,259,084 1,657,407 2,199,004 2,044,257 1,833,879 1,899,496 1,330,593 1,431,150 1,556,107 1,385,790 1,501,613 1,295,102 640,554 794,180 802,220 963,147 1,128,441 1,032,541 1,105,160 710,208 803,897 974,764 957,544 1,062,143 1,116,155 583,471 668,151 818,850 844,204 929,404 672,729 718,820 792,249 779,722 813,708 1,098,228 570,302 622,241 717,679 836,431 849,014 394,443 503,345 598,742 577,120 590,179 706,223 399,375 435,318 570,064 576,199 605,698 713,595 750,336 593,348 575,695 581,133 464,336 451,553 779,678 666,173 608,072 418,149 570,109 842,103 957,941 805,265 698,456 715,872 563,002 493,552 79% 82% 57% 89% 63% 71% 94% 37% 66% 79% 79% LAND & TITLE | 7
HISTORICALTRENDSINTHERURAL REALESTATEMARKET
ASNAPSHOTOFTHELAST6YEARS
COTTAGE COUNTRY SURGE THE LUXURY MARKET
One of the most noteworthy changes in 2020 was the increase in buyer interest in rural homes and cottages. This can be seen especially in cottage country areas like Kawartha Lakes, Northumberland and areas in Peterborough. Although days to sell were aboutaverage,salespriceswereuponaverage as were the number of sales compared to previousyears.
Higher priced areas like York, Peel and Halton are often the most susceptible to marketconditionsandfluctuationswhichis why you see a number of changes in the averageruralhomesalespricefrom2015to 2020.Havingsaidthat,theseareasfollowed the same trend with price increases, quick sales and plenty of buyer competition in 2020.
GOOD PERFORMERS OUTSIDE THE GREENBELT
A number of regions saw substantial increases this year - namely Durham, Wellington, Dufferin, Simcoe and Niagara. You can find a good mix of higher-end, luxury country homes as well as more affordable options, which is a likely reason for their popularity. When looking at the number of sold listings, appreciation rates,daystosellandavailableinventorythese regions were some of the best performing areasin2020.
Waterloo & Brant are interesting areas. Both have seen a lot of residential development over the last number of years but still have large areas of important farmland. These regions had the lowest numbers of available and sold rural home inventory in 2020 (and this has been quite typical for previous years). However,thislackofsupplyjustleadtohigher prices being paid for the rural home that did sellin2020.
THE NEXT EXCLUSIVE AREA THE UP AND COMER
Hamilton has been very popular for the last number of years. However, buying a country home here is somewhat an exclusive affair. Not that many rural homes are available to purchase here, which is likely why we didn't see a significant jump in prices compared to someoftheotherareas.
Haldimand is a region that we would classify as an up and comer. Prices are affordable here but as more people are priced out of the other areas, Haldimand Country will likely see more activity and price increases in the new year.
INFO
LAND & TITLE | 8


WORK TOGETHER TO FIND YOUR IDEAL COUNTRY HOME TODAY! YOUR JOURNEY BEGINS HERE.
with Rock Star Real Estate, Brokerage LANDANDTITLE.CA DISCOVER THE BEST IN RURAL LIVING i n f o @ l a n d a n d t i t l e . c a
LAND&TITLE LET'S
Team
AVERAGESALESPRICEBY ACREAGE
Here you can see the average sale price across multiple acreage ranges in the 15 different counties/regions across the Greater Golden Horseshoe
The highest average sales price increase from last year was seen in the 5 - 9.99 acreage range. There was a 26% increase in this acreage range from last year. The remaining acreages increased between 14 - 18% on average Once again, the majority of the country home sales occurred in the 05-199 acreage range Properties of this size are attractive to the vast majority of people for a number of reasons. They are more manageable, you see fewer financing restrictions here and compared to the larger sized acreages, these properties are often more affordable Typically there are also more properties of this size available to purchase
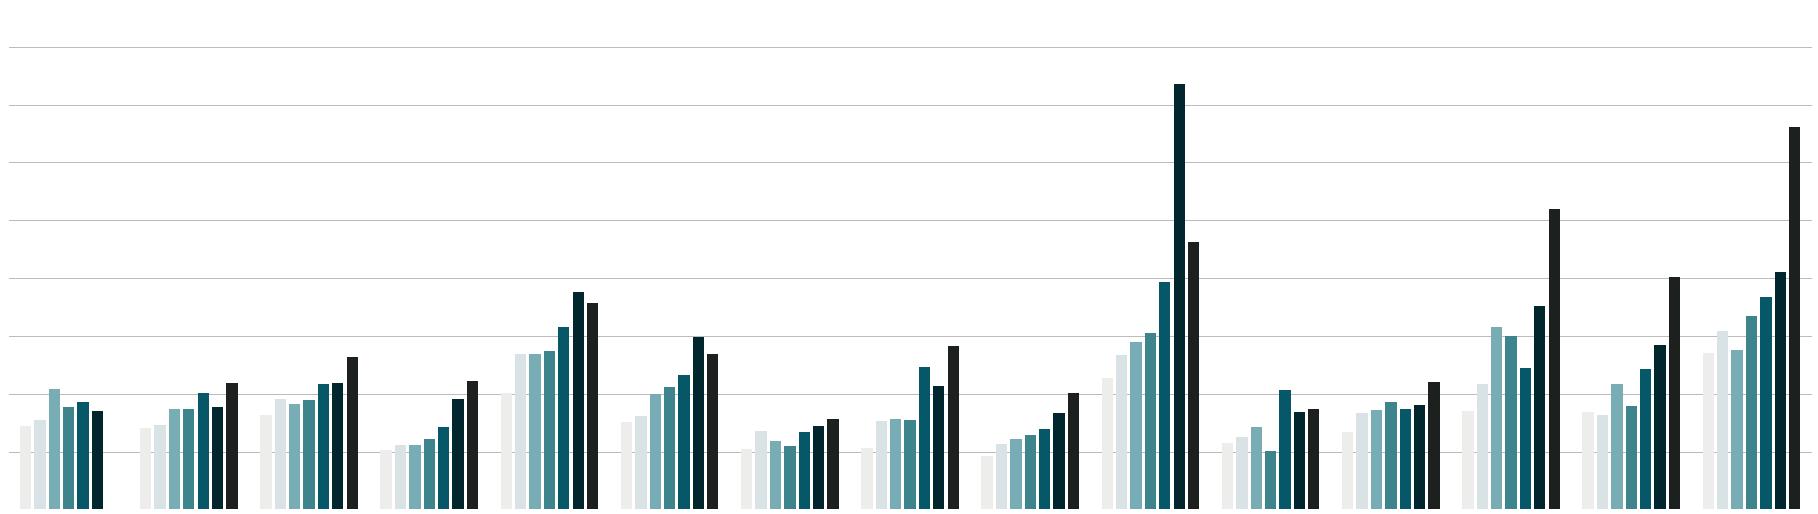
Generally, the larger the acreage, the more expensive the property However, this is not always the case. It depends on a few things like location, existing property use, the condition of the home and any additional infrastructure on the property.
As you might imagine, few sales happen at the 100+ acreage range and these average sale prices are often not reflective of what you can expect to pay for a property this size that has a turnkey home or barn on the property. In fact, it is not unreasonable to see only a handful of these sales in each region/county during any given year If you are looking for a turnkey 100 acres property you should actually expect to pay closer to $3 million +
0 5 - 1 99 2 - 4 99 5 - 9 99 10 - 24 99 25 - 49 99 50 - 99 99 100+ 0.5 - 1.99 $960,149 $1,841,472 100 + 2 - 4.99 $1123193 5 - 9.99 $1,235,587 50 - 99.99 $1,708,757 25 - 49.99 $1,440,130 10
24.99 $1,232,567
-
R U R A L H O M E S , C O U N T R Y H O M E S & F A R M S D A T A $0 $625,000 $1,250,000 $1,875,000 $2,500,000 $5,000,000 $4,375,000 $3,750,000 $3,125,000
LAND & TITLE | 10
BRANT DUFFERIN DURHAM HALDIMAND HALTON HAMILTON KAWARTHA NIAGARA NORTHUMBERLANDPEEL PETERBOROUGHSIMCOE WATERLOO WELLINGTON YORK
WHAT TO EXPECT IN 2021
It seems that the impacts of COVID both socially and personally were a catalyst for many to make the jump to a more rural lifestyle If they didn't before, many could clearly see the benefits of living in the countryside. If you're going to be locked at home it is better to be somewhere with space and fresh air. Working from home gave people the opportunity to widen their home search to rural properties and of course many now see a benefit to being away from crowds as well as living a more self-sufficient lifestyle.
We have been saying for some time now that rural living has been growing steadily in popularity year over year Although, in fairness, we did not expect this level of activity in such a short period of time, nor did we see a pandemic being a strong driving factor for this market.
But, with a vaccine on the horizon and hopes of returning to normal, you might wonder where that will leave the 2021 rural real estate market...
CREA is predicting further price increases of 91% across Ontario's residential markets in 2021
Immigration levels are only set to increase over the next few years. The Canadian Government announced immigration targets of 401,000 in 2021. With many of these newcomers likely settling in Ontario, we don't see the pressure on the housing market ceasing any time soon
Interest rates may fluctuate slightly but the chances of them jumping drastically overnight are slim as this would do some severe damage to our already fragile economy
We might see a slight increase in inventory in 2021 as people take the opportunity to sell their homes while the market is hot. However, this increase likely won't be enough to meet the demand we are seeing
It is tough to say whether we will have a continuation of the cottage country surge in 2021. As the vaccine is rolled out, travel restrictions will hopefully be lifted and it is possible that fewer people will look to these areas for vacation homes at the same level of intensity as they seemed to this year. On the other hand, these areas are still predominately more affordable than areas within an hour's drive of Toronto so it is difficult to say with absolute certainty what will happen
As the push continues, more people are going to be priced out of areas around major cities and will look to areas outside of the Greater Golden Horseshoe for alternatives
In 2020, the Canadian government announced that by 2022 they are going to have a new tax strategy for owners of vacant properties in Toronto. All these types of taxes do is encourage people to move their money out of the city to other areas, causing more pressure in different parts of Ontario.
It seems some of the same factors impacting the 2020 rural real estate market are here to stay for 2021 Only time will tell where things go from there
T H E F U T U R E O F R U R A L R E A L E S T A T E LAND & TITLE | 11 I N F O
The inevitable disclaimer: This report is intended to be informative as it relates to the country home real estate market in the Greater Golden Horseshoe The information provided in this report has been taken from the Multiple Listing Service, Toronto Real Estate Board and the Hamilton-Burlington Real Estate Board All of which cover the 15 regions and counties laid out in this report covering January 1, 2020 to December 31st, 2020 for rural homes specifically. The statistics and information obtained from these sources is deemed to be reliable but cannot be guaranteed It is possible that data may not reflect current market conditions at your time of reading this report since we cannot forecast with absolute certainty and cannot possibly know the future of market conditions This report, the information contained herein, Land & Title and Land & Title's logo are all copy-written and cannot be duplicated or used in any way without written permission Should you want to use any information in this report, contact Aimee at aimee@landandtitle ca
LAND & TITLE
Team with Rock Star Real Estate Inc
Country
© 2020 - 2021. Land & Title.
By Aimee Wesson & J.P. Gulbis
Home Real Estate Guide LAND&TITLE

WWW.LANDANDTITLE.CA
