RURAL

2 0 2 1 - 2 0 2 2
R E A L E S T A T E M A R K E T R E P O R T LAND & TITLE DISCOVER THE BEST IN RURAL LIVING A TEAM WITH ROCK STAR REAL ESTATE, BROKERAGE

Average Sales Prices Historical Trends TABLE OF CONTENTS Report Overview What was Impacting Prices Sales by Acreage 03 05 11 12 14 Historical price trends for country homes since 2015. Review the average sales prices by Acreage in the GGHS. Review average sales prices across the Greater Golden Horseshoe. The fundamentals driving prices upwards in 2021. Introduction to the 2021 Rural Real Estate Market Report LAND&TITLE.CA 2021 - 2022 02 Future Outlook 16 What should we expect for the rural home market in the future?
RURAL HOME MARKET REPORT
Just when we thought the market couldn’t get any more heated after 2020, 2021 stepped in and shattered all previously held records.
Similarly, though, 2021 saw many of the same fundamentals impacting the Greater Golden Horseshoe rural real estate market.

Take a decade-long housing shortage, rising demand, a pandemic that continued to have a stronghold on Canada’ s economy, add in a pinch of changing lifestyle dynamics and what do you have?
Demand greatly outweighing supply, cheap money and an out-of-control real estate market across the province
The average sales price for a country home in the greater golden horseshoe was just over $1,500,000.
This meant, if you had purchased a country property in 2020 there is a good chance it appreciated at approximately 28% from the previous year where we had already seen high prices.
To give you an idea of what people were willing to pay, above and beyond the asking price the list to sales price ratio for equestrian properties was just over 112%.
Even in times of uncertainty, the long-term personal & financial reward of owning a country home is still apparent
Throughout this report, we aim to provide insight as to why we are in this position and how we can navigate through this competitive real estate environment And we will try to answer the ever-resounding question: What is causing property prices to soar like they have been over the last few years?
Although there is no simple answer, we will dive into the very basic economic factors playing a role in our Canadian real estate market and review this past years sale statistics
Low supply of homes, high demand, interest rates, inflation and the what appears to be a growing land grab in the Greater Golden Horseshoe Area
F R O M T H E L A N D & T I T L E T E A M A I M E E W E S S O N & J P G U L B I S
LAND&TITLE.CA 2021 - 2022 03
REAL ESTATE PRICES
BASIC FUNDAMENTAL INFLUENCES

LANDANDTITLE.CA
WHAT DROVE REAL ESTATE PRICES IN 2021?
There were a number factors at play causing the unprecedented competition and historically high real estate prices we were all concerned about in 2021
Many of these fundamentals are the same culprits from years prior.
INTEREST RATES
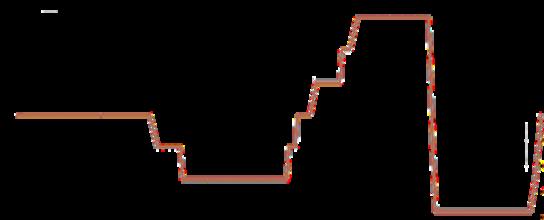
The Bank of Canada had not increased its overnight rate since October 2018* It was necessary, many said, to keep and eventually lower interest rates low during the pandemic as a way to encourage money to flow through the economy Below is a graph of the interest rates from the last 8 years.
people look for the same type of property, causing competition and inevitably increased prices due to the increased demand And this is what we saw in 2021
INFLATION
"The world is experiencing one of the most accelerated periods of wealth creation & capital availability in history "
- FORBES GLOBAL PROPERTIES
Low interest rates often lead to a sort of euphoria where buyers take the chance to live out their desires for a bigger house, a bigger lot, and a bigger mortgage
Buyer ability and a willingness to pay more for their home comes to the forefront of spending Properties like country homes, hobby farms, and equestrian estates suddenly have an influx of buyers.
This influx often causes a ripple effect as more
Stimulus packages were handed out like Halloween candy by the Canadian government during the pandemic. CERB and Wage Subsidies were given to many people with the hopes of stimulating the economy and encouraging consumer spending `
The downside, of course, was that, in order to do this, money was made out of thin air or "printed".
"Printing" money in times of crisis is another tactic often used by governments in an attempt to delicately balance a fragile
05 *As of writing this report, we are aware that the BOC has increased its overnight rate to a total of 1% as of April 2022 RealEstatePrices
02 18 2018 2021 2020 2019 TRADINGECONOMICSCOM|BANKOFCANADA 2017 2016 2014 2015
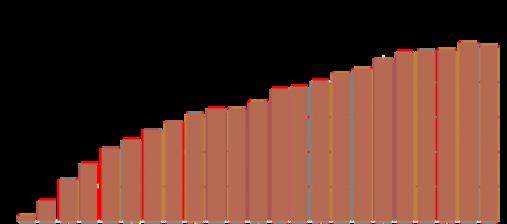
economic system Below is a graph showing the drastic increase in money supply per month as a result of this pulling-money-out-of-thin-air tactic used during the pandemic
It is not uncommon for folks to use real estate, in either the form of equity or cash flow (if they are so lucky) as a hedge against rising inflation. More on this later
POPULATION
Population changes have an impact on real estate prices. Whether it be population growth or from people moving to different regions
This lead to a devaluation of our currency and inflation rates that - like fanny packs - we haven’t seen since the early 90s
Inflation, to put it very simply, means that the cost of goods, on average, goes up Housing is one of those goods (in the form of mortgage costs and rents)
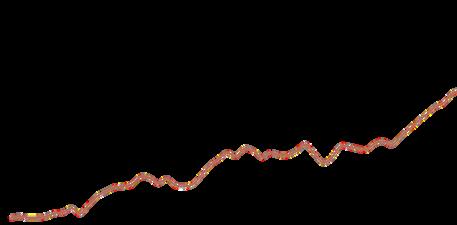
The below graph shows Canada's CPI (Consumer Price Index) over the last 10 years CPI is a measure of inflation
Why? Because people need places to live And more demand with limited supply often leads to increased prices.
Immigration & Natural Growth
It is no secret that the majority of our population growth comes from immigration, and this looks like it will be the trend for years to come
You can see the cost of goods has been on the rise for some time (the last 30-ish years). This is not unnatural but what is, is large spikes upwards like we had seen during the pandemic.
Despite the injection of cash, lockdowns prevented us from actually being able to spend this money in our communities. Sure Amazon saw a 220% increase in its profits during this time but local Canadian businesses, not as much.
Consumers instead spent their saved money (whether from stimulus packages, or additional savings not being spent in restaurants, in-person shopping or self care services) went towards housing and stocks
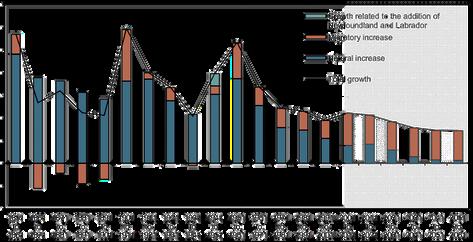
Canada’s birth rate has been dropping since the 60s Although the death rate is currently not beating out the birth rate, causing some natural population growth, it is still no match for immigration numbers.
The majority of immigrants coming to Canada fall under the economic immigrant category which means they come here to fill their role in the Canadian workforce and are often able to purchase homes fairly quickly
In 2021, a historic 405,000 new immigrants were welcomed to Canada, 107,865 in Ontario.
130 135 140 145 150 2018 2021 2020 2019 TRADINGECONOMICSCOM|STATISTICSCANADA 06 RealEstatePrices
POPULATIONGROWTHINCANADA|STATSCAN Actual Projected 35% 30% 20% 10% -10% 25% 15% 05% 00% -05%
TRADINGECONOMICSCOM|STATISTICSCANADA $19M OCT'21 APR'20 JUL'20 OCT'20 JAN'21 APR'21 JUL'21 $20M $21M $22M $23M $24M $18M
As our population grows, so does the need for housing Although that sounds like an oversimplification, since increases in population doesn’t necessarily increase the need for a house For example in the instance where a second child is born into the same household that doesn't necessarily translate to the need for a new house. But by the same merit someone moving out of their parents home does not increase the population but does increase the demand for a house
With only just over 41,000 housing starts for SINGLE FAMILY HOMES, this puts an immense amount of pressure on the housing supply
Intraprovincial Movement - "Drive Until You Qualify."
The Smart Prosperity Institute wrote an insightful report which outlined (among other things) population sprawl across Ontario They reported notable findings on a large number of people moving out of areas like Peel, Toronto and York to areas like Simcoe, Durham Niagara, Hamilton and Wellington
These areas saw the biggest growth in population from 2020-2021 And some large price increases from the influx of new demand.
When we look at the historic data later in this report, you will see evidence of this in the gradual and continued increase in property prices in these areas from 2015 to 2021, despite changes to interest rates
LACK OF SUPPLY
A problem Canada has had for some time is the lack of supply of homes available to purchase Be it new builds or existing inventory.
"One million new homes will need to be built in Ontario between 2021 and 2031 to keep pace with a growing population We have a problem when our population is growing faster than the housing needed to accommodate that growth."
- THE SMART INSTITUTE
Construction Completions
I was often given the advice that it is not how you start something, but how you finish Which is why we feel housing completion statistics are more useful than the number of starts
In 2021, there were approximately 41,600 housing completions in Ontario. We did not include condos or multi family homes in this stat because people looking for rural homes generally aren't also looking for, or competing against the same people looking for condos, apartments or multi family homes.
According to the Financial Times, Canada has some of the lowest housing supply among the G7 countries with average housing being 424 units per 1000 people.
To put that into perspective, Canada would need 18 million more dwellings to have the same number of homes per capita as the rest of the G7
Low Inventory
Also at historic lows this year was available, existing inventory
To understand the supply-demand balance in real estate we often look to the "months of inventory" measure.
That is, if 200 active listings are available, and 20 homes sold in the most recent month, then there is approximately 10 months of housing inventory for buyers to choose from.
07 RealEstatePrices
In December 2021, the months of inventory across Canada was a historical record-low 16 months according to CREA
Rural properties are, relatively speaking, a rare commodity in comparison to regular suburban homes
As urban sprawl continues and small homes with postage stamp yards become the norm, more and more people will yearn (and have been yearning) for larger and more private properties This is evident in the stats you will see in a moment
A LAND GRAB
Going hand in hand with low supply is the value of land in its short supply
As a finite resource, and in a world that has become more uncertain, many look at land ownership for stability Especially in times of high inflation and in an unreliable economy.
The long term financial and personal rewards that you get from owning a large property are becoming ever more apparent in this uncertain world.
A Hedge Against Inflation
In uncertain times, real estate is often used as a hedge against inflation.
Be it farmland, residential acreages and large residential lots, more home buyers and investors alike look for opportunity and find it in land these days
How is this done?
Well, when you have an appreciating asset in times of high inflation, any debt on that asset (as
long as costs remain fixed) will lower the loan-tovalue on that debt as the property value increases
Any passive income produced from an investment property can also provide as a hedge against inflation
And lastly, property values over time tend to stay on a steady upward curve Most of the real estate markets that saw a dip in 2008 were back to their "pre-crash" prices in less than a decade, and have exceeded those prices since. This included even the higher end, luxury homes that were hit the hardest by the market correction, rebounded in only a few years
This again is likely, in large part, due to our severe lack of housing supply in Canada As well as strict lending policies.
Shifting Lifestyles & Personal Rewards
As intrinsic values and capabilities shift to one where tranquility is paramount over a short drive into the office. Where perhaps one's situation is such that they can now work primarily from home and spend more time enjoying the outdoors. Where owning a larger property means you have the opportunity to grow (or raise) some of your own food, explore hobbies or simply enjoy the space and privacy
It appears this has become more recognisable to more people, especially during the pandemic Where they live has become less about proximity and more about recreation and enjoyment Only furthering the demand on an already supplyconstrained market
As land becomes more difficult to acquire, values will continue to rise and country homes will continue to be an extremely valuable commodity for years to come
08 RealEstatePrices


LAND
LET'S WORK TOGETHER TO FIND YOUR PERFECT COUNTRY HOME TODAY! YOUR JOURNEY BEGINS HERE. Team with Rock Star Real Estate, Brokerage DISCOVER THE BEST IN RURAL LIVING LANDANDTITLE.CA www.landandtitle.ca
& TITLE
THE STATISTICS
RURAL HOMES IN THE GGHS

LANDANDTITLE.CA
avg sale price sold listings $971 $955
YORK $2.478 SOLD:565 PEEL $2.370 SOLD:355 HALTON $2.283 SOLD:334 WATERLOO $1.677 SOLD:209 WELLINGTON $1.570 SOLD:349 DURHAM $1.551 SOLD:502 HAMILTON $1.513 SOLD:403 DUFFERIN $1.440 SOLD:281 BRANT $1.280 SOLD:202 NIAGARA $1.246 SOLD:678 SIMCOE $1.243 SOLD:1514 PETERBOROUGH $1.029 SOLD:189 HALDIMAND SOLD:247 NORTHUMB. SOLD:443 KAWARTHA SOLD:319 AVGERAGE SALE PRICE AVERAGE SALE PRICE MarketSnapshot 11
$906
SALE PRICE BY ACREAGE
As you'll see on the following page, the continuation of a seller's market in 2021 led to price increases across all acreages in the Greater Golden Horseshoe.
Despite these high prices, there was also a notable increase in the number of sales that occurred in the 100+ acreage range. This could be due to low-interest rates and/or more availability of properties of this size on the market than in pervious years.
While smaller acreages often make up the lion's share of the rural home market, larger acreages performed very well during 2021.
For example, the highest percentage increase in prices was seen in the 10-25 acreage range It is unsurprising that a property in this size range would cost more than smaller acreages, but to see a 26% price increase from 2020 indicates an active and competitive demand at this acreage
MarketSnapshot 12
4.99 5 . 09 . 9 9 10.024. 99
2 5 . 04 9 99. 5 0 . 099 99. +001
2.0
0.5-1.99
Sales by Acreage Range
SALE PRICE BY ACREAGE

LOCATION 0.5 - 1.99 $1,101,987 $1,207,352 $1,302,431 $791,179 $1,756,492 $1,291,852 $837,440 $1,099,523 $825,570 $1,866,785 $968,036 $1,101,795 $1,403,273 $1,435,573 $2,290,133 2 - 4.99 $1,338,762 $1,256,058 $1,524,100 $1,030,414 $2,296,071 $1,541,974 $917,464 $1,225,081 $946,351 $2,272,163 $1,049,693 $1,276,403 $1,682,652 $1,406,399 $2,524,305 5 - 9.99 $1,627,060 $1,540,143 $1,648,556 $874,986 $2,436,984 $1,725,205 $1,277,500 $1,334,961 $976,420 $2,248,617 $1,063,330 $1,466,051 $2,310,376 $1,532,355 $2,033,133 10 - 24.99 $1,317,500 $1,425,435 $1,714,594 $1,269,500 $2,647,594 $1,930,787 $891,748 $1,486,495 $1,119,863 $3,378,342 $1,170,285 $1,354,713 $2,450,625 $1,747,283 $2,282,939 25 - 49.99 $1,865,168 $2,151,778 $2,432,032 $1,182,500 $3,528,791 $1,947,750 $988,527 $1,538,716 $1,117,732 $3,115,700 $1,123,893 $1,730,736 $2,956,428 $2,157,586 $2,465,931 50 - 99.99 $2,240,000 $2,023,412 $2,102,503 $1,379,182 $3,954,839 $2,650,722 $1,280,001 $2,145,882 $1,265,000 $4,779,985 $1,244,374 $1,849,515 $2,751,300 $2,618,319 $4,890,286 100+ $2,700,000 $2,696,333 $2,142,692 $3,380,033 $3,020,000 $2,966,400 $1,202,144 $1,861,333 $1,726,491 $6,500,000 $1,267,446 $1,845,881 NO SALES $2,805,375 $5,941,081 BRANT DUFFERIN DURHAM HALDIMAND HALTON HAMILTON KAWARTHA NIAGARA NORTHUMB. PEEL PETERB. SIMCOE WATERLOO WELLINGTON YORK 13 MarketSnapshot
TRENDS FROM 2015 TO2021

Since at least 2015 (but even prior to this), country home prices have been steadily ticking upwards.
It hasn't been this way for all regions in the GGHS but the first quarter of 2017 was where we really saw some impressive price increases.
In spring of 2017, the government introduced the foreign buyers tax as well as the stress test on mortgage qualification.
By September 2017, interest rates had been increased to 3.2% which was the highest they had been since 2008.
As you may have been able to tell, these factors caused a mild slow down of the market during the middle quarters of the year.
However, by late 2017, and the beginning of 2018, prices started to climb again as psychologically, people become accustomed to the new rules & rates.
Even as rates continued to gradually increase until October 2018 where they paused at 3.95%.
Yet, this did not appear to have a significant impact on areas that could be considered more affordable for the time.
For instance, areas like Hamilton, Niagara, Durhamand Dufferin, among others, saw steady gains even during the slight market correction
in early 2017.
As we often say, higher end areas are much more susceptible to market changes and you can see this in the data given on the next page. During times of higher rates and uncertainty, higher priced regions like Halton, Peel, and York did not see as as much activity in their markets and prices even came down, slightly.
You can see over the last number of years, unlike other regions, their prices have fluctuated more drastically than others.
This could also be due to the fact that these regions often see extraordinary outliers.
It is not uncommon to see country home listings selling in the $6M, $10M, $12M+ range. But this doesn't necessarily happen yearly which is why you see some discrepancy in these regions from year to year in addition to the other factors mentioned.
By March 2020, interest rates had started to come down and prices were up drastically across all areas in the Greater Golden Horseshoe.
And by 2021 we continued to see some of the most historic sale prices, and price increases across the board with all areas in the GGHS outperforming their numbers from the previous year.
Market Snapshot 14


MarketSnapshot 15 2015 2016 2017 2018 2019 2020 2021 LOCATION YORK PEEL HALTON WATERLOO WELLINGTON HAMILTON DUFFERIN BRANT NIAGARA SIMCOE PETERBOROUGH HALDIMAND NORTHUMBERLAND KAWARTHA DURHAM $2.48M $2.37M $2.28M $1.68M $1.57M $1.55M $1.51M $1.44M $1.28M $1 25M $1.24M $1.03M $971K $955K $906K $1 55M $1 88M $2 29M $2 66M $1 94M $2 07M $1 26M $1 66M $2 20M $2 04M $1 83M $1 90M $1 11M $1 33M $1 43M $1.56M $1.39M $1 50M $734K $764K $877K $939K $976K $1 30M $641K $794K $905K $865K $995K $1 15M $802K $963K $1 13M $1 03M $1 15M $1 46M $710K $804K $975K $1.62M $1 12M $1 12M $583K $668K $819K $844K $929K $1 10M $570K $622K $718K $836K $849K $975K $494K $494K $716K $699K $805K $958K $673K $1 10M $814K $780K $792K $719K $570K $418K $842K $608K $666K $780K $399K $435K $570K $576K $606K $714K $451K $464K $581K $576K $593K $750K $706K $590K $577K $599K $503K
WHAT SHOULD WE EXPECT IN THE FUTURE?
"There will never be a point in your life where it’s the right time to do a great thing. If you’re waiting for that perfect perfect moment, that perfect timing, it’s not going to happen. You have to create the perfect time, and the perfect opportunity, and the perfect situation."
- LES BROWN
It is often those who create opportunity in times of uncertainty that go on to benefit
We know that interest rates will increase in 2022 - they have to But it is never a good idea to just focus on one fundamental when all others are still at play.
When interest rates increased in 2017/2018 many took a back seat waiting for the market to crash But it did the opposite by 2020 and went beyond that in 2021. Even in a time of utter unpredictability during the pandemic
Those who purchased in 2017/2018 during what can be seen as a less competitive time compared to 2021 realised IMPRESSIVE gains And those who waited for the market to "drop" likely STILL don't live in the house of their dreams. And many are now priced out
Population growth and in particular, low inventory will still have influence on the real estate market in the years to come
Some panic selling may occur during a period where interest rates are ticking up But what you are more likely to see is people not selling, waiting for things to improve causing a further tightening on an already supply constrained market
Now, that is not to say with certainty that things won't go south - anything is possible
Purchasing a large property which you plan to enjoy for 10, 15, 20 + years means you don't have to worry as much about market fluctuations Long term appreciation is inevitable.
In 2022, we will continue to strive to provide the best expertise as it relates not only to the rural real estate market but to the basic economic forces that impact it as well. We look forward to that journey with all of those who value the rewards of land ownership
Until then
LAND&TITLE.CA 2021 - 2022 15
Aimee&JP
The disclaimer probably no one will read: This report is intended to be informative as it relates to the country home real estate market in the Greater Golden Horseshoe. The information provided in this report has been taken from the Multiple Listing Service, Toronto Real Estate Board and the Hamilton-Burlington Real Estate Board. All of which cover the 15 regions and counties laid out in this report covering January 1, 2021 to December 31st, 2021 for rural homes specifically The statistics and information obtained from these sources is deemed to be reliable but cannot be guaranteed It is possible that data may not reflect current market conditions at your time of reading this report since we cannot forecast with absolute certainty and cannot possibly know the future of market conditions This report, the information contained herein, Land & Title and Land & Title's logo are all copy-written and cannot be duplicated or used in any way without written permission. Should you want to use any information in this report, contact Aimee at aimee@landandtitle ca
LAND & TITLE
© 2021 - 2022. Land & Title.
By Aimee Wesson & J.P. Gulbis
Team with Rock Star Real Estate Inc
Country Home Real Estate Guide LAND&TITLE
WWW.LANDANDTITLE.CA
