

RitLbhÍnr.151 2022 I „Áhrif Hybrid topplýsingar og hæð lampanna á vöxt, uppskeru og gæði gróðurhúsatómata“ FINALREPORT ChristinaStadler
LandbúnaðarháskóliÍslands,2022. RitLbhÍnr.151 ISSN1670-5785 ISBN978-9935-512-25-3
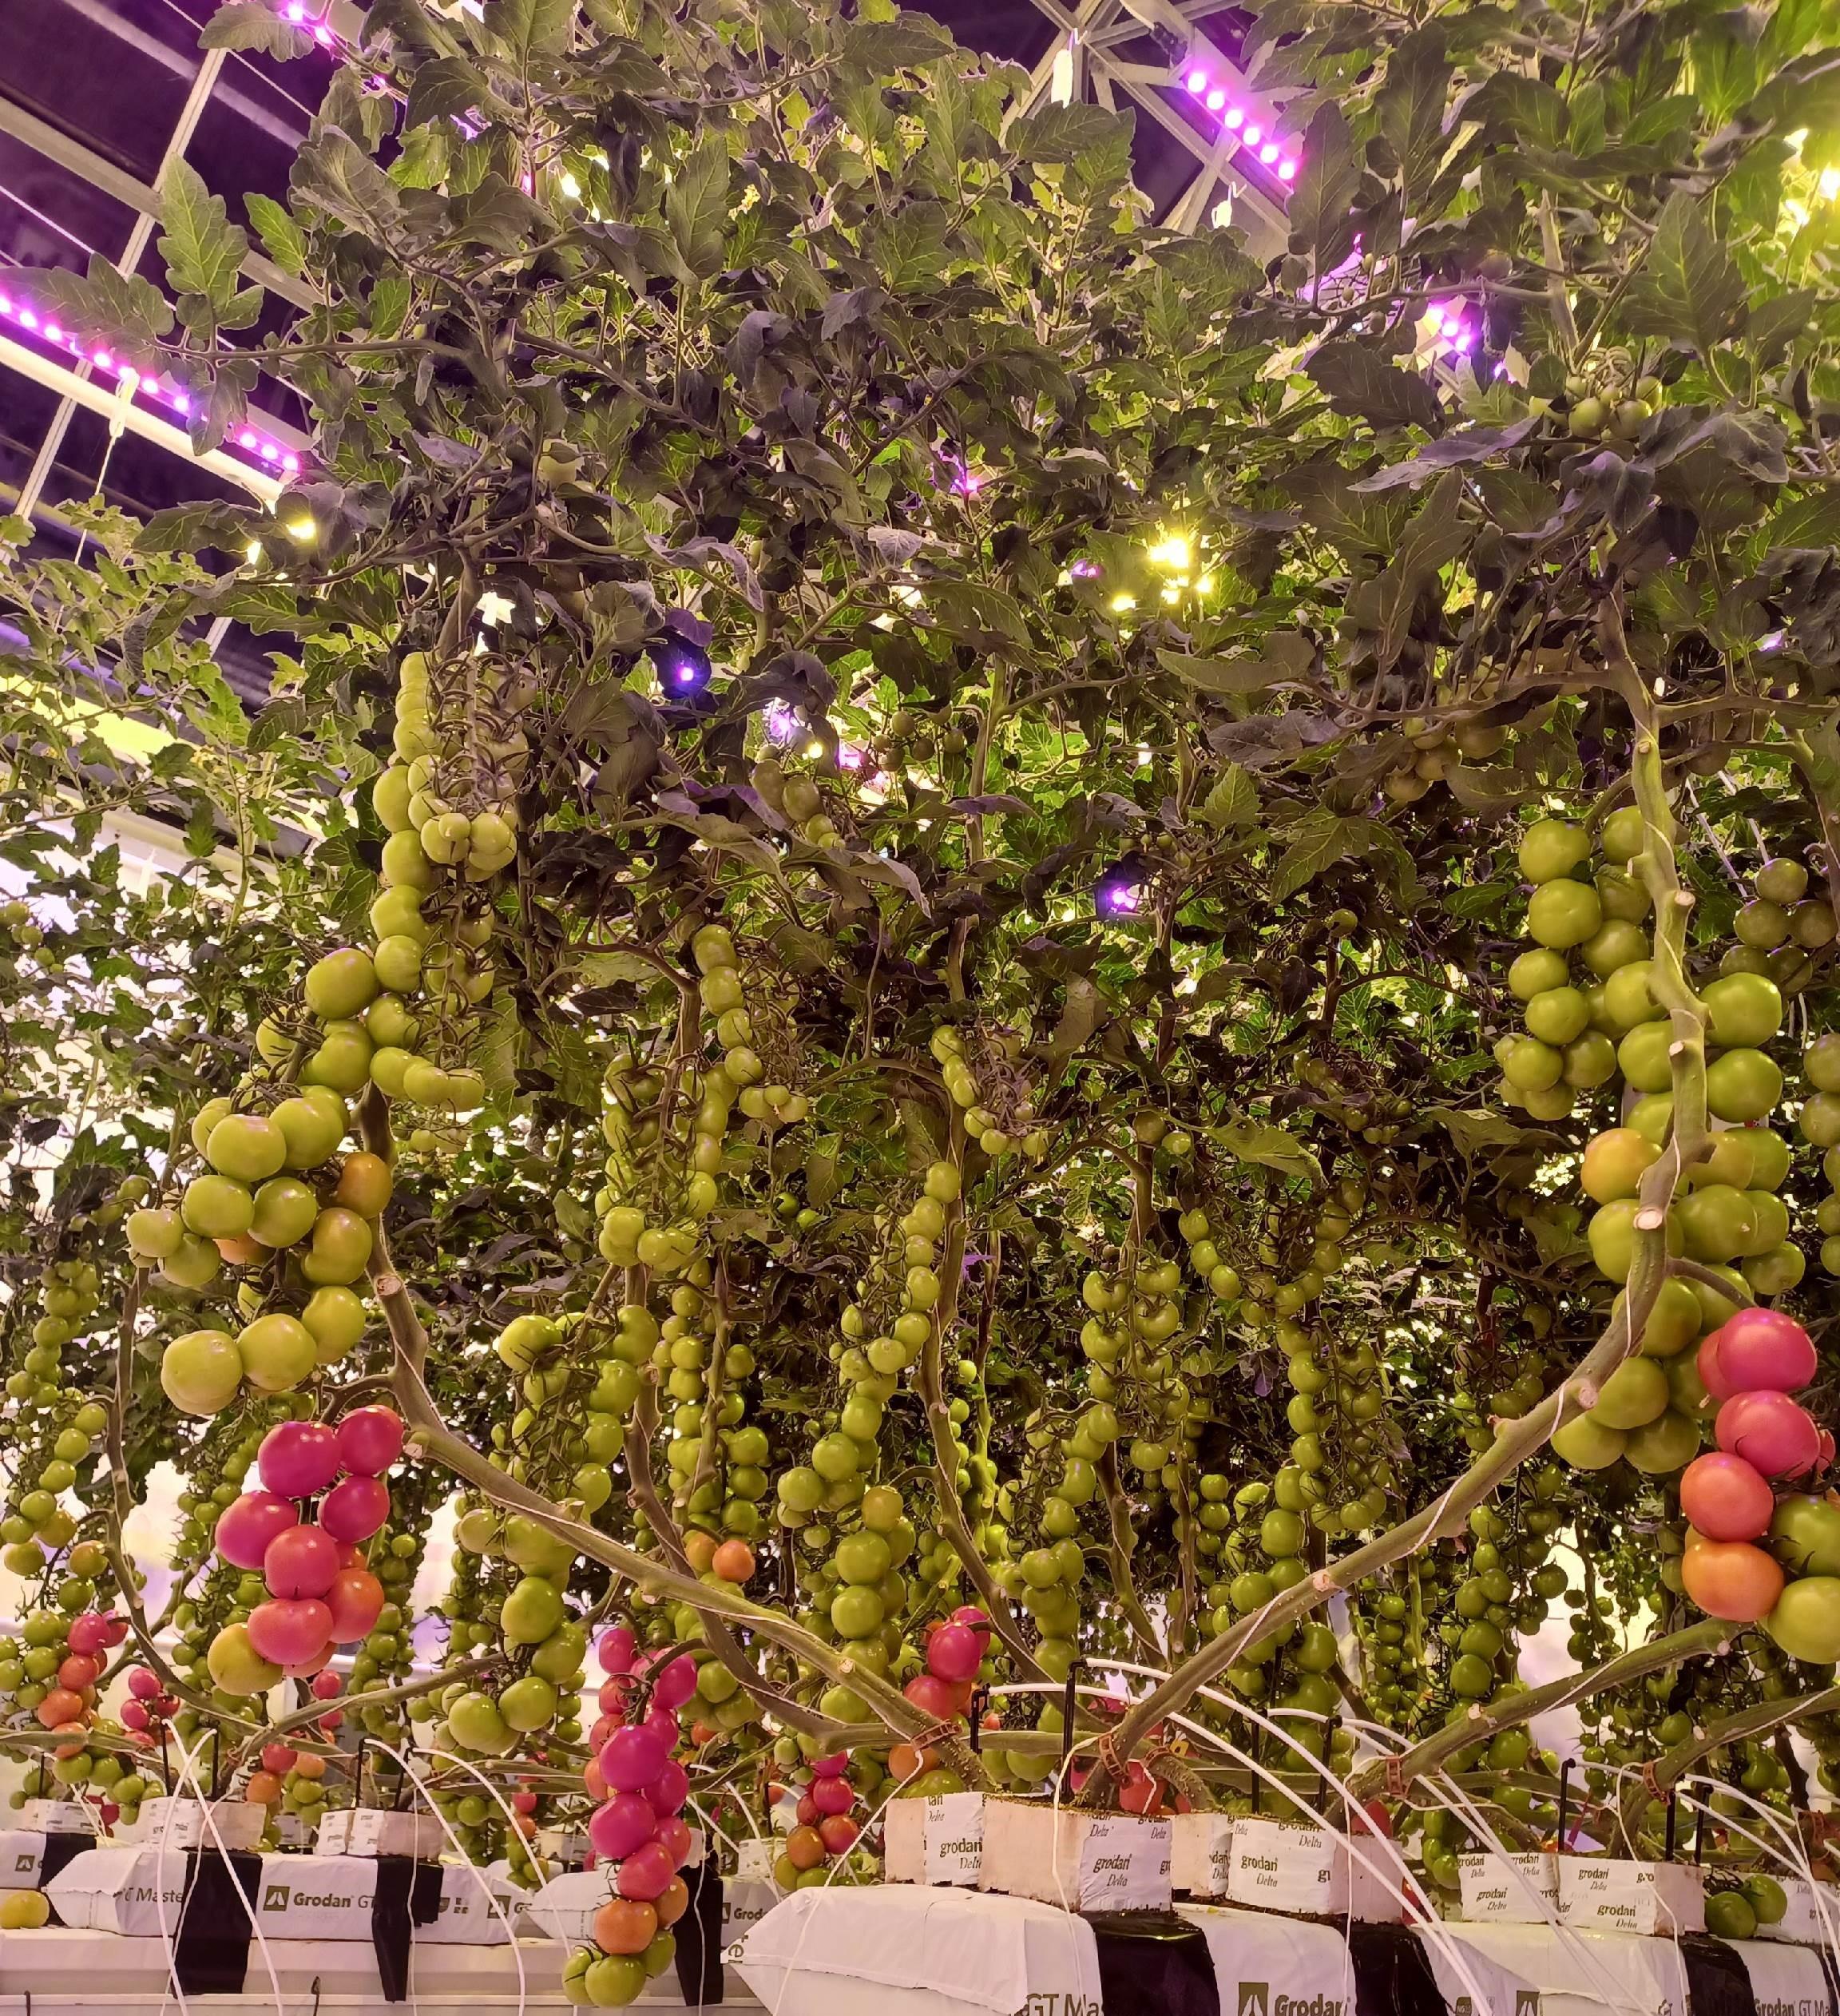
Ljósmyndáforsíðu:ChristinaStadler
[Type here]
[Type here]
Finalreportoftheresearchproject „ÁhrifHybridtopplýsingaroghæðlampannaávöxt,uppskeruoggæði gróðurhúsatómata“
Duration: 28/09/2021–27/09/2022
Projectleader:
LandbúnaðarháskóliÍslands Keldnaholt
Dr.ChristinaStadler Árleyni22 112Reykjavík Email:christina@lbhi.is Mobile:8435312
Garðyrkjufræðingur: BörkurHalldórBlöndalHrafnkelsson Ræktunarstjóritilraunahús: ElíasÓskarsson
Collaborators: HelgiJóhannesson,Ráðgjafarmiðstöðlandbúnaðarins Tomatogrowers
Projectsponsors: Matvælaráðuneytið(Þróunarsjóðigarðyrkjunnar)
Skúlagötu4
101Reykjavík
[Type here]
[Type here] I Table of contents Tableofcontents I Listoffigures III Listoftables IV Abbreviations IV 1 SUMMARY 1 YFIRLIT 3 2 INTRODUCTION 5 3 MATERIALSANDMETHODS 8 3.1 Greenhouseexperiment 8 3.2 Treatments 10 3.3 Measurements,samplingandanalyses 12 3.4 Statisticalanalyses 12 4 RESULTS 13 4.1 Environmentalconditionsforgrowing 13 4.1.1Solarirradiation 13 4.1.2Chambersettings 14 4.1.3Substratetemperature 14 4.1.4Leaftemperature 15 4.1.5Irrigationoftomatoes 16 4.2 Developmentoftomatoes 20 4.2.1Plantdiseasesandpests 20 4.2.2Height 20 4.2.3Weeklygrowth 20 4.2.4Numberofleaves 20 4.2.5Lengthofleaves 22 4.2.6Numberofclusters 22
4.2.7Lengthofclusterstotop
4.2.8Distancebetweenclusters
4.2.9Lengthofclusters
4.2.11Numberofopenflowers
4.3.4Interiorqualityofyield–sugarcontent
27
27
[Type here] II
22
24
24 4.2.10Fruitspercluster 25
25 4.2.12Stemdiameter
4.2.13Diameteroftheuppermostfloweringcluster
4.3 Yield 29 4.3.1Totalyieldoffruits 29 4.3.2Marketableyieldoftomatoes 30 4.3.3Outerqualityofyield 36
37 4.4 Economics 37 4.4.1Usedenergy 37 4.4.2Energyuseefficiency 38 4.4.3Lightrelatedcosts 39 4.4.4Costsofelectricityinrelationtoyield 40 4.4.5Profitmargin 40 5 DISCUSSION 46 5.1 Yieldindependenceofthelightsource 46 5.2 Yieldindependenceoftheheightofthelightsource 51 5.3 Futurespeculationsconcerningenergyprices 54 5.4 Recommendationsforincreasingprofitmargin 55 6 CONCLUSIONS 59 7 REFERENCES 60 8 APPENDIX 65
Listoffigures
Fig.1: Experimentaldesignofcabinets. 8
Fig.2: Timecourseofsolarirradiation. 13
Fig.3: Substratetemperature. 15
Fig.4: Leaftemperature. 16
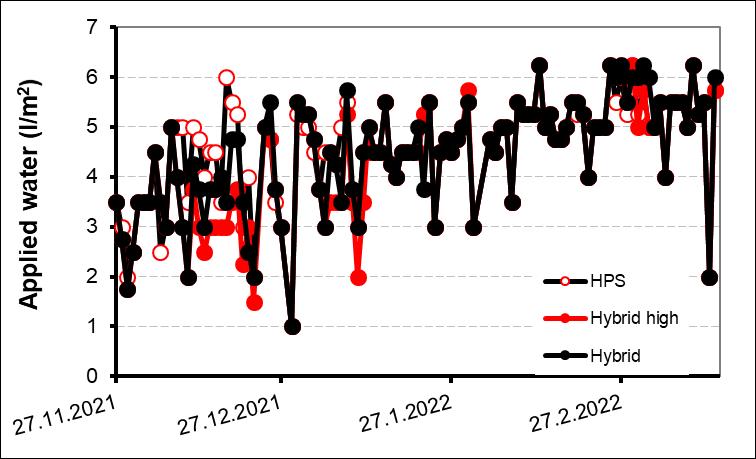
Fig.5: Dailyappliedwater. 17
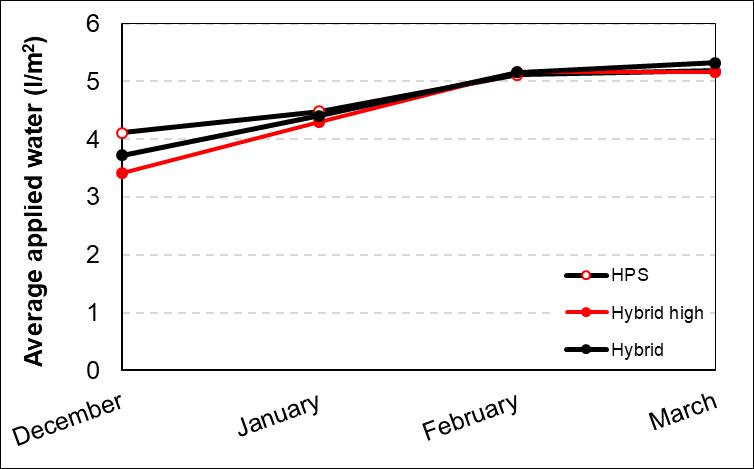
Fig.6: Averagedailyappliedwaterineachmonth. 17
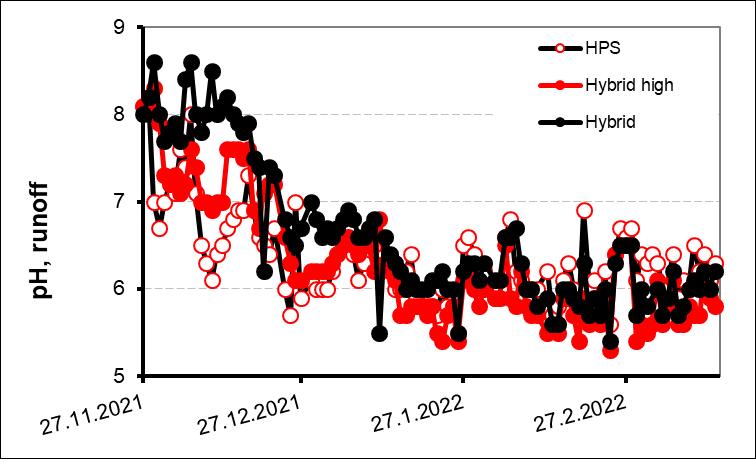
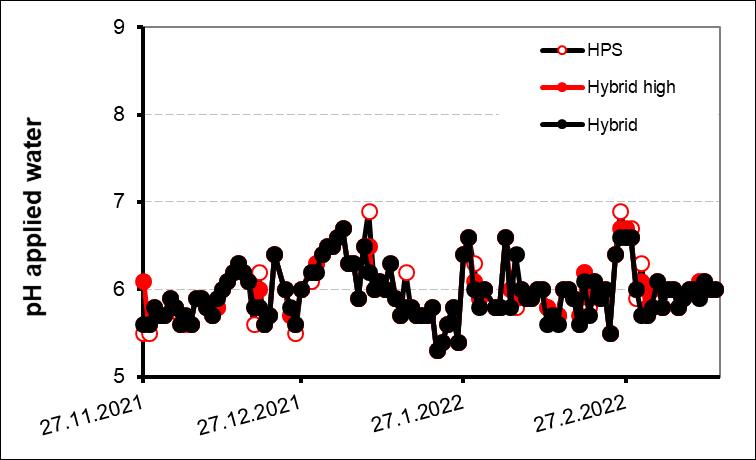
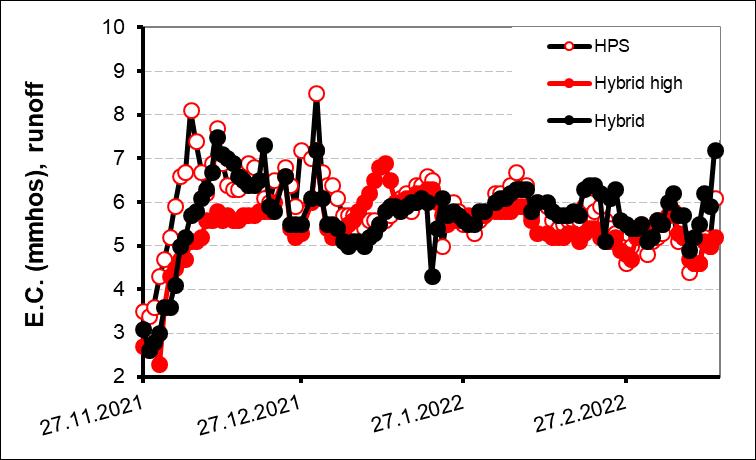
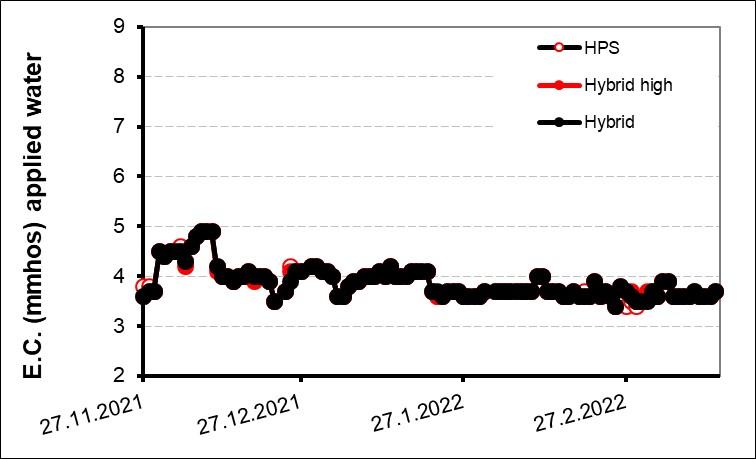
Fig.7: E.C.andpHofirrigationwaterandrunoff. 18
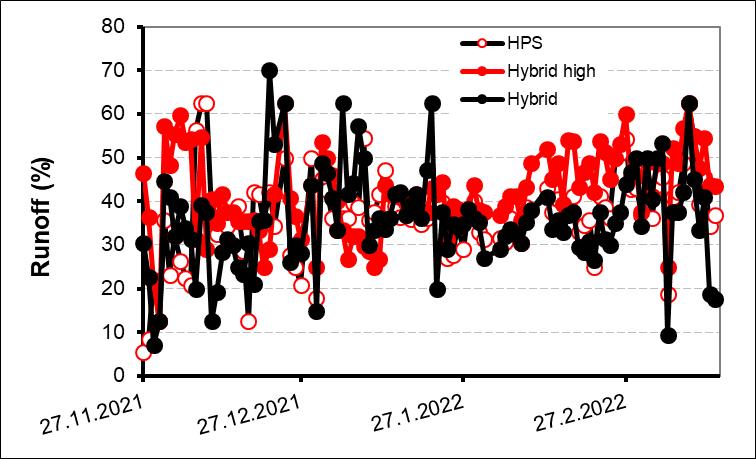
Fig.8: Proportionofamountofrunofffromappliedirrigationwater. 19
Fig.9: Wateruptake. 19
Fig.10: Heightoftomatoes. 20
Fig.11: Weeklygrowth. 21
Fig.12: Numberofleavesonthetomatoplant. 21
Fig.13: Lengthofleaves. 22
Fig.14: Numberofclusters. 23
Fig.15: Lengthofuppermostfloweringclustertoplanttop. 23
Fig.16: Distancebetweenclusters. 24
Fig.17: Lengthofclusters. 25
Fig.18: Numberoffruitspercluster. 26
Fig.19: Numberofunpollinatedfruitspercluster. 26
Fig.20: Numberofflowers. 27
Fig.21: Stemdiameterandquotientlengthstotopandstemdiameter. 28
Fig.22: Diameteroftheuppermostfloweringcluster. 28
Fig.23: Cumulativetotalyieldoftomatoesinkg. 29
Fig.24: Cumulativetotalyieldoftomatoesinnumber. 30
Fig.25: Timecourseofmarketableyield(1.and2.classtomatoes). 31
Fig.26: Timecourseofmarketable1.classyield. 32
Fig.27 Timecourseofmarketable2.classyield. 32
Fig.28: Time course of marketable yield of tomatoes in the whole chamber. 33
Fig.29: Timecourseofmarketableyield. 33
Fig.30: Averageweightoftomatoes(1.classfruits). 35
Fig.31: Averageweightoftomatoes(1.and2.classfruits). 35
Fig.32: Sugarcontentoftomatoes. 37
Fig.33: Energyuseefficiency(=marketable yieldper used energy)for tomatoesunderdifferentlighttreatments. 38
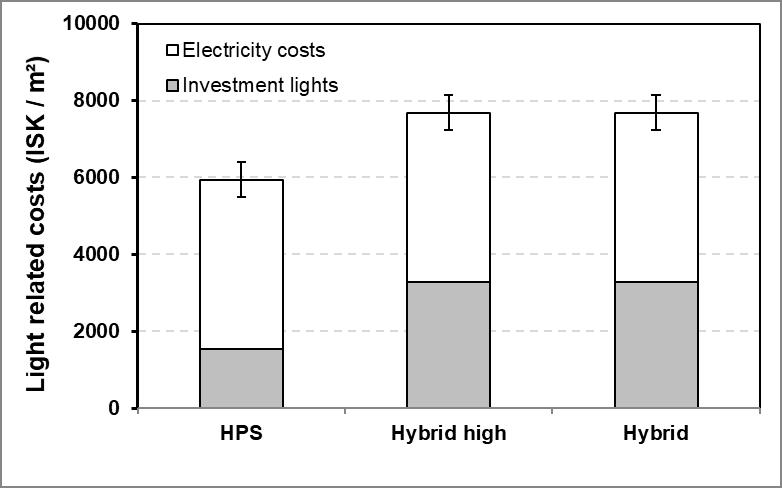
Fig.34: Light related costs in tomato production under different light treatments. 40
Fig.35: Revenuesatdifferentlighttreatments. 41
Fig.36: Variableandfixedcosts(withoutlightingandlabourcosts). 42
[Type here] III
Fig.37: Divisionofvariableandfixedcosts. 43
Fig.38: Profitmargininrelationtothelighttreatment. 46
Fig.39: Profit margin in relation to yield with different light sources in tomatoproduction–calculationscenarios. 49
Fig.40: Profit margin in relation to yield with different heights of the lightsintomatoproduction–calculationscenarios. 51
Fig.41: Profit margin in relation to light treatment – calculation scenarios. 55
Listoftables
Tab.1: Fertilizermixture. 9
Tab.2: Numberoflightsandtheirdistributioninthechambers. 11
Tab.3: Lightdistributioninthechambers. 11
Tab.4: Chambersettingsaccordingtogreenhousecomputer. 14
Tab.5: Cumulativetotalnumberofmarketablefruits. 34
Tab.6: Proportionofmarketableandunmarketableyield. 36
Tab.7: Used energy under different light treatments (datalogger values). 38
Tab.8: Energy costs and investment into lights for one growing circle oftomatoesunderdifferentlighttreatments. 39
Tab.9: Variablecostsofelectricityinrelationtoyield. 40 Tab.10: Profitmarginoftomatoesatdifferentlighttreatments. 44 Tab.11: Marketableyieldperclusterwithdifferentlighttreatments. 52
[Type here] IV
Abbreviations E.C. electricalconductivity HPS high-pressurevapoursodiumlamps kWh kiloWatthour LED light-emittingdiodes pH potentialofhydrogen ppm partspermillion W Watt Wh Watthours Otherabbreviationsareexplainedinthetext.
SUMMARY
In Iceland, winter production of greenhouse crops is totally dependent on supplementary lighting and has the potential to extend seasonal limits and replace imports during the winter months. Adequate guidelines regarding the effect of the light source and the optimal height of the lights are not yet in place for tomato production and need to be developed. The objective of this study was to test if the lightsource(HPSorHybrid)andtheheightofthelampsisaffectinggrowth, yieldand qualityoverthewinteroftomatoesandtoevaluatetheprofitmargin.
An experiment with ungrafted tomatoes (Lycopersicon esculentum Mill. cv. Completo) was conducted from the beginning of November 2021 to the middle of March 2022 in the experimental greenhouse of the Agricultural University of Iceland at Reykir. Tomatoes were grown in rockwool plugs in three replicates with 2,5 tops/m2 with one top per plant. Three different light treatments for a maximum of 16hours light were applied: 1. HPS top lighting(1000W bulbs), HPS lamps in 4,5m height from the floor (HPS, 472µmol/m2/s), 2. Hybrid top lighting (2:1, HPS:LED, 750W HPS bulbs), HPS in 4,9 m and LEDs in 4,5 m height from the floor (Hybrid high, 373µmol/m2/s), 3. Hybrid top lighting (2:1, HPS:LED, 750 W HPS bulbs), HPS lights and LEDs in 4,5m height from the floor (Hybrid, 454µmol/m2/s). The day temperaturewas set on20°C. Thenight temperaturewas duringthe first two months 20°C and after that 17°C. The underheat was 35°C when the experiment started, but was increased to 50°C after one month and to 55°C at the end of February. The heating pipes were set to 45°C in the middle of January. 800 ppm CO2 was applied. The tomatoes received standard nutrition through drip irrigation. The effect of the light source and the height of the lamps were tested and the profit margin was calculated.
The light source had an influence on the appearance of the plant: The height of the plant, the weekly growth and the distance between the clusters was significantly higher in “HPS” compared to “Hybrid”. In contrast, the above mentioned parameters werenotaffectedbytheheightoftheHybridlights.
The tomatoes that were lighted with the light source mounted 1,0 m over the plant canopywereabouthalfaweek earlierripethanfruitsthatreceivedlightsfrom Hybrid lights that were 1,4m away. This might be caused by the higher substrate temperatureof plants wherethe light was mounted closer to the plants. At theend of
[Type here] 1 1
the harvest period was total yield and their number as well as marketable yield significantly higher where the Hybrid lights were in less distance to the plants. The reason for the higher yield was a significantly higher first class yield due to heavier fruits, whereas the number of marketable fruits was independent of the height of the Hybrid lights. In contrast, total yield, marketable yield, their number and average weightwasnotaffectedbythelightsource.
Marketable yield was around 70% for all light treatments, whereby the percentage of 1. class fruits, 2. class fruits, too small fruits and green fruits was independent of the lighttreatment.
Using Hybrid lights was associated with the same daily usage of kWh’s compared to HPS lights. Light related costs (electricity costs + investment into lights) were calculatedhigher(6%)for“Hybrid”than“HPS”andamounted46%of totalproduction costs. Used kWh’s were better transferred into yield with “Hybrid” than with “Hybrid high”,whilethelightsourcehadnoeffectonthisparameter.
When the distance between Hybrid lights and plant canopy was reduced from 1,4m to 1,0m, yield was increased by 4,2kg/m2 and profit margin by 2.500ISK/m2. An additional increase could be reached by replacing Hybrid lights by HPS lights with 1000W bulbs instead of 750W bulbs to reduce investment costs. Then, the profit margin increased by 1.600ISK/m2 compared to Hybrid lights, while yield stayed comparable.
Possible recommendations for saving costs other than lowering the electricity costs are discussed. To be able to get a higher photosynthetic photon flux density the distance between lights and plant canopy could be lowered to one meter to be able tohave apositive influence onyieldandprofitmargin.Itcanbe advicedto growhigh wire plants under HPS top lights and invest rather in buying HPS lights with 1000W than inLEDs for top lighting. So far, a replacement of the HPS lamps by LEDs is not recommendedfromtheeconomicsideandmorescientificstudiesareneeded.
[Type here] 2
Vetrarræktun í gróðurhúsum á Íslandi er algjörlega háð aukalýsingu. Viðbótarlýsing geturlengtuppskerutímannogkomiðí staðinnflutnings aðvetritil.Fullnægjandileiðbeiningar fyrir vetrarræktun á tómötum og áhrif ljósgjafa og besta millibils milli ljóss og plantna á gróðurhúsatómata eru ekki til staðar og þarfnast frekari þróunar. Markmiðið var að prófa hvort ljósgjafi (HPS eða Hybrid) og hæð lampanna hefðu áhrifávöxt,uppskeruoggæðiyfirháveturinnátómataoghvortþaðværihagkvæmt.
Gerðvartilraunmeðóágræddatómata(Lycopersicon esculentum Mill.cv.Completo) frá byrjun nóvember 2021 og fram í miðjan mars 2022 í tilraunagróðurhúsi LandbúnaðarháskólaÍslands á Reykjum. Tómatarnirvoruræktaðir í steinullarmottum í þremur endurtekningum með 2,5toppi/m2 með einum toppi á plöntu. Prófaðar voru þrjár mismunandi ljósameðferðir að hámarki í 16klst. ljós: 1. HPS topplýsingu (1000W perur), ljós í 4,5m hæð frá gólfi (HPS, 472µmol/m2/s), 2. Hybrid topplýsingu(2:1,HPS:LED,750W HPSperur),HPSí4,9mogLEDsí4,5mhæðfrá gólfi (Hybrid high, 373µmol/m2/s), 3. Hybrid topplýsingu (2:1, HPS:LED, 750 W HPS perur), HPS ljós og LEDs í 4,5m hæð frá gólfi (Hybrid, 454µmol/m2/s). Daghiti var 20°C. Næturhiti var fyrstu tvo mánuðina 20°C og eftir það 17°C. Undirhiti var 35°C í byrjun, en 50°C eftir mánuð og55°C í lok febrúar. Um miðjanjanúar voru hitarör stillt á 45°C. 800ppm voru gefin. Tómatarnir fengu næringu með dropavökvun. Áhrif ljósgjafaoghæðlampannavoruprófaðarogframlegðreiknuðút. Ljósgjafar höfðu áhrif á plönturnar: Hæðplöntunnar, lengdavöxtur vikunnar og millibil milliklasa var marktækt lengri þegar plönturnar fengu HPS ljós miðaðviðHybridljós. EnhinsvegarhafðihæðHybridlampannaekkiáhrifáofangreindarbreytur. Tómatarsem fenguljós fráljósgjafasem var 1,0m fyrir ofan plöntuþekju, þroskuðust um hálfrivikufyrr en tómatar sem fenguljós fráHybridljósisem varí1,4m fyrirofan plönturnar.Þettagæti orsakast af hærri hita íræknunarefniplantna þarsem ljós var í minni fjárlægð frá plöntunum. Í lok uppskerutímabilsins var heildaruppskera, fjöldi uppskorinnaaldinaog markaðshæfraruppskerumarktæktmeiri þegar Hybridljósvar í minnni fjarlægð frá plöntunum. Meiri uppskeru má rekja til þess að fyrsta flokks uppskera var marktækt meiri vegna meira þyngdar aldins, á meðan fjöldi markaðshæfrar aldina var óháð hæð frá Hybrid ljósum. Hins vegar var heildaruppskera, markaðshæfrar uppskeru, fjölda uppskorinnaaldinaogmeðalþyngd aldinaekkiháðljósgjafa.
[Type here] 3 YFIRLIT
Hlutfall uppskerunnar sem hægt var að selja var um 70% fyrir allar ljósameðferðir án þess aðtillit væri tekið til mismunar milli meðferða á 1. flokks aldina, 2. flokks aldina, oflítillaaldinaoggrænnaaldina. Dagleg notkun á Hybrid ljósum var sú sama í kWh’s sem og HPS ljós. Ljósatengdur kostnaður (orkukostnaður+fjárfesting í ljósum) var hærri (6%) fyrir “Hybrid” en fyrir “HPS” og var 46% af heildarframleiðslukostnaði. Skilvirkni orkunotkunar var meiri með “Hybrid” en með “Hybrid high”, á meðan ljósgjafi hafði engin áhrif á þessar breytur.
Þegar millibil milli Hybrid ljósa og plöntuþekju var minnkað úr 1,4m í 1,0m jókst uppskera um 4,2kg/m2 og framlegð um 2.500ISK/m2. Að auki var hægt að fá betri niðurstöður með því að skipta Hybrid ljósum út fyrir HPS ljós og nota 1000W perur í staðinnfyrir 750W perur til að lækka fjárfestingarkostnað í ljósum. Þájókst framlegð um1.600ISK/m2 ámeðanuppskerabreyttistekki. Möguleikar á að lækka kostnað, með öðrum hætti en aðlækkarafmagnskostnað eru taldir upp í umræðukaflanum í þessari skýrslu. Þar er ráðlegt að minnka hæð milli plöntunnar og ljós í einn metra til að fá hærri µmol tölu sem mun leiða til hærri uppskeru og framlegðar. Mælt er með því að rækta tómata undir HPS ljósi og fjárfesta frekar í að kaupa HPS ljós með 1000 W perum en LEDs fyrir topplýsingu. Ekki mælt með því að skipta HPS lömpum út fyrir LED að svo stöddu og þörf er á meirireynsluáræktunundirLEDljósi.
[Type here] 4
2 INTRODUCTION
Theextremely lownatural light level is themajorlimitingfactorforwinter greenhouse productioninIcelandandothernorthernregions.Therefore,supplementarylightingis essential to maintain year-round vegetable production. This could replace imports from lower latitudes during the winter months and make domestic vegetables even morevaluablefortheconsumermarket.
The positive influence of artificial lighting on plant growth, yield and quality of tomatoes (Demers et al., 1998a), cucumbers (Hao & Papadopoulos, 1999) and sweet pepper (Demers et al., 1998b) has been well studied. It is often assumed that an increment in light intensity results in the same yield increase (Marcelis et al., 2006). Indeed, yield of sweet pepper in the experimental greenhouse of the AgriculturalUniversityofIcelandatReykirincreasedwithlightintensity(Stadler etal., 2010).However,withtomatoes,ahigher light intensityresultednot (Stadler,2012)or inonlyaslightlyhigheryield(Stadler,2013).
Supplemental lighting that is normally used in greenhouses has no or only a small amount of UV-B radiation. High pressure sodium (HPS) lamps are the most commonly used type of light source in greenhouse production due to their appropriate light spectrum for photosynthesis and their high efficiency. The spectral output of HPS lamps is primarily in the region between 550 nm and 650 nm and is deficient in the UV and blue region (Krizek et al., 1998). However, HPS lights suffer fromrestrictedcontrollabilityanddimmingrangelimitations(Pinho etal.,2013).Ithas been common in Iceland to use HPS lamps with electromagnetic ballast. However, HPS lamps with electronic ballast will safe about 8% energy according to the companyGavita(Nordby,oralinformation).Thisisespeciallyimportantastheenergy costshasahighproportionoftotalproductioncostsofvegetables.
Light-emitting diodes (LED) have been proposed as a possible light source for plant production systems and have attracted considerable interest in recent years with their advantages of reduced size and minimum heating plus a longer theoretical lifespancomparedto high intensitydischarge lightsourcessuch as HPS lamps(Bula et al., 1991). These lamps are a radiation source with improved electrical efficiency (Bula et al., 1991), in addition to the possibility to control the light spectrum and the light intensity which is a good option to increase the impact on growth and plant development. Several plant species (tomatoes, strawberries, sweet pepper, salad,
[Type here] 5
radish) have been successfully cultured under LEDs (e.g. Philips, 2017; Philips, 2015; Tamulaitis etal.,2005; Schuerger etal.,1997; Brown etal.,1995; Hoenecke et al.,1992).However,withHPSasignificantlyhigherfreshyieldofsaladwasachieved in comparison to LEDs. Two times more kWhwas necessary with only HPS lights in comparision with only LEDs. The only use of HPS lights resulted in the highest yield, whilethe yield with onlyLEDs was about ¼ less (Stadler, 2015). In contrast,thelight sourcedidnot affecttheweightof marketableyieldofstrawberries.Thedevelopment of flowers andberries andtheir harvest was delayed bytwo weeks under LED lights. This was possibly related to a higher leaf temperature in the HPS treatment due to additional radiation heating. However, nearly 45% lower daily usage of kWh’s under LEDs were recorded (Stadler, 2018). These results are requesting scientific studies with different temperature settings to compensate the additional heating by the HPS lights and the delayed growth and harvest. When the air temperature was adapted it was possible to compensate the additional heating by the HPS lights and prevent a delayedgrowthandharvest(Stadler,2019; Stadler,2020).
Traditionally, lamps are mounted above the canopy (top lighting), which entails, that lower leaves are receiving limited light. Experiments (Hovi-Pekkanen & Tahvonen, 2008; Grodzinski et al., 1999; Rodriguez & Lambeth, 1975) imply that lower leaves are also able to assimilate quite actively, suggesting that a better utilization could be obtained by using interlighting (lamps in the row) in addition to top lighting. Indeed, the benefits from interlighting in contrast to top lighting alone have been confirmed with different vegetable crops. Interlighting increased first class yield of cucumbers along with increasing fruit quality and decreased unmarketable yield, both in weight andnumber(Hovi-Pekkanen & Tahvonen,2008). Experiments with interlighting have been conducted at the Agricultural University of Iceland. The position of the HPS lights had no influence on marketable yield. But HPS top lighting together with interlighting increased unmarketable yield (around 2% blossom end rot fruits and 2% more fruits with burning damage from the lights) compared to only HPS top lighting (Stadler et al., 2010). But the yield of sweet pepper warsignificantlyless withLEDinterlightingthanwithHPSinterlightingor20% lessmarketable yield(Stadler, 2010).According to Davis & Burns (2016) interlighting in tomatoes has proved highly successful and a significant increase in yield was reported. The top light source (LED, HPS) had no influence on marketable yield of tomatoes,buttheuseofLEDsresultedinabout40% lowerdailyusageof kWh´sand
[Type here] 6
with that in lower expenses for the electricity but higher investment costs compared to HPS lighting (Stadler, 2020). The yield increased when LED interlighting was addedto HPS toplighting, in additionincreasedthe used energyby 8%. The highest yield was reached with Hybrid top lighting and LED interlighting, where the light distribution and used energy was comparable to the before mentioned treatment (Stadler, 2020). When part of the HPS top lights was replaced by LED interlights decreased yield and it was concluded that it would be more economic to use LEDs as top lights (360 µmol/m2/s, Hybrid lighting (HPS:LED, 2:1)) in contrast to interlights (240µmol/m2/s Hybrid lighting (HPS:LED, 1:1) together with 120µmol/m2/s LED interlighting)(Stadler,2021b).
The Icelandic greenhouse growers are still using a high light intensity with HPS lights.Therefore, it is importanttotest if the growersshouldreplacesome HPSlights by LEDs or if it would be better to use only HPS lights in tomato production. In the past, experiments with HPS lights were conducted with 750 W bulbs. However, with the use of 1000 W bulbs it would be possible to reduce lighting costs as investment costs could be lowered. Furthermore, a better PAR value could be reached by adjustingtheheightoflampsindepencetotheplantcanopy. In addition to the yield, the quality of the harvest is also important. Research in the Netherlands has shown that with LED lights it was possible to increase the taste of strawberries (Hanenberg et al., 2016). Experience of the effect of the light source in growing tomatoes under Hybrid top lighting compared to HPS top lighting and with different heights of the lamps is not available in Iceland. Therefore, the effect of the light on yield over the high winter (with low levels of natural light) needs to be tested under Icelandic conditons. Incorporating lighting into a production strategy is an economic decision involving added costs versus potential returns. Therefore, the questionariseswhetherthesefactorsareleadingtoanappropriateyieldoftomatoes. Theobjectiveof thisstudywas totestif (1)thelight sourceandtheir mountingheight is affecting growth, yield and quality of tomatoes, if (2) this parameter is converted efficiently into yield, and if (3) the profit margin can be improved by the choice of the light source and by the height of the lights. This study should enable to strengthen the knowledge on the best method of growing tomatoes and give vegetable growers advice of how to improve their production by modifying the efficiency of tomato production.
[Type here] 7
MATERIALSANDMETHODS
3.1 Greenhouseexperiment
experiment with ungrafted
(Lycopersicon esculentum Mill. cv. Completo) and different light treatments (see chapter “3.2 Treatments”) was conductedattheAgriculturalUniversityofIcelandatReykirduringwinter2021/2022. Completo from De Ruiter is a compact vigourous variety suitable for truss and loose harvest with a high yielding potential and uniform fruit weight of 90-95g (De Ruiter, withoutyear).
On 30.09.2021
sown in rockwool plugs. On 09.11.2021 four plants with one top/plant were planted into rockwool slabs (50 cm x 24 cm x 10 cm).
each bed were six slabs placed in three chambers. Tomatoes were transplanted inrowsinthree65cmhighbeds(Fig.1)with2,5plants/m2.Beds wereequippedwith six slabs respectively 24 tops. Three replicates, one replicate in each bed consisting of two slabs (8 plants) acted as subplots for measurements. Other slabs were not measured. Due to the weekly hanging down all plants were once at the end of the bed.
were regularly taken of the plants and the plants were deleafed once a week
leaves
cluster
a more open and generative plant habit. That
deleafing was done in the way that most of the time two leaves were taken of the bottom and one top leaf was taken at the upper
[Type here] 8 3
An
tomatoes
seeds of tomatoes were
On
30 1,23m0,36m1,45m0,36m1,45m0,36m1,45m0,36m1,45m0,36m1,23m 30 4,98m6,12m 1,0m3.rep.2.rep1.rep. 10,06m N Fig.1: Experimentaldesignofcabinets. Shoots
according to 15
per plant. The weekly
flowering
to create
improves light penetration and air circulation and prevents fungal diseases and aphids. The removal of young leaves reduces the total vegetative sink-strength and favours assimilate partitioning into the fruit (Heuvelink et al., 2005). Double clusters were removed. Fruits on each cluster were not pruned to be able to enable a high yield potential. Plants were not topped during the experiment to be able to have a “normal” growthuntiltheendof theexperiment andtoconductmeasurements.Wires were placed in 3,5m height from the floor. Handpollination was used instead of bumblebeestoguaranteeanevenpollinationamongchambers.
Until the 07.01.2022 was the temperature set on 20°C and after that on 20°C/ 16-17°C (day/night). The aim was to reach20°C at onehour after daystarts. At the endofthedaythetemperaturewasdroppedimmediately.Ventilationstartedat24°C. It was heated up with 1,5-2,0°C per hour. The underheat was set to 35°C in the beginning, increased to 50°C on 07.12.2021 and to 55°C on 24.02.2022. On 10.01.2022 the heating pipes were set on 45°C. Carbon dioxide was provided (800ppm CO2 with no ventilation and 600ppm CO2 with ventilation). A misting system was installed. Humidity was set to 75%. Plant protection was managed by beneficial organisms: En-Strip (Parasitic wasp, Encarsia Formosa) was used to preventwhitefly(seedetailsinappendix).
Tomatoes received standardnutritionconsisting of “YaraTeraTM FerticareTM Tomato”, calciumnitrateandpotassiumnitrateaccordingtothefollowingfertilizerplan(Tab.1).
Tab.1:
[Type here] 9
Fertilizermixture. StemsolutionA (100 l) StemsolutionB (100 l) Irrigation water Runoff water Fertilizer(amount in kg) YaraTera TM Ferticare TM TomatoPotassiumnitrateCalciumnitrate E.C.(mS/cm)E.C.(mS/cm) Planting-flowering on3.cluster 15 19 5 4-6 Floweringon3.-6. cluster 15 2 19 5 4-6 Floweringfrom6. clusteronwards 15 6 18 5 4-6
Plants were irrigated through drip irrigation (4tubes per slab). The watering was set up that the plants could root well down, which means a low amount of runoff in the first 2-3 weeks. The slabs were watered with an E.C. of 5. The irrigation (100ml/drip) was arranged to 30% runoff with an E.C. in the drip of 4-6. The first watering was at 5:00 and the last watering was at 18:00. The irrigation interval was variableinaccordancetotherunoff.
3.2 Treatments
Tomatoes were grown from 09.11.2021 until 16.03.2022 under different lighting regimesinthreecabinetsattheAgriculturalUniversityofIcelandatReykir:
1. HPStoplighting(1000W bulbs),HPSlampsin4,5mheightfromthefloor HPS
2. Hybridtoplighting(2:1,HPS:LED,750W HPS bulbs), HPSlightsin4,9mand LEDsin4,5mheightfromthefloor Hybridhigh
3. Hybrid top lighting (2:1, HPS:LED, 750 W HPS bulbs), HPS lamps and LEDs in4,5mheightfromthefloor Hybrid
To test if the light source had an influence on the yield of tomatoes plants that got HPS lights were compared to plants that got Hybrid lights (compare 1 and 3). In addition, it was tested if the height of the light source can be used to increase yield andprofitmargin(compare2and3).
HPS lights were used with an electronic ballast and 750W bulbs (Philips) in the Hybrid treatments, but 1000W bulbs in the HPS treatment to reduce lighting costs.
LED top lights “Green power LED” deep red/blue types (DR/B) and LED interlights 2,5m high output (respectively 2,0 m high output at the shelter bed next to the door) wereusedfromthecompanySignify.
The lamps were distributed in the way that tomatoes got the most equal light distribution according to the light plan of Signify for the LEDs and of Agrolux for the HPS lights (Tab.2). HPS lamps were mounted horizontally in 1,4/1,0m (“Hybrid high”/“Hybrid” and “HPS”) distance over the canopy, which corresponds to a height of 4,9m from thefloor in“Hybrid, high”,butin 4,5m in“Hybrid”.LEDsfortoplighting
[Type here] 10
mounted 4,5m from the floor, which was equivalent to 1,0m over the canopy. However, due to the roof of the greenhouse the LEDs over the shelter beds were mounted4,15mfromthefloor.
White plastic on the surrounding walls helped to get a higher light level at the edges of the growing area. The µmol level of the lights in “HPS” (472µmol/m2/s) and “Hybrid” (454µmol/m2/s) was comparable, while the µmol level of “Hybrid high” was muchlower(373µmol/m2/s)(Tab.3).ThesetupoftheHPSlightswascorresponding to 300W/m2 (HPS) and to 210W/m2 (“Hybrid”, “Hybrid high”). Light was provided from03:00-19:00afterplanting.
Tab.2:
3Cprofileswith4/6HPS, 1,75mforHPSdistancecentre centreand2mforHPScentre centre
3Cprofileswith4/5HPS, 2mforHPSdistancecentre centreand2mforHPScentre centre
8Cprofileswith3modules, 1,3mforCprofiledistanceand 1,9mformodulescentrecentre
[Type here] 11 were
Numberoflightsandtheirdistributioninthechambers. Lighttreatment Lights Lights/chamber (no) Distance between lights HPS HPStoplighting 16
Hybrid and HPStoplighting 14
Hybrid high LEDtoplighting 24
Tab.3: Lightdistributioninthechambers. HPS Hybridhigh Hybrid Measurementpoints ––––––––––(µmol/m2/s)––––––––––1,5m(floortotoplights) 374 321 372 2,0m(floortotoplights) 420 352 426 2,5m(floortotoplights) 474 381 498 3,0m(floortotoplights) 620 437 520 Toplighting(average) 472 373 454
3.3 Measurements,samplingandanalyses
Substrate temperature was measured in 1-2 cm depth by a portable thermometer (TP1110-HD2307.0 Temperature meter, Nieuwkoop, Aalsmeer, The Netherlands) and leaf temperature by a portable infrared contact thermometer (BEAM infrared thermometer, TFA Dostmann GmbH & Co. KG, Wertheim-Reicholzheim, Germany) byhand.Theamountoffertilizationwater(input,runoff)wasmeasuredeveryday.
To be able to determine plant development, in all treatments was the weekly growth, the number of leaves, leaf length, the number of clusters, the number of open flowers,thediameterofheadandthediameterof thecluster onthe highest flowering cluster, the distance between clusters and the length of clusters and total fruits per clustermeasuredeachweekonsixplants.
During the harvest period fruits were regularly collected (two times per week) in the subplots.Totalfreshyield,numberoffruits,fruitcategory(A-class(>55mm),B-class (45-55 mm) and not marketable fruits (too little fruits (<45 mm), fruits with blossom end rot) was determined. At the end of the experiment on each plant from the subplots the number of immature fruits (green) were counted by harvesting five clusters withonlygreenfruits above thelast harvestedcluster with maturefruits. The marketable yield of the whole chamber was also measured. LED glasses were used forpickingtobeabletodistinguishiffruitswerereadyforharvestingornot. The interior quality of the fruits was determined. A brix meter (Pocket Refractometer PAL-1, ATAGO, Tokyo, Japan) was used to measuresugar content in the fruits at the beginning and in the middle of the growth period. Sugar content at the end of the growthperiodwasnotmeasured,becauseharvestedfruitswerestored,duetoclosed roads,temporaryinacoolerbeforesugarmeasurementswouldhavebeenpossible.
Energyuse efficiency(total cumulative yieldin weight perkWh) andcosts for lighting per kg yield were calculated for economic evaluation and the profit margin was determined.
3.4 Statisticalanalyses
SAS Version 9.4 was used for statistical evaluations. The results were subjected to one-way analyses of variance with the significance of the means tested with a Tukey/KramerHSD-testatp≤0,05.
[Type here] 12
RESULTS
Environmentalconditionsforgrowing
4.1.1 Solarirradiation
Solarirradiationwasallowedtocomeintothe greenhouse.Therefore, incomingsolar irradiation was affecting plant development and was regularly measured. The natural light level was low during the whole growth period. The value was after transplanting less than 1 kWh/m2 at the beginning of November and was staying at this value until the end of January. With longer days increased solar irradiation naturally continuously,howeverwithupto3kWh/m2 wasthisvaluestilllow(Fig.2).
Fig.2: Timecourseofsolarirradiation. Solar irradiation was measured every day and values for one week were cumulated.

[Type here] 13 4
4.1
4.1.2 Chambersettings
Thesettings in the chambers were regularly recorded. Table4 shows theaverage of theairtemperature,floortemperature,CO2 amount,windowsopeningandhumidity. The average air temperature amounted around 21°C and was very similar between the light treatments. The average air temperature during the day was about 0,5°C lower in the treatment “HPS” compared to the other light treatments. However, the averagenighttemperaturewassimilarbetweenlighttreatments.
The floor temperature during the day was comparable between the light treatments. The floor temperature during the night was less than 3°C lower in the treatment “HPS”comparedtotheothertreatments.
The mean CO2 amount was very similar between treatments. Windows were in all lighttreatmentsmostofthetimeclosed.Humidityamounted61-68%.
Tab.4:Chambersettingsaccordingtogreenhousecomputer.
Greenhouse computer data (Average over the experimental period)
HPS Hybrid high Hybrid Airtemperature(°C) 21,1 21,3 21,5 day(°C) 22,4 22,8 23,0 night(°C) 18,6 18,6 18,7
Floortemperatureday(°C) 42,4 42,2 41,6 Floortemperaturenight(°C) 34,4 36,9 37,2 CO2 (ppm) 740 747 761
Windowsopening1(%) 1,8 2,0 3,6
Windowsopening2(%) 1,6 2,3 2,1 Humidity(%) 66 61 68
4.1.3 Substratetemperature
Substrate temperature was measured weekly at low solar radiation at around noon andfluctuatedbetween18-23°C. Substratetemperature was onaveragesignificantly lower in “Hybrid high” compared to the other light treatments. On average amounted thisdifference0,6°C(Fig.3).
[Type here] 14
Fig.3:
Letters indicate significant differences (HSD, p ≤ 0,05).
Leaftemperature
Leaf temperature was measured weekly at low solar radiation at around noon and fluctuated between 17-24°C. On average the leaf temperature was significantly higherin“HPS”comparedtoplantsthatgotHybridlights(Fig.4).

[Type here] 15
Substratetemperature.
4.1.4
Fig.4: Leaftemperature. Letters indicate significant differences (HSD, p ≤ 0,05).
4.1.5 Irrigationoftomatoes
The amount of applied water varied most of the time between 2 and 6 l/m2 (Fig.5). Bycalculatingthedaily applied water rate per month(Fig.6) it is gettingobvious that alllighttreatmentswerewateredequally. E.C. and pH of irrigation water was fluctuating much (Fig.7). The E.C. of applied water ranged most of the time between 3,5-5,0 and the pH between 5,5-6,5. The E.C. of runoff stayed most of the time between 4,0-7,0 and the pH between 5,5-8,0. TheE.C.oftherunoffseemtobelowestfor“Hybridhigh”.
The amount of runoff from applied irrigation fluctuated very much and varied most of the time between 20-60% runoff. It seems to be on average highest in “Hybrid high” (Fig.8).

[Type here] 16
Fig.5:
Fig.6:
[Type here] 17
Dailyappliedwater.
Averagedailyappliedwaterineachmonth.
[Type here] 0 Fig.7: E.C.and pH of irrigationwater and runoff. 1 8
Fig.8:
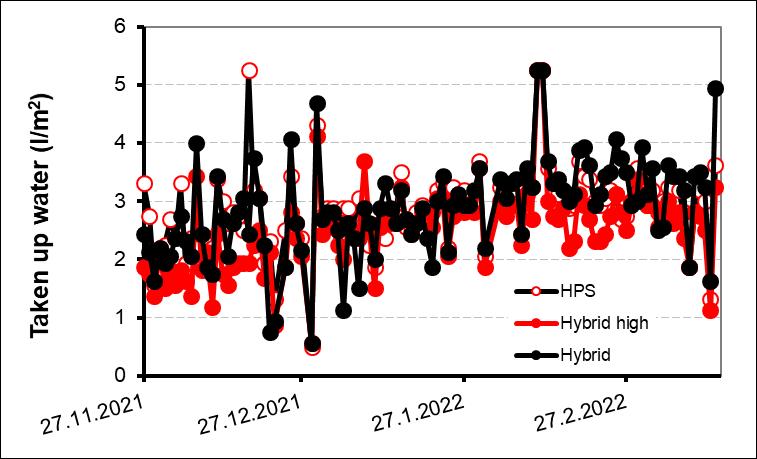
Plantstookupto1,5-4,0l/m2.Itseemsthatplantstookuplesswaterinthetreatment “Hybridhigh”(Fig.9).
Fig.9:
[Type here] 19
Proportionofamountofrunofffromappliedirrigationwater.
Wateruptake.
4.2 Developmentoftomatoes
4.2.1 Plantdiseasesandpests
Neitherplantdiseasesnorpestswereobserved.
4.2.2 Height
Tomato plants were growing about 2-4cm per day and reached at the end of the experiment more than 4m (Fig.10). Plants were significantly taller when grown underHPSlights.
Fig.10: Heightoftomatoes. Letters indicate significant differences at the end of the experiment (HSD, p ≤ 0,05).
4.2.3 Weeklygrowth
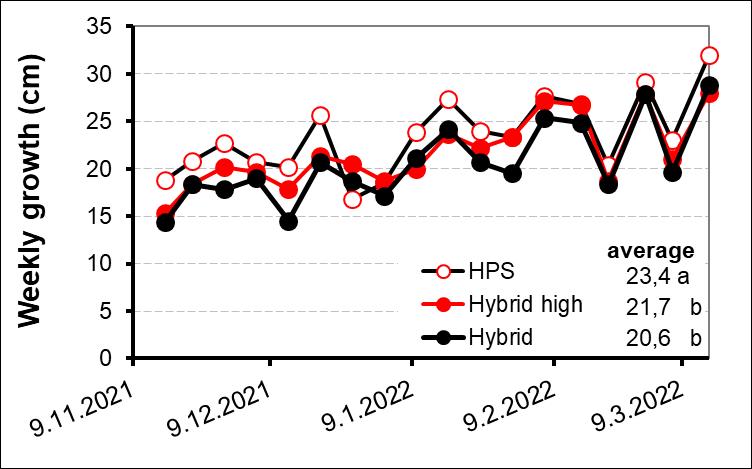
The weekly growth amounted 15-30 cm. Plants under HPS lights grow on average significantlymorecomparedtothetwoHybridtreatments(Fig.11).
4.2.4 Numberofleaves
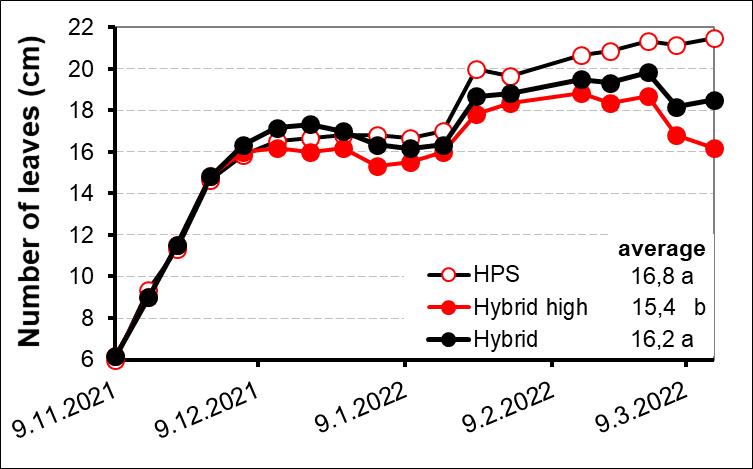
Plants had on average 15-17 leaves. However, “Hybrid high” had on average a significantlyloweramountofleavescomparedtotheotherlighttreatments(Fig.12).

[Type here] 20
Fig.11: Weeklygrowth.
Letters indicate significant differences (HSD, p ≤ 0,05).
Fig.12: Numberofleavesonthetomatoplant.
Letters indicate significant differences (HSD, p ≤ 0,05).
[Type here] 21
4.2.5 Lengthofleaves
Length of leaves during the experiment remained at 36-48 cm (Fig.13). The light treatmenthadnoinfluenceonthelengthoftheleaves. Fig.13: Lengthofleaves. Letters indicate significant differences (HSD, p ≤ 0,05).
4.2.6 Numberofclusters
Thenumberofclustersincreasedwithapproximatelyoneadditionalclusterperweek. Thetreatment “Hybrid high” had a significantlylower amount of clusterscomparedto “HPS”, whereas no differences in the number of clusters were observed for “HPS” and“Hybrid”aswellasfor“Hybrid”and“Hybridhigh”(Fig.14).

4.2.7 Lengthofclusterstotop
The length from the uppermost flowering cluster to the top of the plant amounted on average18-20cmwithnosignificantdifferencesbetweenlighttreatments(Fig.15).
[Type here] 22
Fig.14: Numberofclusters.
Letters indicate significant differences at the end of the experiment (HSD, p ≤ 0,05).
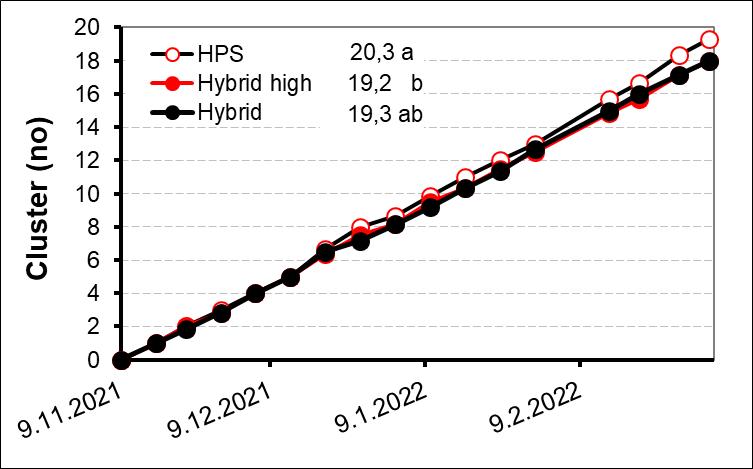
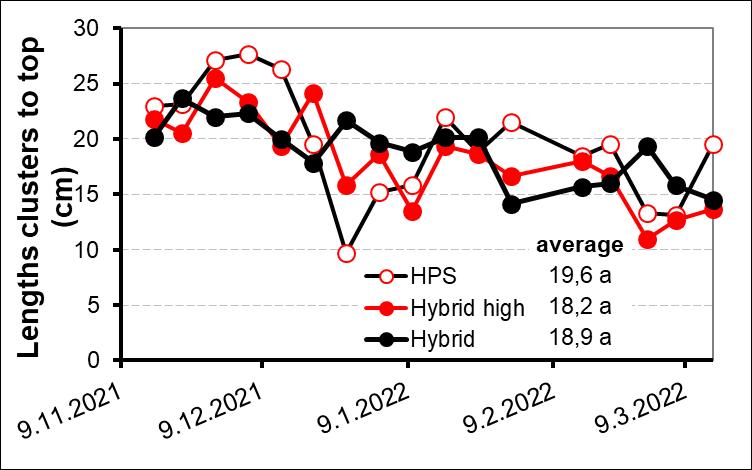
Fig.15: Lengthofuppermostfloweringclustertoplanttop.
Letters indicate significant differences (HSD, p ≤ 0,05).
[Type here] 23
4.2.8 Distancebetweenclusters
The distance between clusters was fluctuating between 18-24cm during the growth period. On average amountedthe distance 21-22cm and was significantly higher for “HPS” than for “Hybrid”, whereas no significant differences were found between “Hybrid”and“Hybridhigh”aswellasbetween“HPS”and“Hybridhigh”(Fig.16).

Fig.16: Distancebetweenclusters. Letters indicate significant differences (HSD, p ≤ 0,05).
4.2.9 Lengthofclusters
The length of clusters decreased from about 30 cm to about 20 cm at the end of the experiment (Fig.17). On average no significant differences between light treatments inthelengthofclustersweremeasured.
[Type here] 24
Fig.17: Lengthofclusters.
Letters indicate significant differences (HSD, p ≤ 0,05).
4.2.10 Fruitspercluster
Clusters were not pruned. Consequently the number of fruits per cluster fluctuated (Fig.18). The number of fruits per cluster decreased during the harvest period from around 12at the beginning of the harvest period to about 9 at the end of theharvest period. The average number of fruits per cluster amounted around 11 and was independentofthelighttreatment.
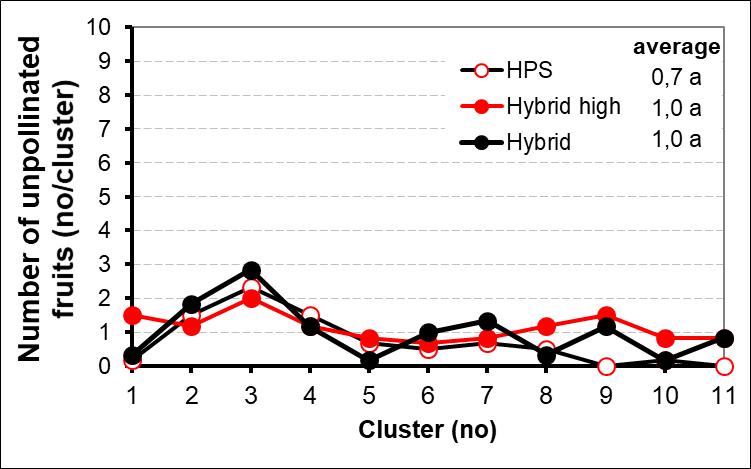
Thenumber of not pollinatedfruits per cluster was fluctuating between0-2, however, with a peak of 3 on the third cluster. The average number of not pollinated fruits amountedaround1andwasindependentofthelighttreatment(Fig.19).
4.2.11 Numberofopenflowers
On the uppermost cluster was the number of open flowers counted. The number of open clusters fluctuated during the growth period between 2-5 per cluster. On average were significant more open flowers under “HPS” than under “Hybrid high” observed, whereas the number was independent between “HPS” and “Hybrid” as wellasbetween“Hybrid”and“Hybridhigh”(Fig.20).

[Type here] 25
Fig.18: Numberoffruitspercluster. Letters indicate significant differences (HSD, p ≤ 0,05).
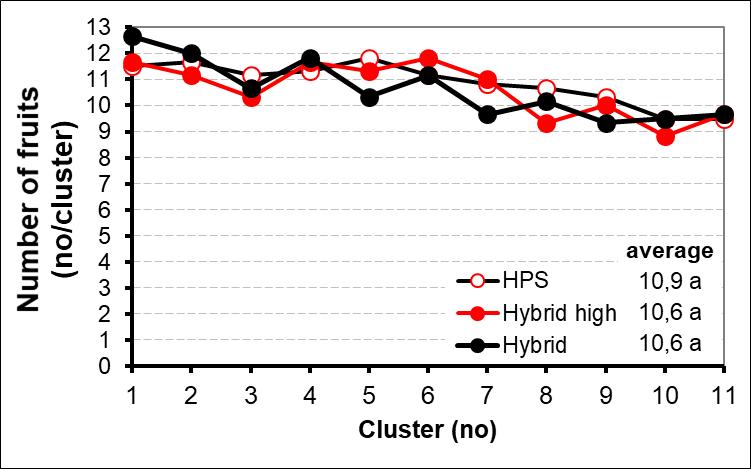
Fig.19: Numberofunpollinatedfruitspercluster. Letters indicate significant differences (HSD, p ≤ 0,05).
[Type here] 26
Fig.20: Numberofflowers.
Letters indicate significant differences (HSD, p ≤ 0,05).
4.2.12 Stemdiameter
Stem diameter was varying from 0,7 to 1,5 cm (Fig.21). On average amounted the diameterofthestem0,92-1,01cmandwasindependentofthelighttreatment.Plants were most of the time of the growth period weak vegetative, respectively very vegetative.
4.2.13 Diameteroftheuppermostfloweringcluster
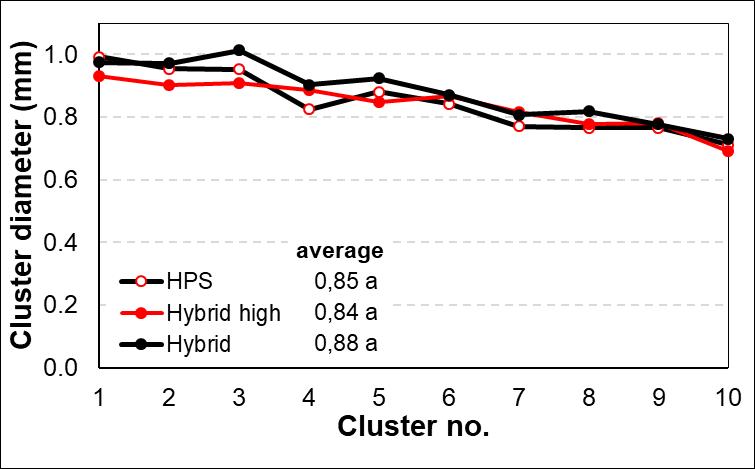
The diameter of the uppermost flowering cluster decreased from about 1,0 mm to about 0,7 mm during the growth period. No significant differences between the light treatmentsweremeasured.

[Type here] 27
Fig.21: Stemdiameterandquotientlengthstotopandstemdiameter. Numbers arerepresenting the week number.
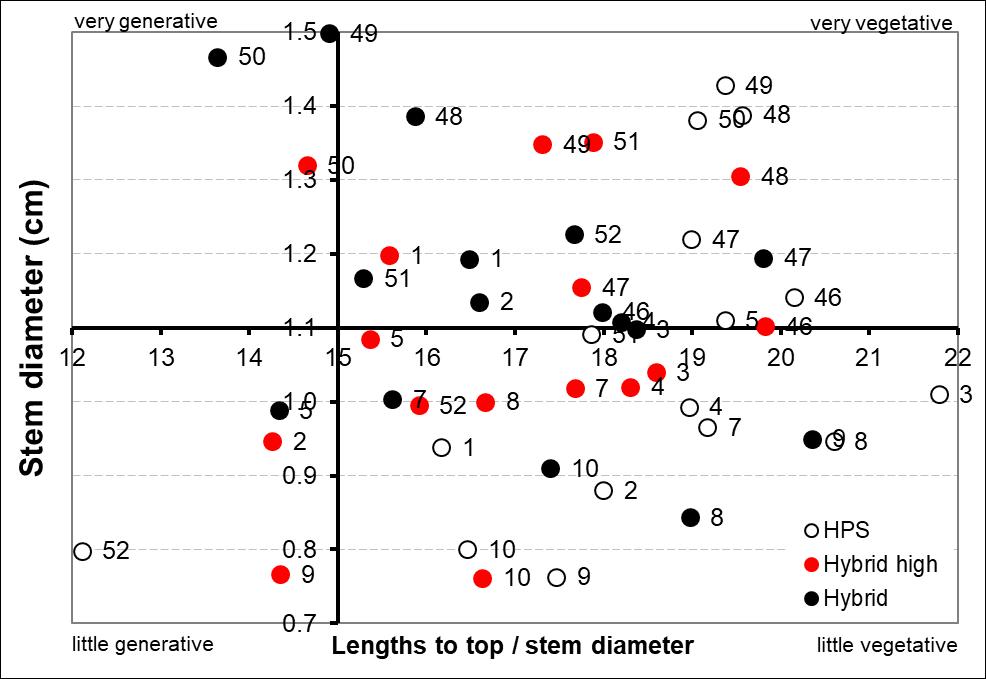
Fig.22: Diameteroftheuppermostfloweringcluster. Letters indicate significant differences (HSD, p ≤ 0,05).
[Type here] 28
4.3 Yield
4.3.1 Totalyieldoffruits
The yield of tomatoes included all harvested red fruits during the growth period. The fruits were classified in 1.class (>55mm), 2.class (45-55 mm) and not marketable fruits(toolittlefruits (<45mm),fruitswithblossomendrot,notwellshapedfruitsand greenfruitsattheendoftheharvestperiod).
Cumulative total yield of tomatoes ranged between27-32kg/m2 (Fig.23). Intotal the cumulative total yield of tomatoes was independent of the light treatment (“HPS” versus “Hybrid”), but significantly lower when lights were mounted higher. However, the 1.class yield and the 2.class yield was affected by the light treatment. Under “Hybrid high” significantly lower 1.class yield was measured than under “Hybrid”, whereas the 2.class yield was independent of the height of the lights. A significantly higher 2.class yield was measured under “HPS” compared to “Hybrid”. In contrast, the too little fruits as well as the green fruits were neither affected by the light source norbytheheightofthelights.
Fig.23: Cumulativetotalyieldoftomatoesinkg. Letters indicate significant differences at the end of the experiment (HSD, p ≤ 0,05).

[Type here] 29
The total amount of fruits harvested was independent of the light source and the heightof thelights.Whilethe number of 1.classfruits,toolittlefruitsand greenfruits was independent of the light treatment, was the amount of 2. class fruits significantly higher under “HPS” compared to “Hybrid”, whereas the number was not influenced bytheheightofthelights(Fig.24).
Fig.24: Cumulativetotalyieldoftomatoesinnumber. Letters indicate significant differences at the end of the experiment (HSD, p ≤ 0,05).
4.3.2 Marketableyieldoftomatoes
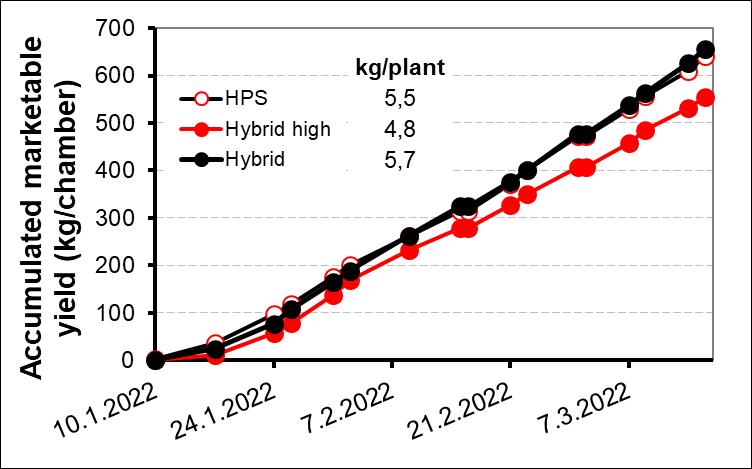
Plants that received HPS or Hybrid lights, where the distance between light and plants was reduced, started to give red fruits about half a week earlier than plants whereHybridlights weremounted higher.At theendof theharvest periodamounted marketable yield of tomatoes 18-22kg/m2 (Fig.25). No significant differences between light sources (“HPS” versus “Hybrid”) were observed, whereas a significantly lower marketable yield was measured when the lights were mounted higher. This difference amounted about 20% less marketable yield at “Hybrid high” comparedto“Hybrid”.

[Type here] 30
Fig.25: Timecourseofmarketableyield(1.and2.classtomatoes). Letters indicate significant differences at the end of the experiment (HSD, p ≤ 0,05).
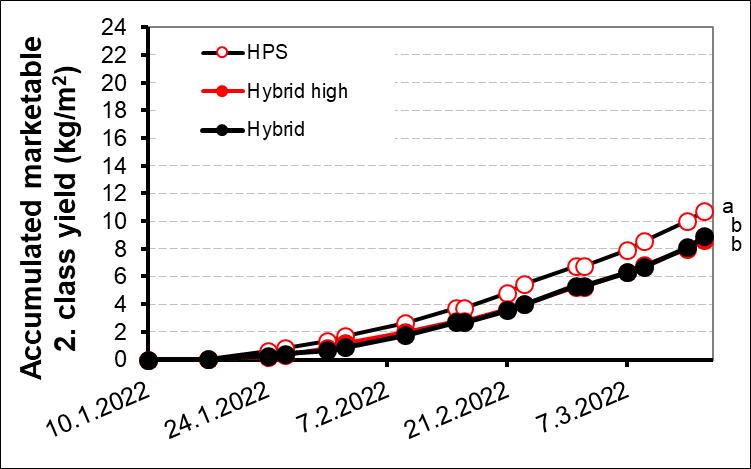
The1. class yieldamounted9-13 kg/m2 (Fig.26) andthe 2. class yield 9-11 kg/m2 at theendoftheharvestperiod(Fig.27).The1.classyieldwasnotaffectedbythelight source (“HPS” versus “Hybrid”). However, when Hybrid lights were mounted lower (“Hybrid”) a significantly higher 1. class yield was reached compared to when Hybrid lights were mounted higher (“Hybrid high”). This difference amounted about 30%. In contrast, the 2. class yield was independent of the height of the lights. However, the 2. class yield was significantly higher when plants received HPS lights compared to Hybridlights(Fig.27).
Also, the marketable yield of the whole chamber was measured (Fig.28). A higher marketable yield was reached with “HPS” (5,5 kg/plant) and “Hybrid” (5,7 kg/plant) comparedto“Hybridhigh”(4,8kg/plant).

[Type here] 31
Fig.26: Timecourseofmarketable1.classyield. Letters indicate significant differences at the end of the experiment (HSD, p ≤ 0,05).
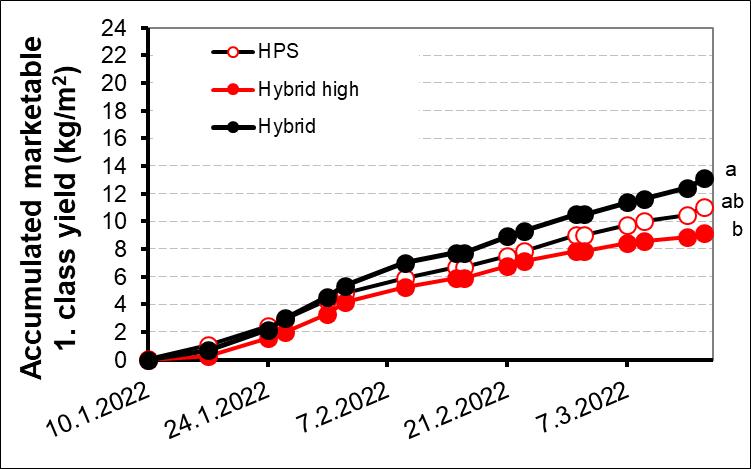
Fig.27: Timecourseofmarketable2.classyield. Letters indicate significant differences at the end of the experiment (HSD, p ≤ 0,05).
[Type here] 32
Fig.28: Timecourseofmarketableyieldoftomatoesinthewholechamber.
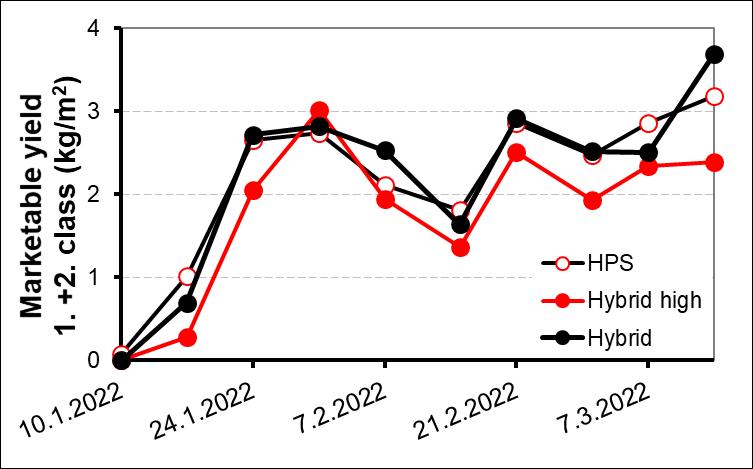
Fig.29: Timecourseofmarketableyield.
[Type here] 33
The weekly harvest of 1. class and 2. class fruits amounted 1,0-3,5 kg/m2, but was mostofthetime2,0-3,0kg/m2 (Fig.29).
The number of 1. class fruits was independent of the light treatment (Tab.5). The number of 1. class fruits was neither influenced by the light source nor by the height of the lights. The number of 2. class fruits was significantly higher in “HPS” than in the other light treatments. The total number of marketable fruits was neither significantly different between light sources (“HPS” versus “Hybrid”) nor between differentheightsofthelights.
Tab.5: Cumulativetotalnumberofmarketablefruits. Treatment Numberofmarketablefruits
1.class 2.class total(1.class+2.class) (no/m2) (no/m2) (no/m2)
HPS 107a 140a 247a Hybridhigh 90a 115 b 205 b Hybrid 124a 116 b 240ab Letters indicate significant differences (HSD, p ≤ 0,05).
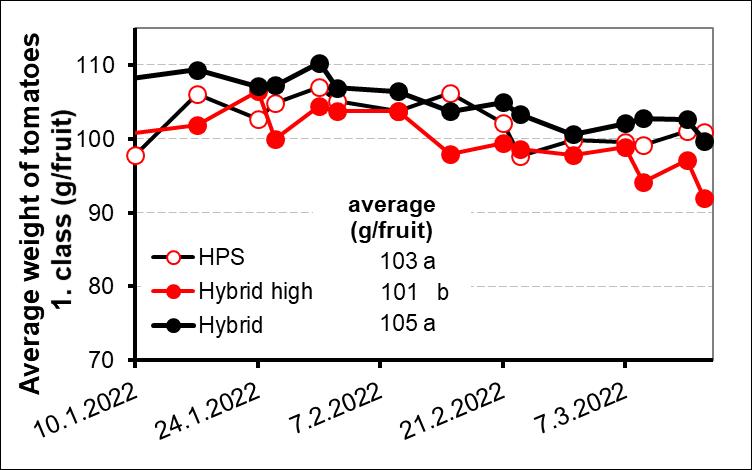
Average fruit size of 1.class tomatoes varyied between 95-110g/fruit and decreased slightly from 100-110g/fruit to 95-100g/fruit during the harvest period (Fig.30). On average the weight of 1.class tomatoes was independent of the light source.However, whenthelights weremounted higher, asignificantlylower average sizewasmeasured.
[Type here] 34
Fig.30: Averageweightoftomatoes(1.classfruits).
Letters indicate significant differences (HSD, p ≤ 0,05).
Fig.31: Averageweightoftomatoes(1.and2.classfruits).
Letters indicate significant differences (HSD, p ≤ 0,05).
[Type here] 35
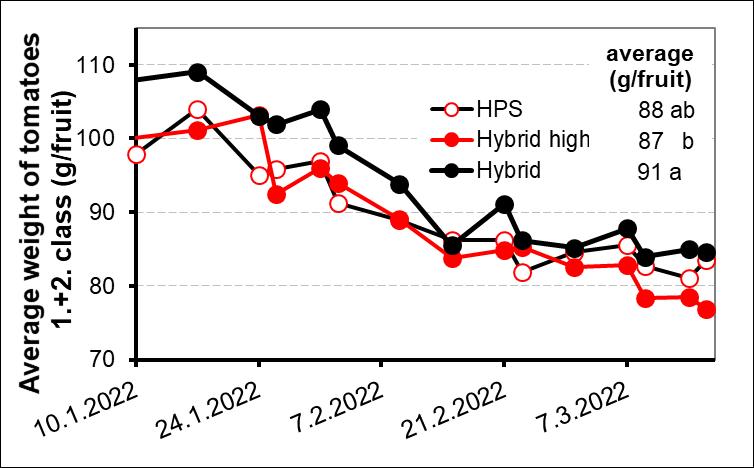
Average fruit size of 1. and 2.
was varying between 80-110 g/fruit (Fig.31). The fruit size decreased at proceeded harvest period from 100-110 g/fruit to 80-85 g/fruit. The light source did not affect average fruit size, even though a slightly higher average size of 3g was found under Hybrid lights compared to HPS lights. In contrast, when lights were mounted higher, were significantly lighter fruits measured.Thisdifferenceamounted14g.
4.3.3 Outerqualityofyield
Marketable yield was around 70% of
yield for all light treatments (Tab.6). The percentage of 1.class fruits, 2.class fruits and too little fruits was both independent of the light source as well as of the height of the lights. However, while “HPS” and “Hybrid high” had a comparable proportion of 1.and 2.class fruits, for “Hybrid” the proportion of 1.class fruits was higher than of 2.class fruits. Blossom end rot fruits as well as unshaped fruits had a proportion of zero on total yield. The proportion of green fruits on total yield
very high due to the fact that tomato plants were not topped
allowed to grow “naturally” until the end of the experiment. Therefore, the amount of green fruits was high as new clusters
theexperiment,whichwerethenharvestedas greenfruits. Theproportionofgreenfruitswascomparableinalllighttreatments.
[Type here] 36
class tomatoes
total
was in all light treatments
and
developeduntiltheendof
Tab.6: Proportionofmarketableandunmarketableyield. Treatment Marketableyield(%) Unmarketableyield(%) 1.class >55mm 2.class >45-55mm toolittle weight blossom endrot notwell shaped green HPS 35a 34a 5a 0a 0a 26a Hybridhigh 34a 33a 8a 0a 0a 25a Hybrid 42a 28a 5a 0a 0a 25a Letters indicate significant differences at the end of the experiment (HSD, p ≤ 0,05).
4.3.4 Interiorqualityofyield–sugarcontent
Sugar content of tomatoes was measured two times during the harvest period. Completo had a sugar content of 3,2-3,6°BRIX. The sugar content was independent of the light treatment. However, the sugar content seems to be tendentially higher underHPSlightsthanunderHybridlights(Fig.32).
Fig.32: Sugarcontentoftomatoes. Letters indicate significant differences (HSD, p ≤ 0,05).
4.4 Economics
4.4.1 Usedenergy
Thenumberof lighting hoursiscontributingtohighannualcostsandneedstherefore special consideration to consider decreasing lighting costs per kg “yield”. The total hours of lighting and the used kWh’s during the growth period after transplanting weremeasuredwithdataloggers. Productionoftomatoesresultedinthe“HPS”chamberinadailyusageof235,9kWh, in the “Hybrid high” chamber in a daily usage of 237,8kWh and in the “Hybrid” chamber in a daily usage of 241,1kWh (Tab.7). This means that the costs for growingtomatoeswereinallthelighttreatmentscomparable(Tab.7).

[Type here] 37
Tab.7:
(kWh/day)
(kWh/growthperiod)
29.961 29.965 Energy/m2 (kWh/m
4.4.2
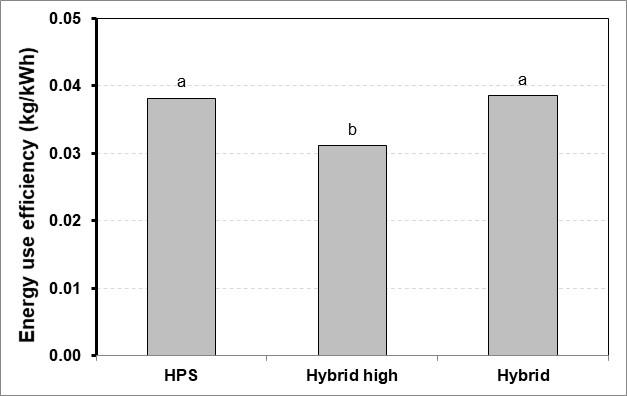
When tomatoes were lightened with
that were placed high, were kWh’s transferred
lights that were placed closer to theplants(Fig.33).Thisdifferenceamounted20%.Incontrast,thelightsource,HPS orHybridlights,hadnoinfluenceontheenergyuseefficiency.
Fig.33:
[Type here] 38
Usedenergyunderdifferentlighttreatments(dataloggervalues). Treatment HPS Hybridhigh Hybrid Energy
235,9 237,8 241,1 Energy
29.959
2) 571 571 571
Energyuseefficiency
Hybrid lights
less good into yield compared to Hybrid
Energy use efficiency (= marketable yield per used energy) for tomatoesunderdifferentlighttreatments.
Lightrelatedcosts
thecost forelectricityhas been split between the monopolist
to utilities, transmission and distribution and the competitive part, the electricity itself. Most growers (95%) are, due to their location, mandatory customers of RARIK, the distribution system operator (DSO) for mostofIcelandexceptintheSouthwestandWestfjords. The government subsidises the distribution cost of growers that comply to certain criterias. In recent years, the subsidies fluctuated quite much. After substitution / directpaymentfromthestateofvariablecostofdistribution(95%)resultedincostsof about 1ISK/kWh for distribution, while for the sale values amounted 5,89-7,49ISK/kWh. However, it has to be taken into account that big vegetable growerscan get atleast50% discount onthe tariffvalues. Basedonthis information, were energy costs for tomato production calculated (Tab.8). The electricity costs did not differ much between light treatments. In contrast, investments into lights were much lower for “HPS” than for “Hybrid high” and for “Hybrid”. The investment costs into lights more than doubled when Hybrid lights were used compared to only HPS lights(Fig.34).
[Type here] 39 4.4.3
Sincetheapplicationoftheelectricitylaw65/2003in2005,
access
Tab.8: Energy costs and investment into lights for one growing circle of tomatoesunderdifferentlighttreatments. Costs(ISK/m2) HPS Hybridhigh Hybrid Electricitydistribution 1 571 571 571 Electricitysale 2 3.363-4.277 3.363-4.277 3.363-4.277 ∑ Electricitycosts 3.934-4.848 3.934-4.848 3.934-4.848 Lamps 3 944 2.738 2.738 Bulbs 4 604 549 549 ∑ Investment lights 1.548 3.287 3.287 Total light related costs 5.482-6.396 7.221-8.135 7.221-8.135 1 Assumption: On average around 1 ISK/kWh after substitution / direct payment from the state 2 Assumption: Around 5,89-7,49 ISK/kWh (according to data from Rarik in the year 2022) 3 HPS lights: 25.760 ISK / 750 W lamp, 26.565 ISK / 1000 W lamp, lifetime: 8 years, LEDs: 50.000 ISK/lamp, lifetime: 11 years 4 HPS bulbs: 5.474 ISK / 750 W bulb / 5.275 ISK/ 1000 W bulb, lifetime: 2 years
4.4.4 Costsofelectricityinrelationtoyield
Costs of electricity in relation to yield for wintergrown tomatoes were calculated (Tab.9). The costs of electricity
source had no influence on the costs of
kg yield increased by 22% when Hybrid lights were mounted high. In contrast, the
4.4.5 Profitmargin
The profit margin is a parameter for the economy of growing a crop. It is calculated by substracting the variable costs from the revenues. The revenues itself, is the product of the price of the sale of the fruits and kg yield. For each kg of tomatoes, growers
getting about 590 ISK from Sölufélag garðyrkjumanna (SFG, The Horticulturists’ Sales
in addition about 113 ISK from the government.
[Type here] 40 Fig.34: Light related costs in tomato production under different light treatments.
per
light
electricityinrelationtoyield. Tab.9: Variablecostsofelectricityinrelationtoyield. Treatment HPS Hybrid high Hybrid Yield (kg/m2) 21,8 17,8 22,0 Electricitycosts(ISK/kg yield) 188-222 221-272 179-220
are
Company) and
Therefore, the revenues increased with more yield (Fig.35). The light source had no influence on the revenue, whereas a higher profit margin was reached by having the lightsclosertotheplants.

Fig.35: Revenuesatdifferentlighttreatments.
When considering the results of previous chapter, one must keep in mind that there are other cost drivers in growing tomatoes than electricity alone (Tab.10). Among others, those are e.g. the costs for seeds and seedling production (≈350ISK/m2) and transplanting (≈480ISK/m2), costs for gutters (≈100ISK/m2), andwateringsystem(≈350ISK/m2),costsforplantnutrition(≈370ISK/m2),costsfor plant protection (≈30ISK/m2), truss support (≈70ISK/m2), CO2 transport (≈260ISK/m2), liquid CO2 (≈2.600ISK/m2), the rent of the tank (≈440ISK/m2), the rent of the green box (≈170ISK/m2), material for packing (≈800ISK/m2), packing costs with the machine from SFG (≈330ISK/m2) and transport costs from SFG (≈260ISK/m2)(Fig.36).
[Type here] 41
in Fig.36 three of the biggest cost drivers are not included and these are investment in lamps and bulbs, electricity and labour costs. These costs are also includedin Fig.37 and it is obvious, that especiallythe electricity and the investment in lamps and bulbs as well as the CO2 and labour costs are contributing much to the variable and fixed costs beside the costs for seedling production, transplanting and cultivation and the costs for packing and marketing. The proportion of the variable andfixedcosts ismainlythesameforalllight treatments.Attentionhastobepaid on the big proportion of 40-47% of light related costs (electricity+ investment intolamps andbulbs) ontotal productioncosts.Withauseof HPS lightsinsteadof Hybridlights decreased the costs of investment into lamps and bulbs from 20% to 10%. The proportionoftheothercostsiscomparableforalllighttreatments.
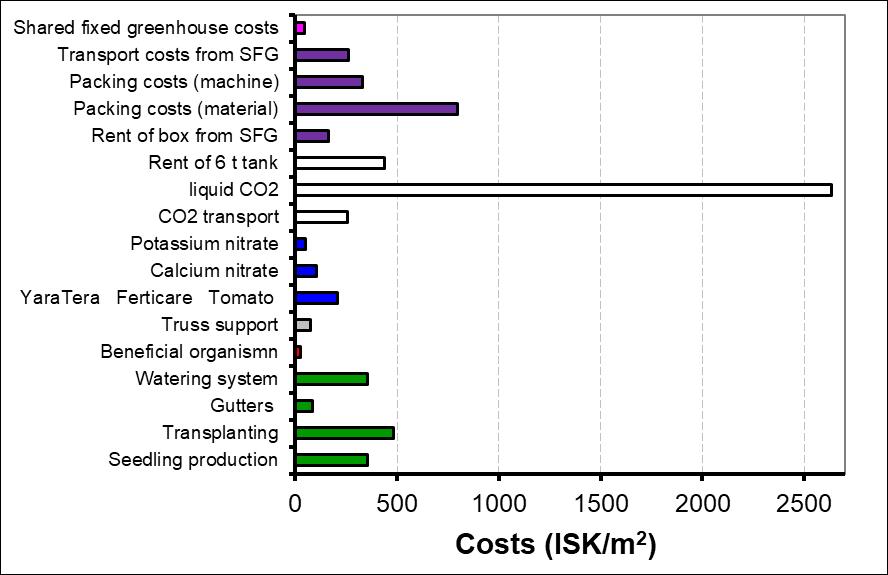
[Type here] 42 Fig.36: Variableandfixedcosts(withoutlightingandlabourcosts). However,
2 TM TM 2
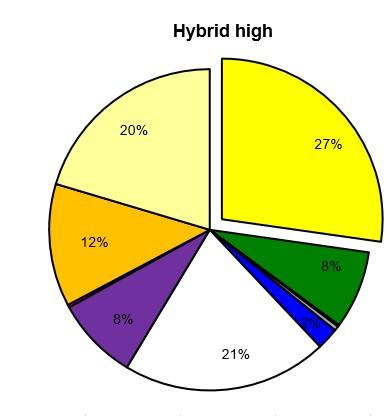
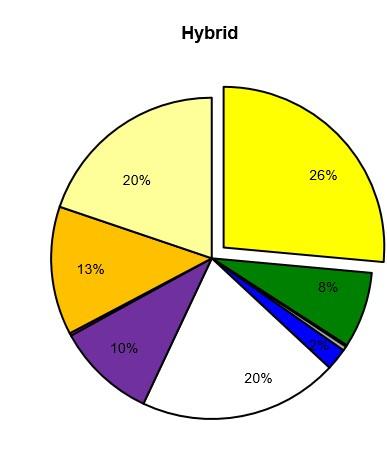
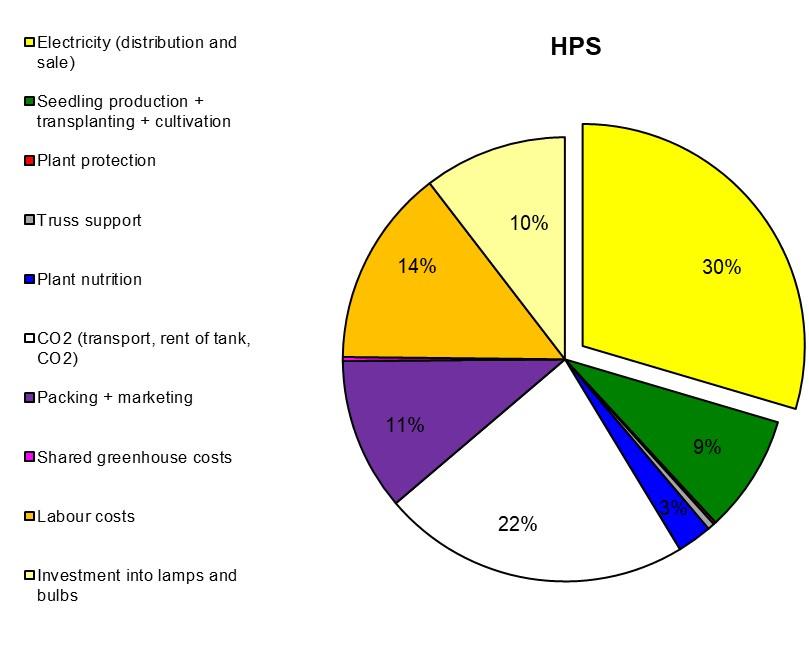
[Type here] 43 Fig.37: Divisionofvariableandfixedcosts. AdetailedcompositionofthevariablecostsateachtreatmentisshowninTab.10. 2 2
[Type here] 44 Tab.10: Profitmarginoftomatoesatdifferentlighttreatments. Treatment HPS Hybrid high Hybrid Marketableyield(kg/m2) 21,8 17,8 22,0 Sales SFG(ISK/kg) 1 590 590 590 Government(ISK/kg) 2 112,84 112,84 112,84 Revenues(ISK/m2) 15.322 12.511 15.462 Variableandfixedcosts(ISK/m2) Electricitydistribution 3 571 571 571 Electricitysale 4 3.363-4.277 3.363-4.277 3.363-4.277 Seeds 5 192 192 192 Grodansmall 6 13 13 13 Grodanbig 7 149 149 149 Slab 8 397 397 397 Strings 9 84 84 84 Gutters 10 85 85 85 Wateringsystem 353 353 353 Beneficialorganismn 11 26 26 26 Trusssupport 12 74 74 74 YaraTeraTMFerticareTM Tomato13 214 202 209 Potassiumnitrate 14 109 103 106 Calciumnitrate 15 53 51 53 CO2 transport 16 256 256 256 LiquidCO2 17 2.636 2.636 2.636 RentofCO2 tank 18 440 440 440 RentofboxfromSFG 19 176 143 177 Packingmaterial 20 847 692 855 Packing(labour+machine) 21 349 285 352 TransportfromSFG 22 276 225 278 Sharedfixedcosts 23 43 43 43 Lamps 24 944 2.738 2.738 Bulbs 25 604 549 549 ∑variablecosts 12.252-13.166 13.670-14.594 13.958-14.912 Revenues-∑variablecosts 3.070-2.156 -1.159--2.073 1.464-550 Workinghours(h/m2) 0,96 0,90 0,97 Salary(ISK/h) 2.221 2.221 2.221 Labourcosts(ISK/m2) 2.140 1.991 2.147 Profitmargin(ISK/m2) 930-16 -3.151--4.065 -683--1.597 1 Price winter 2021/2022: 590 ISK/kg 2 Price for 2021: 112,84 ISK/kg 3 Assumption: On average around 1ISK/kWhafter substitution / direct payment from the state 4 Assumption: Around 5,89-7,49 ISK/kWh (according to data from Rarik in the year 2022) 5 76.880 ISK / 1.000 Completo seeds 6 36x36x40mm, 1.100 ISK / 220 Grodan small 7 27/35, 48 ISK/ 1 Grodan big
8 50x24x10cm, 512 ISK/slab
9 27 ISK / string
10 4.388 ISK / m gutter; assumption: 10 years lifetime, 1,33 circles / year
11 3.956 ISK / unit parasitic wasps (Encarsia formosa), twice
11 2 ISK / truss support
13 7.275 ISK / 25 kg YaraTeraTM FerticareTM Tomato
14 5.225 ISK / 25 kg Potassium nitrate
15 3.050 ISK / 25 kg Calcium nitrate
16 CO2 transport from Rvk to Hveragerði / Flúðir: 9,34 ISK/kg CO2
17 Liquid CO2: 77,39 ISK/kg CO2
18 Rent for 6 t tank: 80.000 ISK/mon, assumption: rent in relation to 1.000 m2 lightened area
19 104 ISK / box
20 Packing costs (material):
Costs for packing of tomatoes (1,00 kg): Platter: 21 ISK/ kg, plastic film: 11ISK / kg, label: 2 ISK / kg
21 Packing costs (labour + machine): 16 ISK / kg
22 Transport costs from SFG: 10,2 ISK/ kg
23 94 ISK/m2/year for common electricity, real propertyandmaintenance
24 HPS lights 750W: 25.760 ISK/lamp, lifetime: 8 years
HPS lights 1000W: 26.565 ISK/lamp, lifetime: 8 years
LED top lights: 50.000ISK/lamp, lifetime: 11 years
25 HPS bulbs: 5.474 ISK / 750 W bulb, 5.275 ISK / 1000 W bulb, lifetime: 2 years
The profit margin was dependent on the light treatment and was varying between 900 to -4.100 ISK/m2 (Fig.38). The profit margin was lower under the treatment where the Hybrid lights were mounted higher (-3.200 to -4.100 ISK/m2) than under treatments where Hybrid lights were mounted lower (-700 to -1.600 ISK/m2). That means by lowering the lights closer to the plants profit margin increased by 2.500 ISK/m2. When some of the HPS lights were replaced by LED top lights profit margin decreased by 1.600ISK/m2 and reached -700ISK/m2 instead of 900ISK/m2 , respectively -1.600ISK/m2 instead of 0ISK/m2. However, it must be taken into account that the profit margin depends much on the actual price of the LEDs in the Hybridtreatments.
[Type here] 45
5 DISCUSSION
In winter production, the success of vegetable growing strongly depends on supplementallighting. Inthisexperiment,theeffectoftwolightsourcesandtheeffect oftheheightofthelightsovertheplantcanopywastestedontomatoes.
5.1 Yieldindependenceofthelightsource
When tomatoes were lighted, either with HPS or Hybrid top lights with a distance of one meter between lights and plant canopy, a comparable µmol level between light sources was reached. Then, the beginning of harvest, the total and marketable yield of tomatoes and their number was independent of the light source. However, previous experiments have shown that the harvest was delayed when plants were grown under HPS lights compared to LEDs: The harvest started half a week earlier whentomatoes receivedLEDs inyoung plant production, but this advantagewas not reflected in a higher marketable yield (Stadler, 2021b). Also, strawberry plants under HPS lights showed a delayed growth that was one week behind the development of strawberries treated with LEDs and increased temperature (Stadler, 2019), while

[Type here] 46 Fig.38: Profitmargininrelationtothelighttreatment.
strawberries in the LED treatment were delayed when temperature settings were the same, however with no yield differences between HPS and LEDs (Stadler, 2018). In contrast, the marketable yield of the strawberry variety Magnum under HPS lights was significantly higher than under LEDs and increased temperature, while there were no significant yield differences between light sources for the strawberry variety Sonata(Stadler,2019).Also Dysko & Kaniszewski (2021)reportedthattomatoplants that got LEDs fruited earlier than plants that got HPS lights, thus increasing the early yield. In contrast, the authors did not observe an effect of the light source on yield of cucumbers. However, as in the presented experiment LED lights were used in combination with HPS lights, the effect of only LEDs on earliness might have been overshadowed.
While the temperature in the substrate was the same between the light sources, the leaftemperaturewassignificantlylowerunder“Hybrid”comparedto“HPS”. Särkka et al. (2017) reported that cucumber leaf temperature was lower (4-5°C at the centre parts of leaf blades, 3-4°C at the top of the canopy) with only LED lights (top and interlighting) and there was a lower temperature difference between night and day compared to the other light treatments (HPS top and HPS interlights, HPS top and LED interlights). This resulted in reduced leaf appearance rate, flower initiation rate, increased fruits abortion rate, whereas stem elongation and leaf expansion were increased compared to full HPS (HPS top and HPS interlights) and Hybrid (HPS top and LED interlights) lighting. The lower temperature might have decreased fruit growth of cucumbersintheLED treatment throughreducedcell growthandindirectly through sink strength. Also, Hernández & Kubota (2015) attributed the 28% greater shoot dry mass of cucumber transplants, the 28-32% higher shoot fresh weight and the 9-12% higher leaf number under HPS lights compared to the LED treatments (blue LED, red LED) to the higher canopy air temperature. Indeed, Davis & Burns (2016) reported that in all experiments that compare HPS and LED light there is a need to assess the differences in plant temperature to ensure that any effect of temperature can be seperated from the effects of light on plants responses. The authorsconcludedthat theswitchfrom HPStoLED lightingwouldrequirea periodof learning to develop protocols for correct management of plant irrigation and growth. For example, Kowalczyk et al. (2018) draw the conclusion to increase the density of cucumbers whenprovidingLEDlighting.However,asinthepresentexperiment were LED in combination with HPS lights used and therefore, the influence of only LEDs
[Type here] 47
was overshadowed. In addition, it seems to be not necessary in a Hybrid lighting system to increase the floor temperature or day temperature to compensate for additionalradiationheatoftheHPSlightsasithasbeenrecommendedearlierforthe only use of LEDs. However, this kind of operation was necessary to prevent a harvest delay under only LED lights (Stadler, 2018). Indeed, van Delm et al. (2016) concluded that the regulation of temperature and lighting strategy seems to be importantforplantbalancebetweenearlinessandtotalyield.
While light quality did not affect yield, it had an influence on the appearance of the plant. The weekly growth and with that the total height of the tomato plant and the distance between clusters was significantly increased when plants received HPS lights compared to Hybrid lights. This is in accordance with Stadler (2020) who reported that the distance between tomato clusters and the length of clusters was significantly higher under HPS top lighting. Tomato plants were growing significantly more each week and showed consequently significantly tallest plants compared to LED top lighting. Also, Trouwborst et al. (2010) measured a lower plant length of cucumbers under LEDs. Tomatoes that received LEDs in young plant production were more compact than tomatoes that received HPS lights in young plant production(Stadler,2021a; Stadler,2021b).
With LED lighting LED glasses were needed to distinguish between ripe and not ripe fruits. For strawberries the maintenance of the crop and the harvest were more difficultduetoanothervisionunderLEDlightscomparedtothecommonlyusedHPS lights (Stadler & Hrafnkelsson, 2019). However, this effect was much less pronounced under tomatoes as well as under Hybrid lights compared to only LED lights.
The BRIX content of the tomatoes was not influenced by the light treatment, which was in accordance with Stadler (2021b). Dzakovich et al. (2015) did not reveal any significant differences when analysing the quality of tomatoes in response to supplementallightingwithHPSorLEDlamps.Incontrast,accordingto Philips (2018) werestrawberriessweeter under LEDscomparedtoHPSlightsand Hanenberg etal. (2016) also mentioned that it was possible to increase the taste of strawberries by usingLEDlights. Theuseof HPS lights resulted ina1.600ISK/m2 higher profitmarginthantheuse of Hybrid lights (Fig.39). The yield was reduced by 0,2 kg/m2. When the yield of the
[Type here] 48
Hybrid treatment would have been nearly 3kg/m2 higher, would the profit margin have been comparable to the treatments that received HPS lights. However, the profitmarginwasnegativefor theHybridtreatment. Tobeabletogetapositiveprofit marginwouldayieldincreasebenecessary:Yieldmustreachnearly24kg/m2 .
Dueck et al. (2012b) reported that the production under LEDs was lower than under HPS, but LEDs saved 30% of dehumidification and heat energy and 27% of electricity relative to the crop grown with HPS lights. Särkka et al. (2017) mentioned thattheelectricaluse efficiency(kgyieldJ-1) increasedwhenHPSlight wasreplaced with LEDs in cucumbers. When LED lights and interlights were used the light use efficiency (gfruit FW mol-1 PAR) was highest but resulted in a fewer number of fruits in mid-winter particularly and the lowest yield potential. However, the high capital cost is still an important aspect delaying the LED technology in horticultural lighting. ThehighinvestmentcostsforLEDsareonereasonwhyitismoreeconomictoinvest rather in HPS lights with an electronic ballast and 1000W bulbs instead of 750W bulbs. Singh et al. (2015) showed that the introduction of LEDs allows, despite of high capital investment, reduction of the production cost of vegetables and

[Type here] 49
Fig.39: Profitmargininrelationtoyieldwithdifferentlightsourcesintomato production–calculationscenarios.
ornamental flowers in the long run (several years), due to the LEDs’ high energy efficiency,lowmaintenancecostandlongevity.
So far, limited information is available comparing HPS supplemental lighting with LED supplemental lighting in terms of plant growth and development (Hernández & Kubota, 2015). Reported results are controversial, first because of different plant species and cultivars are used and second due to various experimental conditions (Appolloni et al., 2021). Therefore, it is concluded by different authors (Bantis et al., 2018; Gómez et al., 2013; Hernández & Kubota, 2015; Singh et al., 2015), that more detailed scientific studies are necessary to understand the effect of different spectra using LEDs on plant physiology and to investigate the responses to supplemental lightqualityof economicallyimportant greenhousecrops andvalidatetheappropriate and ideal wavelength combinations for important plant species. Despite of the fact that in a Hybrid system the effect of LEDs is less pronounced compared to the only useofLEDs,evenlessinformationisavailableregardingtheeffectofamixedHPS+ LED top lighting system (Rakutko et al., 2020). Therefore, the above stated conclusionisalsovalidforHybridlighting.
Särkka et al. (2017) concluded that at the current stage of LED technology, the best lighting solution for high latitude winter growing appears to be HPS top lights combined with LED interlights. However, a solution for the near future could be a combination of LED and HPS as top lights, to be able to maintain a suitable temperature, but reduce energy use. This is in accordance with Dueck et al. (2012a) who suggested that a combination of HPS and LEDs as top lighting is the most promisingalternativeforgreenhousegrowntomatoes intheNetherlandswhentaking into consideration different production parameters and costs for lighting and heating.
Rakutko et al. (2020) stated that the use of a Hybrid lighting system is the best available technique as it significantly increased the efficiency of light energy use by cultivated plants leading to shorter pre-fruiting period, higher plant productivity, improved commercial quality of fruits and higher sugar and vitamin content in them.
Verheul et al. (2022) concluded that artificial HPS top lighting is more efficient for tomato production than LED interlighting. This was in accordance with recent experiments (Stadler, 2021b) as well as to the present experiment, where it is recommended to use rather LED lights as top lightings and no LED interlights. However, taking the investment costs into account, HPS top lights (1000W) are
[Type here] 50
rather recommended than a combination of HPS top lights (750W) and LED top lights.
5.2 Yieldindependenceoftheheightofthelightsource
By lowering the HPS lights in the Hybrid lighting treatment from 1,4m distance between lights and plant canopy to 1,0m it was possible to increase the photosynthetic photon flux density from 373µmol/m2/s to 454µmol/m2/s by nearly 100µmol/m2/s.Withthat was thesubstratetemperature significantly increasedand a positive effect on yield was observed: Total yield, total number of fruits and marketable yield increased significantly. The yield increase was related to a higher firstclassyieldduetoasignificantlyhigheraverageweightof thefruits.However,the numberofmarketablefruitswasindependentoftheheightofthelightsource,despite of a tendentially higher number of 1. class fruits when lights were lowered. The marketable yield was increasedbymore than 20% whenHybridlights weremounted more closer to the plants. Indeed, also Verheul et al. (2022) observed a yield increase with a higher light intensity of HPS top lights or a combination of HPS top lightsandLEDinterlights.However,incontrast tothepresentedresults wasthe yield increase related to an increase in the number of harvested fruits, whereas the fruit weightwasmuchlessaffectedbyahigherlightintensity.
Moving the Hybrid lights closer to the plants resulted in a 2.500 ISK/m2 higher profit margin (Fig.40). The yield was increased by 4,2 kg/m2. Therefore, it is highly recommended to move the lights closer to the lamps, as the µmol level increased andthisresultedinanincreaseinyieldandprofitmargin.
[Type here] 51
Fig.40:
tomatoproduction–calculationscenarios.
Marcelis et al. (2006) reported that generally, it can be said that 1% increase of light intensityis resulting ina yieldincrease of 0.7-1.0% for fruit vegetables. These values are in accordance with the present findings: A 1% increase of µmol/m2/s (compare “Hybridhigh” with “Hybrid”) resulted in a yieldincrease of 1%. Inearlier experiments, wherethelightintensity(W/m2)ofHPStoplightswasincreased,werevaluesof0.7% reported(Stadler,2013).

relation to the number of
(Tab.11), the
yield
cluster was not influenced by the
source, but by the
of the
source over the
indicating that withahigherlightlevelalsoahigheryieldcanbegained.
[Type here] 52
Profitmargininrelationtoyieldwithdifferentheightsofthelightsin
When the marketable yield per cluster was set into
harvested clusters
marketable
per
light
height
light
canopy,
Tab.11: Marketableyieldperclusterwithdifferentlighttreatments. Treatment HPS Hybridhigh Hybrid Yield(kg/m2) 21,8 17,8 22,0 Harvestedclusters(no/m2) 26 25 26 Yield(kg/cluster) 0,84 0,71 0,85
BRIX content did not increase, when Hybrid lights were lowered and with that the µmol level increased. Indeed, also Kowalczyk et al. (2018) found that the taste desirability was similarly high for cucumbers irrespectively of HPS top lighting, HPS top lighting + LED interlighting or LED top lighting + LED interlighting. But Verheul et al. (2022) observed that with a higher amount of HPS top lights and LED interlights increased BRIX content in the fruits. This increase was related to an increase in dry mattercontentofthefruits.
It can be expected that a higher µmol level will cause a higher transpiration from the plants.Thepresentedresultsshowahigher humidityintheHybridtreatmentwherea higherµmollevelwasreachedbyloweringthelamps.
As “Hybrid” and“Hybridhigh” usedthe same energy, the energy useefficiencycould be significantly increased by 20% by lowering the lamps and with that increasing the photosynthetic photon fluxdensity.Thiswasinaccordanceto resultsfrom Verheul et al., (2022) where a higher light intensity (242W/m2, HPS top lighting) used less energy per kg tomato produced compared to a lower light intensity (161W/m2, HPS toplighting). Dueck et al. (2012a) compared the effect of toplighting andinterlighting withHPSand/orLEDsontheproductionoftomatoes.Theamountofenergyrequired per kg of harvested tomatoes was highest for the LED treatment and Hybrid system with LED top lighting. In cucumbers, LED interlighting increased light use efficiency, mainly by increasing light reaching the inter canopy, compared with HPS top lights (Hao et al., 2014). Moreover, the response of cucumbers to LED interlighting could be optimized by using proper crop management (e.g. plant density) and ratio of top light / interlight. In contrast, in the presented experiment was the electricity per yield onlydependendontheheightof thelightsanddecreasedwithless distancebetween lights and plant canopy. Also, “Hybrid” transferred the used kWh’s better into yield than“Hybridhigh”.
[Type here] 53
Futurespeculationsconcerningenergyprices
When tomatoes were grown under HPS lights in young plant production, the energy costs were as high as underHybridlights. Incontrast, Stadler (2020) reportedhigher savings with LED top lighting without compromising yield of tomatoes: Using LEDs was associated with about 40% lower daily usage of kWh’s, resulting in lower expenses for the electricity compared to the use of HPS top lights. With the use of LED top lights were energy costs (distribution + sale) per kg yield lowered by 45% compared to the use of HPS lights. However, the investment into LEDs was nearly double the price as for HPS lights. Meaning the higher price of the LEDs compensated their lower use of electricity (Stadler, 2020). In contrast, in the presented experiment where the investment costs into Hybrid lights double the price as the treatment that received only HPS lights. The lower costs in HPS lights were reached by investing in 1000W bulbs instead of 750W bulbs as it was the case in the Hybrid light treatment. With that, a fewer number of lamps was needed to reach thesame light level andwiththat couldinvestment costs belowered. This resultedin total light related costs that were more than 50% higher for “Hybrid” compared to “HPS”.
In terms of the economy of lightingit is also worth to make some future speculations aboutpossibledevelopmentsalsoregardingthefluctuationofthesubsidy.Sofar,the lightingcosts(electricity+ bulbs)arecontributingtoabigpart of the productioncosts of tomatoes. In the past and present, there have been and there are still a lot of discussions (for example in Bændablaðið, 11. tölublað 2022, blað nr. 612) concerningtheenergyprices.Therefore,itisnecessarytohighlightpossiblechanges in the energy prices (Fig.41). So far, the lighting costs are contributing to about 1/3 oftheproductioncosts.
The white columns are representing the profit margin according to Fig.38. Where to be assumed, that growers would get no subsidy from the state for the distribution of the energy, that would result in a profit margin of -10.400 to -14.500 ISK/m2 (black columns, Fig.41). Without the subsidy of the state, probably less Icelandic growers wouldproducetomatoesoverthewintermonths.Whenitisassumedthattheenergy costs, both in distribution and sale, would increase by 25%, but growers would still get the subsidy, then the profit margin would range between -770 to -4.800 ISK/m2 (dotted columns). When it is assumed that growers must pay 25% less for the
[Type here] 54 5.3
energy, the profit margin would increase to -2.400 to 1.700 ISK/m2 (gray columns). From these scenarios, it can be concluded that from the grower’s side it would be preferable to get subsidy to be able to get a higher profit margin and grow tomatoes over the winter. It is obvious that actions must be taken, that growers are also producingduringthewinteratlowsolarirradiation.

Fig.41:
Recommendationsforincreasingprofitmargin
The current economic situation for growing tomatoes necessitate for reducing production costs to be able to heighten profit margin for tomato production. On the other hand, growers need to decide, if tomatoes should be grown during low solar irradiationandmuchuseofelectricity.
It may be expected to get a higher price when consumers would be willing to pay even more for Icelandic fruits than importedones. Growers could also get a higher price for the fruits with direct marketing to consumers (which is of
[Type here] 55
Profitmargininrelationtothelighttreatment–calculationscenarios. 5.4
Itcanbesuggestedthatgrowerscanimprovetheirprofitmarginoftomatoesby: 1. Gettinghigherpriceforthefruits
course difficult for large growers).Theycouldalso trytofind other channels of distribution(e.g.sellingdirectlytotheshopsandnotthroughSFG).
2. Decreaseplantnutritioncosts
Growers can decrease their plant nutrition costs by mixing their own fertilizer. When growers would buy different nutrients separately for a lower price and mix out of this their own composition, they would save fertilizer costs. However, this takes more time, and it is more difficult to perform this task by employees. At low solar irradiation, watering with a scale can save up to 20% of water–andwiththatplant nutritioncosts –withsameyield whencompared to automatic irrigation (Stadler, 2013). It is profitable to adjust the watering to theamountoflastwaterapplication(Yeager etal.,1997).
3. LowerCO2 costs
The costs of CO2 are rather high. Therefore, the question arises, if it is worth to use that much CO2 or if it would be better to use less and get a lower yield but alltogetherhavea possiblehigherprofitmargin. TheCO2 sellingcompany has currently a monopoly position in the market and a competition might be good.
4. Decreasepackingcosts
The costs for packing (machine and material) from SFG and the costs for the rent of the boxes are high. Costs could be decreased by using cheaper packing materials. Also, packing costs could be decreased when growers woulddothepackingonsite.
5. Efficientemployees
The efficiency of each employee needs to be checked regularly and growers will have an advantage to employ faster workers. Growers should also check the user-friendliness of the working place to perform only minimal manual operations. It is often possible to optimize by not letting each employee doing each task, but to distribute tasks among employees by creating a flow line where employees become more specialized and thus achieve better productivity. In total, employees will work more efficiently due to the specialisation.
[Type here] 56
6. Decreaseenergycosts
Growers should decrease artificial light intensity at increased solar irradiation because this would possibly result in no lower yield (Stadler et al.,2010).
Growers need to make sure that they are using the right RARIK tariff and the cheapest energy sales company tariff. Unfortunately, it is not so easy, tosay,whichistherighttariff,becauseitisgrowerdependent.
Growersshouldcheckiftheyareusingthepowertariffinthebestpossible way to be able to get a lowered peak during winter nights and summer (max. power -30%). It is important to use not so much energy at the most expensivetimebuthaveahighuseduringcheaptimes.
Growers can save up to 8% of total energy costs by dividing the winter lighting over all day. That means growers should not let all lamps be turned on at the same time. This would be practicable, when they are growing in different independent greenhouses. Of course, this is not so easy to implement, when greenhouses are connected but can also be solved there by having different switches for the lamps to be able to turn onepartof thelamps offatagiventime.Then, plantsin onecompartment of the greenhouse would be lightened only during the night. When yield would be not more than 2% lower with lighting at nights compared to the usual lighting time, dividing the winter lighting over all day would pay off. However, a tomato experiment showed that the yield decreased by about 15% when tomatoes got from the beginning of November to the end of February light during nights and weekends (Stadler, 2012). This resulted in a profit margin that was about 18% lower compared to the traditional lightingsystemandtherefore,normallightingtimesarerecommended.
Also, growers could decrease the energy costs by about 6% when they would lighten according to 100J/cm2/cluster and 100J/cm2 for plant maintenance (Stadler, 2012). This would mean that especially at the early stage after transplanting, plants would get less hour’s light. Also at high natural light, lamps would be turned off. In doing so, compared to the
[Type here] 57
Lowerpricesfordistributionandsaleofenergy(whichisnotrealistic)
traditional lighting system, profit margin could be increased by about 10% (assumingsimilaryield).
For large growers, that are using a minimum of 2GWh it could be recommended to change to “stórnotendataxti” in RARIK and save up to 35%ofdistributioncosts.
It is expected that growers are cleaning their lamps to make it possible, that all the lights are used effectively and that they are replacing their bulbsbeforetheexpensiveseasonisstarting.
Aikman (1989) suggests using partially reflecting material to redistribute theincidentlightbyinterceptingmaterialtoredistributetheincidentlightby intercepting direct light before it reaches those leaves facing the sun, and to reflect some light back to shaded foliage to give more uniform leaf irradiance.
By moving lights closer to the plants the µmol level is increasing. This is positivelyinfluencingyieldandwiththatprofitmargin.
Byreplacing750W bulbsby1000W bulbslesslightsarenecessary.With that the investment costs of lights can be reduced and a positive effect on profitmarginwasreached.
The use of a high light level is required for getting a high yield and with thatapositiveprofitmargin.
[Type here] 58
CONCLUSIONS
The development of tomato plants was affected by the height of the lights over the plant canopy. When Hybrid lights were placed more further away from the plant, the photosynthetic photon flux density was naturally lowered, and the tomato harvest wasdelayedandalowermarketableyieldwasreached.Incontrast,theyieldwasnot affectedbythelightsource,HPSorHybrid.
The high capital costs into LEDs have been one important aspect delaying the LED technologyinhorticulturallightingas wellas lackof knowledge on thislight source to different plant species. This has been one of the reasons why a replacement of the HPS lamps by LEDs has not been recommended. As the combined light treatment (“Hybrid”) resulted in a lower profit margin than “HPS”, the results are not justifying replacing part of the HPS top lights by LED toplights as energy costs could also not be lowered. Therefore, from the economic side it can be recommended to rather invest in HPS lights with 1000W bulbs instead of 750W bulbs to reduce investment costsandplacethelampsonemeterovertheplantcanopytobeabletoget ahigher photosynthetic photon flux density and have a positive influence on yield and profit margin. Growers should pay attention to possible reduction in their production costs fortomatoesotherthanenergycosts.
[Type here] 59 6
REFERENCES
AIKMAN DP, 1989: Potential increase in photosynthetic efficiency from the redistributionofsolarradiationinacrop.J.Exp.Bot.40,855-864.
APPOLLONI E, ORSINI F, PENNISI G, DURANY XG, PAUCEK I, GIANQUINTO G, 2021: Supplemental LED lighting effectively enhances the yield and quality of greenhouse truss tomato production: Results of a mata-analysis. Frontiers in PlantScience12,596927.
BANTIS F, SMIRNAKOU S, OUZOUNIS T, KOUKOUNARAS A, NTAGKAS N, RADOGLOU K, 2018: Current status and recent achievements in the field of horticulture with the use of light-emitting diodes (LEDs). Sci. Hortic 235, 437-451.
BROWN CS, SCHUERGER AC, SAGER JC, 1995: Growth and photomorphogenesis of pepper plants under red light-emitting diodes with supplementalblueorfar-redlighting.J.Amer.Soc.Hort.Sci.120,808-813.
BULA RJ, MORROW EC, TIBBITTS TW, BARTA DJ,IGNATIUS RW &MARTIN TS, 1991: Light-emitting diodes as a radiation source for plants. HortScience 26, 203-205.
DAVIS PA, BURNS C,2016: Photobiologyin protectedhorticulture. Foot andEnergy Security5(4),223-238.
DE RUITER, without year: Completo https://www.deruiterseeds.com/enuk/products.html/tomato/completovisited29.04.2020.
DEMERS DA, DORAIS M,WIEN CH, GOSSELIN A, 1998a: Effects of supplemental light duration on greenhouse tomato (Lycopersicon esculentum Mill.) plants andfruityields.Sci.Hortic.74,295-306.
DEMERSDA,GOSSELINA,WIENHC,1998b:Effectsofsupplementallightduration on greenhouse sweet pepper plants and fruit yields. J. Amer. Hort. Sci. 123, 202-207.
DUECK TA, JANSE J, LI T, KEMPKES F, EVELEENS B, 2012a: Influence of diffuse glassonthegrowthandproductionoftomato.ActaHortic.956,75-82.
[Type here] 60 7
DUECK TA, JANSE J, EVELEENS BA, KEMPKES FLK, MARCELIS LFM, 2012b: Growth of tomatoes under hybrid LED and HPS lighting. Acta Hortic. 952, 335-342.
DYSKO J, KANISZEWSKI S, 2021: Effects of LED and HPS lighting on the growth, seedling morphology and yield of greenhouse tomatoes and cucumbers. HorticulturalScience48,22-29.
DZAKOVICH MP, GOMEZ C, MITCHELL CA, 2015: Tomatoes grown with lightemitting diodes or high-pressure sodium supplemental light have similar fruitqualityattributes.HortScience,50(10),1498-1502.
GÓMEZ C, MORROW RC, BOURGET CM, MASSA G, MITCHELL CA, 2013: Comparison of intracanopy light-emitting diode towers and overhead highpressure sodium lamps for supplemental lighting of greenhouse-grown tomatoes.HortTechnology23(1),93-98.
GRODZINSKI B, SCHMIDT JM, WATTS B, TAYLOR J, BATES S, DIXON MA, STAINES H, 1999: Regulating plant/insect interactions using CO2 enrichment inmodelecosystems.Adv.SpaceRes.24,281-291.
HANENBERG MAA, JANSE J, VERKERKE W, 2016: LED light to improve strawberryflavour,qualityandproduction.ActaHortic.1137,207-212.
HAO X, PAPADOPOULOS AP, 1999: Effects of supplemental lighting and cover materials on growth, photosynthesis, biomass partitioning, early yield and qualityofgreenhousecucumber.Sci.Hortic.80,1-18.
HERNÁNDEZ R, KUBOTA C, 2015: Physiological, morphological, and energy-use efficiency comparisons of LED and HPS supplemental lighting for cucumber transplantproduction.HortScience50(3),351-357.
HEUVELINK E, BAKKER MJ, ELINGS A, KAARSEMAKER R, MARCELIS LFM, 2005:Effectofleafareaontomatoyield.ActaHort.691,43-50.
HOENECKE ME, BULA RJ, TIBBITTS TW, 1992: Importance of “blue” photon levels for lettuce seedlings grown under red-light-emitting diodes. HortScience 27, 427-430.
[Type here] 61
HOVI-PEKKANEN T, TAHVONEN R, 2008: Effects of interlighting on yield and external fruit quality in year-round cultivated cucumber. Sci. Hortic. 116, 152161.
KOWALCZYK K, GAJC-WOLSKA J, BUJALSKI D, MIRGOS M, NIEDZINSKA M, MAZUR K, ZOLNIERCZYK P, SZATKOWSKI D, CICHON M, LECZYCKA N, 2018: The effect of supplemental assimilation lighting with HPS and LED lamps on thecucumberyieldingandfruit qualityinautumncrop. ActaSci.Pol. HortorumCultus,17(4),193-200.DOI:10.24326/asphc.2018.4.17.
KRIZEK DT, MIRECKI RM, BRITZ SJ, HARRIS WG, THIMIJAN RW, 1998: Spectral properties of microwave sulfur lamps in comparison to sunlight and high pressuresodium/metalhalidelamps.Biotronics27,69-80.
MARCELIS LFM, BROEKHUIJSEN AGM, MEINEN E, NIJS EHFM, RAAPHORST MGM, 2006: Quantification of the growth response to light quality of greenhousegrowncrops.ActaHort.711,97-104.
PHILIPS, 2015: The ideal replacement for the incandescent lamp. http://www.lighting.philips.com/b-dam/b2b-li/en_AA/Experience/cases/Brookberries/PHIL_143918_CaseStudy_Brookberries_UK.pdfvisited:01.02.2017.
PHILIPS, 2017: Higher yields of better quality tomatoes. http://images.philips.com/is/content/Philips Consumer/PDFDownloads/Global/ Case-studies/CSLI20170119_001-UPD-en_AA-PHIL_164209_CaseStudy_ MartinSigg.pdfvisited:01.02.2017.
PHILIPS, 2018: Strawberries ahead of the rest. http://www.lighting.philips.com/main/cases/cases/horticulture/welroy-fruit. visited:11.09.2018.
PINHO P, HYTÖNEN T, RANTANEN M, ELOMAA P, HALONEN L, 2013: Dynamic control of supplemental lighting intensity in a greenhouse environment. LightingRes.Technol.45,295-304.
RAKUTKO S, AVOTINS A, GRUDULS J, RAKUTKO E, 2020: Hybride irradiation as best available practice in artificial plant lighting. Engineering for rural development,1076-1081.
[Type here] 62
RODRIGUEZ BP, LAMBETH VN, 1975: Artificial lighting and spacing as photosynthetic and yield factors in winter greenhouse tomato culture. J. Amer. Soc.Hort.Sci.100,694-697.
SÄRKKA L, JOKINEN K, OTTOSEN CO, KAUKORANTA T, 2017: Effects of HPS andLEDlightingoncucumberleafphotosynthesislightqualitypenetrationand temperature in the canopy, plant morphology and yield. Agricultural and Food Science26,102-110.
SCHUERGER AC, BROWN CS, STRYJEWSKI EC, 1997: Anatomical features of pepper plants (Capsicum annum L.) grown under red light-emitting diodes supplementedwithblueorfar-redlight.Ann.Bot.79,273-282.
SINGHD,BASUC,MEINHARDT-WOLLWEBERM,ROTHB,2015:LEDsforenergy efficientgreenhouselighting.RenewableandSustainableEnergyReviews49, 139-147.
STADLER C, 2010: Effects of plant density, interlighting, light intensity and light quality on growth, yield and quality of greenhouse sweet pepper. Final report, RitLbhÍnr.30.
STADLER C, 2012: Effects of lighting time and light intensity on growth, yield and qualityofgreenhousetomato.Finalreport,RitLbhÍnr.40.
STADLER C, 2013: Áhrif ljósstyrks, rótarbeðsefnis, vökvunar og umhirðu á vöxt, uppskeruoggæðigróðurhúsatómata.Finalreport,RitLbhÍnr.43.
STADLER C, 2015: Áhrif LED lýsingar á vöxt, uppskeru og gæði gróðurhúsasalats aðvetri.Finalreport,RitLbhÍnr.61.
STADLER C, 2018: Áhrif LED lýsingar á vöxt, uppskeru og gæði gróðurhúsajarðarberjaaðvetri.Finalreport,RitLbhÍnr.103.
STADLERC,2019:ÁhrifLEDlýsingarogviðeigandihitastillingarávöxt,uppskeruog gæðigróðurhúsajarðarberjaaðvetri.Finalreport,RitLbhÍnr.117.
STADLER C, 2020: Áhrif LED topplýsingar og LED millilýsingar á vöxt, uppskeru og gæðigróðurhúsatómata.Finalreport,RitLbhÍnr.125.
STADLER C, 2021a: Áhrif LED topplýsingar á forræktun tómata, agúrku og papriku. Finalreport,RitLbhÍnr.135.
[Type here] 63
STADLER, C., 2021b: Áhrif ljósmeðferðar í forræktun og lýsingarmeðferð í áframhaldandiræktunávöxt,uppskeruoggæðigróðurhúsatómata. Final report, RitLbhÍnr.143.
STADLER C, HELGADÓTTIR Á, ÁGÚSTSSON, M, RIIHIMÄKI MA, 2010: How does light intensity, placement of lights and stem density affect yield of wintergrown sweetpepper?Fræðaþinglandbúnaðarins,227-232.
STADLER C, HRAFNKELSSON BH Bl, 2019: Vinnuskilyrði undir LED-ljósum. Bændablaðið532,41.
TAMULAITIS G, DUCHOVSKIS P, BLIZNIKAS Z, BREIVE K, ULINSKAITE R, BRAZAITYTE A, NOVICKOVAS A, ZUKAUSKAS A, 2005: High-power lightemitting diode based facility for plant cultivation. J. Phys. D: Appl. Phys. 38, 3182-3187.
TROUWBORST G, OOSTERKAMP J, HOGEWONING SW, HARBINSON J, VAN IEPEREN W, 2010: The responses of light interception, photosynthesis and fruit yield of cucumber to LED-lighting within the canopy. Physiol. Plant 138, 289-300.
VAN DELM T, MELIS P, STOFFELS K, VANDERBRUGGEN R, BAETS W, 2016: Advancing the strawberry season in Belgian glasshouses with supplemental assimilationlighting.ActaHortic.1134,147-154.
VERHEUL MJ, MAESSEN HFR, PAPONIV M, PANOSYAN An, KECHASOV D, NASEER M, PAPONOV IA, 2022: Artificial top-light is more efficient for tomato productionthaninter-light.ScientiaHorticulturae291,110537.
YEAGER TH, GILLIAM CH, BILDERBACK TE, FARE DC, NIEMIERA AX, TILT KM, 1997:Bestmanagementpracticesguideforproducingcontainer-grownplants. SouthernNurs.Assoc.,Marietta,GA.
[Type here] 64
HPS Hybridhigh Hybrid
tasks observations tasks observations tasks observations
20°C/20°C(day/night),ventilation24°C,underheat35°C, 800ppmCO2 (600ppmCO2 withventilation),humidity 75%(06-18,humification 1:30min,0,5-0,3minin between)300mlH2O/plant perday(wateringfrom 05-18,100mlwateringwith 3hinbetween)
transplanting,lightfrom3-19, 20°C/20°C(day/night),ventilation24°C,underheat35°C, 800ppmCO2 (600ppmCO2 withventilation),humidity 75%(06-18,humification 1:30min,0,5-0,3minin between)300mlH2O/plant perday(wateringfrom 05-18,100mlwateringwith 3hinbetween)
transplanting,lightfrom3-19, 20°C/20°C(day/night),ventilation24°C,underheat35°C, 800ppmCO2 (600ppmCO2 withventilation),humidity 75%(06-18,humification 1:30min,0,5-0,3minin between)300mlH2O/plant perday(wateringfrom 05-18,100mlwateringwith 3hinbetween)
[Type here] 17 8 APPENDIX
Date
09.11 transplanting,lightfrom3-19,
10.11 11.11 12.11 13.11 handpollination firstflowers open handpollination firstflowers open handpollination firstflowers open 14.11 handpollination handpollination handpollination 15.11 weeklymeasurement, measuredleaf+soil temperature,handpollination weeklymeasurements, measuredleaf+soil temperature,handpollination weeklymeasurements, measuredleaf+soil temperature,handpollination 16.11 17.11 18.11 19.11 20.11 21.11 22.11 weeklymeasurements, measuredleaf+soil temperature weeklymeasurements, measuredleaf+soil temperature weeklymeasurements, measuredleaf+soil temperature 23.11 wateringfor2min,interval 1h wateringfor2min,interval 1h wateringfor2min,interval 1h 24.11 65
HPS Hybridhigh Hybrid Date tasks observations tasks observations tasks observations
26.11 27.11 28.11 29.11
weeklymeasurements, measuredleaf+soil temperature
weeklymeasurements, measuredleaf+soil temperature
weeklymeasurements, measuredleaf+soil temperature 30.11 deleafed2leavesfromthe bottom deleafed2leavesfromthe bottom deleafed2leavesfromthe bottom
02.12 03.12 04.12 05.12
weeklymeasurements, measuredleaf+soil temperature,deleafed2 leavesfromthebottom, removedleafbehindthe cluster
floortemperature50°C, wateringfor2min,intervall 1h
weeklymeasurements, measuredleaf+soil temperature,deleafed2 leavesfromthebottom, removedleafbehindthe cluster
floortemperature50°C, wateringfor2min,intervall 2h
weeklymeasurements, measuredleaf+soil temperature,deleafed2 leavesfromthebottom, removedleafbehindthe cluster
floortemperature50°C, wateringfor2min,intervall 2h
09.12
weeklymeasurements, measuredleaf+soil temperature
weeklymeasurements, measuredleaf+soil temperature
weeklymeasurements, measuredleaf+soil temperature
[Type here] 18
25.11
01.12
06.12
07.12
08.12
10.12 11.12 12.12 13.12
14.12 15.12 16.12 17.12 66
HPS Hybridhigh Hybrid
Date tasks observations tasks observations tasks observations
18.12 19.12
20.12
weeklymeasurements, measuredleaf+soil temperature
weeklymeasurements, measuredleaf+soil temperature
weeklymeasurements, measuredleaf+soil temperature
21.12 handpollination handpollination handpollination
22.12 deleafed2leavesfromthe bottom
23.12 removedleafbehindthe cluster,handpollination
fertilizermixture tankwasnot working(50% lesswatered) deleafed2leavesfromthe bottom
wateringpump didnotwork(no watering):plant topsareflabby removedleafbehindthe cluster,handpollination
24.12 handpollination,wateringfor 6min,intervall1h handpollination,wateringfor 6min,intervall1h
fertilizermixture tankwasnot working(50% lesswatered) deleafed2leavesfromthe bottom
wateringpump didnotwork(no watering):plant topsareless flabbythanin “HPS” removedleafbehindthe cluster,handpollination
handpollination,wateringfor 6min,intervall1h
25.12 fertilizermixturechanged, handpollination fertilizermixturechanged, handpollination fertilizermixturechanged, handpollination 26.12 handpollination handpollination handpollination
fertilizermixture tankwasnot working(50% lesswatered)
wateringpump didnotwork(no watering):plant topsareless flabbythanin “HPS”
27.12
weeklymeasurements, measuredleaf+soil temperature,handpollination, wateringfor6min,intervall 2h
little development duetotheevent on23.12
weeklymeasurements, measuredleaf+soil temperature,handpollination, wateringfor6min,intervall 2h
theeventonthe 23.12seemsto haveno negativeeffect onthegrowth
weeklymeasurements, measuredleaf+soil temperature,handpollination, wateringfor6min,intervall 2h
theeventonthe 23.12seemsto haveno negativeeffect onthegrowth
28.12
deleafed2leavesfromthe bottom,handpollination, wateringfor6min,intervall 1,5h
deleafed2leavesfromthe bottom,handpollination, wateringfor6min,intervall
1,5h
wateringpump didnotwork wateringpump didnotwork
deleafed2leavesfromthe bottom,handpollination, wateringfor6min,intervall 1,5h
deleafed1leaffromthe middle deleafed1leaffromthe middle deleafed1leaffromthe middle
handpollination handpollination handpollination
wateringpump didnotwork
[Type here] 19
29.12
30.12
31.12
67
HPS Hybridhigh
Hybrid
Date tasks observations tasks observations tasks observations
01.01
02.01 handpollination handpollination handpollination
03.01
weeklymeasurements, measuredleaf+soil temperature,handpollination
04.01 deleafed2leavesfromthe bottom
05.01 handpollination, En-Stripputout
06.01 deleafed1leaffromthe middle
weeklymeasurements, measuredleaf+soil temperature,handpollination
weeklymeasurements, measuredleaf+soil temperature,handpollination
deleafed2leavesfromthe bottom deleafed2leavesfromthe bottom
handpollination, En-Stripputout handpollination, En-Stripputout
deleafed1leaffromthe middle deleafed1leaffromthe middle
07.01 handpollination,night temperature16-17°C(-2°C) handpollination,night temperature16-17°C(-2°C) handpollination,night temperature16-17°C(-2°C)
08.01 handpollination handpollination handpollination
09.01 10.01
1.harvest,weeklymeasurements,measuredleaf+soil temperature,45°Cheating pipes,handpollination
weeklymeasurements, measuredleaf+soil temperature,45°Cheating pipes,handpollination
1.harvest,weeklymeasurements,measuredleaf+soil temperature,45°Cheating pipes,handpollination
11.01 deleafed2leavesfromthe bottom deleafed2leavesfromthe bottom deleafed2leavesfromthe bottom
12.01 handpollination,wateringfor 6min,intervall1,3h
handpollination,wateringfor 6min,intervall1,3h
handpollination,wateringfor 6min,intervall1,3h
13.01 handpollination,deleafed 1leaffromthebottom handpollination,deleafed 1leaffromthebottom handpollination,deleafed 1leaffromthebottom
14.01 handpollination handpollination handpollination
15.01 16.01
17.01
harvest,weeklymeasurements,measuredleaf+soil temperature
harvest,weeklymeasurements,measuredleaf+soil temperature
moreadditional growththanin „HPS“
harvest,weeklymeasurements,measuredleaf+soil temperature
18.01 En-Stripputout, handpollination En-Stripputout, handpollination En-Stripputout, handpollination
19.01 handpollination handpollination handpollination
moreadditional growththanin „HPS“
[Type here] 20
68
HPS Hybridhigh Hybrid
Date tasks observations tasks observations tasks observations
20.01 handpollination,removedleaf behindthecluster handpollination,removedleaf behindthecluster, handpollination,removedleaf behindthecluster, 21.01 handpollination handpollination handpollination 22.01 23.01 24.01
harvest,BRIX,weekly measurements,measured leaf+soiltemperature, handpollination
25.01 deleafed2leavesfromthe bottom,handpollination
harvest,BRIX,weekly measurements,measured leaf+soiltemperature, handpollination
deleafed2leavesfromthe bottom,handpollination
harvest,BRIX,weekly measurements,measured leaf+soiltemperature, handpollination
deleafed2leavesfromthe bottom,handpollination
26.01 harvest,handpollination harvest,handpollination harvest,handpollination
27.01 handpollination,removedleaf behindthecluster handpollination,removedleaf behindthecluster handpollination,removedleaf behindthecluster 28.01 29.01 30.01 31.01
harvest,weeklymeasurements,measuredleaf+soil temperature
harvest,weeklymeasurements,measuredleaf+soil temperature
harvest,weeklymeasurements,measuredleaf+soil temperature
01.02 handpollination handpollination handpollination 02.02 harvest harvest harvest 03.02 removedleafbehindthe cluster removedleafbehindthe cluster removedleafbehindthe cluster 04.02 05.02 06.02 07.02 wateringfor7min,intervall 1,3h
wateringfor7min,intervall 1,3h
08.02
harvest,weeklymeasurements,measuredleaf+soil temperature
09.02 harvest,deleafed2leaves fromthebottom
harvest,weeklymeasurements,measuredleaf+soil temperature
wateringfor7min,intervall 1,3h
harvest,weeklymeasurements,measuredleaf+soil temperature
harvest,deleafed2leaves fromthebottom harvest,deleafed2leaves fromthebottom
[Type here] 21
10.02 69
HPS Hybridhigh Hybrid
Date tasks observations tasks observations tasks observations
11.02 deleafed1leaffromthe bottom deleafed1leaffromthe bottom deleafed1leaffromthe bottom
13.02
15.02 harvest,deleafed2leaves fromthebottom
harvest,deleafed2leaves fromthebottom
harvest,deleafed2leaves fromthebottom
deleafed1leaffromthe bottom deleafed1leaffromthe bottom deleafed1leaffromthe bottom
20.02
harvest,weekly measurements,measured leaf+soiltemperature
harvest,weekly measurements,measured leaf+soiltemperature
harvest,weekly measurements,measured leaf+soiltemperature
harvest,deleafed2leaves fromthebottom harvest,deleafed2leaves fromthebottom harvest,deleafed2leaves fromthebottom
55°Cheatingpipes, additionalwatering(0,5h beforelightisturnedonand at23)
55°Cheatingpipes, additionalwatering(0,5h beforelightisturnedonand at23)
26.02 27.02 28.02
harvest,weekly measurements,measured leaf+soiltemperature
harvest,weekly measurements,measured leaf+soiltemperature
55°Cheatingpipes, additionalwatering(0,5h beforelightisturnedonand at23)
harvest,weekly measurements,measured leaf+soiltemperature
deleafed2leavesfromthe bottom deleafed2leavesfromthe bottom deleafed2leavesfromthe bottom
deleafed1leaffromthe bottom deleafed1leaffromthe bottom deleafed1leaffromthe bottom
[Type here] 22
12.02
14.02
16.02 17.02 18.02
19.02
21.02
22.02 23.02
24.02
25.02
01.03
02.03
03.03 04.03
70
HPS Hybridhigh Hybrid
Date tasks observations tasks observations tasks observations
05.03
06.03
07.03
harvest,weeklymeasurements,measuredleaf+soil temperature,deleafed2 leavesfromthebottom,wateringfor6min,intervall2h
08.03 wateringfor7min,intervall 1,5h
harvest,weeklymeasurements,measuredleaf+soil temperature,deleafed2 leavesfromthebottom,wateringfor6min,intervall2h
harvest,weeklymeasurements,measuredleaf+soil temperature,deleafed2 leavesfromthebottom,wateringfor6min,intervall2h
wateringfor7min,intervall 1,5h wateringfor7min,intervall 1,5h
09.03 harvest harvest harvest
10.03 deleafed1leaffromthe bottom deleafed1leaffromthe bottom deleafed1leaffromthe bottom
11.03 12.03 13.03 14.03 harvest,wateringfor6min, intervall1,5h
15.03
weeklymeasurements, measuredleaf+soil temperature
harvest,wateringfor6min, intervall1,5h
weeklymeasurements, measuredleaf+soil temperature
harvest,wateringfor6min, intervall1,5h
weeklymeasurements, measuredleaf+soil temperature
16.03 finalharvest finalharvest finalharvest
[Type here] 23
71

