
Áburðargjöf í lífrænni ræktun á Íslandi“


FINAL REPORT
ChristinaStadler
I
LbhÍ nr. 48 „
2014
lífrænni ræktun
REPORT
RitLbhÍnr.48 ISSN1670-5785 „Áburðargjöf í
á Íslandi“ FINAL
ChristinaStadler LandbúnaðarháskóliÍslands Júlí2014
Finalreportoftheresearchproject
„ÁburðargjöfílífrænniræktunáÍslandi“
Duration: 01/05/2012 – 31/12/2013
Project leader: Landbúnaðarháskóla Íslands
Reykjum
Dr. Christina Stadler
810 Hveragerði
Email: christina@lbhi.is
Tel.: 433 5312 (Reykir), 433 5249 (Keldnaholt)
Mobile: 843 5312
Collaborators: Þórður G. Halldórsson, Akur Ingólfur Guðnasson, Engi
Valdimar Ingi Guðmundsson, Sólheimar
Guðfinnur Jakobsson, Skaftholt Svanhvít Konráðsdóttir, Skjóli skyggnis
Project sponsor: Samband Garðyrkjubænda
Bændahöllinni við Hagatorg 107 Reykjavík
Table of contents
INTRODUCTION
MATERIALSANDMETHODS
RESULTS
I
List of figures III List of tables IV Abbreviations V 1 SUMMARY 1 YFIRLIT 2 2
4 3
5 3.1 Fertilisers 5 3.2 Soils 6 3.3 Potexperiment 7 3.4 Basilexperiment 7 3.5 Greenhouseexperimentwithtomatoesandsweetpepper 8 3.6 Statisticalanalyses 10 4
11 4.1 Potexperiment 11 4.1.1 Drymatteryield 11 4.1.2 Nutilisation 12 4.1.3 Relationshipof Nutilisationandfertilisercharacteristics 14 4.1.4 Effectofsoil 17 4.2 Basilexperiment 18 4.2.1 Germination 18 4.2.2 Height 19 4.2.3 Freshyield 20 4.2.4 Dryyield 21 4.2.5 ApparentNutilisation 22
Greenhouseexperiment
4.3.1
Outerqualityofyield
Interiorqualityofyield
4.3.5.1 Sugar content
4.3.5.2 Nitrogen content of fruits
Soilnitratecontent
DISCUSSION
CONCLUSIONS
REFERENCES
II 4.3
23
Marketableyield 23 4.3.2
27 4.3.3
27
27
29 4.3.4
30 5
32 5.1 Effectoffertiliser 32 5.2 Effectofsoil 34 5.3 Fertiliserapplicationstrategies 36 5.4 Economics 37 6
38 7
38
Listoffigures
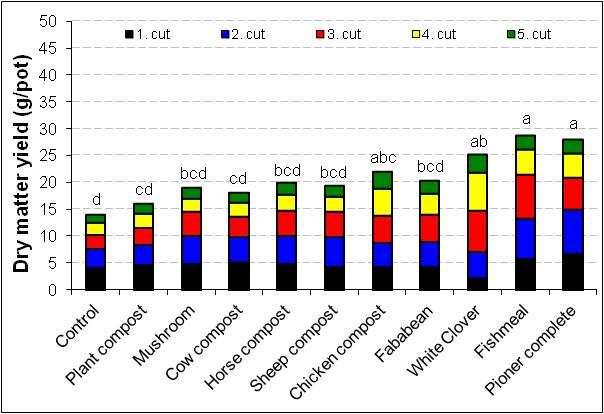
Fig. 1: Dry matter yield of ryegrass after application of organic fertilisers to “soil lower Corg”. Ryegrass was grown 131 d at 60% maximum water holding capacity and shoots were harvested five times.
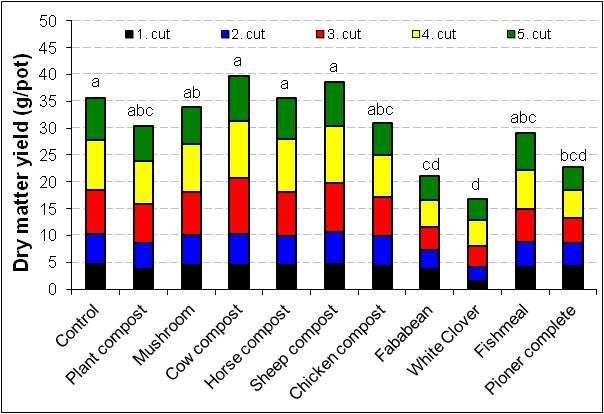
Fig. 2: Dry matter yield of ryegrass after application of organic fertilisers to “soil higher Corg”. Ryegrass was grown 131 d at 60% maximum water holding capacity and shoots were harvested five times.
Fig. 3: Apparent N utilisation of organic fertilisers by perennial ryegrass during the pot experiment with “soil lower Corg”. Ryegrass was grown 131 d at 60% maximum water holding capacity, and shoots were harvested five times.
Fig. 4: Apparent N utilisation of organic fertilisers by perennial ryegrass during the pot experiment with “soil higher Corg”. Ryegrass was grown 131 d at 60% maximum water holding capacity, and shoots were harvested five times.
Fig. 5: Relationship between apparent N utilisation of perennial ryegrass and N content of organic fertilisers with “soil lower Corg”. Apparent N utilisation was calculated based on the cumulative N uptake (five cuts) during 131 d of growth. 15
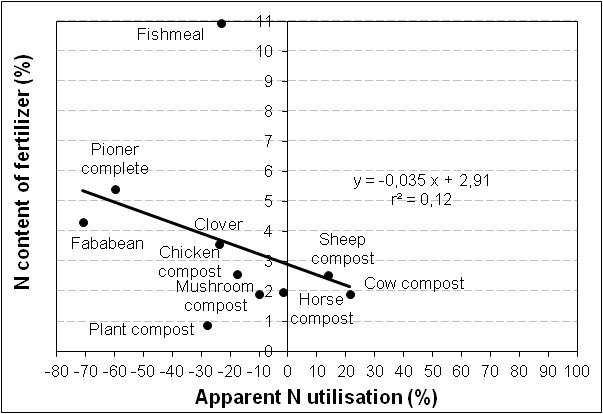
Fig. 6: Relationship between apparent N utilisation of perennial ryegrass and N content of organic fertilisers with “soil higher Corg”.
Apparent N utilisation was calculated based on the cumulative N uptake (five cuts) during 131 d of growth. 15
Fig. 7: Relationship between apparent N utilisation of perennial ryegrass and C : N ratio of organic fertilisers with “soil lower Corg”.
Apparent N utilisation was calculated based on the cumulative N uptake (five cuts) during 131 d of growth.
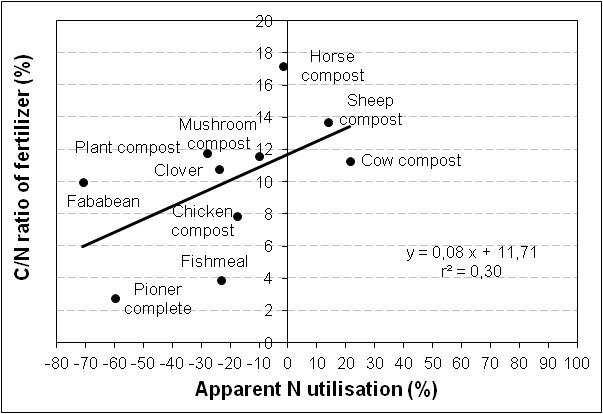
Fig. 8: Relationship between apparent N utilisation of perennial ryegrass and C : N ratio of organic fertilisers with “soil higher Corg”.
Apparent N utilisation was calculated based on the cumulative N uptake (five cuts) during 131 d of growth.
Fig. 9: Dry matter yield of ryegrass after application of organic fertilisers to different soils (a: 1,5% Nt, 21,4% Corg content, b: 0,6% Nt, 6,8% Corg content, c: 1,0% Nt, 12,8% Corg content. Ryegrass was grown 221 d at 60% maximum water holding capacity and shoots were harvested eight times.
Fig. 10: Germination of basil after application of organic fertilisers.
Fig. 11: Height of basil after application of organic fertilisers.
Fig. 12: Development of fresh weight of basil until marketable size after application of organic fertilisers.
Fig. 13: Development of dry weight of basil until marketable size after application of organic fertilisers.
III
11
12
13
14
16
17
18
19
20
21
22
Fig. 14: Apparent N utilisation of organic fertilisers by basil and weeds. Basil was grown 39 d until marketable size. 23
Fig. 15: Time course of accumulated marketable yield of tomatoes (1. and 2. class fruits) during seven months of growth period after application of organic fertilisers. 24
Fig. 16: Time course of accumulated marketable yield of sweet pepper (1. class fruits) during seven months of growth period after application of organic fertilisers. 25
Fig. 17: Average fruit weight of tomatoes at different fertiliser treatments. 26
Fig. 18: Average fruit weight of sweet pepper at different fertiliser treatments. 26
Fig. 19: Sugar content of tomatoes at different fertiliser treatments. 28
Fig. 20: Sugar content of sweet pepper at different fertiliser treatments. 28
Fig. 21: N content of tomato fruits at different fertiliser treatments. 29
Fig. 22: N content of red sweet pepper fruits at different fertiliser treatments. 29
Fig. 23: Soil nitrate content in tomatoes after the split application of different organic fertilisers in the glasshouse. Fertiliser was applied within a 30 cm wide fertiliserband and thereafter all treatments were hand hoed 5-10 cm deep. 31
Fig. 24: Soil nitrate content in sweet pepper after the split application of different organic fertilisers in the glasshouse. Fertiliser was applied within a 30 cm wide fertiliserband and thereafter all treatments were hand hoed 5-10 cm deep. 31
Listoftables
Tab. 1: N, C, P and K content and C : N ratio of the tested organic fertilisers.
Tab. 2: Characteristics of the glasshouse soils used.
Tab. 3: Cumulative total number of marketable tomatoes and sweet pepper at different fertiliser treatments.
Tab. 4: Proportion of marketable and unmarketable tomato yield at different fertiliser treatments.
Tab. 5: Proportion of marketable and unmarketable sweet pepper yield at different fertiliser treatments.
Tab. 6: Costs of organic fertilisers.
IV
6
6
25
27
27
37
Abbreviations
C carbon
CAL calcium acetate lactate
C : N carbon : nitrogen ratio
Corg organic carbon
CaCl2 calcium chloride
DM dry matter yield
HPS high-pressure vapour sodium lamps
HSD honestly significant difference
K potassium N nitrogen
Nt total nitrogen NO3 -N nitrate-nitrogen
OM organic matter p ≤ 0,05 5% probability level
P phosphor pH potential of hydrogen r2 coefficient of determination
W Watt
Other abbreviations are explained in the text.
V
SUMMARY
In the past, organic vegetable crops in Iceland were fertilised mainly with mushroom compost (1,9% N). However, due to the contamination with conventional chicken manure this fertiliser is to be replaced. Thus, substitutes are urgently needed. Plant compost (0,9% N), composted animal residues (1,9-2,6% N), clover (3,56% N), residues from the fish industry (10,9% N), grain legumes (4,3% N) and commercial organic fertilisers (216 mg N/l) have been tested in a pot experiment with perennial ryegrass (Lolium perenne L.). Fertilisers (800 mg N) were mixed into different greenhouse soils and dry matter yield was observed and plant N utilisation over the time investigated. A selection of the above mentioned organic fertilisers was tested in a basil (variety ‘Genoveser’) experiment and in a greenhouse experiment with sweet pepper (variety ‘Ferrari’) and tomatoes (variety ‘Encore’). Plants were grown with a plant distance in the row of 49,25 / 48,25 cm (tomatoes / sweet pepper), 2,5 / 3,3 plants/m² (tomatoes / sweet pepper with 2 tops/plant) and 200 kg N/ha fertiliser was applied in a split application within a fertiliser band of 30 cm during a growth period of seven months. The yield of tomatoes and sweet pepper was measured and soil samples regularly taken and analysed for nitrate-N.
A fertiliser application resulted in comparison to the unfertilised control in a higher DM yield. The yield increase was higher with fertilisers with a high N content. The composted animal residues were comparable to mushroom compost. The time course of the apparent N utilisation of ryegrass differed strongly depending on the organic fertiliser used. The cumulative fertiliser-N uptake of ryegrass was highest for Pioner complete 6-1-3®, fishmeal and clover. A medium apparent N utilisation of ryegrass (40-50%) was achieved for chicken compost and fababean. The cumulative fertiliser-N uptake was lowest for plant, sheep, cow and horse compost as well as for the reference fertiliser mushroom compost. Different soils also had an influence on the N mineralisation of organic fertilisers, but to a lesser extent than the fertiliser itself.
Basil seeds did only germinate in the unfertilised control, with mushroom compost and with composted cow manure. The N utilisation was low and comparable to the results from the pot experiment.
Due to the high soil N supply of the soil in the greenhouse did the fertiliser treatments show no significant differences in tomato and sweet pepper yield and even not to the
1 1
unfertilised control. In general was the yield level low. The reason for that was a relatively low natural solar irradiation during the whole growth period compared to other years. A fertiliser application markedly affected the nitrate content in the soil.
Also, hand hoeing generally increased the soil nitrate content and should therefore be part of an optimised fertiliser management strategy.
When just observing the price for one kg of N, mushroom compost seems to be a cheap fertiliser. However, when also the N utilisation is considered, both fishmeal and Pioner complete 6-1-3® are even cheaper than mushroom compost. Taking more years into account would probably result in similar values for all fertilisers as mushroom compost is not only mineralising N in the year of application.
The prohibition of mushroom compost should not really effect the organic vegetable growers as there are at least equal (composted animal manures) or even better fertilisers (e.g. fishmeal) with a similar price range on the market.
YFIRLIT
Fram til þessa hafa grænmetisbændur í lífrænni ræktun einkum notað sveppamassa (1,9% N) til áburðargjafar. En nú hefur verið bannað að nota sveppamassa í lífrænni ræktun vegna þess að hann inniheldur hænsnaskít úr hefðbundinni hænsnarækt. Það er því brýn þörf á því að finna aðra áburðargjafa sem uppfylla næringarþörf plantna og má jafnframt nota í lífrænni ræktun.
Sett var upp pottatilraunin með plöntumoltu (0,9% N), moltu úr búfjáráburði (1,9-2,6% N), smára (3,56% N), leifum frá fiskiðnaði (fiskimjöl, 10,9% N), möluðu fræi af hestabaunum (4,3% N) og innfluttum verksmiðjuframleiddum áburði (216 mg N/l). Áburðinum (800 mg N) var blandað í mismunandi gróðurhúsajarðveg, rýgresi (Lolium perenne L.) sáð og þurrefnisuppskera og niturupptaka mæld yfir ákveðið tímabil. Úrval af ofangreindum lífrænum áburðum var prófað í basilrækt (yrki 'Genovese') og í gróðurhúsatilraun með papriku (yrki 'Ferrari') og tómötum (yrki 'Encore'). Plöntur voru ræktaðar með 49,25 / 48,25 cm (tómatar / paprika) bili milli plantna í röðinni og 2,5 / 3,3 plöntur / m² (tómatar / paprika með 2 toppar / plöntu). Borið var á 30 cm breitt svæði, alls 200 kg N / ha skipt í fernt (4 × 50) yfir vaxtatímabilið, sem var sjö mánuðir. Uppskera af tómötum og papriku var mæld og jarðvegssýni tekin reglulega og nítrat-N mælt.
2
Áburðarnotkun skilaði meiri uppskeru borið saman við uppskeru án áburðar. Aukið N innihald jók uppskeru. Molta úr búfjáráburði gaf sambærilega uppskeru og sveppamassinn. Upptaka niturs í rýgresinu var breytileg eftir tegund áburðar. Pioner complete 6-1-3®, fiskimjöl og smári mældist með mesta upptöku niturs af öllum áburðartegundum. Í hænsnamoltu og hestabaunum var niturupptaka í meðallagi (40-50%). Minnst var upptakan við búfjáráburð, plöntumoltu og sveppamassa. Mismunandi jarðvegur hafði því áhrif á niturupptöku, en í minna mæli en áburðurinn sjálfur.
Fræ af basil spíraði aðeins í pottum án áburðar, með sveppamassa og með áburði frá kúm. Upptaka niturs var lág og sambærileg við niðurstöður úr rýgresistilraun.
Vegna mikils N framboðs í jarðvegi úr gróðurhúsi var ekki marktækur munur milli áburðarliða í tómata og papriku uppskeru og jafnvel ekki í samanburði við liðinn án áburður. Almennt var uppskeran lág. Ástæðan þess var mun minni náttúruleg sólarinngeislun á öllu vaxtartímabilinu samanborið við önnur ár. Áburður hafði veruleg áhrif á nítrat í jarðvegi. Það jók nítrat í jarðveginum að hræra í efsta laginu nokkrum sinnum (t.d. við áburðurgjöf) yfir vaxtatímabilið og ætti því að vera hluti af betri áburðurstjórnun.
Þegar einungis er verið að skoða verð fyrir eitt kg af N, virðist sveppamassi vera ódýr áburður. Hins vegar, þegar athuguð er N nýting, eru bæði fiskimjöl og Pioner complete 6-1-3® jafnvel ódýrari en sveppamassi. Að taka fleiri ár í reikninginn myndi líklega leiða í ljós svipað verð fyrir allar áburðartegundirnar, því að sveppamassi gefur ekki aðeins nítrat á áburðargjafarárinu.
Bann við notkun sveppamassa ætti í raun ekki hafa áhrif á lífræna ræktun grænmetis þar sem til staðar er að minnsta kosti jafn góður áburður (molta úr búfjáráburði) eða jafnvel betri áburður (t.d. fiskimjöl) á svipuðu verði á markaði.
3
INTRODUCTION
Vegetable crops, both grown in the greenhouse and outdoor, have a high nitrogen requirement. Therefore, N fertilisers used for organic vegetable production should ensure high N turnover, fast N availability, and continuous N supply. In the past, organic vegetable crops in Iceland were fertilised mainly with mushroom compost. However, due to the organic regulation (Council Regulation (EC) No 834/2007 of 28 June 2007 on organic production and labelling of organic products and repealing Regulation (EEC) No 2092/91) the use of mushroom compost is forbidden due to contamination with conventional chicken manure. Organic chicken husbandry is missing in Iceland and therefore also the possibility for replacement. Thus, substitutes are urgently needed. This study is a response to the imminent need of the Icelandic organic vegetable growers to find a suitable substitute for the mushroom compost they have been using till now.
Potential fertilisers for organic vegetable production are on the one hand animal residues, e.g. horse and sheep manure from organic production or from conventional production after composting and residues from the fish industry (fishmeal). Also, imported industrially processed animal residues e.g. Nugro (liquid fertiliser based on fishmeal) are getting more popular, but are not in line with the general principle of organic horticulture to feed the plants through the soil. On the other hand crop residues, legumes (milled seeds of grain legumes (pea, fababean, lupin), cuttings of e.g. clover mixed into soil or undersowing of clover) and commercial organic fertilisers are popular in other countries. However, traditional compost is mainly used as soil conditioner as its N mineralisation is low and slow.
All these types of fertilisers are implying a different fertiliser composition. In numerous studies, N mineralisation and frequently N content of crop residues (e.g. Trinsoutrot et al., 2000) and plant-derived and industrially processed organic N fertilisers (Stadler et al., 2006) were strongly correlated. Therefore, possible fertilisers for organic horticulture in Iceland should require a high N content.
So far, studies on organic fertilisers on the yield of vegetable crops are rare in Iceland and mainly based on fertiliser application with mushroom compost (Gunnlaugsson, 1995 and 1997) and mushroom compost in comparison to fishmeal (Gunnlaugsson & Guðfinnsson, 2004) or a mixture of fishmeal and seaweed was compared to Nugro (Stadler et al., 2010). To achieve a synchrony between N release
4 2
of fertilisers and N demand by the growing crop, time of application is important. Earlier studies have shown that a splitted application of fertiliser amount could be promising to synchronise N availability with growth (Stadler, 2006).
The objectives of this study are to test (1) whether N release of animal and crop residues, legumes and commercial organic fertilisers can be predicted by their N content, (2) whether this relation is subject to modification by different soils, (3) their effect on yield of organic vegetable grown indoor and (4) to develop advisory material for organic growers in Iceland.
3
MATERIALSANDMETHODS
3.1 Fertilisers
Composted plant and animal residues (manure from cow, sheep, horse, chicken) from organic production, residues from the fish industry (fishmeal), crop residues (cuttings of white clover), milled seeds of grain legumes (fababean, Vicia faba L.), the imported industrially processed plant residue Pioner complete 6-1-3® (liquid fertiliser based on sugar beets and sugar cane), and mushroom compost as one of the most commonly used fertilisers in organic vegetable production in Iceland were investigated in both pot experiments and greenhouse experiments with short and long growing crops. The selected fertilisers obtain a wide range in N and C content and C : N ratio (Tab. 1): The N content was low for plant compost (0,9% N), mushroom compost and composted animal residues (1,9-2,6% N), whereas the N content was much higher for fishmeal (10,9% N). The C content of the investigated organic fertilisers did vary much. The C : N ratio resulted in much lower values for fishmeal and Pioner complete 6-1-3® than for the composted animal fertilisers and legumes. The P content was in relation to the N content very low for clover (N : P ratio: 21) and to a lesser extent also for fababeans (N : P ratio: 7,4) and composted cow manure (N : P ratio: 6), but relatively high for plant compost (N : P ratio: 2,2). For the other fertilisers the N : P ratio was between 3-5. The N : K ratio was varying for all fertilisers between 1-2. However, this value was with nearly 9 much higher for fishmeal and also high with about 3,5 for fababeans and clover.
Residues with a small particle size showed a stronger and longer N immobilisation and subsequently lower N mineralisation than did those with a large size (Jensen, 1994; Corbeels et al., 2003). Therefore, to minimise particle size effects so as to
5
better compare the investigated fertilisers, fababeans were coarsely milled and the composted plant and animal residues were sieved to pass through a 5.0 mm screen.
Table 1: N, C, P and K content and C : N ratio of the tested organic fertilisers.
Fertiliser N content (%) (mg/l)
C content (%) (mg/l)
: N ratio P (%) (mg/l)
K (%) (mg/l)
Mushroom compost (reference) 1,91 22,2 11,6 0,44 1,04
Plant compost 0,89 10,5 11,8 0,40 0,46
Cow compost 1,92 21,7 11,3 0,58 0,89
Horse compost 1,98 34,0 17,2 0,54 1,91
Sheep compost 2,53 34,6 13,7 0,42 2,68
Chicken compost 2,57 20,3 7,9 0,80 1,26
Cuttings of white clover 3,56 38,5 10,8 0,17 1,05
Coarse meal of fababean 4,29 42,7 10,0 0,58 1,24
Fishmeal 10,94 42,7 3,9 2,25 1,24
Pioner complete 6-1-3® 216 * 609 * 2,8 50 150
3.2 Soils
Three glasshouse soils (the soils for the greenhouse experiment are only counted once), each differing in the amount of organic matter (OM) and Nt as well as supply of P and K, were selected for this investigation (Tab. 2). The glasshouse soils (0-20 cm, ≤ 5 mm) were obtained from organic vegetable growers.
Table 2: Characteristics of the glasshouse soils used.
Soil name Corg Nt C : N pH
CAL K CAL (–––––– % ––––––) (mg / 100 g dry soil)
Pot experiment
soil higher Corg 12,8 1,0 13,0 6,5 287 49
soil lower Corg 6,8 0,6 10,7 6,4 27 18
Greenhouse experiment
soil tomatoes 21,4 1,5 14,3 6,4 321 33 soil sweet pepper 21,7 1,4 15,6 6,3 309 27
6
*
* C
*
*
CaCl2 P
3.3 Pot experiment
Two soils (Tab. 2) were tested in a pot experiment using five-liter pots. Eight hundred milligrams of fertiliser N (Tab. 1), equivalent to 255 kg N/ha, were mixed into the upper half of the soil in the pots in three replicates. A treatment without fertiliser was also included as a control. Perennial ryegrass seeds (Lolium perenne, L. cv. Birger; 1.5 g) were sown two weeks after the addition of the fertiliser. The pots were covered with plastic until the germination of the ryegrass and were regularly watered to achieve 60% maximum water holding capacity.
During 131 days of cultivation, ryegrass was cut five times to 1,5 cm stubble height. Ryegrass was oven-dried for 24 h at 105 °C to determine the dry matter yield (DM). Samples were milled and their N content was analysed according to the DUMAS method (varioMax CN, Macro Elementar Analyser, ELEMENTAR ANALYSENSYSTEME GmbH, Hanau, Germany) to be able to determine N uptake from ryegrass. The apparent N utilisation with the model plant perennial ryegrass was calculated over the time as the additional N uptake of ryegrass compared to the control divided by the added fertiliser N. Residual soil mineral N after final harvest was not included.
3.4 Basil experiment
Organic fertilisers (fishmeal, Pioner complete 6-1-3®, chicken compost, cow compost) were compared to mushroom compost in a spring culture of basil (Ocimum basilicum L. cv. Genoveser). A treatment without added fertiliser was included as control treatment. Each treatment was repeated three times in a randomised block design with 35 pots per treatment. 10 cm pots were filled with 2.165 g of press-pot substrate “Natural Peat” (Kekkilä Oy, Vantaa, Finland) mixed with 1.000 mg N / pot of organic fertilisers according to recommendations of experiments with basil in Germany and experience in Iceland. 20 seeds per pot were sown on 21.03.2013 and pots were watered and covered with white plastic film with tiny holes (needle-size, 10.000 holes per m2). The plastic film was removed after germination (about 12 days after sowing). The first week after removing of the film the pots were watered with hose and after that watered as needed from below and water tapped from tables after 2-3 hours.
Basil was grown under high-pressure sodium lamps (HPS) for top lighting with about 120 W/m2 for 18 hours. Temperature was kept at 22 °C / 17 °C (day / night) and ventilation started at 24 °C. Plant protection was managed by beneficial organisms.
7
Basil was harvested once in between (15.04.2013) before final harvest (29.04.2013). At both harvests the number of germinated seeds of six pots was counted and the height and the fresh weight measured. Basil was oven-dried for 24 h at 105 °C to determine DM. Samples were milled and their N content was analysed according to the DUMAS method (varioMax CN, Macro Elementar Analyser, ELEMENTAR ANALY SEN-SYSTEME GmbH, Hanau, Germany) to be able to determine N uptake from basil.
3.4 Greenhouse experiment with tomatoes and sweet pepper
Tomatoes (Lycopersicum esculentum MILL. cv. Encore) and sweet pepper (Capsicum annuum cv. Ferrari) were grown in glasshouses at Sólheimar. The soil (soil tomatoes, soil sweet pepper) was high in OM and well supplied with nutrients as indicated in Table 2.
Previous to the tomato crop sweet pepper was grown. Sweet pepper received about 355 g N / m2 (1,6 kg compost per m2, 2,2 kg fishmeal per m2, 0,8 kg seaweed meal per m2, 0,8 l Bröste high fruit per m2 and 0,9 l Bröste 6-1-3 per m2). Previous to the paprika crop tomatoes were grown in 2012. Tomatoes received about 425 g N / m2 (2,5 kg compost per m2, 2,8 kg fishmeal per m2, 1 kg seaweed meal per m2, 0,6 l Bröste high fruit per m2 and 0,9 l Bröste 6-1-3 per m2).
Tomatoes and sweet pepper (with two tops per plant) were transplanted in double rows per plot with 49,25 cm / 48,25 cm plant to plant (tomatoes / sweet pepper), 50 / 55 cm interrow distance (tomato / sweet pepper) and 75 cm distance between the double rows, 2,5 / 3,3 plants/m2 (tomatoes / sweet pepper) on April 9, 2013 / April 17, 2013 (tomatoes / sweet pepper). Tomatoes were grown until October 28, 2013 and sweet pepper until November 25, 2013. The experimental layout was a randomised block design with three replicates. Plant protection was managed by using beneficial organisms. Bumblebees were used for pollination and hives were open approximately from 09.00-15.30. Weed was regularly removed by hand. Air temperature in the glasshouse was for tomatoes 21 °C from 09.30-18.00, 15 °C from 18.00-21.00 and 17 °C from 21.00-9.30 and for sweet pepper 18 °C from 21.0001.00, 19,5 °C from 01.00-06.00 and 24 °C from 06.0 0-21.00. Sweet pepper was grown under high-pressure sodium lamps (HPS) for top lighting over the canopy. Light (120 W/m2) was provided in July for 12 hours (04.00-18.00) and in August until end of the experiment for 16 hours (06.00-22.00). Drip irrigation (two tubes for each
8
row, 10 cm dripping distance). Approximately 1,5 / 1,2 l (tomatoes / sweet pepper) per plant was applied daily (tomatoes: 0,75 l at 06.00, 0,50 l at 11.00 and 0,25 l at 15.00 and 1,0 l was added at sunny days; sweet pepper: 1,0 l at 9.00, 0,2 l at 14.00 and 1,0 l was added at sunny days and water sprayed on the leaves on hot days).
After planting an amount of 20 g N/m2 was applied during seven months of growing period in a splitted application of each 5 g N/m2 in about 40 days intervals as either fishmeal, Pioner complete 6-1-3®, composted cow manure or the reference fertiliser mushroom compost (Tab. 1) within a fertiliser-band of 25-30 cm. Also, undersowing with white clover was done in one treatment. An unfertilised treatment (control) was included to monitor N mineralisation from soil. At each N application all treatments including the control were hand hoed 5-10 cm deep. During the growth period red tomatoes and mostly red sweet pepper (green sweet pepper was harvested only very seldom) were regularly collected in the subplots from eight / ten plants (tomatoes / sweet pepper) about once each week. Total fresh yield, number of fruits, fruit category (for tomatoes: A-class (> 55 mm), B-class (45-55 mm) and not marketable fruits (among others too little fruits (< 45 mm)) and for sweet pepper: 1st class (> 100 g) and not marketable fruits (among others too little fruits (< 100 g), fruits with blossom end rot) was determined. During the growth period the interior quality of fruits was determined twice. A brix meter (Pocket Refractometer PAL-1, ATAGO, Tokyo, Japan) was used to measure sugar content. From these harvests, the fresh biomass weight was determined and samples were dried at 105 °C for 24 h for DM. Dry samples were milled and N content was analysed according to the DUMAS method (varioMax CN, Macro Elementar Analyser, ELEMENTAR ANALYSENSYSTEME GmbH, Hanau, Germany).
Composite soil samples for analysis of nitrate-N were taken from 6 cores from 0-15 cm depth within the fertiliser-band before planting of tomatoes and at regular intervals during the growth period (at fertiliser application and 10, 20, 40 days after each fertiliser application). After sampling, soil samples were kept frozen. Gravimetric soil water content was determined and the soil was extracted with 0.01 M CaCl2 (1:2 soil:extractant). After filtration (filter paper no. 2, WHATMAN) soil extracts were subsequently frozen. Nitrate was measured by FIAlab 3500b SIA analyser (FIALAB Instruments Inc., 14450 NE 29th Place, Suite 113, Bellevue, WA 98007, USA).
9
3.5
Statisticalanalyses
SAS Version 9.2 was used for statistical evaluations. The results were subjected to one-way analyses of variance with the significance of the means tested with a Tukey/Kramer HSD-test at p ≤ 0,05. Regression and correlation analyses were calculated using the SAS procedure “proc reg” and “proc corr”.
10
RESULTS
4.1 Potexperiment
The pot experiment was conducted to determine the availability of organic-fertiliser N to ryegrass. Both an influence of the fertiliser and of the soil was observed.
4.1.1 Dry matter yield
A fertiliser application to the soil with lower Nt and Corg content resulted in comparison to the unfertilised control in a higher DM yield. The yield increase was higher with fertilisers with a high N content. Highest DM yields were achieved with Pioner complete 6-1-3® and fishmeal. The composted animal residues were comparable to mushroom compost (Fig. 1), whereas plant compost reached just a slightly higher yield than the control.
Fig. 1: Dry matter yield of ryegrass after application of organic fertilisers to “soil lower Corg”. Ryegrass was grown 131 d at 60% maximum water holding capacity and shoots were harvested five times. Letters indicate significant differences at the end of the experiment (LSD, p≤0,05).
11 4
In contrast, the soil with the higher Nt and Corg content acted differently: There was no yield increase observed after fertiliser application. The unfertilised control had a similar yield level as the composted animal fertilisers. However, when fertilisers with a high N content were applied, yield decreased partly much compared to the control (Fig. 2).
Fig. 2: Dry matter yield of ryegrass after application of organic fertilisers to “soil higher Corg”. Ryegrass was grown 131 d at 60% maximum water holding capacity and shoots were harvested five times. Letters indicate significant differences at the end of the experiment (LSD, p≤0,05).
4.1.2 N utilisation
The time course of the apparent N utilisation of ryegrass differed strongly depending on the organic fertiliser used (Fig. 3). For the soil with the lower Nt and Corg content most of the N was already released until the second cut (about 50% of the total N uptake) except for clover, chicken compost and fababean. Thereafter, the increase in the apparent N utilisation was markedly lower. Pioner complete 6-1-3® had during the whole experiment the highest N uptake of all the fertilisers. The cumulative fertiliser N uptake of ryegrass was also high from fishmeal and clover. However, at the beginning of the experiment fertiliser N was immobilised in the clover treatment, but
12
after that apparent N utilisation increased rapidly. A medium apparent N utilisation of ryegrass (40-50%) was achieved for chicken compost and fababean, but seems to be not fully completed at the end of the experiment. The cumulative fertiliser N uptake was lowest for plant, sheep, cow and horse compost as well as for the reference fertiliser mushroom compost.
Fig. 3: Apparent N utilisation of organic fertilisers by perennial ryegrass during the pot experiment with “soil lower Corg”. Ryegrass was grown 131 d at 60% maximum water holding capacity, and shoots were harvested five times.
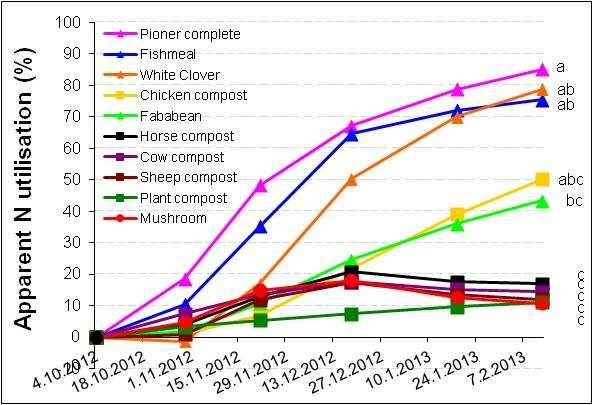
Letters indicate significant differences at the end of the experiment (LSD, p≤0,05).
However, in contrast to the soil low in Nt and Corg content did the soil higher in Nt and Corg content show an immobilisation of N with nearly all fertilisers. With longer growing period of the ryegrass was this immobilisation even getting stronger. The immobilisation was highest for fertilisers with a high N content. At the end of the growth period amounted immobilisation values for Pioner complete 6-1-3® and fababean 60-70%. An N immobilisation of 10-30% had plant compost, white clover, fishmeal, chicken compost and mushroom compost and horse compost immobilised only slightly. In contrast, after about 10 weeks of growth was the immobilised N in the treatments with composted sheep and cow manure mineralised and an N utilisation
13
of 15-20% was reached for these fertilisers at the end of the growth period. This amount was comparable to the soil with the lower Nt and Corg content.
Fig. 4: Apparent N utilisation of organic fertilisers by perennial ryegrass during the pot experiment with “soil higher Corg”. Ryegrass was grown 131 d at 60% maximum water holding capacity, and shoots were harvested five times.
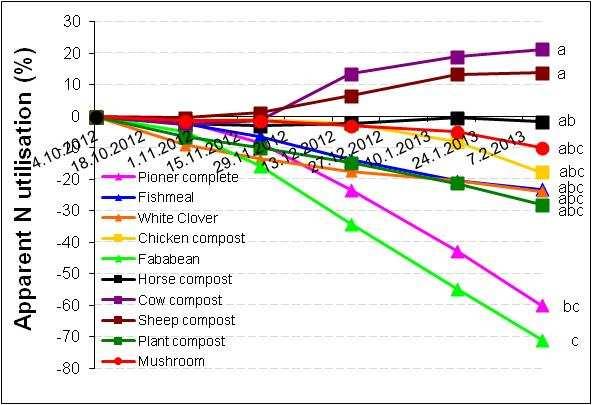
Letters indicate significant differences at the end of the experiment (LSD, p≤0,05).
4.1.3 Relationship of N utilisation and fertiliser characteristics
As a general rule, it can be said that fertilisers with a higher N content showed a higher apparent N utilisation of ryegrass. However, this relationship was only very weak and not fitting for all fertilisers (Fig. 5, Fig. 6), suggesting that other factors than the N content must also be responsible for a low, medium or high apparent N utilisation.
14
Fig. 5: Relationship between apparent N utilisation of perennial ryegrass and N content of organic fertilisers with “soil lower Corg”. Apparent N utilisation was calculated based on the cumulative N uptake (five cuts) during 131 d of growth.
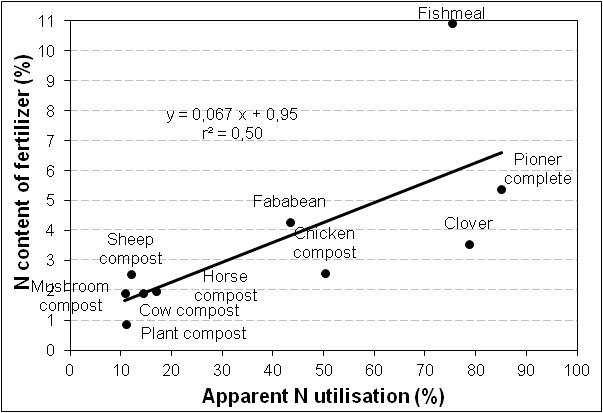
Fig. 6: Relationship between apparent N utilisation of perennial ryegrass and N content of organic fertilisers with “soil higher Corg”. Apparent N utilisation was calculated based on the cumulative N uptake (five cuts) during 131 d of growth.
15
The C : N ratio explained the relationship slightly better than the N content, even though the relationship was still weak (r2=0,61 and r2=0,30). Generally it can be said that for the soil lower in Nt and Corg fertilisers with a high C : N ratio like composted animal manure showed a low apparent N utilisation, whereas fertilisers with a low C : N ratio, e.g. fishmeal and Pioner complete 6-1-3®, are rapidly available for plants and resulting in a high apparent N utilisation. However, also here, some exceptions can be found like clover that had a medium C : N ratio, but the apparent N utilisation was high (Fig. 7).
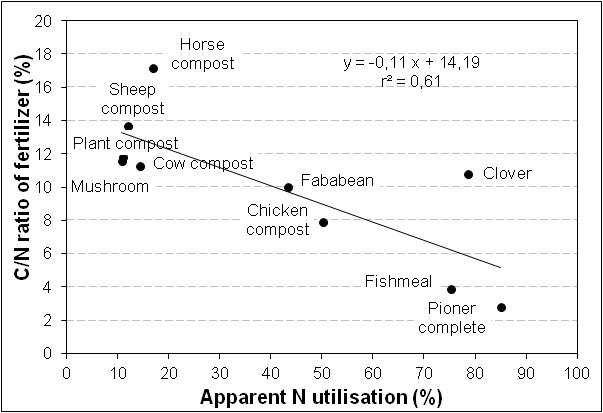
Fig. 7: Relationship between apparent N utilisation of perennial ryegrass and C : N ratio of organic fertilisers with “soil lower Corg”. Apparent N utilisation was calculated based on the cumulative N uptake (five cuts) during 131 d of growth.
In contrast with the soil higher in Nt and Corg did fertilisers with a high C : N ratio (most composted animal manures) showed a higher N utilisation than fertilisers with a low C : N ratio (e.g. Pioner complete 6-1-3®). However, also here the relationship was very low (Fig. 8).
16
Fig. 8: Relationship between apparent N utilisation of perennial ryegrass and C : N ratio of organic fertilisers with “soil higher Corg”. Apparent N utilisation was calculated based on the cumulative N uptake (five cuts) during 131 d of growth.
4.1.4 Effect of soil
To better observe the effect of soil, the reference fertiliser mushroom compost and fishmeal and an unfertilised control was tested on three soils and the dry matter yield was measured. Again, a fertiliser effect and also a soil effect was observed. One soil (Fig. 9 c) showed during the first cuts a higher yield when no fertiliser was applied compared to the application of fishmeal. However, after the 5th cut the positive effect of fishmeal developed. At the end of the growing period was in all soils with the highest N content fertiliser (fishmeal) a significantly higher yield measured compared to mushroom compost. The latter fertiliser gave no (Fig. 9 b) or only a slightly higher yield compared to the control (Fig. 9 a), but a quite large difference to the control in soil c (Fig. 9 c).
17
Fig. 9: Dry matter yield of ryegrass after application of organic fertilisers to different soils (a: 1,5% Nt, 21,4% Corg content, b: 0,6% Nt, 6,8% Corg content, c: 1,0% Nt, 12,8% Corg content. Ryegrass was grown 221 d at 60% maximum water holding capacity and shoots were harvested eight times.


Letters indicate significant differences at the end of the experiment (LSD, p≤0,05).
4.2 Basilexperiment
The pot experiment was conducted to determine the availability of selected organicfertiliser N to basil.
4.2.1 Germination
Basil germinated when it was not fertilised (control) or when fertiliser was applied in the form of composted cow manure and mushroom compost. A fertiliser application of fishmeal, Pioner complete 6-1-3® and composted chicken manure resulted in only few germinated seeds that died, however.
Germination of seeds in the successful three treatments was about 90% (Fig. 10). At the end of the growth period no significant differences in germination were detected between the different treatments.
18
a b c
Fig. 10: Germination of basil after application of organic fertilisers. Letters indicate significant differences (LSD, p≤0,05).
4.2.2 Height
Three and a half month after sowing was no difference between treatments in the height of basil measured. However, at the end of the growth period was basil significantly higher when fertilised with mushroom compost compared to the control, whereas no significant differences were found to composted cow manure (Fig. 11).

19
Fig. 11: Height of basil after application of organic fertilisers. Letters indicate significant differences (LSD, p≤0,05).
4.2.3 Fresh yield
Treatments did not differ in fresh weight of basil at first harvest, when only the yield of basil was considered. However, when also the yield of the weeds was included, fresh weight was significantly higher with composted cow manure. Yield increased in all treatments markedly from first harvest to second harvest. When only the yield of basil was included, a significantly higher yield was measured with mushroom compost. However, when also the yield of weeds was included, a significantly higher yield was reached with mushroom compost and composted chicken manure compared to the unfertilised control (Fig. 12).

20
Fig. 12: Development of fresh weight of basil until marketable size after application of organic fertilisers. Letters indicate significant differences (LSD, p≤0,05).
4.2.4 Dry yield
Dry weight of basil was not different between treatments at first harvest and also not when the dry matter yield of the weeds was included. Dry matter yield increased in all treatments markedly from first harvest to second harvest. When only yield of basil was included, a significantly higher yield was measured with mushroom compost than with composted cow manure. However, when also the yield of weeds was included, increased the dry weight significantly with mushroom compost and composted chicken manure compared to the unfertilised control (Fig. 13).

21
Fig. 13: Development of dry weight of basil until marketable size after application of organic fertilisers. Letters indicate significant differences (LSD, p≤0,05).
4.2.5 Apparent N utilisation
Apparent N utilisation of organic fertilisers was low and no significant differences between fertiliser treatments were calculated at the end of the growth period (Fig. 14).

22
Fig. 14: Apparent N utilisation of organic fertilisers by basil and weeds. Basil was grown 39 d until marketable size. Letters indicate significant differences at the end of the experiment (LSD, p≤0,05).
4.3 Greenhouseexperiment
4.3.1 Marketable yield

The yield of tomatoes included all harvested red fruits at the end of the growth period. The fruits were classified in 1. class (> 55 mm), 2. class (45-55 mm) and not marketable fruits (too little fruits (< 45 mm), fruits with blossom end rot, flawed, cracked and not well shaped fruits). The yield of sweet pepper included all harvested red and green fruits. The fruits were classified in 1st class fruits (> 100 g/fruit) and not marketable fruits (fruits with too little weight (< 100 g), fruits with blossom end rot, fruits with damage from lighting, not well shaped fruits).
At the beginning of the growth period had all treatments a comparable yield. But, after two months of harvest of tomatoes and one month of harvest of sweet pepper, it seems that yield differences between treatments did increase. However, at the end of the harvest period was the yield level of marketable fruits low and the yield differences within the fertilised treatments not significant. Yield obtained with the
23
tested organic fertilisers was comparable to mushroom compost for both tomatoes and sweet pepper (Fig. 15, Fig. 16). Even yield in the unfertilised control was high (compared to the fertilised treatments) and with no statistically significances to the fertilised treatments, indicating a high soil N supply. The yield of sweet pepper with undersowing of clover was tendentially decreased, whereas this effect was not observed with tomatoes. It has to be mentioned, that due to a problem with aphids in sweet pepper the plants stayed for a long time very small, while the clover was developing well. In contrast, in tomatoes no pest problem was observed and the tomato plants were growing fast and suppressing the growth of the clover.

Fig. 15: Time course of accumulated marketable yield of tomatoes (1. and 2. class fruits) during seven months of growth period after application of organic fertilisers.
Letters indicate significant differences at the end of the experiment (LSD, p≤0.05).
24
Fig. 16: Time course of accumulated marketable yield of sweet pepper (1. class fruits) during seven months of growth period after application of organic fertilisers.

Letters indicate significant differences at the end of the experiment (LSD, p≤0.05).
Number of marketable fruits was not different between the fertiliser treatments (Tab. 3).
Tab. 3: Cumulative total number of marketable tomatoes and sweet pepper at different fertiliser treatments.
Number of marketable fruits
Treatment
1. class tomatoes 2. class tomatoes 1. class sweet pepper
Control 43 a 43 a 20 a Mushroom compost 46 a 46 a 18 a Cow manure 41 a 41 a 21 a Clover 44 a 44 a 16 a Fishmeal 47 a 47 a 19 a Pioner complete 6-1-3® 42 a 42 a 19 a
Letters indicate significant differences at the end of the harvest period (HSD, p ≤ 0,05).
25
Average fruit size of first class tomatoes was varying between 80-110 g / fruit (Fig. 17) and for sweet pepper between 160-280 g / fruit (Fig. 18). For tomatoes there seems to be no difference between the fertiliser treatments, while for sweet pepper the treatment “clover” and “cow manure” seems to be with a lower average sweet pepper weight and Pioner complete 6-1-3® with a higher fruit weight.
Fig. 17: Average fruit weight of tomatoes at different fertiliser treatments.

Fig. 18: Average fruit weight of sweet pepper at different fertiliser treatments.

26
4.3.2 Outer quality of yield
Marketable yield was more than 80% for tomatoes (Tab. 4) and around 90% for sweet pepper (Tab. 5). Unmarketable fruits were mainly because of too small tomato fruits and not well shaped sweet pepper fruits.
Tab. 4: Proportion of marketable and unmarketable tomato yield at different fertiliser treatments.
Marketable yield (%) Unmarketable yield (%)
Treatment
1. class
little weight flawed Control
Mushroom compost
Cow compost
Clover
Fishmeal
Pioner complete 6-1-3
Tab. 5: Proportion of marketable and unmarketable sweet pepper yield at different fertiliser treatments.
Treatment Marketable yield (%) Unmarketable yield (%)
1. class (> 100 g) too little weight stilrot damage from lighting not well shaped Control
Mushroom compost
Cow compost
Fishmeal
Pioner complete 6-1-3
4.3.3 Interior quality of yield
4.3.3.1 Sugar content
Sugar content of tomatoes and sweet pepper was measured two times during the harvest period and varied between 3,7 and 4,5 °BRIX for tomatoes (Fig. 19) and between 6,3 and 7,4 °BRIX for sweet pepper (Fig. 20). Sugar content of tomatoes and sweet pepper increased with longer harvest period except for the treatment “control” and “Pioner complete 6-1-3®” for tomatoes.
27
2. class too
32 51 17 0
34 48 17 1
30 54 15 1
34 50 15 1
33 52 14 1
® 32 49 18 1
92 0 1 0 7
92 2 1 1 4
88 2 1 0 9 Clover 89 2 0 4 5
95 2 0 0 3
® 93 2 0 0 5
Fig. 19: Sugar content of tomatoes at different fertiliser treatments.
Fig. 20: Sugar content of sweet pepper at different fertiliser treatments.


28
4.3.3.2 Nitrogen content of fruits
Nitrogen content of tomatoes and sweet pepper was measured two times during the harvest period. N content varied between 2,0-2,5% for tomatoes (Fig. 21) and 2,4-2,8% for sweet pepper (Fig. 22).
Fig. 21: N content of tomato fruits at different fertiliser treatments.
Fig. 22: N content of red sweet pepper fruits at different fertiliser treatments.


29
4.3.4
Soil nitrate content
Fertiliser application markedly affected the nitrate content in the 0-15 cm layer. In the control treatment, nitrate content was relatively high (compared to the fertiliser treatments). Type of fertiliser and hand hoeing strongly influenced the nitrate content in the soil. Hand hoeing generally increased the soil nitrate content (see unfertilised control) except in the last sampling dates for tomatoes. In general, the soil nitrate content was higher in the soil where tomatoes were grown compared to sweet pepper.
A fertiliser application increased generally soil nitrate content in soil. In sweet pepper, the increase in soil nitrate content was highest after the application of fishmeal and Pioner complete 6-1-3®. However, this effect was much less obvious in tomatoes and especially less pronounced with fishmeal. For sweet pepper, after peak values of around 8 g NO3 -N / m2 decreased nitrate content. With each fertiliser application the decline was getting less and decreased from 0 to 4 to 8 g NO3 -N / m2 and finally to about 12 g NO3 -N / m2 and stayed at the latter value for two months until the end of the experiment. For tomatoes, after peak values of around 40 g NO3 -N / m2 decreased nitrate content to nearly 10-30 g NO3 -N / m2 with a reduction in soil nitrate content at the end of the experiment when the last sampling date of fishmeal is excluded.
Composted cow manure and the reference fertiliser mushroom compost increased the soil nitrate content much less compared to the previous mentioned fertilisers. Values of mostly 10-30 g NO3 -N / m2 were reached in tomatoes and 2-8 g NO3 -N / m2 in sweet pepper.
The treatment with undersowing of clover showed an even lower soil nitrate content than the unfertilised control and amounted most of the time around 10 g NO3 -N / m2 in tomatoes and 2 g NO3 -N / m2 in sweet pepper.
Finally, at the end of the greenhouse experiment soil nitrate content of all treatments was not much different compared to the soil nitrate content measured two months before, excluding fishmeal and Pioner complete 6-1-3® in the tomato experiment.
30
23: Soil nitrate content in tomatoes after the split application of different organic fertilisers in the glasshouse. Fertiliser was applied within a 30 cm wide fertiliserband and thereafter all treatments were hand hoed 5-10 cm deep.
24: Soil nitrate content in sweet pepper after the split application of different organic fertilisers in the glasshouse. Fertiliser was applied within a 30 cm wide fertiliserband and thereafter all treatments were hand hoed 5-10 cm deep.
31 Fig.
Fig.
0 10 20 30 40 50 9.4.2013 7.5.2013 4.6.2013 2.7.2013 30.7.2013 27.8.2013 24.9.2013 22.10.2013 Soil nitrate content (g NO 3 -N / m 2 ) Control Cow Fishmeal Mushroom Pionercomplete Clover 1. fertilizer application 2. fertilizer application 3. fertilizer application 4. fertilizer application 0 4 8 12 16 20 17.4.2013 15.5.2013 12.6.2013 10.7.2013 7.8.2013 4.9.2013 2.10.2013 30.10.2013 Soil nitrate content (g NO 3 -N / m 2 ) Control Cow Fishmeal Mushroom Pionercomplete Clover 1. fertilizer application 2. fertilizer application 3. fertilizer application 4. fertilizer application
DISCUSSION
5.1 Effect of fertiliser
The tested organic fertilisers differed strongly with regard to apparent N utilisation of ryegrass in the pot experiment and in soil N mineralisation in the greenhouse experiment with tomatoes and sweet pepper. This confirms earlier experiments with organic fertilisers (Schmitz and Fischer, 2003, Stadler et al. 2006). Gutser et al., (2005) stated that N availability from organic fertilisers determined as mineralfertiliser equivalents vary typically between 30-70% in the year of application.
N release was described by the N content and the C : N ratio of the tested fertilisers, even though with a low correlation and some fertilisers did not fit in the observed relationship. The slightly poorer performance of the N content with respect to C : N ratio in predicting the N release of the fertilisers could be ascribed to the relatively high N content of fishmeal. However, a close relationship between the above mentioned fertiliser characteristics and their N mineralisation was found by Stadler et al. (2006) and Iritani and Arnold (1960) suggesting that fertiliser N content and C : N ratio is a suitable indicator for predicting the N release of organic fertilisers, provided the fertiliser characteristics are sufficiently different (Stadler et al., 2006).
The total N utilisation of mushroom compost was quite low. A comparable N utilisation was reached with cow, sheep and horse manure. Therefore, mushroom compost can be replaced by the mentioned composted animal fertiliser. However, due to missing animal husbandry for most vegetable producers, animal manure is lacking, but manure could be used from organic animal production or from conventional production after composting.
In general, composted animal manure and plant compost are characterised by a low N content and a relatively high C : N ratio, resulting in a low and slow N mineralisation. Therefore, traditional compost is not a real fertiliser, but mainly used as soil conditioner and it will also mineralise nitrogen in low amounts months after application. Furthermore, the weed potential in compost needs to be kept down.
When a faster (compared to compost) and steadier mineralising fertiliser is needed, growers could use milled fababeans. However, fababeans have not been grown in Iceland and must therefore be imported. But, it would be possible to replace fababeans by in Iceland grown lupins, when their seeds would be gathered and
32 5
milled. It can be assumed that icelandic lupins have a comparable N content and C : N ratio than fababeans and consequently similar N mineralisation. Comparable to fababeans acted chicken compost. In contrast to the other animal composts, chicken compost had a slightly lower C : N ratio (but similar N content) and resulted in a higher N utilisation. However, chicken manure is only available from conventional production when needed in big amounts. The composted organic chicken manure that has been used in the experiment was from an organic grower that is holding some hens for private use.
If vegetable requires N very soon, it is recommended to apply either the fast mineralising fishmeal or Pioner complete 6-1-3® even though this fluid fertiliser is not in line with the general principle of organic horticulture to feed the plants through the soil. The success of using cuttings from clover for N application is depending much on the N content as well as the C : N ratio of the clover and results presented here might not be transferred when the characteristics of the clover differ.
The apparent N utilisation of mushroom compost and cow manure was both in the pot and basil experiment low, and numbers were comparable within experiments. The applied N amount was according to recommendations and only a much higher N amount (visible at 1.200 mg/l, but much more obvious at 1.600 mg/l soil) resulted in experiments in germination inhibition (Beck et al., 2005). For grain legumes is however a germination inhibition known and therefore it is recommended to wait after fertiliser application two weeks before sowing is done (Schmitz & Fischer, 2003).
The N mineralisation of the fertilisers in the tomato and sweet pepper experiment showed a similar pattern as in the pot experiment, where fishmeal and Pioner complete 6-1-3® resulted in higher peaks in N mineralisation compared to the other tested fertilisers. But this was not transferred into yield. The yield level was in general low which was caused by the relatively low natural solar irradiation during the whole growth period compared to other years with normally much higher natural solar irradiation. Yield of tomatoes and sweet pepper was comparable between organic fertilisers and the reference fertiliser mushroom compost, pointing out their ability for substitution. Moreover, for both crops the application of fertilisers did not significantly increase yield compared to the unfertilised control, indicating a high N supply of the soil. Also, Tourte et al. (2000) found no significant differences in the yield of marketable tomatoes between the control and an application of approx. 175 kg N/ha
33
in form of woolypod vetch. This might be explained by the often marginal effect of green manure on yield of tomatoes on fertile soils, but its high effects on poor soils (Thönnissen et al., 2000a), which was also observed by Stadler (2006). The tendentially lower yield of the clover treatment in the sweet pepper experiment can be transferred to a problem with aphids, resulting in plants that stayed long very small, while the clover developed very well. In contrast, in tomatoes no pest problem was observed and the fast growing tomato plants were suppressing the growth of the clover.
5.2 Effect of soil
Soils in horticulture vary in their characteristics and therefore it was tested if there are potential interactions between fertilisers and soils. Attention was payed on different soil Nt and Corg contents while the soil texture was not examined. However, it is known that the soil texture is also influencing fertiliser N mineralisation even though this effect is minor compared to the role of the N content of organic fertilisers (Stadler et al., 2006). In the present experiment was also a soil effect on the mineralisation of the tested organic fertilisers observed. In one soil occurred an immobilisation of N with nearly all fertilisers. With fertilisers high in N content did this immobilisation even get stronger with longer growing period and it took a long time until the positive effect of e.g. fishmeal developed. However, at the end had all soils the same fertiliser order. The behaviour of the fertilisers could not be explained with the soil Nt and Corg contents which is in line with Whitehead (1984) who observed that the apparent N utilisation of 15N labelled ammonium nitrate by ryegrass in 21 soils ranged between 45-67%, but was not related to soil Corg content. Similarly, Legg and Stanford (1967) showed that the fertiliser N uptake (15NO3 ) by oat on 12 surface greenhouse soils ranging from 0.5-3.9% C was also not related to soil Corg content. Also, Stadler et al. (2006) and Bending et al. (2002) stated that no clear influence of OM could be demonstrated. In the literature is described that soil characteristics influenced N mineralisation more strongly for fertilisers with lower N content (Stadler et. al., 2006).
However in the presented findings acted fertilisers higher in N content more different in soils than fertilisers with a lower N content.
It is known that in the soil where the N immobilisation occurred, was mushroom compost regularly applied. Consequently, the soil increased in total OM and
34
mineralisable N (Power and Doran, 1984). The turnover of the organic substance might affect the N utilisation of organic fertilisers on different soils. Soils with a high OM turnover are thought to have a large pool of labile, decomposable C and a smaller pool of stable, texture dependent C (Rühlmann, 1999). Furthermore, N turnover of OM added to soil in crop residues and manure affects the availability of N mineralised from both added and native soil OM (Thomsen et al., 2003).
The N release by the soils was not obviously related to their soil Corg contents. Possibly the soil with the N immobilisation was not able to deal with readily available N in the form of e.g. fishmeal and Pioner complete 6-1-3® due to already much available N from fertiliser applications the years before and consequently immobilised the newly applied fertiliser instead. Stadler (2006) observed that for straw (1,5% N) and pea (3,7% N) was the N immobilisation of straw and the lower apparent N utilisation of pea were more pronounced in the higher Corg content soils. In the literature is this immobilisation also related to the soil texture: Soils that were high in silt and clay immobilised more N from crop residues (1,3-2,8% N) than did sandy soils (Egelkraut et al., 2000). Moreover, remineralisation of immobilised N shows a greater delay in soils with a higher clay content (Whitmore and Groot, 1997; Egelkraut et al., 2000). Net mineralisation in fine textured soils is assumed to be lower, because the OM is physically protected against decomposition (Hassink, 1992).
Magdoff (1991) obtained the highest amounts of available N from soils with medium Nt and Corg content. He explained this result by the fact that at low OM contents, the mineralisation rate was high, but less N was available due to low contents of organic N. And soils high in Nt and Corg had low mineralisation rates which consequently resulted in low amounts of mineralised N as well. This might explain the high N mineralisation (unfertilised control) observed here in “soil higher Corg”. The mineralisation in this soil was markedly superior to those of the two other soils, regardless of whether their Corg contents were higher or lower.
Magdoff (1978) concluded that soils with a high mineralisation rate of soil OM may also rapidly mineralise N from manure and in a soil with a low soil N mineralisation rate manure N release will be lower. Our studies indicate that soils with a high N release will not necessarily result in a high apparent N utilisation of the fertilisers.
35
5.3
Fertiliser application strategies
The data from the pot experiment indicate that N mineralisation of organic fertilisers increased rapidly and was mostly completed after 10-11 weeks after application and declined thereafter. Therefore, the time course of the N release of these fertilisers may favourably match the early N demand of tomatoes and sweet pepper. On the other hand, if the whole N amount of fertiliser is applied at planting there will be a high N surplus during the early tomato and sweet pepper growth. But, mineral N in soil may be prone to losses by leaching or immobilisation (Blankenau and Kuhlmann, 2000). Hence, it might be expected that a split application of organic fertilisers could be favourable for long-growing crops.
The efficiency of the fertiliser on yield depends largely on the synchrony between N release of crop residues and N demand by the growing crop (Iritani and Arnold, 1960). The time course of N uptake markedly differs between vegetable crops (Matsumoto et al., 1999) and for tomatoes N uptake, measured by the difference of NO3 in the soil in the planted vs. unplanted plots, starts 1-3 weeks after planting (Thönnissen et al., 2000b). According to the pot experiment can from both fishmeal and Pioner complete 6-1-3® a high and rapid N release be expected that may temporarily exceed the N requirement of the tomato and sweet pepper plants, which is the reason why a splitted fertiliser strategy was selected to reduce intermittently occurring N excess in soil. However, on the one hand any surplus of mineral N in soil may be prone to losses by leaching or immobilisation (Blankenau and Kuhlmann, 2000). On the other hand a minimum content of mineral N in soil is needed to support a proper plant growth (Feller and Fink, 2002).In the glasshouse experiments residual NO3 -N remained in the soil at the end of the growing period of the tomatoes and sweet pepper, showing that there was no limitation of N at the end of the cropping season. However, at the second fertiliser application date, were nitrate values in the soil quite low and it would have been appropriate to apply fertiliser earlier.
In view of the missing yield differences, the N supply of the tomatoes and sweet pepper was obviously not significantly different between different treatments during crucial stages of development. Especially after each Pioner complete 6-1-3® application mineral N content was boosted by a high short-term N release. Similar results observed Båth (2001), where a late application of green manure (clover)
36
caused a delay in growth and N uptake of leek and high values of nitrate in soil at harvest.
Fishmeal and Pioner complete 6-1-3® acted as rapid N sources, ensuring a sufficient N supply for vegetable crops in organic horticulture. During the vegetation period a regular hoeing of the formerly fertilised plots will generally increase N mineralisation and should therefore be part of an optimised fertiliser management strategy.
5.3 Economics
Beside the effect of the fertiliser also the economic side is of interest. Table 6 shows the price per kg or l of fertiliser. Mushroom compost is about 6 times cheaper than fishmeal and about 3 times cheaper than Pioner complete 6-1-3®. However, one must keep in mind that a much higher amount of fertiliser in the form of mushroom compost is necessary to get 1 kg N compared to the other fertilisers. Also, the N utilisation was much lower with mushroom compost. Paying attention to the apparent N utilisation that was about 10% for mushroom compost would mean that one kg of mineralised N would nearly cost 3.000 ISK. For fishmeal with 75% apparent N utilisation it would be about 2.200 ISK and for Pioner complete 6-1-3® with 85%
apparent N utilisation about 2.500 ISK. That means, according to the N utilisation would mushroom compost be the most expensive fertiliser. However, it also needs to taken into account that mushroom compost is releasing N not only in the year of application. Considering also the following years would then probably lead to similar values as for the other fertilisers. Therefore, on the one hand, mushroom compost cannot be classified as cheap fertiliser and on the other hand fishmeal and Pioner complete 6-1-3® cannot be classified as expensive fertilisers.
6: Costs of organic fertilisers. Fertiliser
Mushroom compost 1 m3
Fishmeal 1 kg 185
Pioner complete 6-1-3® 20 l 9
37
Tab.
size ISK / size (without VAT) N content (%) (mg/l) * ISK / kg ISK / l * ISK / kg N ISK / l * N
2500 1,91 6 (bulk density: 450 kg/m3) 291
10,94 185 1691
336 216 * 457 864 (ready mixture)
6 CONCLUSIONS
In the year of application are organic fertilisers mineralising from 10% (compost) up to 80% (fishmeal, Pioner complete 6-1-3®) of the total N applied. Consequently, it can be assumed that the regular application of these fertilisers over several years will tend to increase total soil OM and N that can potentially be mineralised. It should therefore be kept in mind whether long-term application of these fertilisers may require a modified application strategy. The prohibition of using mushroom compost should not really effect the organic vegetable growers as there are at least equal (composted animal manures) or even better fertilisers (e.g. fishmeal) that have a similar price on the market.
7 REFERENCES
BÅTH B, 2001: Nitrogen mineralisation and uptake in leek after incorporation of red clover strips at different times during the growing period. Biol. Agric. Hort. 18, 243-258.
BECK M, JAKSCH T, HENNING V, 2005: Düngung von Bio-Topfkräutern. Gemüse 8, 14-16
BENDING GD, TURNER MK, JONES JE, 2002: Interactions between crop residue and soil organic matter quality and the functional diversity of soil microbial communities. Soil Biol. Biochem. 34, 1073-1082.
BLANKENAU K, KUHLMANN H, 2000: Effect of N supply on apparent recovery of fertiliser N as crop N and Nmin in soil during and after cultivation of winter cereals. J. Plant Nutr. Soil Sci. 163, 91-100.
CORBEELS M, O´CONNELL AM, GROVE TS, MENDHAM DS, RANCE SJ, 2003: Nitrogen release from eucalypt leaves and legume residues as influenced by their biochemical quality and degree of contact with soil Plant Soil 250, 15-28.
EGELKRAUT TM, KISSEL DE, CABRERA ML, 2000: Effect of soil texture on nitrogen mineralised from cotton residues and compost. J. Environ. Qual. 29, 1518-1522.
FAO (1998): World Reference Base for Soil Resources, FAO, Rome.
38
FELLER C, FINK M, 2002: NMIN target values for field vegetables. In: Booij, R., Neeteson, J. (ed.): Acta Hort. 571, Proceedings of the ISHS workshop: Towards an ecologically sound fertilisation in field vegetable production, International Society for Horticultural Science, 195-201.
GUNNLAUGSSON B, 1995: Sveppamassi sem áburðargjafi í lífrænni ylræktun –Forathugun 1995. Garðyrkjufréttir nr 195.
GUNNLAUGSSON B, 1997: Sveppamassi sem áburðargjafi í lífrænni ylræktun. Garðyrkjufréttir nr 201.
GUNNLAUGSSON B, GUÐFINNSSON GK, 2004: Lífrænir áburðargjafar í gúrkuræktun. Garðyrkjufréttir nr 214.
GUTSER R, EBERTSEDER T, WEBER A, SCHRAML M, SCHMIDHALTER U, 2005: Shortterm and residual availability of nitrogen after long-term application of organic fertilisers on arable land. J. Plant Nutr. Soil Sci. 168, 439-446.
HASSINK J, 1992: Effects of soil texture and structure on carbon and nitrogen mineralisation in grassland soils. Biol. Fertil. Soils 14, 126-134.
HEUBERGER H, KREUZMAIR A, WEH F, VON TUCHER S, SCHNITZLER WH, 2005: Vegetabile Dünger als Stickstoffquelle für Topfbasilikum. - Freisetzung und Aufnahme von Stickstoff aus vegetabilen Düngern bei Basilikum (Ocimum basilicum L.) in Topfkultur. Zeitschrift für Arznei- und Gewürzpflanzen10 (3), 140143.
IRITANI WM, ARNOLD CY, 1960: Nitrogen release of vegetable crop residues during incubation as related to their chemical composition. Soil Science 89, 74-82.
JENSEN ES, 1994: Mineralisation-immobilisation of nitrogen in soil amended with low C:N ratio plant residues with different particle sizes. Soil Biol. Biochem. 26 (4), 519-521.
LEGG JO, STANFORD G, 1967: Utilisation of soil and fertiliser N by oats in relation to the available N status of soils. Soil Sci. Soc. Amer. Proc. 31, 215-219.
MAGDOFF FR, 1978: Influence of manure application rates and continuous corn on soil-N. Agron. J. 70, 629-632.
MAGDOFF FR, 1991: Field nitrogen dynamics: Implications for assessing N availability. Commun. Soil Sci. Plant Anal. 22, 1507-1517.
39
MATSUMOTO S, AE N, YAMAGATA M, 1999: Nitrogen uptake response of vegetable crops to organic materials. Soil Sci. Plant Nutr. 45, 269-278.
POWER JF, DORAN JW, 1984: Nitrogen use in organic farming. In: Hauck RD (ed.): Nitrogen in crop production. ASA, CSSA, SSSA, Madison, WI., pp. 585-598.
RÜHLMANN J, 1999: A new approach to estimating the pool of stable organic matter in soil using data from long-term field experiments. Plant Soil 213, 149-160.
SCHMITZ HJ, FISCHER P, 2003: Vegetabile Dünger in Substraten für den ökologischen Gemüsebau. Gemüse 2, 18-22.
STADLER C, 2006: Nitrogen release and nitrogen use efficiency of plant derived nitrogen fertilisers in organic horticultural soils under glasshouse conditions. Ph.D. Thesis, Chair of Plant Nutrition, Technical University of Munich (TUM).
STADLER C, ÁGÚSTSSON MÁ, HALLDÓRSSON ÞG, 2010: Year-round production of organic vegetable in the greenhouse. In: Fræðaþing landbúnaðarins 2010, Reykjavík, 18th / 19th February 2010, 397-398.
STADLER C, VON TUCHER S, SCHMIDHALTER U, GUTSER R, HEUWINKEL H, 2006: Nitrogen release from plant-derived and industrially processed organic fertilisers used in organic horticulture. J. Plant Nutr. Soil Sci. 169, 549-556.
THOMSEN IK, SCHJØNNING P, CHRISTENSEN BT, 2003: Mineralisation of 15Nlabelled sheep manure in soils of different texture and water contents. Biol. Fertil. Soils 37, 295-301.
THÖNNISSEN C, MIDMORE DJ, LADHA JK, HOLMER RJ, SCHMIDHALTER U, 2000a: Tomato crop response to short-duration legume green manures in tropical vegetable systems. Agron. J. 92, 245-253.
THÖNNISSEN C, MIDMORE DJ, LADHA JK, OLK DC, SCHMIDHALTER U, 2000b: Legume decomposition and nitrogen release when applied as green manures to tropical vegetable production systems. Agron. J. 92, 253-260.
TOURTE L, BUGG RL, SHENNAN C, 2000: Foliar-applied seaweed and fish powder do not improve yield and fruit quality of organically grown processing tomatoes. Biol. Agric. Hort. 18, 15-27.
40
TRINSOUTROT I, RECOUS S, BENTZ B, LINÈRES M, CHÈNEBY D, NICOLARDOT B, 2000: Biochemical quality of crop residues and carbon and nitrogen mineralisation kinetics under nonlimiting nitrogen conditions. Soil Sci. Soc. Am. J 64, 918-926.
WHITEHEAD DC, 1984: Interactions between soil and fertiliser in the supply of nitrogen to ryegrass grown on 21 soils. J. Sci. Food Agric. 35, 1067-1075.
WHITMORE AP, GROOT JJR, 1997: The decomposition of sugar beet residues: mineralisation versus immobilisation in contrasting soil types. Plant Soil 192, 237247.
41
