contents
I
of
List of figures III List of tables V Abbreviations V 1 SUMMARY 1 YFIRLIT 2 2 INTRODUCTION 4 3 MATERIALSANDMETHODS 5 3.1 Greenhouseexperiment 5 3.2 Measurements,samplingandanalyses 10 3.4 Statisticalanalyses 10 4 RESULTS 11 4.1 Environmentalconditionsforgrowing 11 4.1.1Solarirradiation 11 4.1.2Chambersettings 11 4.1.3Irrigationofsalad 12 4.2 Developmentofsalad 13 4.2.1Numberofleafes 13 4.2.2Lengthofhypocothyl 16 4.3 Yield 17 4.3.1Totalfreshyieldofsalad 17 4.3.2Interiorquality 21 4.3.2.1 Sugar content 21 4.3.2.2 Dry substance of salad 22 4.3.4.4 Nitrogen content of salad 24 4.3.3Colourofsalad 24 4.3.4Saladgrowthindex 30
II 4.4 Nitrogenuptake 31 4.5 Economics 32 4.5.1Lightinghours 32 4.5.2Energyprices 35 4.5.3Costsofelectricityinrelationtoyield 38 4.5.4Profitmargin 38 5 DISCUSSION 44 5.1 Yieldandelectricityconsumptionindependence oflightingsource 44 5.2 Colourindependenceoflightingsource 45 5.3 Profitmarginindependenceoflightingsource 45 5.4 Futurespeculationsconcerningenergyprices 46 5.5 Recommendationsforincreasingprofitmargin 47 6 CONCLUSIONS 49 7 REFERENCES 49 8 APPENDIX 51
Listoffigures
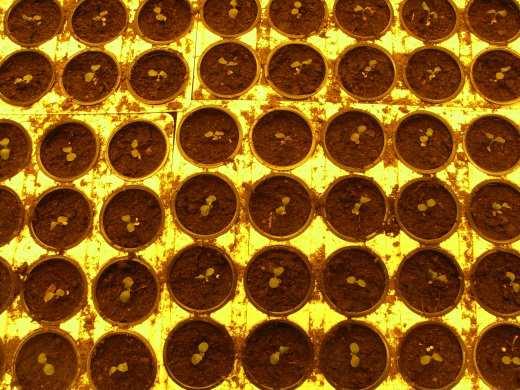
Fig. 1: Salad seedling after germination. 6
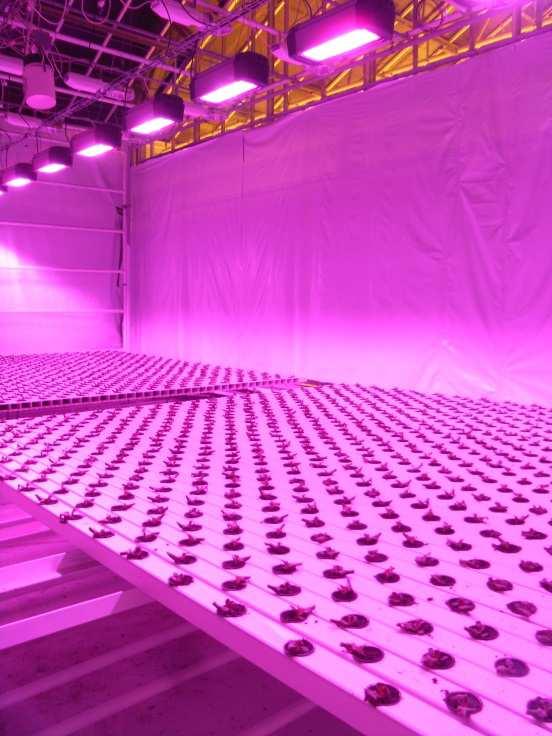
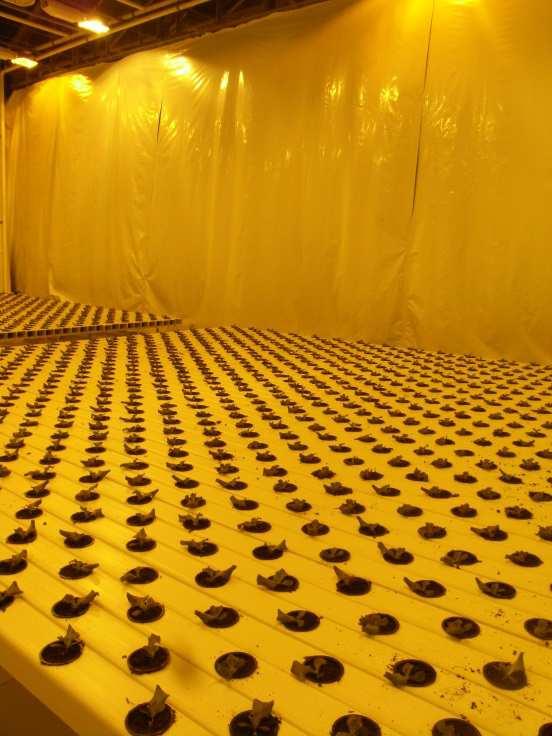
Fig. 2: After moving plants into different chambers (left: HPS, right: LED).
Fig. 3: Experimental design of cabinets.
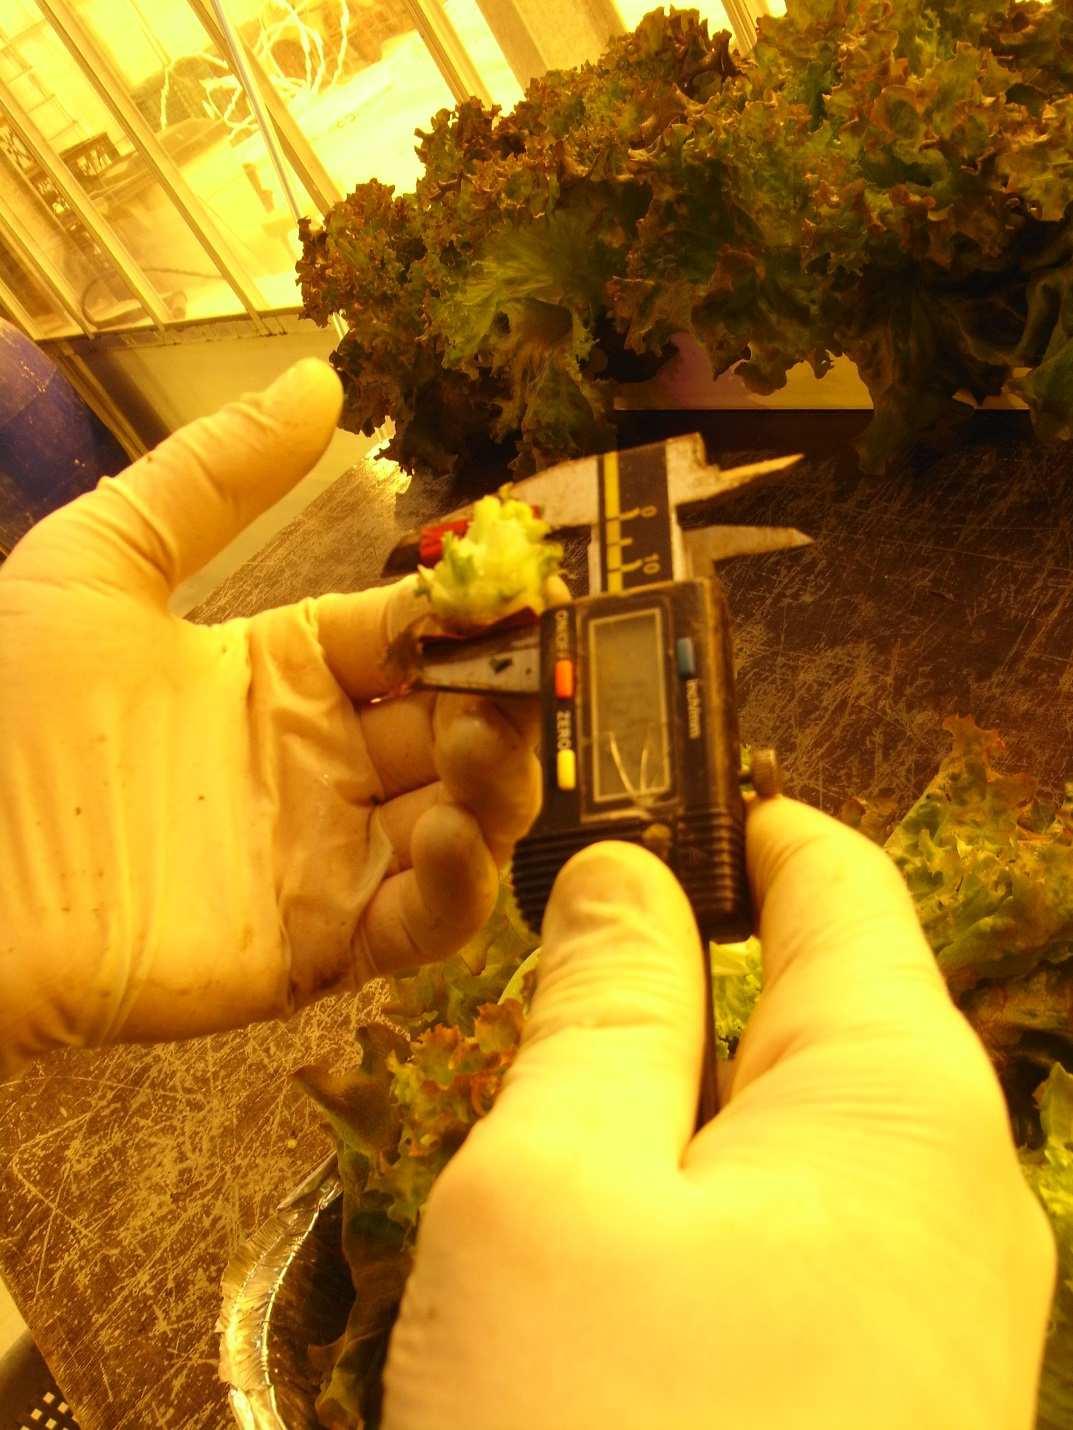
Fig. 4: Measurement of hypocothyl length.
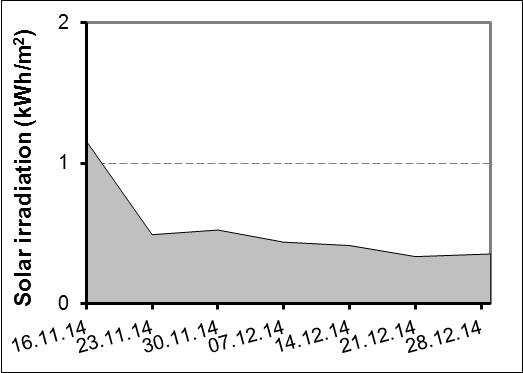
Fig. 5: Time course of solar irradiation. Solar irradiation was measured every day and values for one week were cumulated.
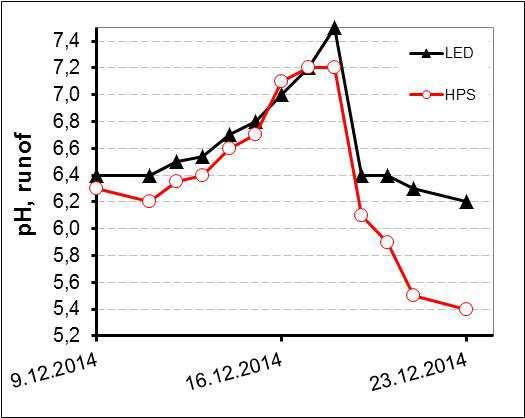
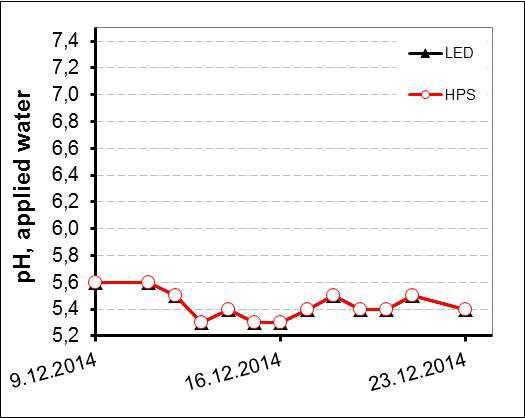
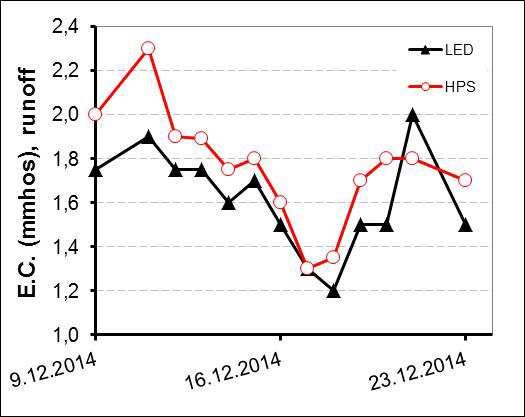
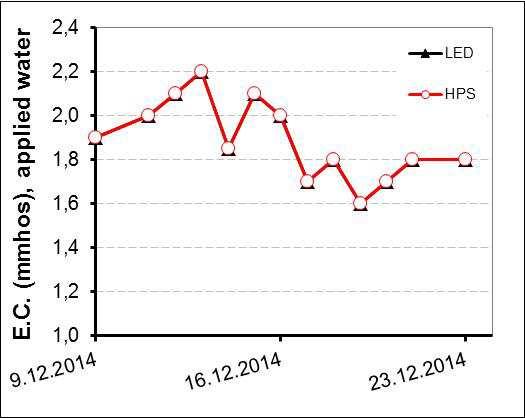
Fig. 6: E.C. and pH of irrigation and runoff water.
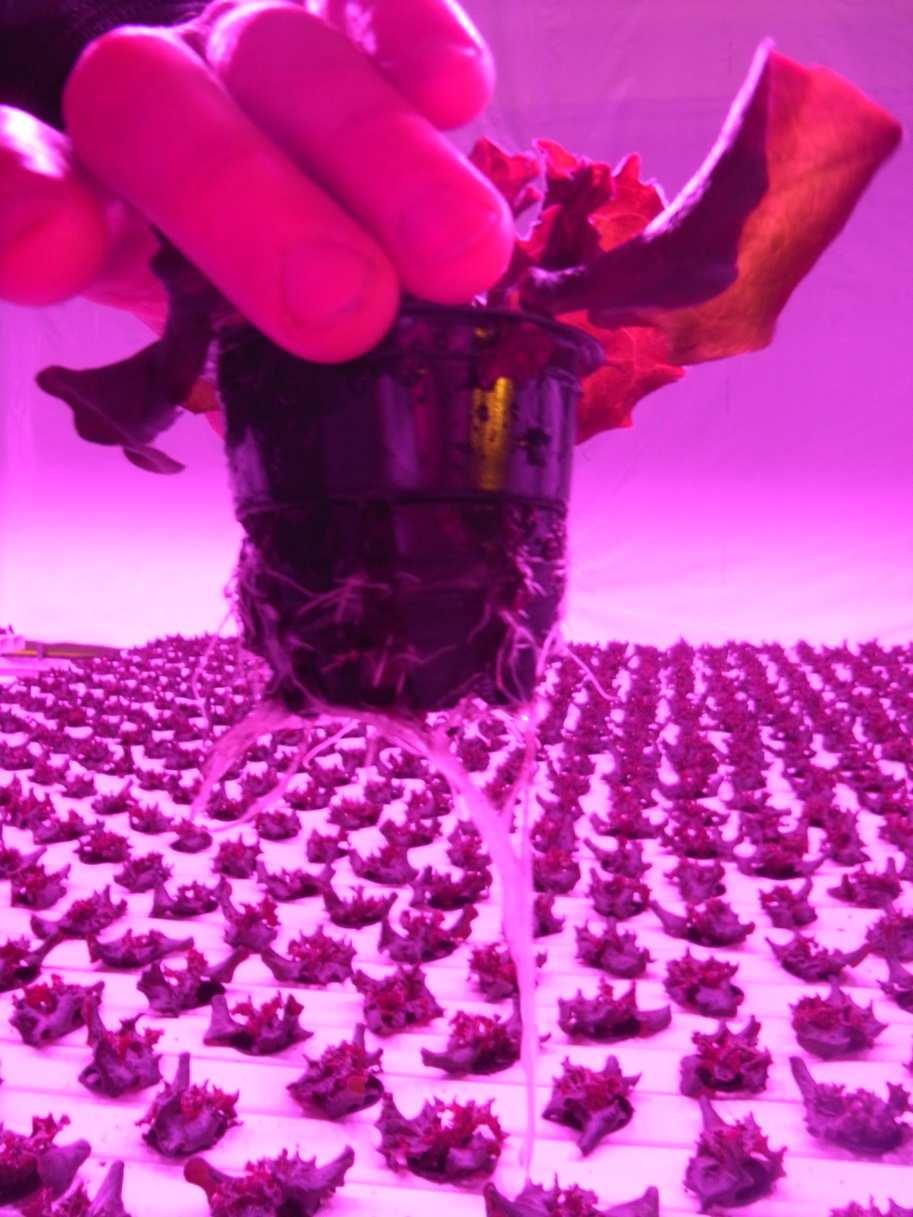
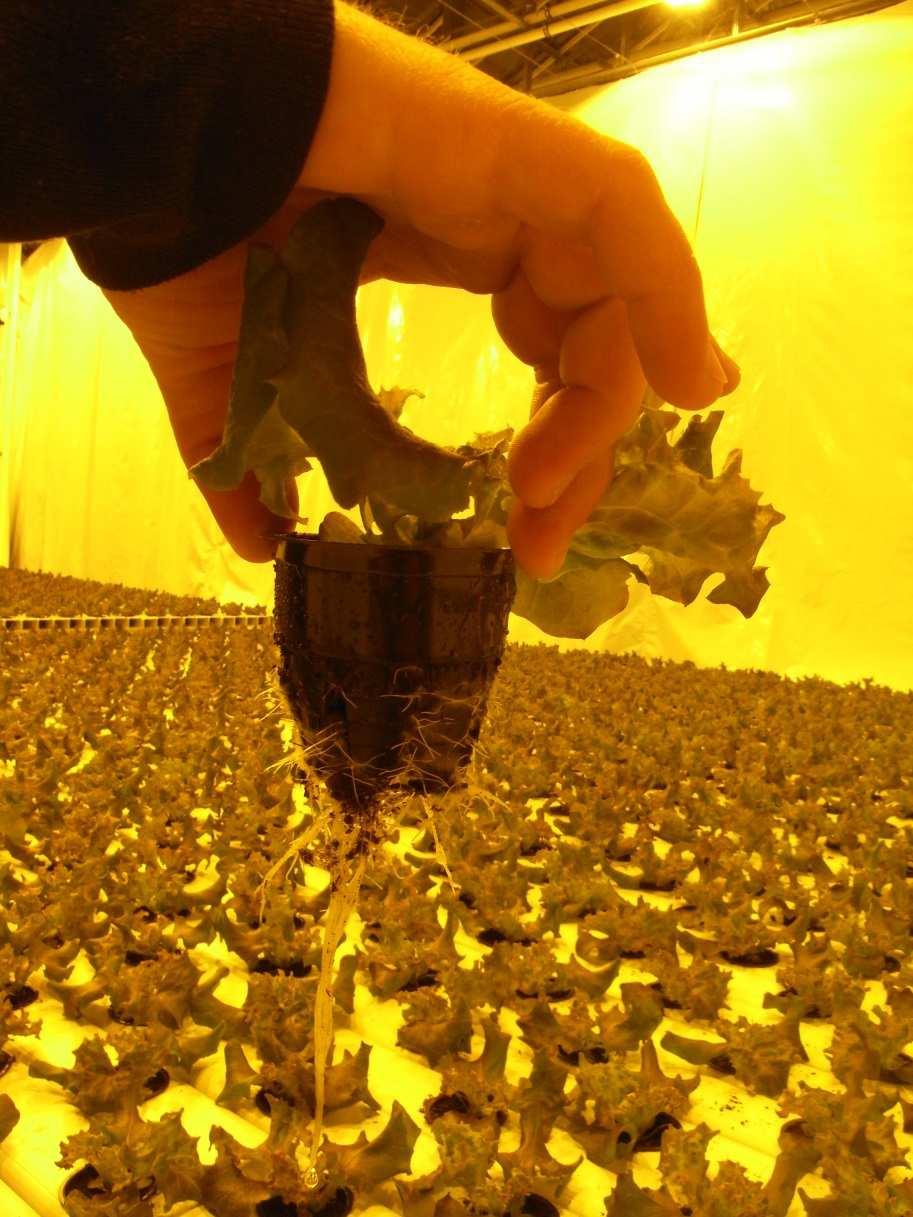
Fig. 7: Salad one week after growing in the NFT channels (left: HPS, right: LED).
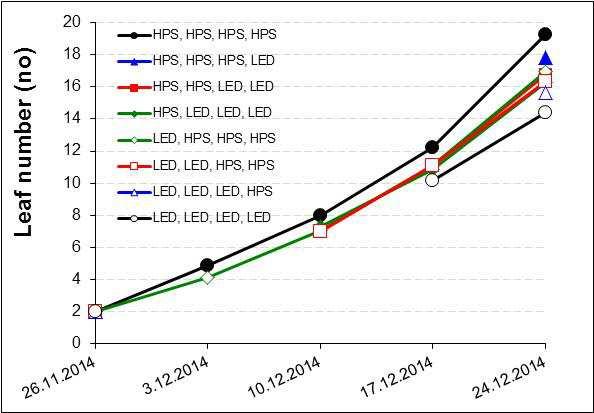
Fig. 8: Development of the leaf number of salad after weekly harvests.
Fig. 9: Leaf number of salad after weekly harvests. 15
Fig. 10: Development of the length of the hypocothyl after weekly harvests.
Fig. 11: Length of hypocothyl after weekly harvests. 17 Fig. 12: Development of total yield of red winter salad after weekly harvests.
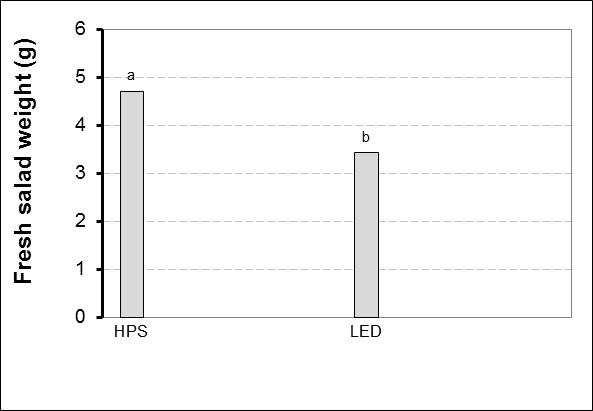
Fig. 13: Total yield of winter salad after one week. Smaller plants are representing plants that received LED lights. 18
Fig. 14: Total yield of winter salad after two weeks. Smaller plants are representing plants that received LED lights. 19
Fig. 15: Total yield of winter salad after three weeks. 19 Fig. 16: Total yield for winter salad after four weeks. 19 Fig. 17: Salad after four weeks. 20
Fig. 18: Relationship between leaf number and fresh weight of salad after four weeks. 20
Fig. 19: Development of sugar content of salad. 21
Fig. 20: Sugar content of salad at weekly harvests. 22
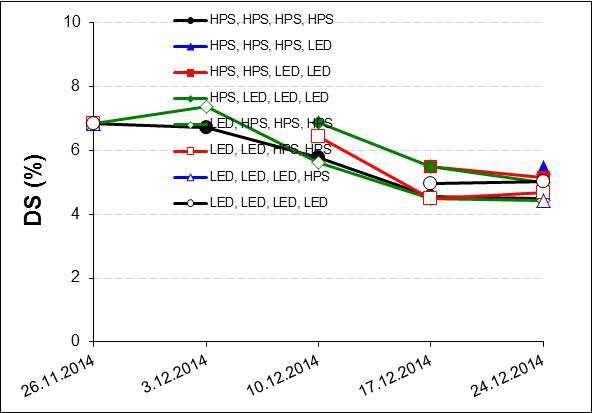
Fig. 21: Development of dry substance of salad. 23
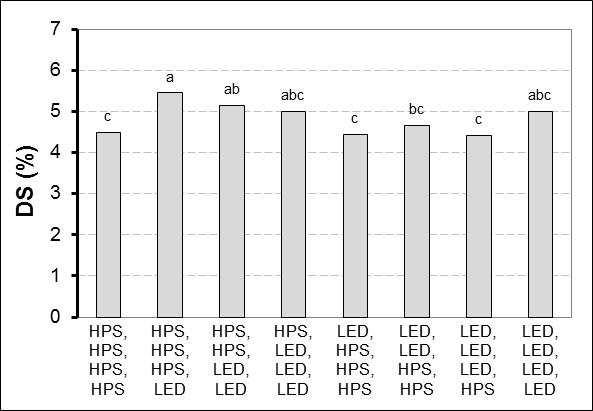
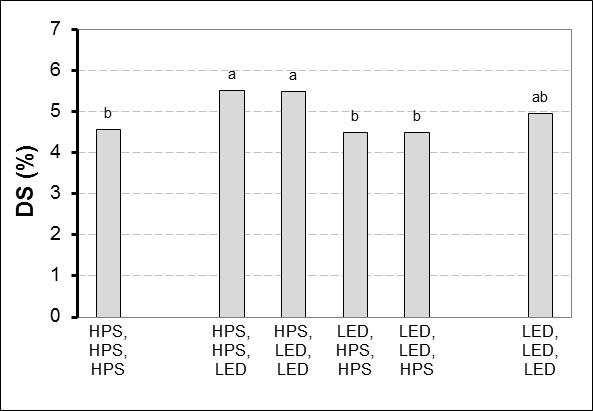
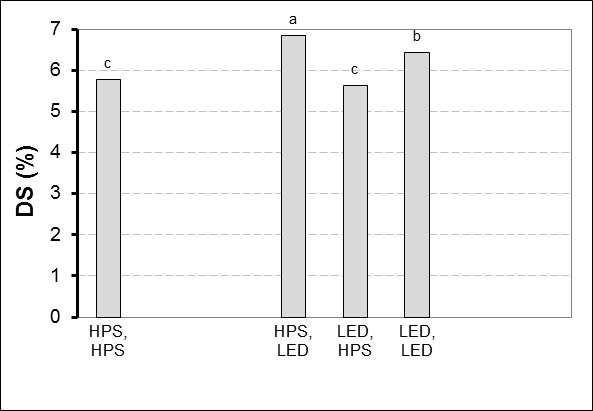
Fig. 22: Dry substance of salad at weekly harvests. 23
Fig. 23: N content of salad after four weeks. 24
Fig. 24: Development of colour of winter salad. 25
Fig. 25: Colour of salad after one week (left: HPS, right: LED). 25
Fig. 26: Colour of salad after two weeks (left: HPS, right: LED). 26 Fig. 27: Colour of salad after three weeks (left: HPS, right: LED). 26
III
7
8
10
11
13
14
15
16
18
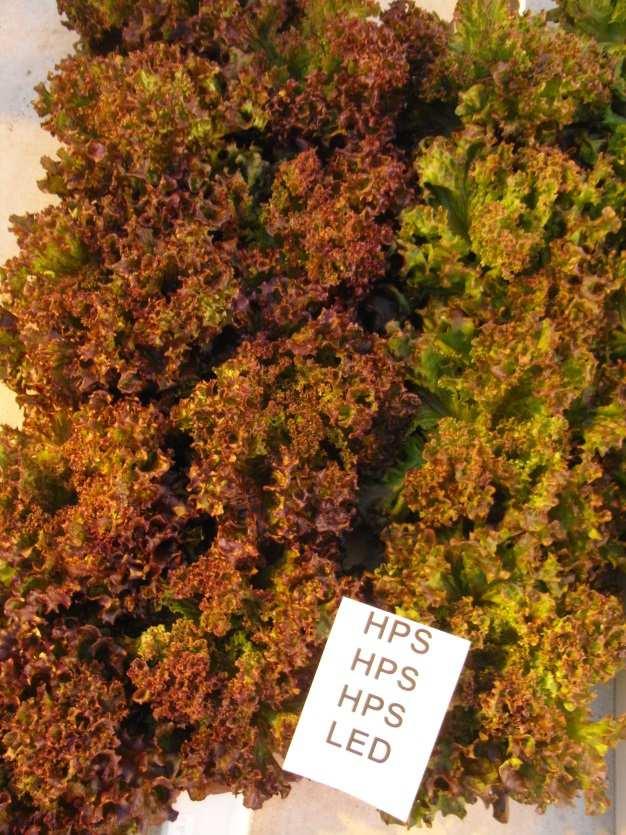
Fig. 28: Colour of salad after four weeks. 26
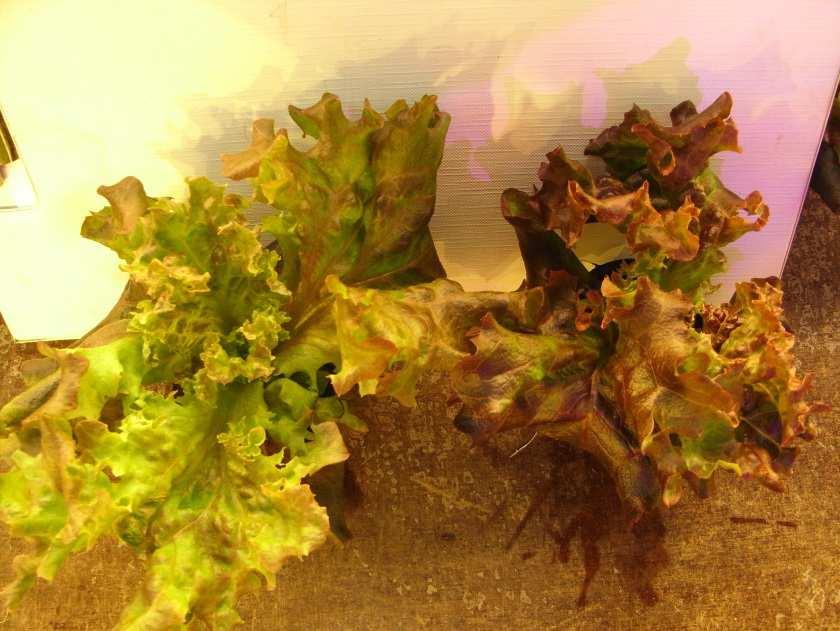
Fig. 29: Colour of salad after four weeks (left: HPS, right: LED). 27
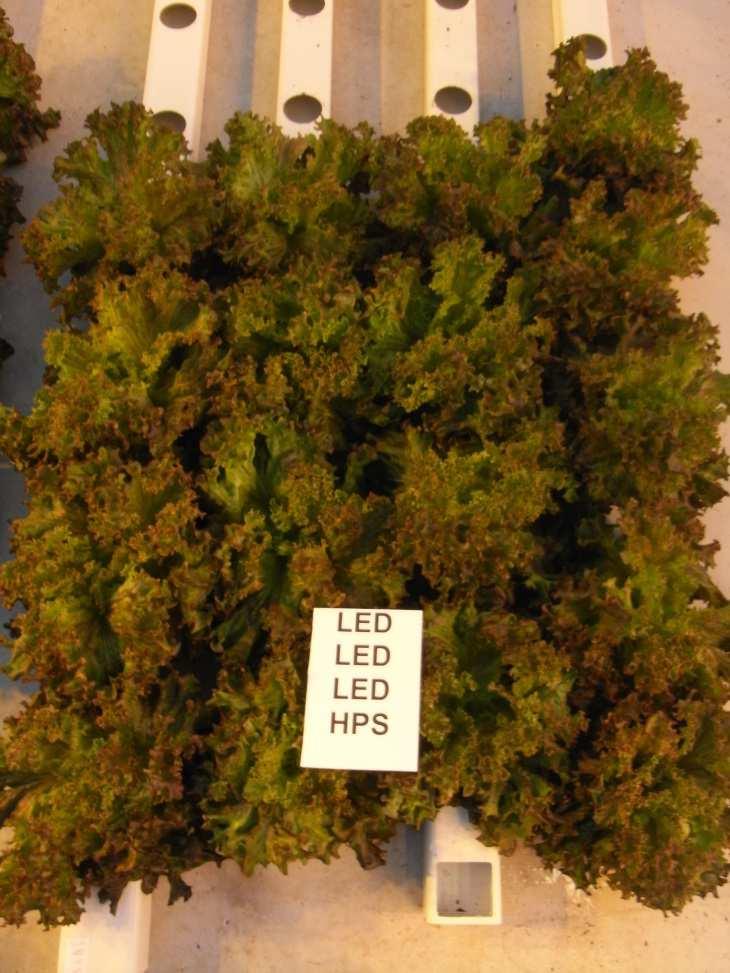
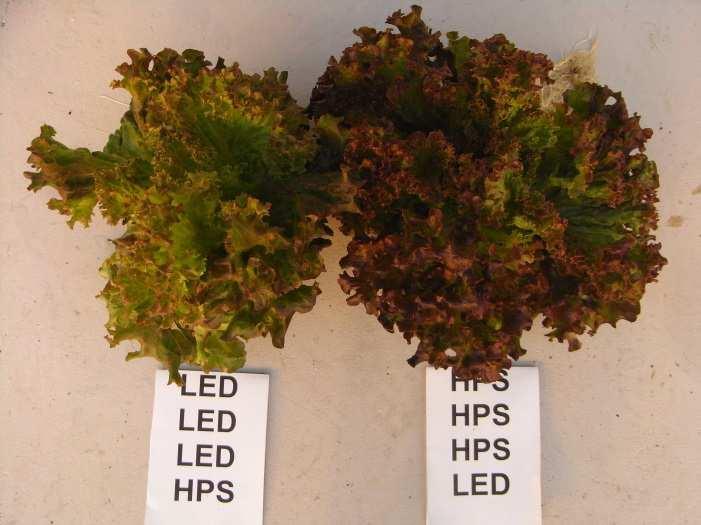
Fig. 30: Colour of salad after four weeks for plants that received one week at the end of the growth period HPS or LED lights and three weeks before LED or HPS lights. 28
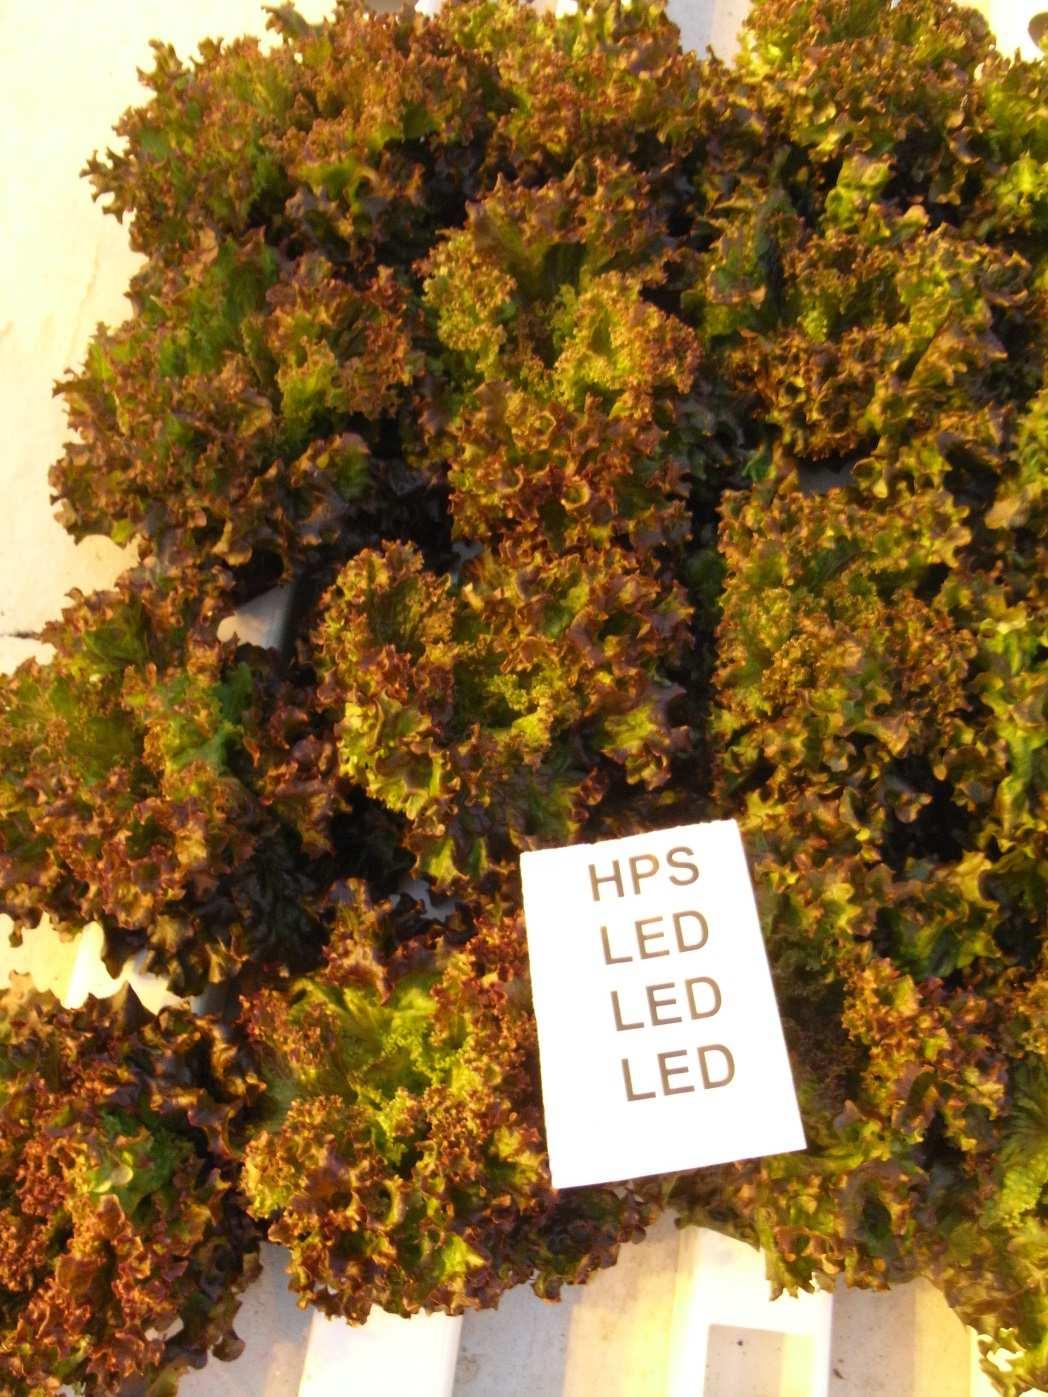
Fig. 31: Colour of salad after four weeks for plants that received three weeks at the end of the growth period HPS or LED lights and one week before LED or HPS lights. 29
Fig. 32: Colour of salad after four weeks for plants that received one or two weeks at the end of the growth period LED and weeks before HPS light. 29
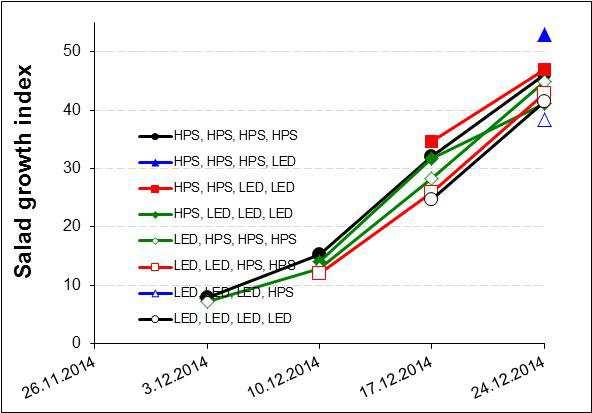
Fig. 33: Development of salad growth index at weekly harvests. 30
Fig. 34: Salad growth index at weekly harvests. 31
Fig. 35: Cumulative N uptake of salad after four weeks. 32
Fig. 36: Used kWh in the different chambers. 32 Fig. 37: Relationship between yield and kWh. 33 Fig. 38: Yield per kWh. 34
Fig. 39: Relationship between growing time and yield – calculation scenarios. 35
Fig. 40: Revenues at different treatments. 39
Fig. 41: Variable and fixed costs (without labour costs). 39 Fig. 42: Division of variable and fixed costs. 40 Fig. 43: Profit margin in relation to tariff and treatment. 42
Fig. 44: Profit margin in relation to treatment – calculation scenarios (urban area, VA210). 46
IV
Listoftables
Tab. 1: Light distribution of the HPS and LED chamber. 9 Tab. 2: Fertilizer mixture according to advice from Azelis. 9 Tab. 3: Settings of the LED and HPS chamber. 12 Tab. 4: Lighting hours, power and energy in the cabinets for different lighting treatments (datalogger values). 33
Tab. 5: Days to harvest and used energy. 35 Tab. 6: Costs for consumption of energy for distribution and sale of energy for growing only under HPS respectively LED lights. 37
Tab. 7: Variable costs of electricity in relation to yield. 38
Tab. 8: Profit margin of winter salad at different treatments (urban area, VA210). 41
Tab. 9: Calculation scenarios of profit margin per year. 43
Abbreviations
DM dry matter yield
DS dry substance
E.C. electrical conductivity
HPS high-pressure vapour sodium lamps
kWh kilo Watt hour
LED light emitting diodes
N nitrogen pH potential of hydrogen ppm parts per million
W Watt Wh Watt hours
Other abbreviations are explained in the text.
V
SUMMARY
In Iceland, winter production of greenhouse crops is totally dependent on supplementary lighting and has the potential to extend seasonal limits and replace imports during the winter months. However, in autumn and winter is it difficult to get the red colour in red salad. Therefore, adequate guidelines for winterproduction of salad are not yet in place and need to be developed. The objective of this study was to test the development, growth and yield of red salad under HPS lights compared to LED lights. The time that is necessary under LED’s, when in the growth period the red colour can be encouraged by LED’s and which lighting treatment is economically viable was investigated.
An experiment with red salad (cv. Carmoli) was conducted in winter 2014, from the end of November to December, in the research greenhouse of the Agricultural University of Iceland at Reykir. Plants were grown in NFT channels in four repetitions under toplighting with high-pressure vapour sodium lamps (HPS) and / or under LED lights for 18 hours. Day temperature was 19 °C and night temperature 15 °C. Salad received standard nutrition through drip irrigation. The plant density was 68, 40, 28 and 22 plants per squaremeter after one, two, three and four weeks after planting.
The lighting treatment that resulted in a satisfactory red colour in salad and in good yield was always under HPS lights and the last week under LEDs. A redder colour was reached with LED lights at the end of the growth period, while is was not paying off to use this lighting source in the first part of the growth period, because whose effect was gone after the use of HPS lights and the red colour was even less compared to plants that got only HPS lights. Two times more kWh were used by only HPS lights compared to the only use of LED lights. In contrast, the yield with the only use of LED lights was around ¼ less.
More yield was going ahead with a higher use of kWh. However, due to the 50 % lower use of energy by using only LEDs, the utilisation of kWh´s into yield was significantly higher compared to the only use of HPS lights. A four days longer growth period would be necessary with LED lights to get the same yield compared to growing only under HPS lights. However, this would result, despite of at least one growing circle less per year, still in a more than 1.000 ISK/m2 higher profit margin when the whole year would be considered due to lower costs for electricity. However,
1 1
these results are very much dependent on the price of the LED’s and have to be judged cautiously.
Possible recommendations for saving costs other than lowering the electricity costs are discussed. From a quality and an economic viewpoint it is recommended to use LED lights at the end of the growing period to boost red colour in salad as well as to reduce electricity usage. Therefore, lower variable production costs with the use of LED’s are resulting in a possibly higher profit margin. However, further experiments by increasing the power of the LED lights and increasing the leaf and root temperature to same values as with plants grown under HPS lights are necessary and could even result in more promising results with LEDs and will be evaluated in future.
YFIRLIT
Vetrarræktun í gróðurhúsum á Íslandi er alveg háð aukalýsingu. Viðbótarlýsing getur þá lengt uppskerutímann og komið í stað innflutnings að vetri til. En að hausti og vetri er erfitt að fá rauðan lit á rautt salat og því eru fullnægjandi leiðbeiningar vegna vetrarræktunar á salat ekki til og þarfnast frekari þróunar. Markmiðin voru að kanna vaxtarhraða, þróun og uppskeru af rauðu salati undir HPS lömpum í samanburði við LED lýsingu og prófa hver er lágmarkstími, sem rækta þarf undir LED ljósi og hvenær er best að lýsa, til að styrkja litun plantnanna og hvaða meðferð væri hagkvæm.
Tilraun með rautt salat (cv. Carmoli) var gerð veturinn 2014, frá lokum nóvember til desember, í tilraunagróðurhúsi Landbúnaðarháskóla Íslands að Reykjum. Plöntur voru ræktaðar í NFT rennu í fjórum endurtekningum undir topplýsingu frá háþrýstinatríumlömpum (HPS) og / eða undir LED ljósi í 18 klst. Daghiti var 19 °C og næturhiti 15 °C. Salatplöntur fengu næringu með dropavökvun. Plöntuþéttleiki var 68, 40, 28 eða 22 plöntur á fermetra, eftir eina, tvær, þrjár eða fjórar vikur eftir gróðursetningu.
Ljósameðferð sem skilaði góðum rauðum lit á salati og góðri uppskeru var alltaf undir HPS og síðustu viku undir LED ljósum. Meiri rauður litur á salati var þegar LED ljós var notað í lokin en það borgar sig ekki að nota LED ljós á fyrri hluta vaxtartímabilsins, því að áhrif þess á salatið eyðast ef seinna er notað HPS ljós og rauði liturinn var jafnvel minni í samanburði við plöntur sem fengu bara HPS ljós.
2
Tvöfalt fleiri kWh þurfti með eingöngu HPS ljós í samanburði við eingöngu LED ljós sem skilaði hæstu uppskeru en uppskera með eingöngu LED var um fjórðungi minni. Meiri uppskera var í samhengi við aukna notkun kWh. En, vegna 50 % lægri orkunotkunar með eingöngu LED ljósum, var nýting kWh í uppskeru marktækt hærri borin saman við að nota eingöngu HPS ljós. Það myndi taka fjórum dögum lengur að fá sömu uppskeru í g með því að nota eingöngu LED ljós samanborið við að nota eingöngu HPS ljós. Þrátt fyrir að LED lýsing hafi í för með sér fjögurra daga lengra vaxtarskeið, auk a.m.k. einu vaxtarskeiði færra á ári, fékkst yfir 1.000 ISK/m2 meiri framlegð þegar allt árið er skoðað vegna lægri rafmagnskostnaður. Hins vegar eru þessar niðurstöður mjög háðar verði á LED ljósum og þarf því að dæma varlega. Möguleikar til að minnka kostnað, aðrir en að lækka rafmagnskostnað eru ræddir. Frá gæða- og hagkvæmnisjónarmiði er mælt með því að nota LED ljós í lok vaxtatímabils til að auka rauða litinn í salatinu og draga úr orkunotkun. Lægri breytilegur framleiðslukostnaður með LED ljósum leiðir væntanlega til hærri framlegðar. Hins vegar þarf frekari tilraunir eins og að auka kraft í LED ljósum og auka hita í blöðum og rótum í sömu gildi eins og þegar ræktað er undir HPS ljósum. Það gæti jafnvel leitt til fleiri vænlegra niðurstaðna fyrir LED lýsingu og verður könnuð í framhaldinu.
3
INTRODUCTION
It is difficult to grow salad in Iceland and other northern regions due to short days and little sunshine from middle of September until middle of April, but the extremely low natural light level is the major limiting factor for winter greenhouse production. Therefore, supplementary lighting is essential to maintain year-round vegetable production. This could replace imports from lower latitudes during the winter months. Ultraviolet-B (UV-B, 280-315 mm) radiation gives the characteristic red color on red salad. Lack of UV-B radiation gives a brownish leaf colour, which is generally regarded as a low-quality product. The radiation level of UV-B varies depending on the season and latitude. Low or inexistent levels of UV-B radiation in the solar irradiation emitted by low sun angle and / or a small amount of blue light in northern regions as in Norway and Iceland during winter inhibit the production of high quality red salad. Therefore, it is difficult get the red color in red salad in autumn and winter. The red color also implies increased content of bioactive substances that are considered good health.
Supplemental lighting that is normally used in greenhouses has no or only a small amount of UV-B radiation. HPS lamps are the most commonly used type of light source in greenhouse production due to their appropriate light spectrum for photosynthesis and their high efficiency. The spectral output of HPS lamps is primarily in the region between 550 nm and 650 nm and is deficient in the IV and blue region (Krizek et al., 1998). However, HPS lights suffer from restricted controllability and dimming range limitations (Pinho et al., 2012).
Light-emitting diodes (LED) have been proposed as a possible light source for plant production systems and have attracted considerable interest in recent years with their advantages of reduced size and minimum heating plus a longer theoretical lifespan as compared to high intensity discharge light sources such as HPS lamps (Bula et al., 1991). This lamps are a radiation source with improved electrical efficiency (Bula et al., 1991), in addition to the possibility to control the light spectrum and the light intensity which is a good option to increase the impact on growth and plant development. Several plant species have been successfully cultured under LEDs (e.g. Tamulaitis et al., 2005; Schuerger et al., 1997; Brown et al., 1995; Hoenecke et al., 1992). The question is if salad under LEDs would also result in good yield and if it is possible to improve red colour. Experiments, conducted for example
4 2
in Finland (Juntunen & Riihimäki, 2011) have shown that it was possible with LED lights to get a stronger red colour. Also, the finish company Valoya has done research on lighting salad with HPS lights in comparison to LEDs. Plants under HPS lights had a longer hypocotyl and the generative growth was more pronounced compared to the LED treatment. On the other side, less aphids on ice salad were observed when grown under LEDs. Also, the taste of salad and basil was evaluated better under LEDs (Valoya, 2013). In Norway had plants a very small amount of phenol when grown under HPS lights. However, grown under LEDs with 20 % blue and 80 % red increased phenol content (Rodriguez, 2012).
The objective of this study was to test (1) which lighting treatment gives a good yield and a satisfactory red colour in red winter salad, (2) the minimum time that is necessary under LED lights to get a satisfactory red colour, and (3) at which time period during the growth is it best to use LED lights to strengthen red colour of salad, and (4) which lighting treatment improves profit margin. This study should enable to strengthen the knowledge on the best lighting method of growing red salad and give vegetable growers advice how to improve red colour in red salad accompanied with a satisfactory yield. The research will determine the development of growth and the yield of red winter salad grown under HPS lights compared to LED lights.
3
MATERIALSANDMETHODS
3.1 Greenhouseexperiment
An experiment with salad (Lactuca stativa cv. Carmoli) and two different light sources (1. HPS 120 W/m2, 165 µmol/m2/s, 2. LED 120 W/m2 with Fiona lighting, 80 % red, 20 % blue, 164 µmol/m2/s) was conducted in two chambers of the Agricultural University of Iceland at Reykir.
Seeds of salad were sown on 11.11.2014 in pots (Ø 6 cm) filled with peat substrate and covered with plastic until germination and kept under 19 °C / 15 °C (day / night). Three days after sowing were pots uncovered from plastic (Fig. 1).
5
Fig. 1: Salad seedling after germination.
Plants were watered with fertilizer. Salad seedlings received 150 W/m2 HPS light from 05.00-23.00. Two weeks after sowing, on 25.11.2014, plants were transferred to a hydroponic growing system with NFT channels, with a slope of 1 cm per m (Fig. 2). The pots were placed in channels (width: 7 cm) in 70 cm height. Each channel was 4,06 m and took 19 pots, with 21 cm between pots. The channels were placed in two rows with a 50 cm gangway in between. Each row had in the beginning of the growth period 44 channels without space in between. However, one week, two and three weeks, respectively, after planting the seedlings into the NFT channels, the distance between the channels was changed to 5 cm, 10 cm, 15 cm, respectively, giving a plant density of 68, 40, 28, 22 plants/m2, respectively. Salad plants were different times under HPS and / or LED lights with supplemental lighting from 05.00-23.00. In total, within four weeks eight different lighting treatments were conducted, starting on 26.11.2014:
6
Fig. 2: After moving plants into different chambers (left: HPS, right LED).
1. 4 weeks only under HPS light
2. 3 weeks under HPS light and then under LED with 1 week
3. 2 weeks under HPS light and then under LED with 2 weeks
4. 1 week under HPS light and then under LED with 3 weeks
5. 1 week under LED light and then under HPS with 3 weeks
6. 2 weeks under LED light and then under HPS with 2 weeks
7. 3 weeks under LED light and then under HPS with 1 week
8. 4 weeks only under LED light
The experimental design of the cabinets can be seen in Fig. 3.
The lamps were distributed in the way that salad got the most equal light distribution (Tab. 1), on average, 165 µmol/m2/s in the HPS chamber and 164 µmol/m2/s in the LED chamber. The LED lights were set to 12 % (=20 %) blue light. To get a more even distribution, 80 % power was given to the inner lamps and 90 % power to the outer lamps. In addition, white plastic on all surrounding walls helped to get a higher light level at the edges of the growing area. The wavelength of red LEDs was 660 nm and of blue LEDs was 450 nm.
7
Tab. 1: Light distribution of the HPS and LED chamber.
HPS µmol/m2/s
LED µmol/m2/s
bed door middle glas average door middle glas average
A 160 160 154 158 162 162 148 157 B 160 171 162 164 173 170 165 169 C 147 178 172 166 175 169 164 169 D 160 175 182 172 163 167 149 160 average 157 171 168 165 168 167 168 164
Salad received standard nutrition consisting of “Pioner Basis 8-5-30” (AZELIS) according to the following fertilizer plan (Tab. 2).
Tab. 2: Fertilizer mixture according to advice from Azelis.
Stem solution A (1000 l) Stem solution B (1000 l)
Fertilizer (amount in kg) Calciumnitrate Pioner Basis 8-5-30
Irrigation water
Resistim (as required) E.C. (mS/cm) 100 125 0,5 10 2,2
Pioner Iron Chelate EDDHA 6 %
Salad was irrigated through NFT channels. The first watering was applied at 5.00 with 2,5 hours from the first to the second irrigation and 6 hours from the second to the third irrigation and so on. From 4th of December onwards 4 hours were between the second and the third irrigation and so on. From the 8th of December onwards 2,5 hours were between waterings and one watering in the night at 01.00. On the 17th of December ammonium nitrate was added and watered with intervals of 2 hours between waterings and on the 19th of December 1 hours and 20 min between waterings. It was aimed on having an E.C. of 1,6 mS/cm and a pH of 5,2-5,5 in the applied water and 5,5-6,0 in the runoff water (please find more information in the appendix).
9
4.1 Environmentalconditionsforgrowing
4.1.1 Solar irradiation
Solar irradiation was allowed to come into the greenhouse. Therefore, incoming solar irradiation is affecting plant development and was regularly measured. The experiment was conducted during high winter and thus, the natural light level was during the different lighing treatments very low and stayed at around 1 kWh/m2 (Fig. 5).
Fig. 5: Time course of solar irradiation. Solar irradiation was measured every dayand values for one week were cumulated.
4.1.2 Chamber settings
The settings of the chambers were monitored (Tab. 3). In the beginning there was observed a problem with the heat of the walls. Also, after that has been fixed, was the heat of the walls in the HPS chamber always higher compared to the LED chamber. However, the air temperature in both chambers was comparable during the whole growth period, while the temperature on the floor was always lower in the LED
11 4
chamber. The CO2 amount was comparable in the chambers. In contrast, the humidity as well as the temperature of the leafes and the roots was higher in the HPS chamber.
Tab. 3: Settings of the LED and HPS chamber.
Chamber Average Min Max Until 1. harvest 1. to 2. harvest 2. to 3. harvest 3. to 4. harvest
Air (°C)
LED HPS 18,4 18,3 18,1 17,9 19,5 19,1 18,5 18,4 18,2 18,1 18,2 18,1 18,4 18,4
Floor (°C) LED HPS 32,4 34,8 25,7 24,7 40,0 42,2 27,6 28,9 29,6 33,4 36,2 39,9 37,2 39,2
Wall (°C)
LED HPS 787,3 788,8 439,8 439,1 867,1 847,1 813,7 800,0 826,5 818,2 828,8 820,2 836,0 827,3
LED HPS 29,8 48,5 21,6 24,8 48,8 82,8 25,3 42,1 33,3 62,1 35,1 52,0 25,5 36,8 CO2 (ppm)
Humidity (%) LED HPS 52,2 56,2 44,6 50,0 61,0 65,1 53,8 57,1 49,3 54,7 49,5 53,8 59,0 61,2
Leaf (°C) LED HPS 13,1 16,4 Roots (°C) LED HPS 17,5 18,9
4.1.3 Irrigation of salad
E.C. and pH of irrigation water was fluctuating much (Fig. 6). E.C. of applied water ranged between 1,6 and 2,2 and pH between 5,3 and 5,6. E.C. of runoff stayed mostly between 1,4 and 2,0 and the pH of runoff between 6,2 and 7,0. The E.C of the runoff water was higher in the HPS chamber and the pH higher in the LED chamber. E.C. of runoff water decreased until middle of December and increased after that again, while the pH increased until middle of December and decreased after that again (Fig. 6).
12
Fig. 6: E.C. and pH of irrigation and runoff water.
4.2 Developmentofsalad
4.2.1 Number of leafes
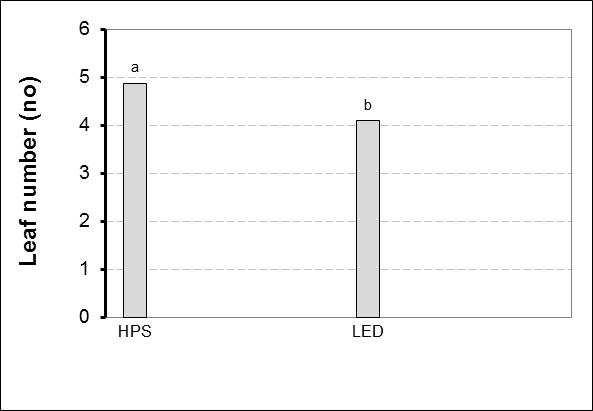
When the salad seedlings were planted into the NFT channels each plant had two leafes. One week after growing in the NFT channels, in both, the LED chamber as well as in the HPS chamber, roots had grown through the plastic pot (Fig. 7) and leaf number had more than doubled (Fig. 9).
13
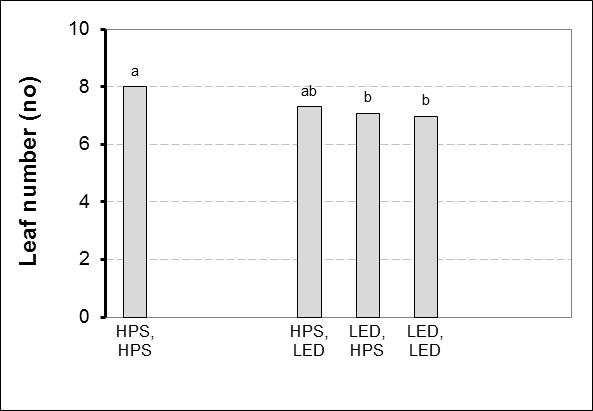
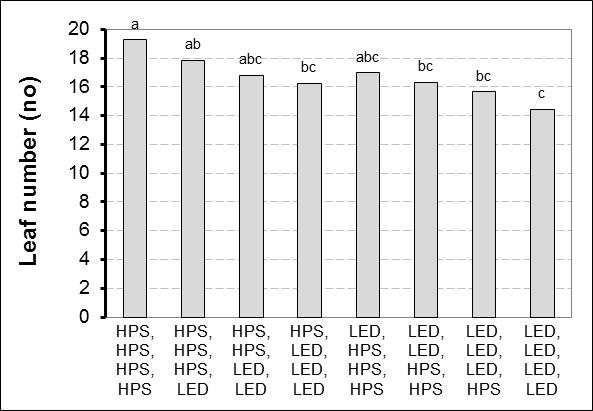
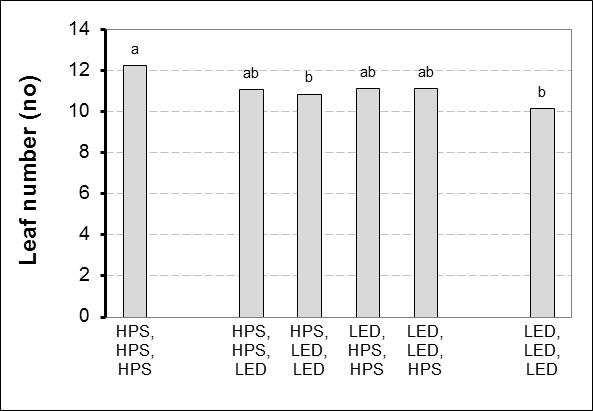
Leafes of salad increased during the growth period and the increase was even faster with proceeding growing period (Fig. 8). Plants that received only HPS light developed during all harvest stages significantly more leaves than plants that received only LED light. Plants that received at the beginning for one, two or three weeks HPS light and after that LED light had a tendentially higher leaf number than plants that received for the same number of weeks first LED and then HPS light (Fig. 9).
14
Fig. 7: Salad one week after growing in the NFT channels (left: HPS, right: LED).
Fig. 8: Development of the leaf number of salad after weeklyharvests.
Fig. 9: Leaf number of salad after weeklyharvests. Letters indicate significant differences at the end of the experiment (HSD, p ≤ 0,05).
15
4.2.2 Length of hypocothyl
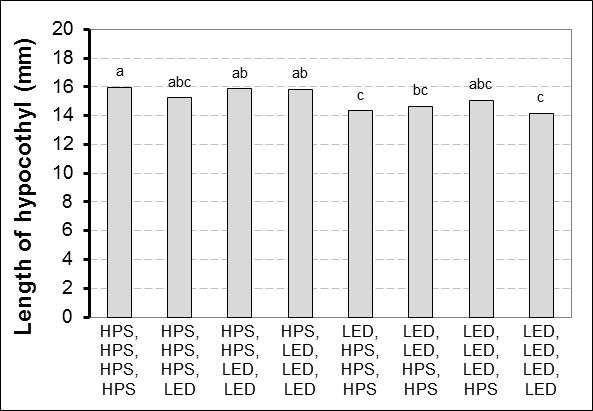
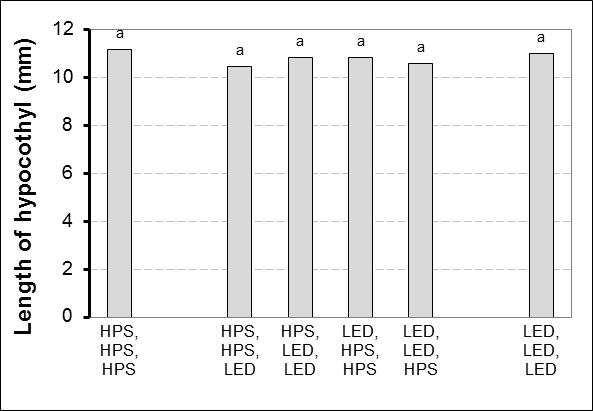
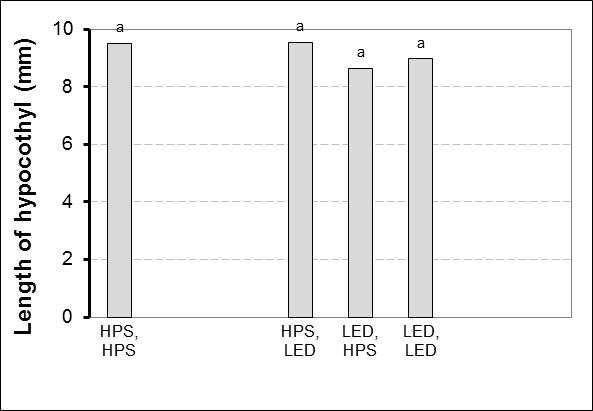
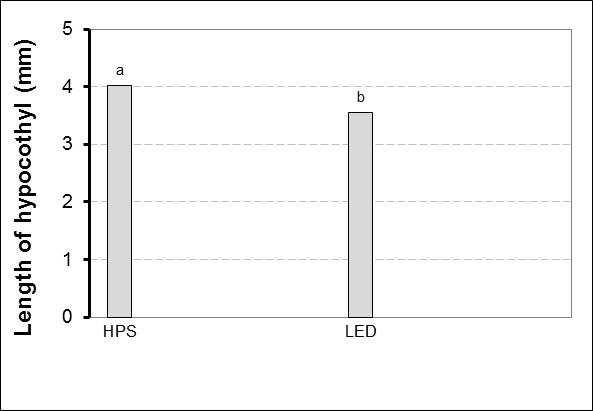
The length of the hypocothyl increased during the growth period by approximately 2 mm per week (Fig. 10). The hypocothyl was in the first and last harvest significantly higher when salad was grown under HPS lights compared to LED lights. However, this was not obvious in the second and third harvest. Plants that received in the beginning HPS light and then LED light seem to have a tendentially or even significantly higher length of hypocothyl compared to plants that received LED light in the beginning of the growth period (Fig. 11).

Plants under HPS light had more leaves (about 19 leafes) in relation to the hypocothyl (about 16 mm). That means that the vegetative growth is more pronounced, whereas less leaves in relation to hypocothyl length indicates generative growth, which is more the case for the LED treatment with about 14 leaves and a hypothyl length of 14 mm.
Fig. 10: Development of the length of the hypocothyl after weeklyharvests.
16
Fig. 11:
Length of hypocothyl after weeklyharvests
Letters indicate significant differences (HSD, p ≤ 0,05).
4.3 Yield
4.3.1 Total fresh yield of salad
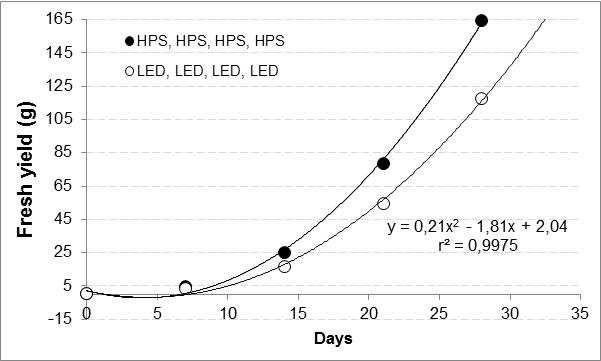
The yield of salad increased during the growth period (Fig. 12). The yield was during all harvests significantly higher when salad received HPS light compared to LED light (Fig. 13, 14, 15, 16, 17). After four weeks, the yield was 28 % lower, when salad was only lightened with LED lights compared to only HPS lights. When salad received not only HPS lights but also at the beginning of the growth period for one week or at the end of the growth period for one or to two weeks LED light, a slightly higher yield was measured compared to the only use of LED lights (Fig. 16).
17
Fig. 12: Development of total yield of red winter salad after weeklyharvests.
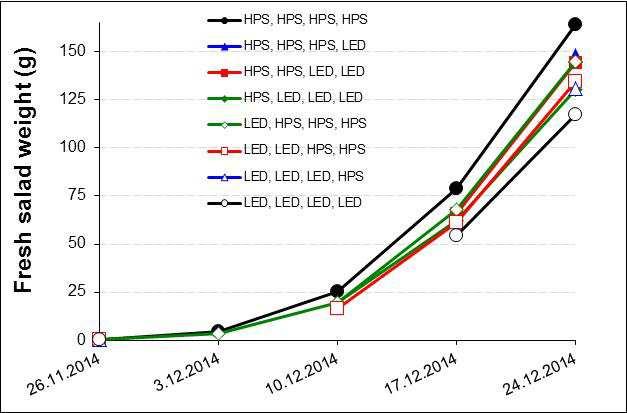
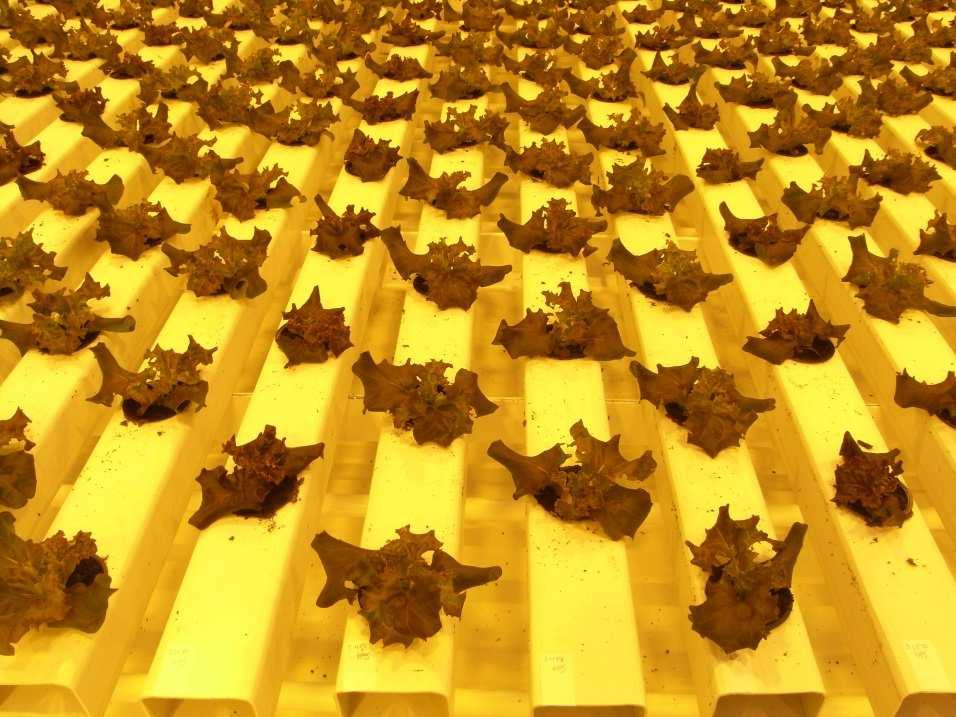
Fig. 13: Total yield for winter salad after one week. Smaller plants are representing plants that received LED lights.
Letters indicate significant differences (HSD, p ≤ 0,05).
18
Fig. 14: Total yield for winter salad after two weeks. Smaller plants are representing plants that received LED lights. Letters indicate significant differences (HSD, p ≤ 0,05).
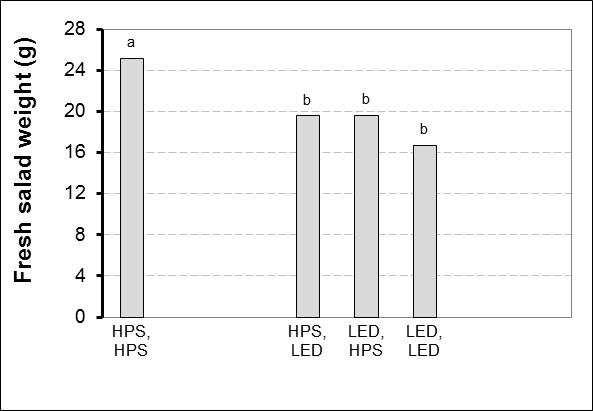
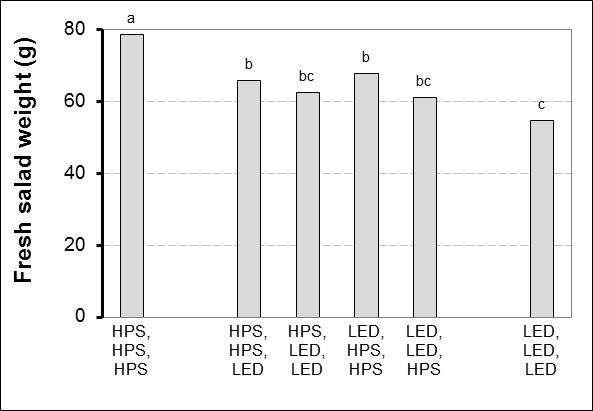
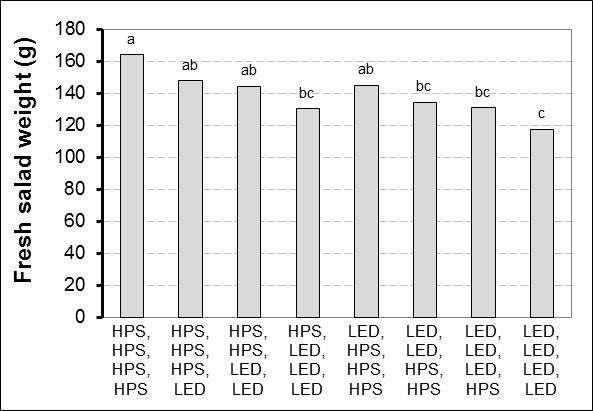
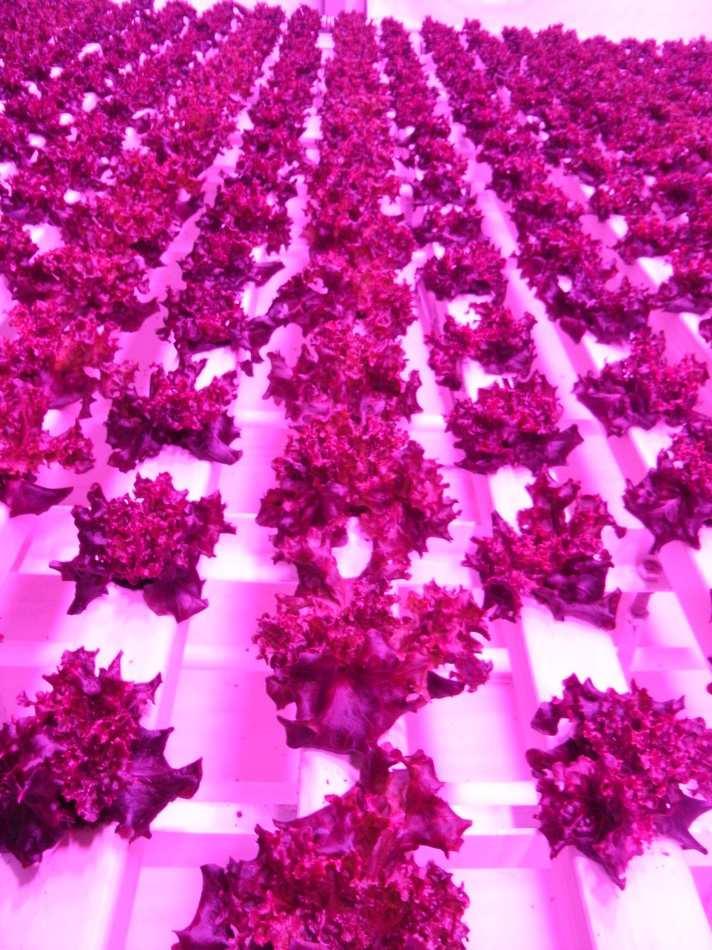
Fig. 15: Total yield for winter salad after three weeks. Letters indicate significant differences (HSD, p ≤ 0,05).
Fig. 16: Total yield for winter salad after four weeks. Letters indicate significant differences (HSD, p ≤ 0,05).
19
Fig. 17: Salad after four weeks.
Letters indicate significant differences (HSD, p ≤ 0,05).
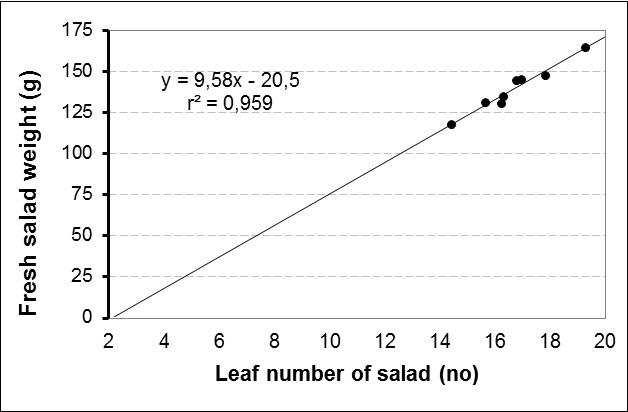
There was a close relationship between the number of leaves and the fresh weight of salad. A higher leaf number involved a higher fresh weight of salad (Fig. 18).
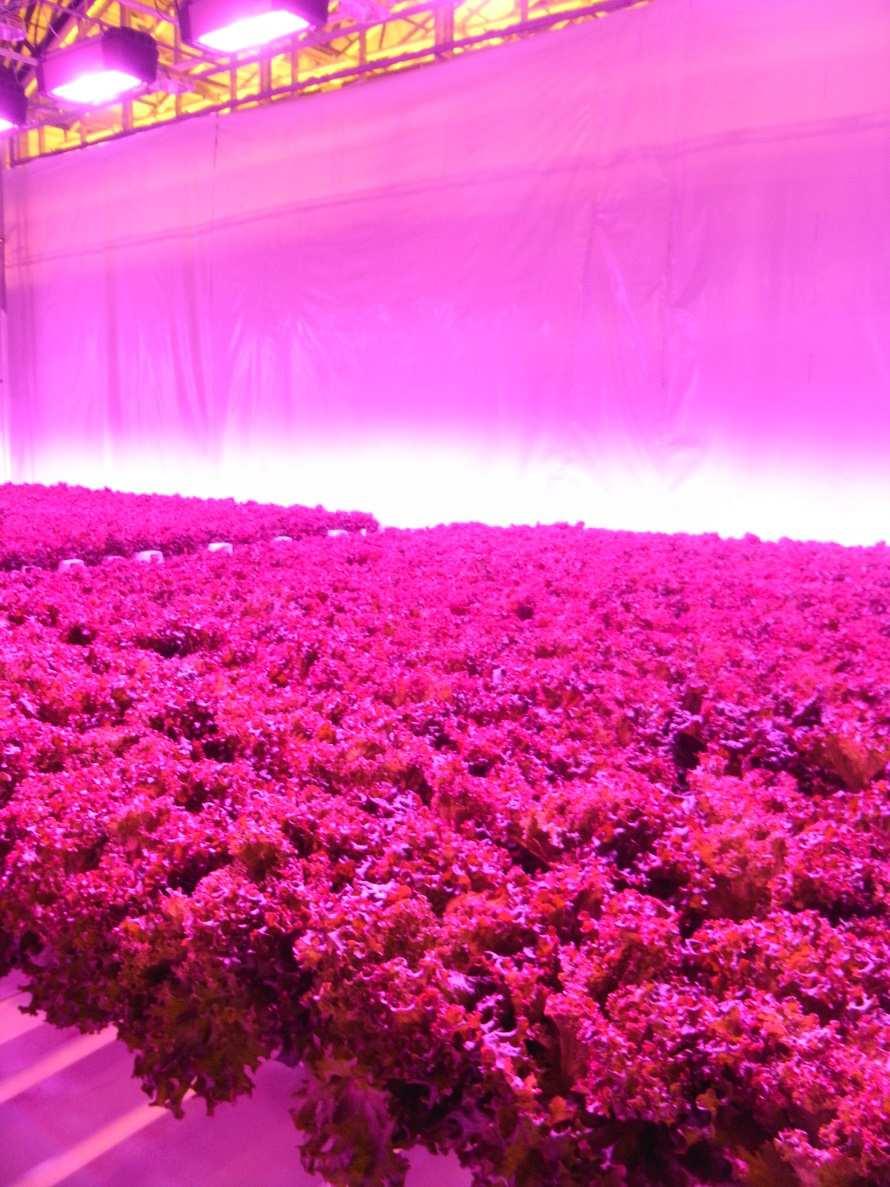
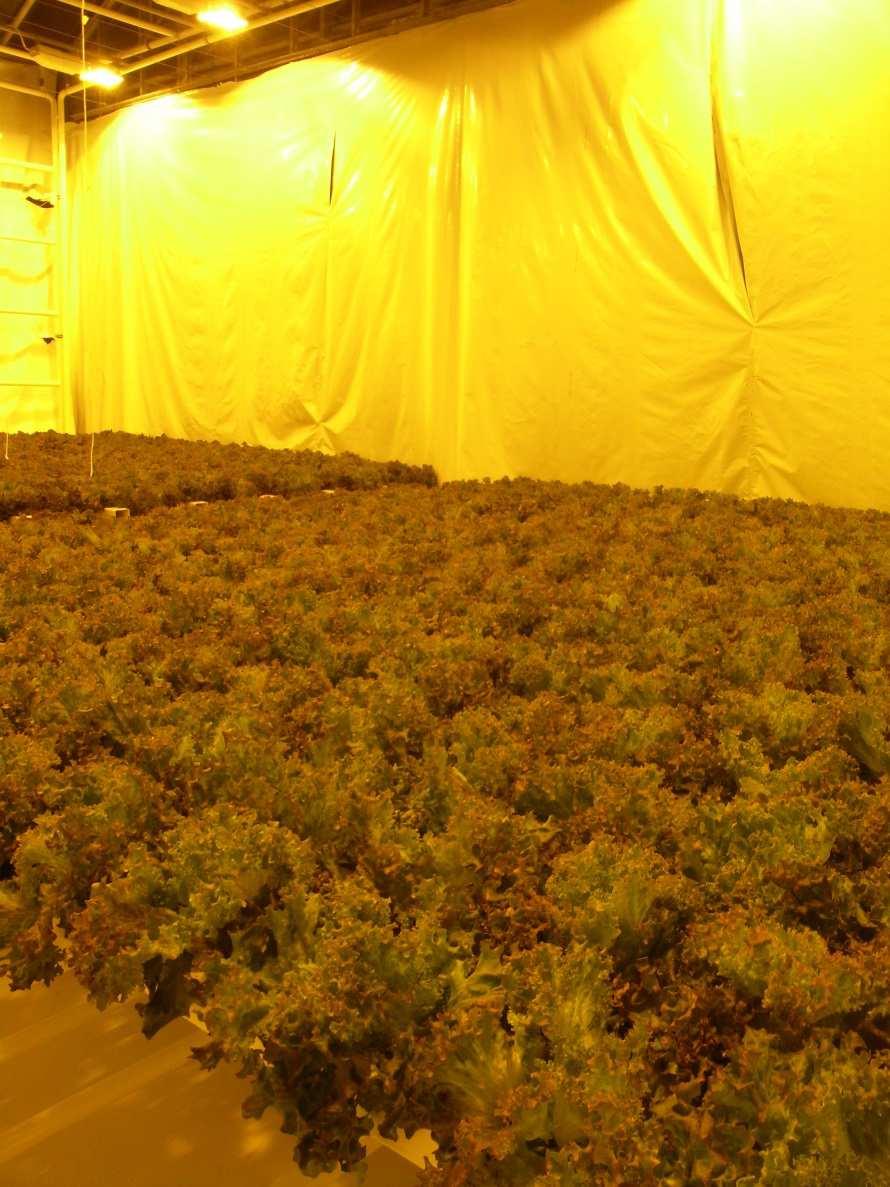
Fig. 18: Relationship between leaf number and fresh weight of salad after four weeks.
20
4.3.2 Interior quality
4.3.2.1 Sugar content
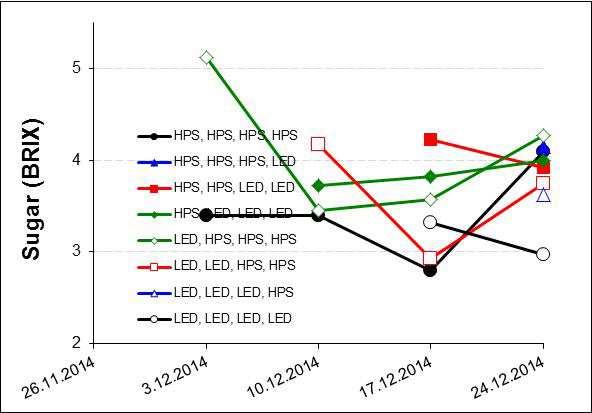
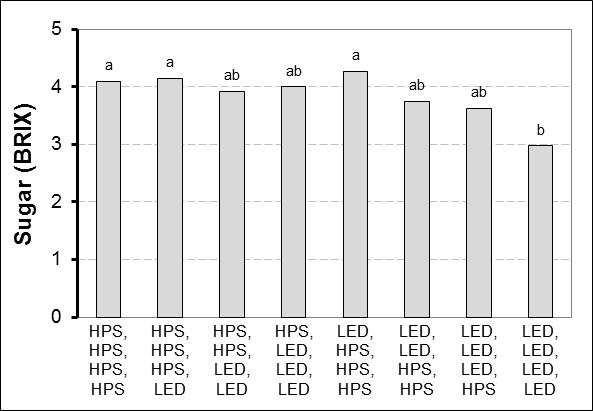
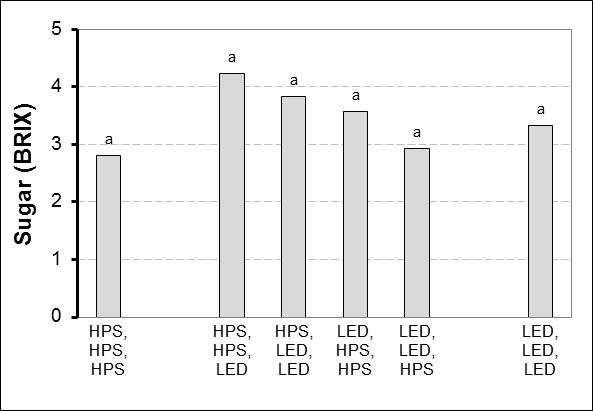
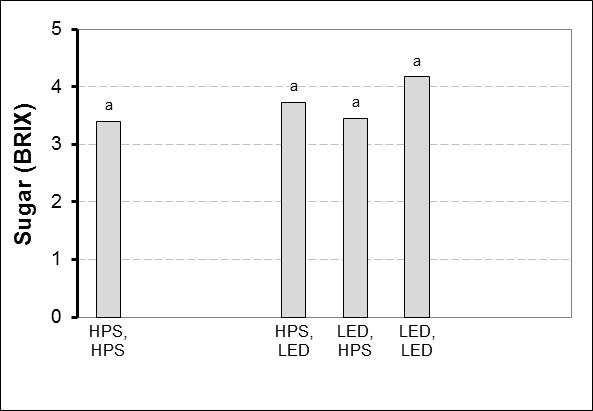
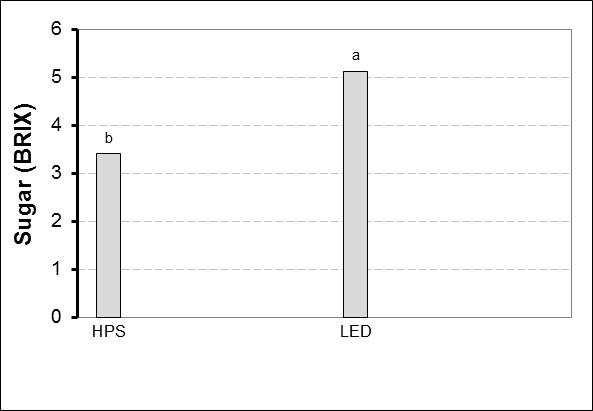
The sugar content was varying very much during the growth period (Fig. 19). At the beginning of the growth period it seemed that sugar content was higher when salad received LED light. The last received light source seems to decide about the sugar content and plants that received HPS light seem to have less sugar. However, at the last harvest date this was not confirmed and it seems rather that plants that received HPS light at the end had a higher sugar content (Fig. 20).
21
Fig.
19: Development of sugar content of salad.
Fig. 20: Sugar content of salad at weeklyharvests.
Letters indicate significant differences (HSD, p ≤ 0,05).
4.3.2.2 Dry substance of salad
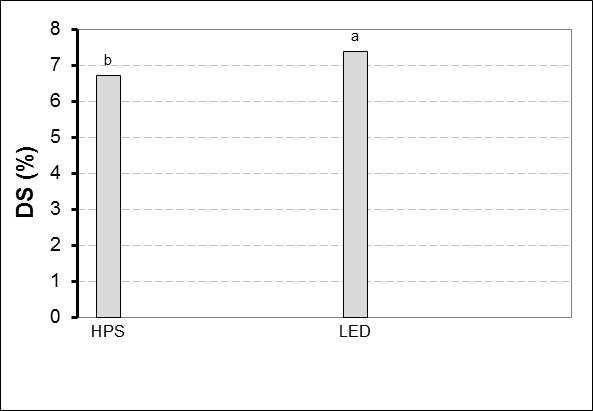
Dry substance (DS) of salad decreased during the growth period from nearly 7 % to about 5 % (Fig. 21). It seems that the treatment with only LED light had a tendentially or even significantly higher dry substance content (Fig. 22).
22
Fig. 21: Development of drysubstance of salad.
Fig. 22: Dry substance of salad at weeklyharvests. Letters indicate significant differences (HSD, p ≤ 0,05).
23
4.3.2.4 Nitrogen content of salad
N content of salad was measured at the end of the growth period and was between 4,0-4,7 % (Fig. 23). The N content increased tendentially with increasing time under LED lights.
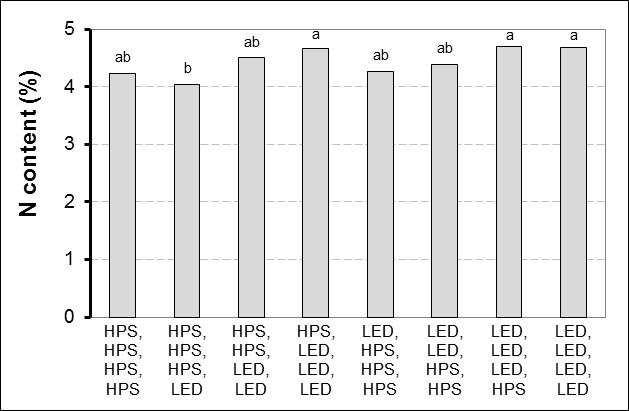
Fig. 23: N content of salad after four weeeks.
4.3.3 Colour of salad
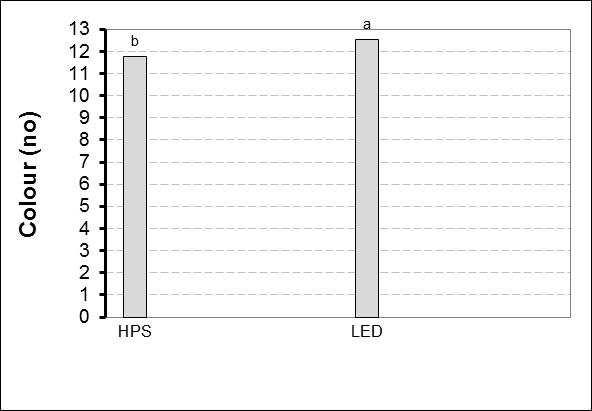
The colour of salad was determined with a colour palette. Colour within one leaf was varying much and the measured colour was supposed to consist of the average colour of the leaf. The colour of the leafes was varying between 9 and 13 (Fig. 24). Number 9 was representing 120 green and 80 red, number 10 was representing 110 green and 90 red, number 11 was representing 100 green and 100 red, number 12 was representing 90 green and 110 red and number 13 was representing 80 green and 120 red. This means, a higher number is representing a higher percentage of red.
24
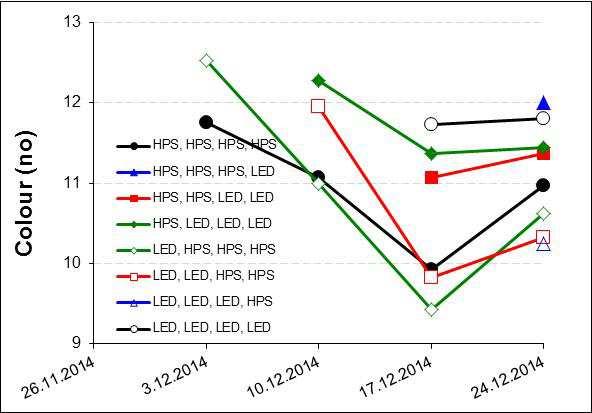
Fig. 24: Development of colour of winter salad.
Already one week after supplemental lighting with LEDs resulted in a more pronounced red colour of winter salad compared to H
Fig. 25: Colour of salad after one week (left: HPS, right: LED).
Letters indicate significant differences (HSD, p ≤ 0,05).
This observation continued, also after two weeks (Fig. 26) and after three weeks (Fig. 27) had plants that received LED lights just before harvest a more pronounced red colour compared to plants that were grown under HPS lights.
25
Fig. 26: Colour of salad after two weeks (left: only HPS, right: onlyLED).
Fig. 27: Colour of salad after three weeks (left: only HPS, right: onlyLED).
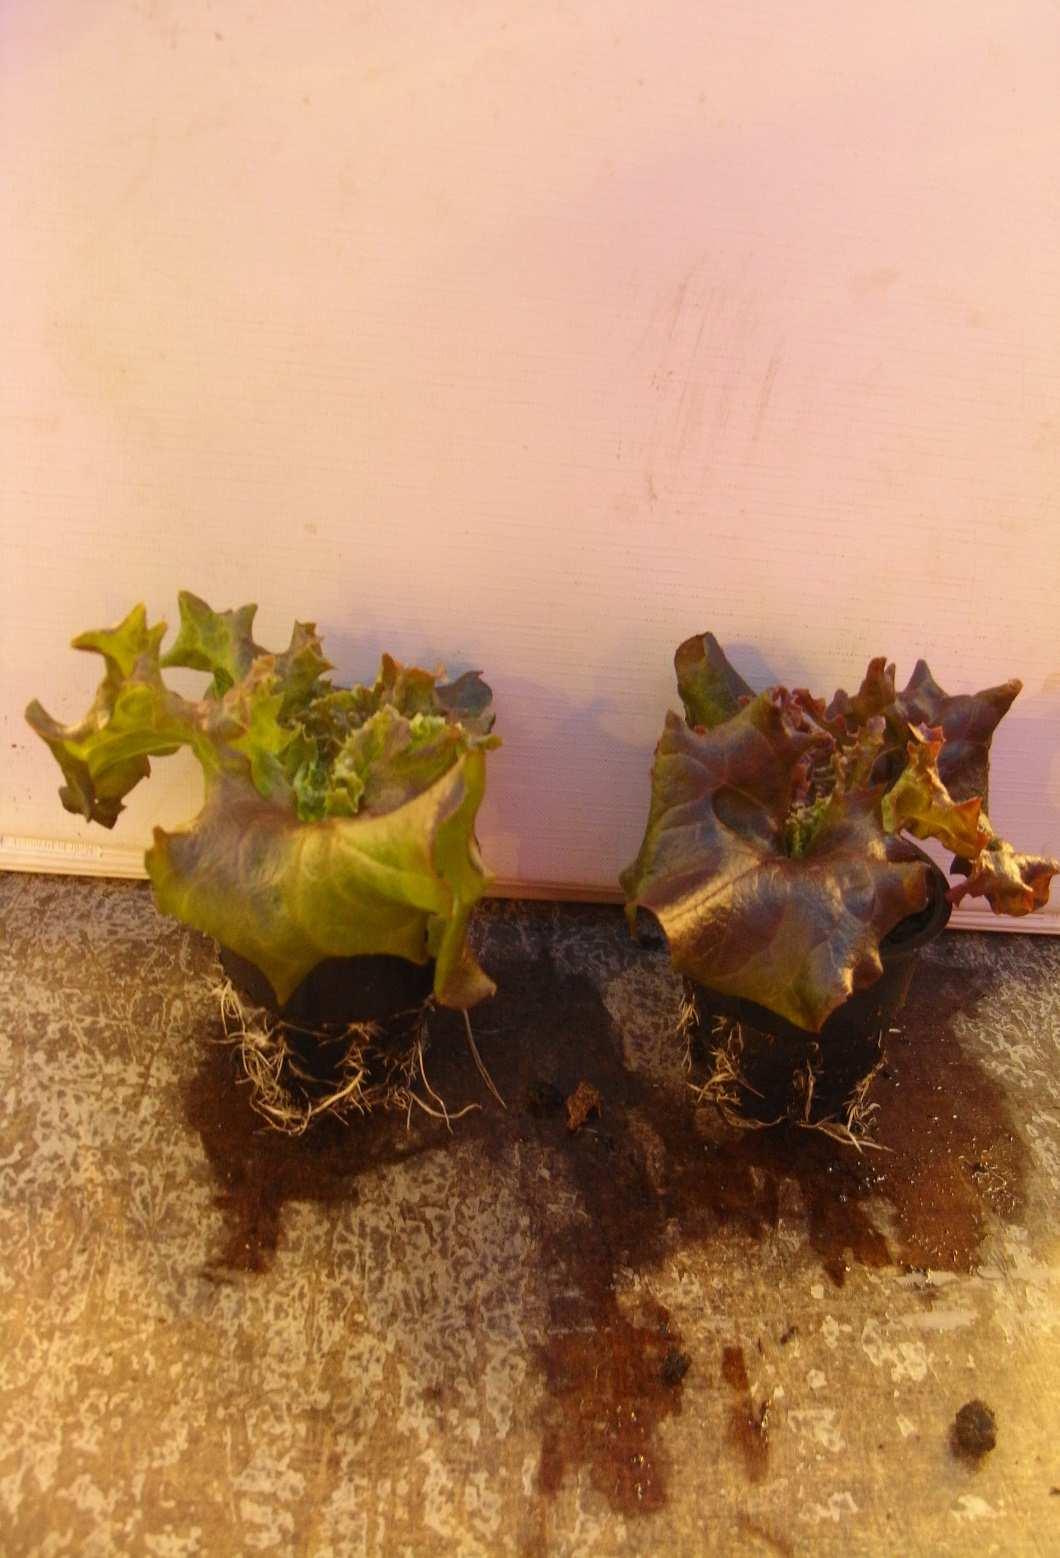
At final harvest (four weeks after planting) had salad a more intensive red colour when the plants were lightened the last week of the growth period or even longer with LED lights (Fig. 28, 29, 30). In contrast, when salad was placed under LED lights at the beginning of the growth period and after that under HPS lights, then salad lost the intensity of colour and was partly less red compared to plants that received only HPS light (Fig. 28, 31, 32).
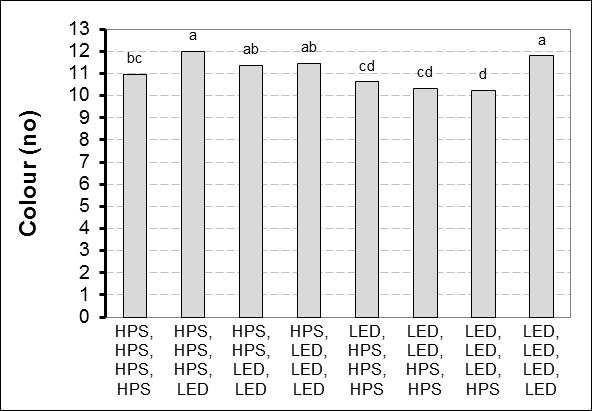
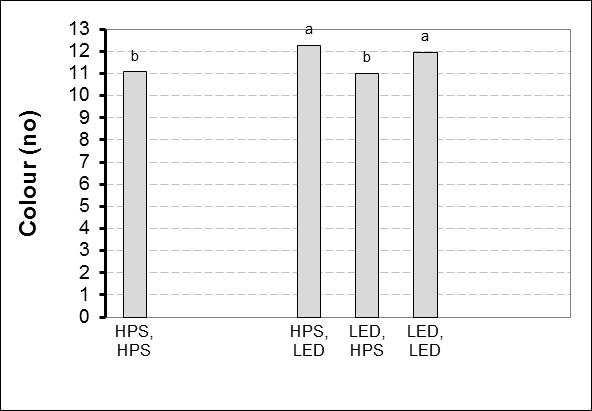
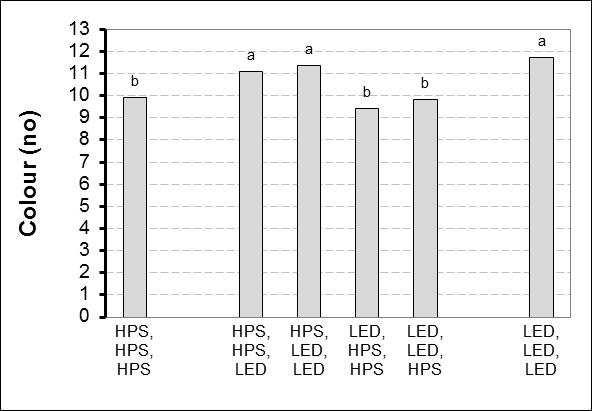
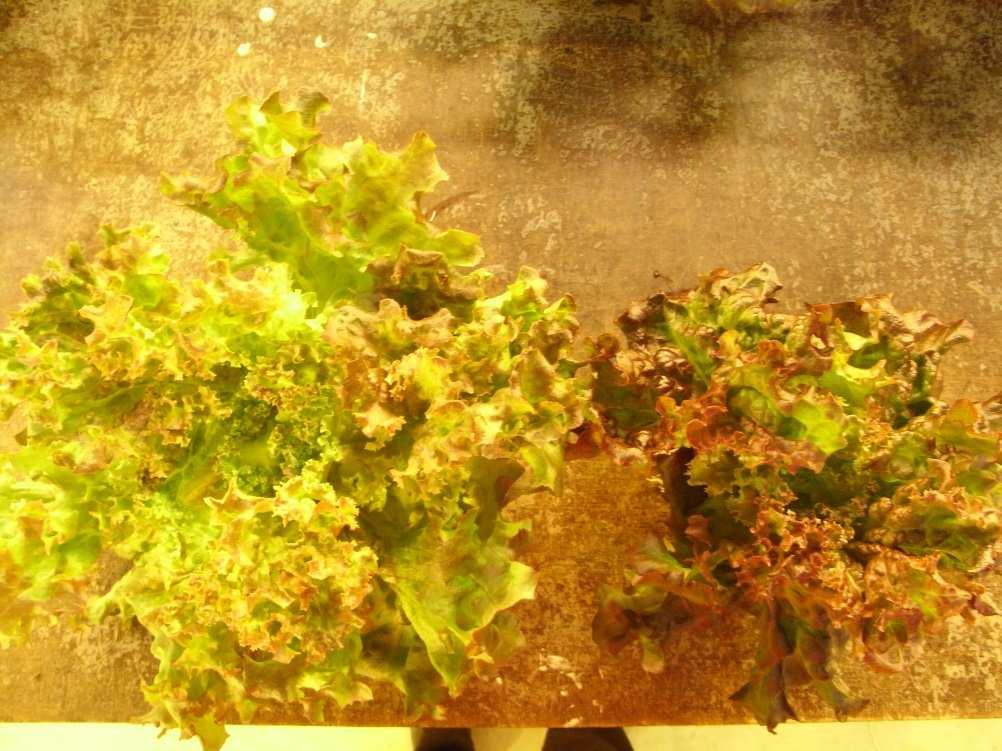
Fig. 28: Colour of salad after four weeks.
26

27
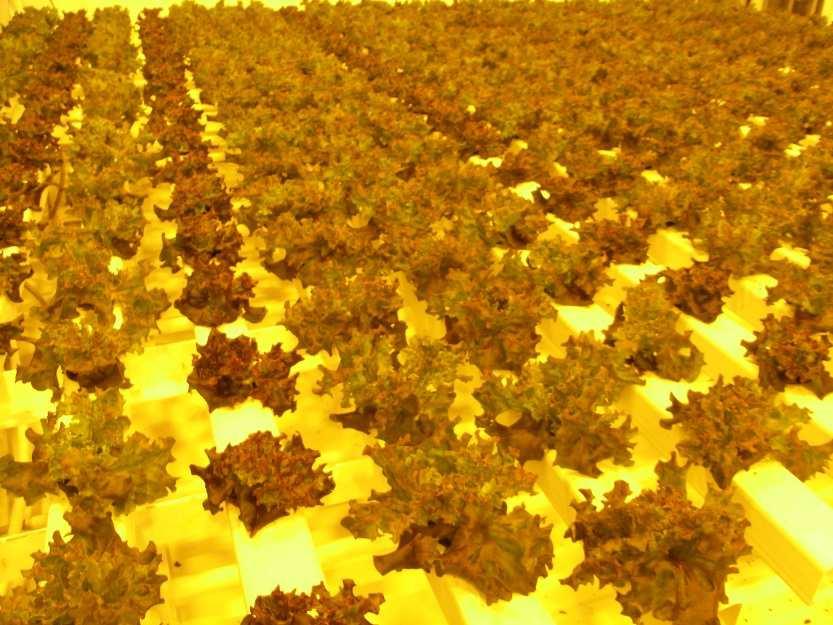
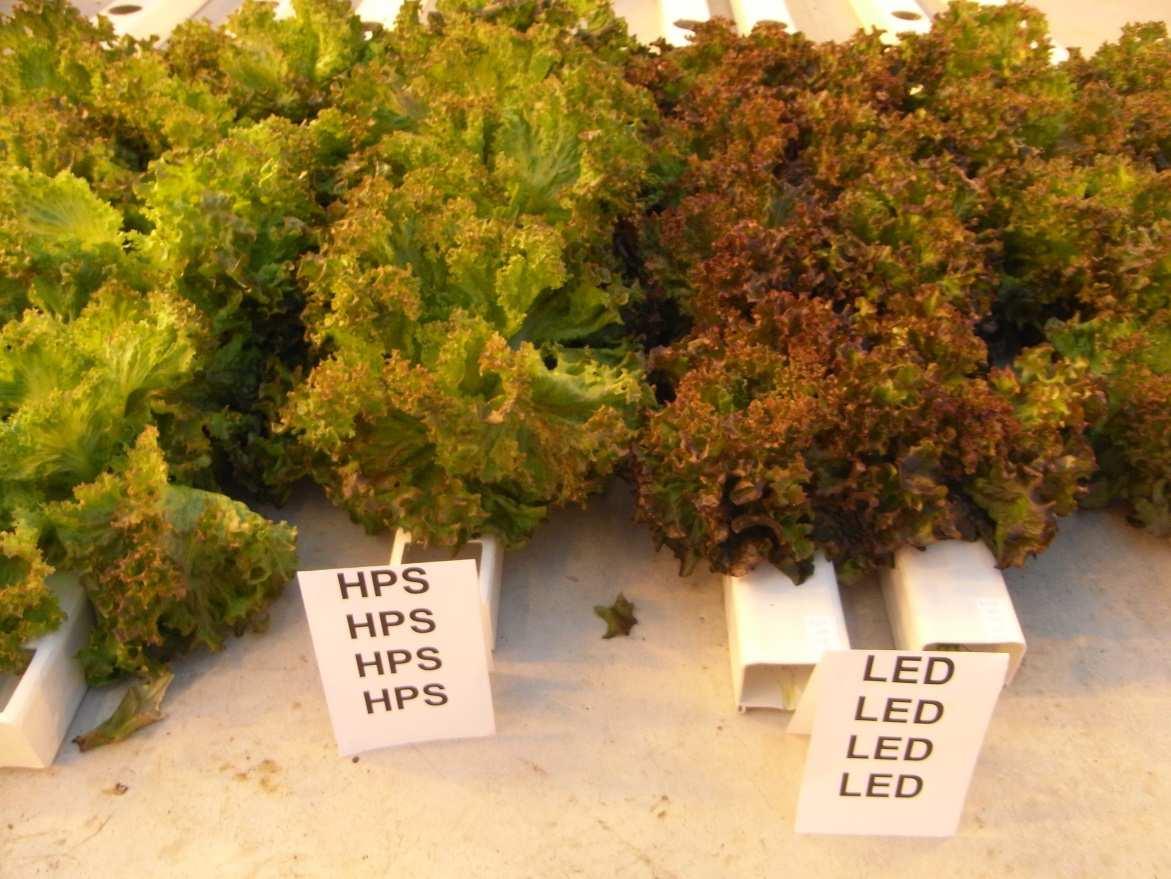
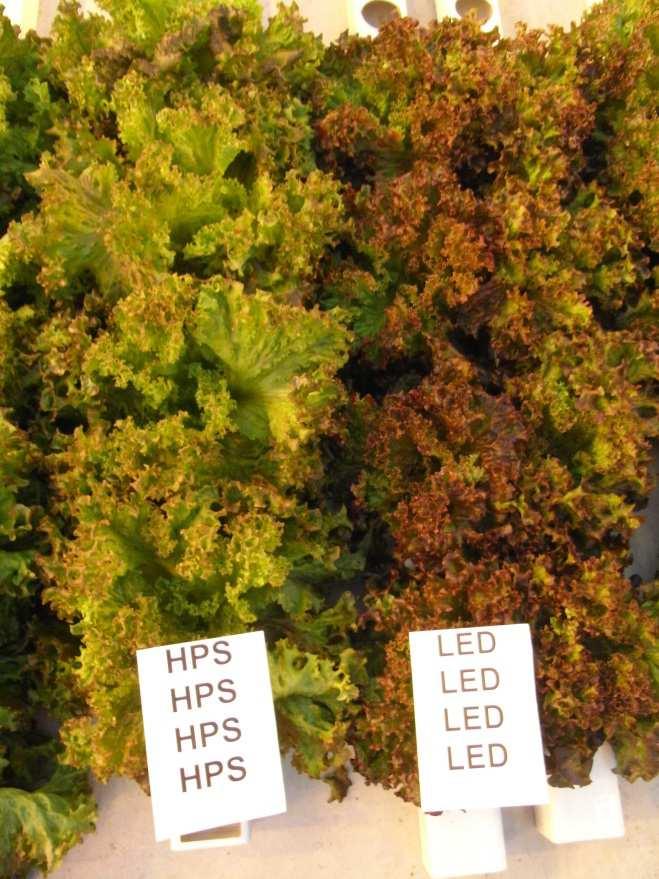
Fig. 29: Colour of salad after four weeks (left: only HPS, right: onlyLED).
Fig. 30: Colour of salad after four weeks for plants that received one week at the end of the growth period HPS or LED lights and three weeks before LED or HPS lights.
28
Fig. 31: Colour of salad after four weeks for plants that received three weeks at the end of the growth period HPS or LED lights and one week before LED or HPS lights.
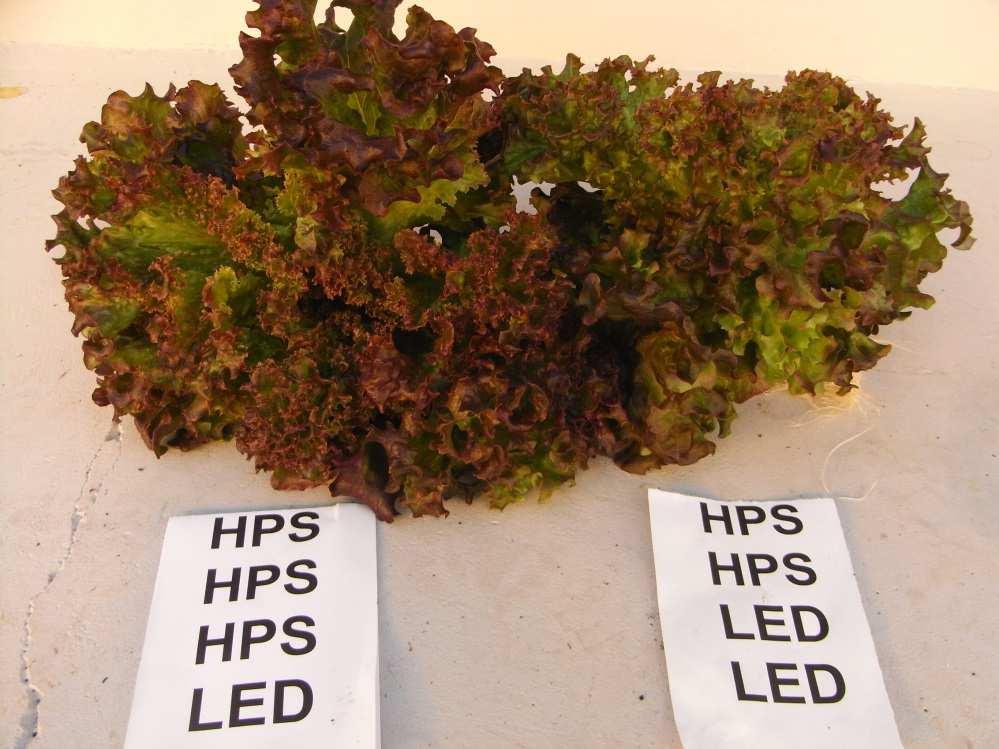
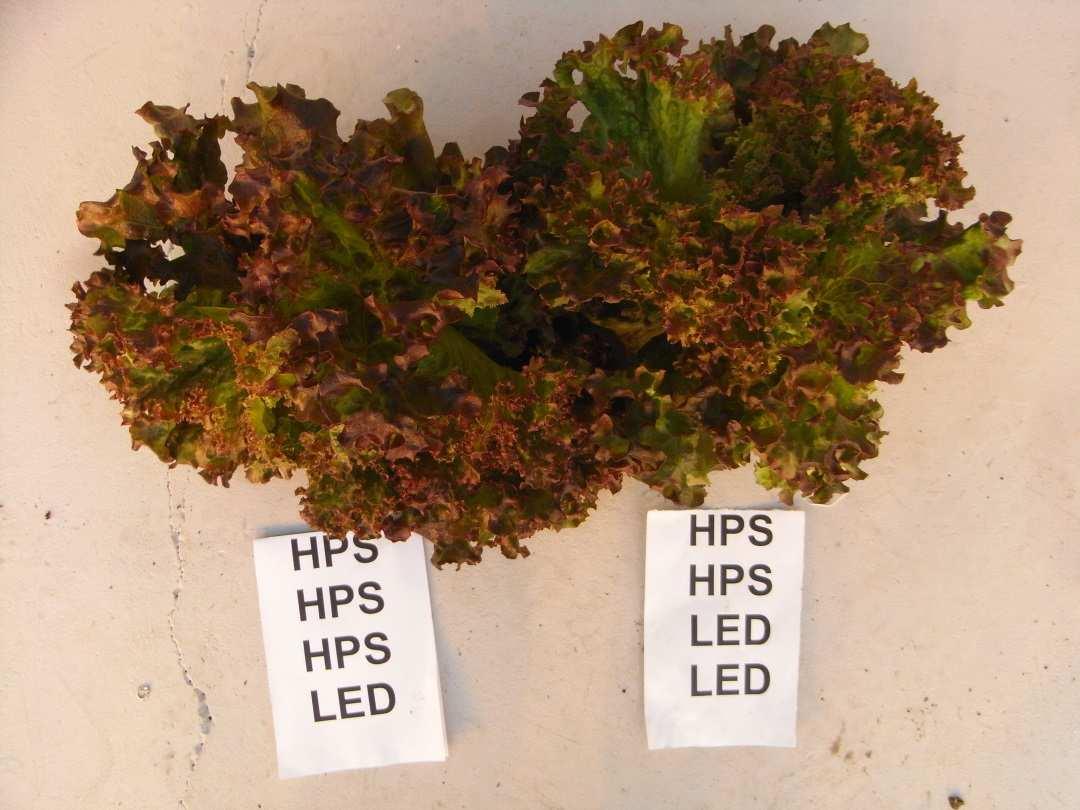
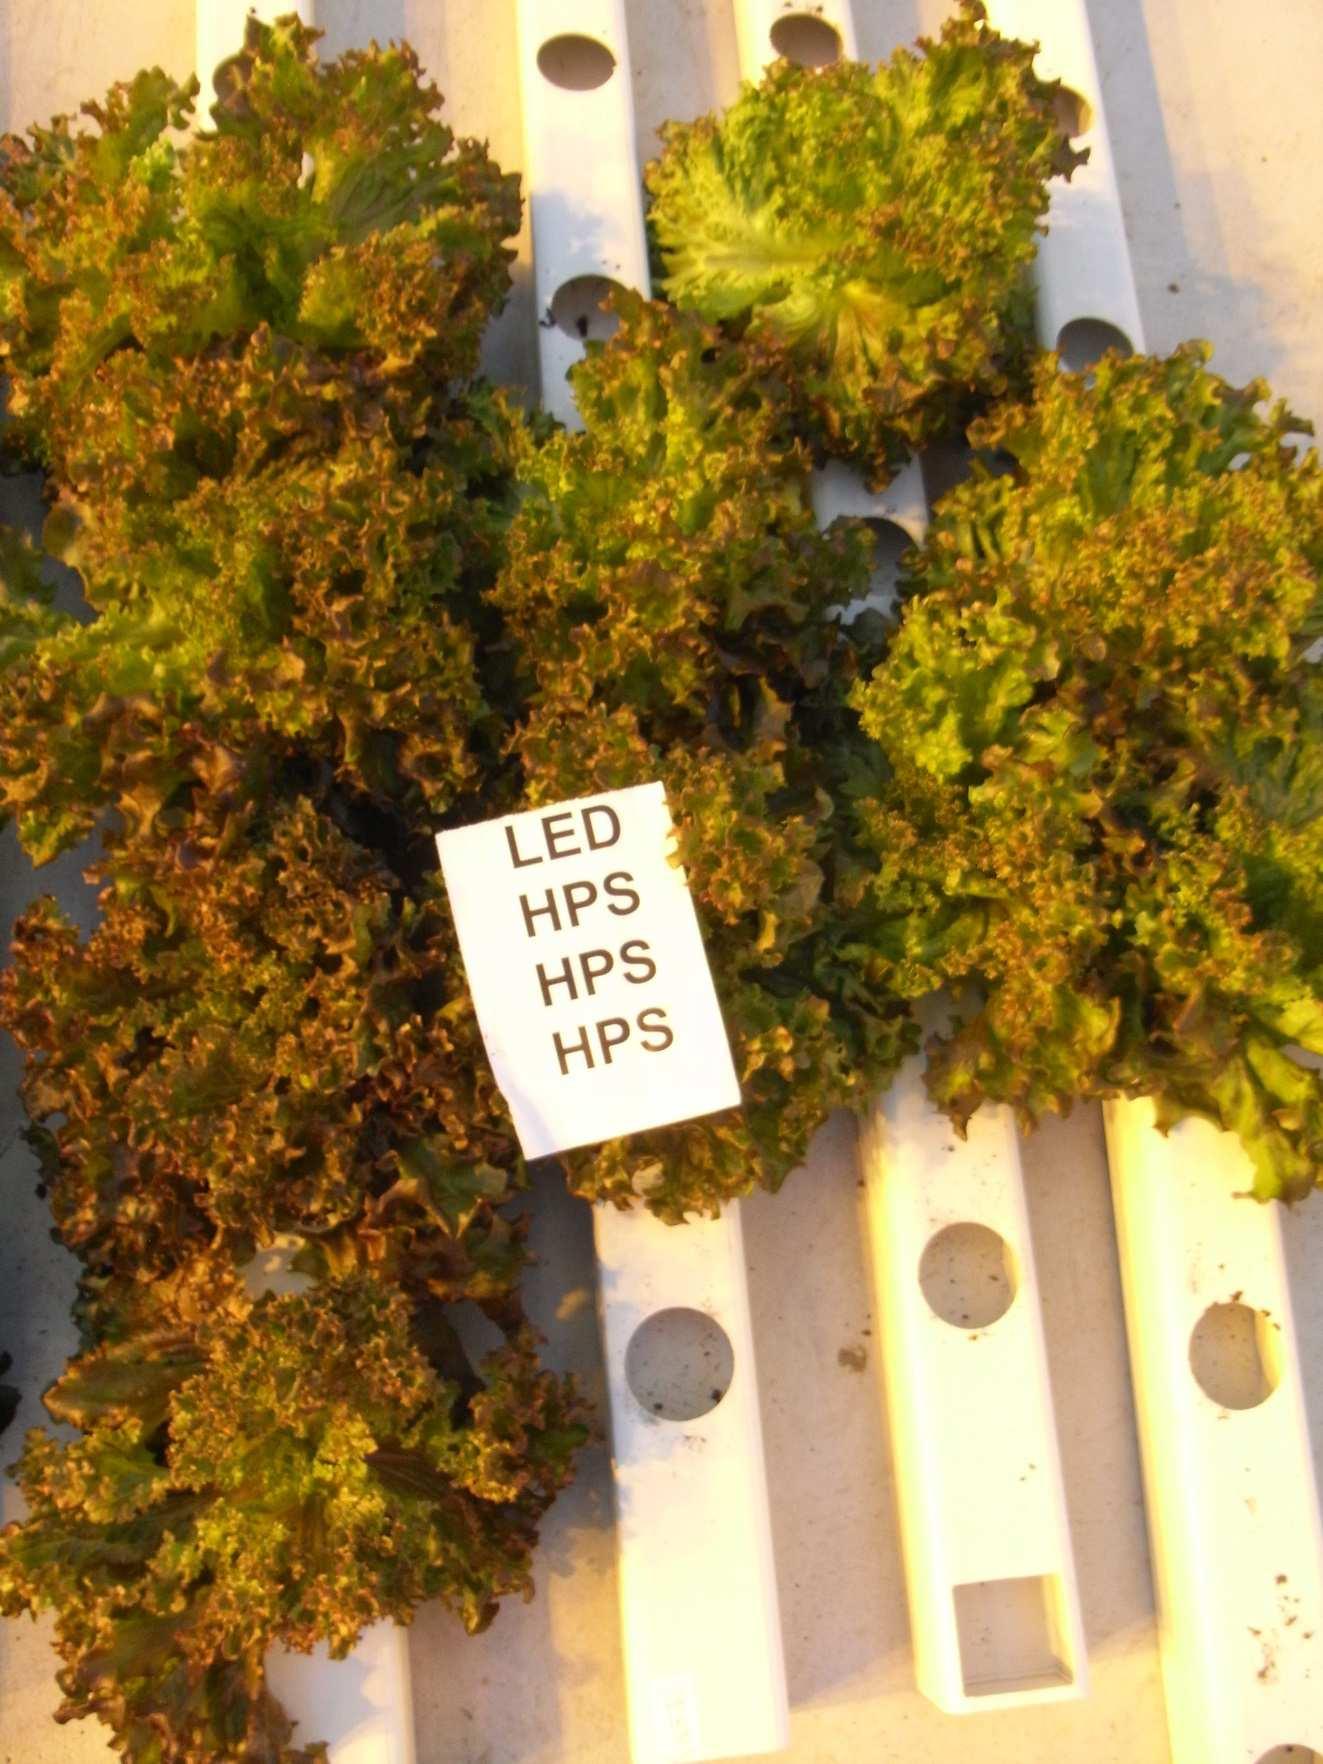
Fig. 32: Colour of salad after four weeks for plants that received one or two weeks at the end of the growth period LED and weeks before HPS light.
29
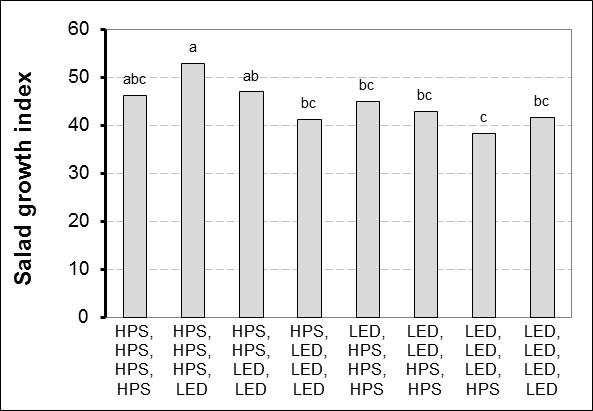
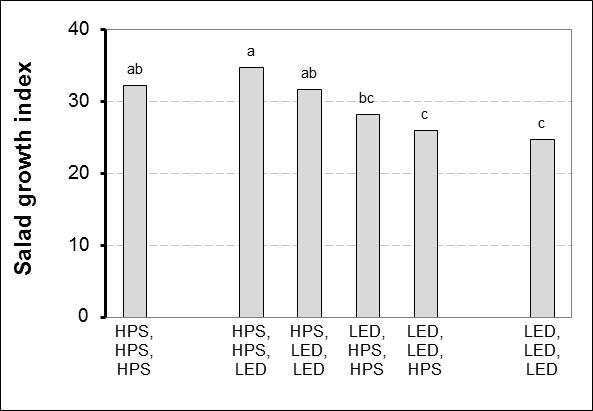
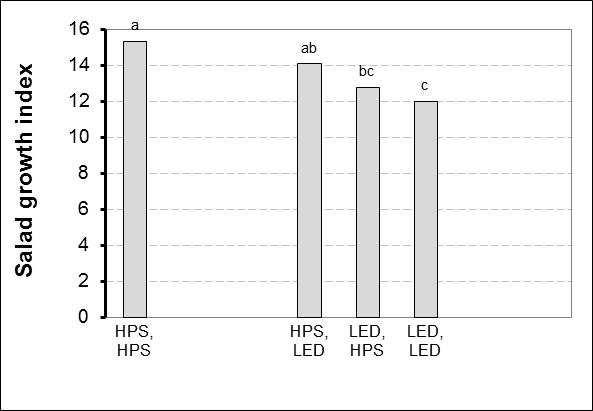
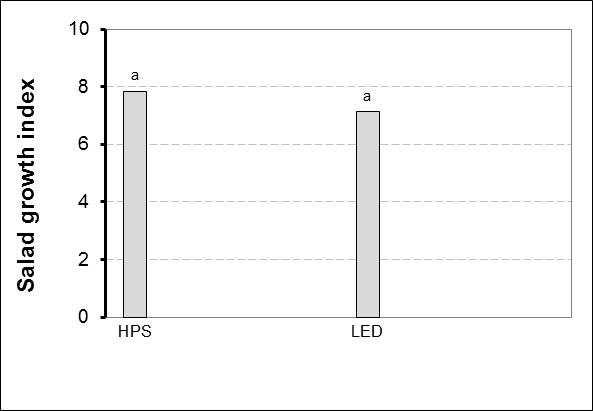
4.3.4 Salad growth index
The salad growth index was calculated by dividing the fresh weight with the hypocothyl length and multiplying this by the dry matter content. The index increased during the growth period (Fig. 33).
The salad growth index was tendentially (first and fourth harvest) or even significantly (second and third harvest) higher when salad was grown under HPS lights (Fig. 34). This is indicating a more good and balanced growth compared to LED lights.
Fig. 33: Development of salad growth index atweeklyharvests.
30
Fig. 34: Salad growth index at weeklyharvests.
Letters indicate significant differences (HSD, p ≤ 0,05).
4.4 Nitrogenuptake
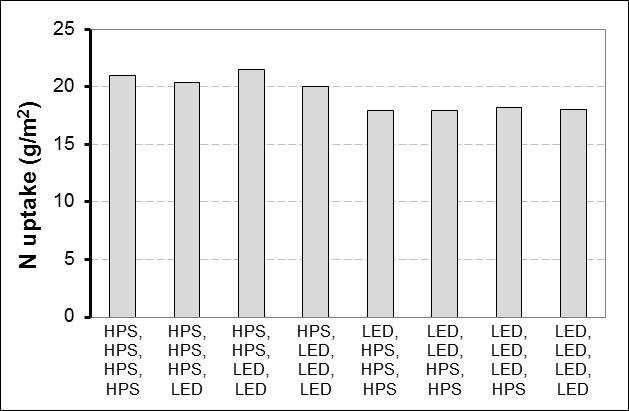
The cumulative N uptake was calculated at the end of the growth period. The N uptake was tendentially higher, when HPS lights were used early in the growth period. In contrast, HPS lights for two or three weeks at the end of the growth period seem to have no effect on the N uptake compared to supplemental lighting with only LED lights (Fig. 35).
31
Fig. 35: Cumulative N uptake of salad after four weeks.
4.5 Economics
4.5.1 Lighting hours
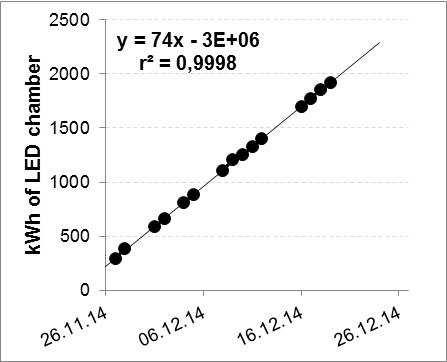
The number of lighting hours is contributing to high annual costs and needs therefore special consideration to consider decreasing lighting costs per kg marketable yield. The total hours of lighting during the growth period of salad were measured with dataloggers. The HPS chamber had a daily usage of 151 kWh, while the LED chamber had with 74 kWh only half the amount (Fig. 36).
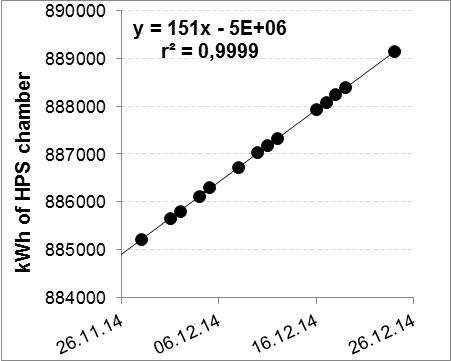
Fig. 36: Used kWh in the different chambers.
32
Lighting hours were for all treatments the same. Naturally, the used kWh increased with a higher use of HPS lights, while the number was lower with more use of LEDs. Therefore, also the energy per squaremeter and the power was lower with a higher use of LEDs (Tab. 4).
Tab. 4: Lighting hours, power and energy in the cabinets for different light treatments (datalogger values).
Treatment Hours Power Energy Energy/m2 h W kWh kWh/m2
HPS, HPS, HPS, HPS 504 168 4.230 85
HPS, HPS, HPS, LED 504 146 3.689 74
HPS, HPS, LED, LED 504 125 3.148 63
HPS, LED, LED, LED 504 103 2.607 52
LED, HPS, HPS, HPS 504 146 3.689 74
LED, LED, HPS, HPS 504 125 3.148 63 LED, LED, LED, HPS 504 103 2.607 52 LED, LED, LED, LED 504 82 2.066 41
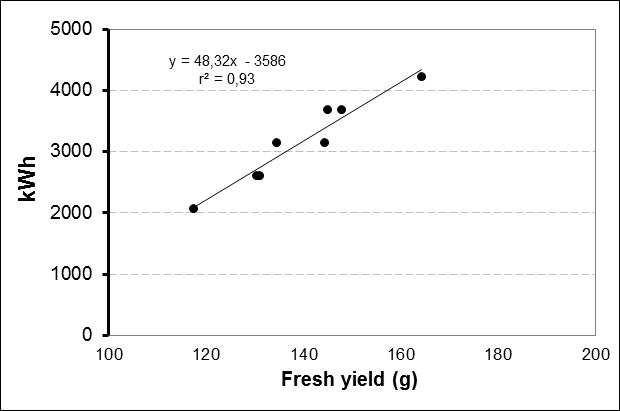
A relation between yield and kWh was found, a high usage of kWh resulted also in a high yield (by using HPS lights), while a low usage of kWh resulted in a low yield (by using LED lights) (Fig. 37).
Fig. 37: Relationship between yield and kWh.
33
However, when salad was only lightened with LED lights, significantly more yield was reached per kWh compared to only HPS lights (Fig. 38). That means that by using LED lights, the kWh’s were transferred better into yield. The utilisation of kWh’s was also significantly higher when HPS lights were used only for one week either at the beginning or at the end of the growing period compared to the only use of HPS lights. However, the use of LED lights for either one week or two weeks was statistically comparable to the only use of HPS lights (Fig. 38).

Fig. 38: Yield per kWh.
To be able to get the same yield (164 g) as with only HPS lighting after 28 days, salad plants need to be grown 32 days with only LED lights (Fig. 39, Tab. 5). That means that the greenhousearea would be for four days more in use to get the same yield. However, in this case the used energy and the energy per yield with LED lights were nearly only half of the amount as with the only use of HPS lights (Tab. 5).
34
Fig. 39: Relationship between growing time and yield - calculation scenarios.
Tab. 5: Days to harvest and used energy. Treatment Days to get 164 g Energy Energy/yield d kWh kWh/g yield HPS, HPS, HPS, HPS 28 4.230 0,0388 LED, LED, LED, LED 32 2.361 0,0696
4.5.2 Energyprices
Since the application of the electricity law 65/2003 in 2005, the cost for electricity has been split between the monopolist access to utilities, transmission and distribution and the competitive part, the electricity itself. Most growers are, due to their location, mandatory customers of RARIK, the distribution system operator (DSO) for most of Iceland except in the Southwest and Westfjords (Eggertsson, 2009).
RARIK offers basically three types of tariffs:
a) energy tariffs, for smaller customers, that only pay fixed price per kWh, b) “time dependent” tariffs (tímaháður taxti, Orkutaxti TT000) with high prices during the day (09.00-20.00) at working days (Monday to Friday) but much lower during the night and weekends and summer, and
35
c) demand based tariffs (afltaxti AT000), for larger users, who pay according to the maximum power demand.
In the report, only afltaxti is used as the two other types of tariffs are not economic. Since 2009, RARIK has offered special high voltage tariffs (“VA410” and “VA430”) for large users, that must either be located close to substation of the transmission system operator (TSO) or able to pay considerable upfront fee for the connection.
Costs for distribution are divided into an annual fee and costs for the consumption based on used energy (kWh) and maximum power demand (kW) respectively the costs at special times of usage. The annual fee is pretty low for “VA210” and “VA230” when subdivided to the growing area and is therefore not included into the calculation. However, the annual fee for “VA410” and “VA430” is much higher. Growers in an urban area in “RARIK areas” can choose between different tariffs. In the report only the possibly most used tariffs “VA210” and “VA410” in urban areas and “VA230” and “VA430” in rural areas are considered.
The government subsidises the distribution cost of growers that comply to certain criteria’s. Currently 87 % and 92 % of variable cost of distribution for urban and rural areas respectively. This amount can be expected to change in the future.
For calculation of the power, different electric consumptions were made, because the actual consumption is higher than the nominal value of the bulb: one was based on the power of the lamps (nominal Watts, 0 % more power consumption), one with 6 % more power consumption and one for 10 % more power consumption. Based on this percentage of subsidy and the lighting hours (Tab. 6), for a salad production only under HPS lights or only under LED lights, the energy costs per m2 were calculated (Tab. 6). The energy costs per kWh for distribution after subsides are around 0,7-1,5 ISK/kWh for „VA210”,„VA230” and for „VA410” and 0,5-1,0 ISK/kWh for „VA430”. The energy costs for sale are for „Afltaxti” around 7,1-12,4 ISK/kWh and for „Orkutaxti” around 7,7-8,1 ISK/kWh. Cost of electricity was higher for the calculated values. In general, tariffs for large users rendered lower cost.
36
Tab. 6: Costs for consumption of energy for distribution and sale of energy for growing onlyunder HPS respectively LED
for consumption
ISK/kWh
ment
RARIK Urban
VA210
VA410
RARIK Rural
VA430
SALE
with
37
lights. Costs
Energy
Energy costs
subsidy per m2 ISK/m2 Treat-
HPS LED HPS LED real calculated real calculated real calculated real calculated DISTRIBUTION
87%subsidyfromthestate
1,540,761,540,76135 46 49 50 66 31 33 34
1,440,671,440,67127 40 43 44 62 28 29 30
92%subsidyfromthestate VA230 1,460,761,460,76129 46 49 51 63 31 33 35
1,000,531,000,5388 32 34 35 43 22 23 24
Afltaxti Orkutaxti 12,35 8,14 7,11 7,74 12,35 8,14 7,11 7,74598 408 432 448 293 279 295 306 Comments: The first number for the calculated value is with 0 % more power consumption, the second value with 6 % more power consumption and the last value with 10 % more power consumption. Prices are from April 2015.
4.5.3
Costs of electricityin relation to yield
Costs of electricity in relation to g yield for wintergrown salad were calculated (Tab. 7). While for the distribution several tariffs were possible, for the sale only the cheapest tariff was considered. The costs of electricity increased by 5 % (calculated values) respectively by 46 % (real values) with the only use of HPS lights compared to the only use of LED lights due to a higher yield but higher use of electricity. Tab. 7: Variable costs of electricityin relation to yield. Variable costs of electricity per kg yield
Yield (kg/m2)
Urban area (Distribution + Sale) VA210 733
359 310 328 341 VA410
355 306 325 337 Rural area (Distribution + Sale) VA230 727
356 310 328 341 VA430
300 318 330
4.5.4 Profit margin
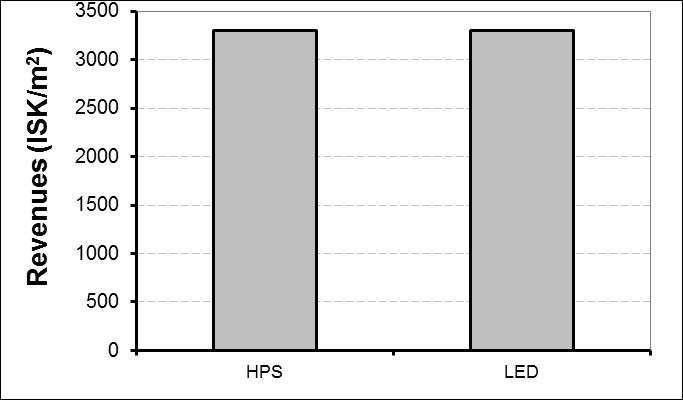
The profit margin is a parameter for the economy of growing a crop. It is calculated by substracting the variable costs from the revenues. The revenues itself, is the product of the price of the sale of the salad and the salad heads per squaremeter. For each head of salad, growers are getting about 150 ISK from Sölufélag garðyrkjumanna (SfG). The number of heads / m2 is the same independent of the lighting treatments and therefore, also the revenues are equal (3.300 ISK/m2) between treatment when differences in yield are unconsidered (Fig. 40).
38
ISK/kg Treatment HPS,HPS,HPS,HPS LED,LED,LED,LED
3,6 2,6 real calculated real calculated
453 481 499
725 448 475 493
454 481 499
686 439 466 483 336
Fig. 40: Revenues at different treatments.
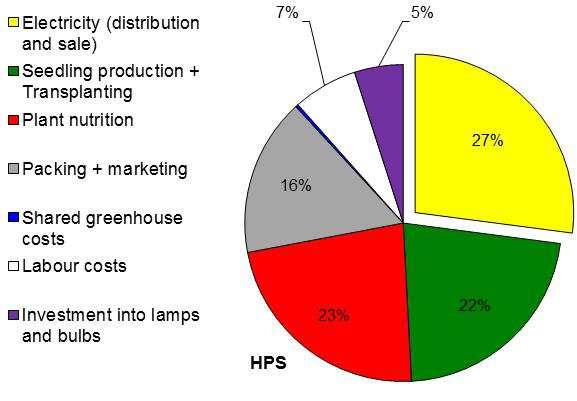
When considering the results of previous chapter, one must keep in mind that there are other cost drivers in growing salad than electricity alone (Tab. 6). Among others, this are e.g. the costs for seeds and seedling production and transplanting (≈ 600 ISK/m2), costs for plant nutrition (≈ 600 ISK/m2), the rent of the green box (≈ 100 ISK/m2), material for packing (≈ 250 ISK/m2), and transport costs from SfG (≈ 100 ISK/m2) and investment into lamps and bulbs (≈ 200 ISK/m2) (Fig. 41).
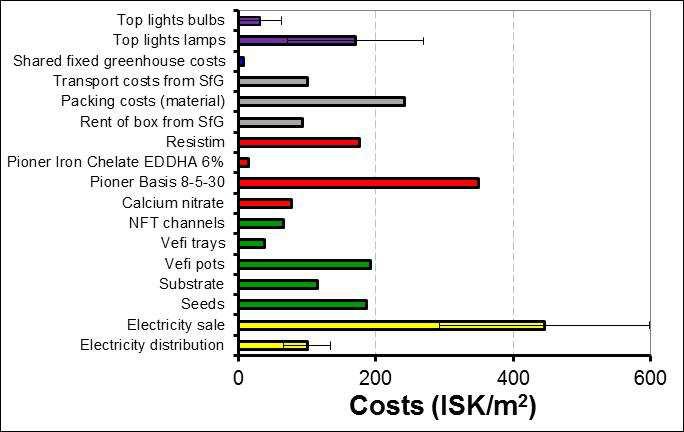
Fig. 41: Variable and fixed costs (without labour costs).
39
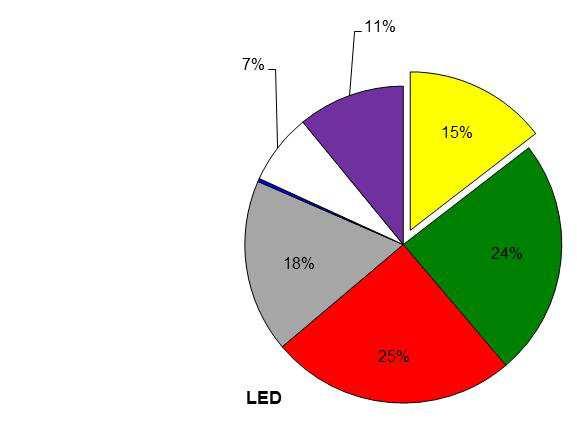
Fig. 42: Division of variable and fixed costs.
However, in Fig. 41 labour costs are not include in constrast to Fig. 42 and it is obvious, that especially the electricity, the seedling production and transplanting, the plant nutrition as well as packing and marketing are contributing much to the variable and fixed costs. When LED lights are the only light source, the percentage of costs for electricity on total costs is decreased, while the percentage of the other costs on total costs increased.
A detailed composition of the variable costs at each treatment is shown in Tab. 8.
40
Profit margin of winter salad at different treatments (urban area, VA210)
Treatment
Marketable heads/m
HPS, HPS, HPS, HPS LED, LED, LED, LED
Sales
SfG(ISK/head)
Revenues (ISK/m
Variable and
Electricitydistribution
(ISK/m
Vefipots
Vefitrays
NFTchannels
Calciumnitrate
PionerBasis8-5-30
PionerIronChelateEDDHA6%
Resistim
RentofboxfromSfG
Packingmaterial
TransportfromSfG
variable costs
Revenues
41 Tab. 8:
.
2 22 22
1 150 150
2) 3.300 3.300
fixed costs
2)
2 135 66 Electricitysale 598 293 Seeds 3 186 186 Substrate 4 97 97
5 193 193
6 46 46
7 67 67
8 78 78
9 349 349
10 15 15
11 176 176
12 94 94
13 242 242
14 101 101 Sharedfixedcosts 15 8 8 Lamps 16 71 270 Bulbs 17 63 ∑
2.530 2.291
-∑ variable and fixed costs 770 1.009 Workinghours(h/m2) 0,13 0,13 Salary(ISK/h) 1.352 1.352 Labourcosts(ISK/m2) 178 178 Profit margin (ISK/m2) 592 831 1 price winter 2013/2014: 150 ISK/head 2 assumption: urban area, tariff “VA210”, no annual fee (according to datalogger values) 3 23.588 ISK / 5.000 Carmoli seeds 4 Substrate 620 pH 6,0 (B2S) 320 l, 6.150 ISK / bag 5 Vefi 306 pots: 3.240 / box, 15.804 ISK / box 6 Vefi 606 trays: 9x6 holes / tray, 36 trays / box, assumption: life time 10 times, 22.554 ISK / box 7 NFT channels: 7 cm width, 21 cm between holes, 1.001 ISK/m, assumption: life time 10 years, 12 circles / year 8 2.500 ISK / 25 kg Calcium nitrate 9 8.938 ISK / 25 kg Pioner Basis 8-5-30 10 95.313 ISK / 25 kg Pioner Iron Chelate EDDHA 6 % 11 18.000 ISK / 10 l Resistim 12 85 ISK / 20 head box 13 packing costs (material for one head of salad): plastic film: 10 ISK / head, label: 1 ISK / head 14 transport costs from SfG: 4,60 ISK / head 15 94 ISK/m2/year for common electricity, real property and maintenance
HPS lights: 30.000 ISK/lamp, life time: 8 years, assumption: 12 circles / year LED lights: 13.8368 ISK/lamp, life time: 8 years, assumption: 12 circles / year
HPS bulbs: 4.000 ISK/bulb, life time: 2 years, 12 circles / year
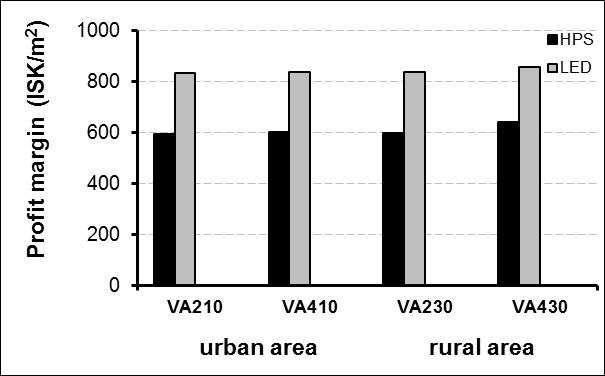
The profit margin was dependent on the treatment (Fig. 43) and lowest (600 ISK/m2) with the only use of HPS lights. However, the profit margin rose to more than 800 ISK/m2 with the only use of LED lights. That means, the only use of LED lights increased profit margin. A larger use (higher tariff: “VA 410” compared to “VA 210”) did not unfluence profit margin in the urban area. In contrast, in a rural area, a higher profit margin was gained with a higher tariff (compare “VA 430” with “VA 230”). This small advantage of rural areas was due to the state subsidies.
Fig. 43: Profit margin in relation to tariff and treatment.
However in the calculation of the profit margin was not taken the fresh weight of the salad heads into account. The fresh weight after lighting with only LED lights was about 28 % reduced compared to the only use of HPS lights. When salad grown under LED lights would be sold with the same weight as when grown under HPS lights, the growing period would increase by four days (Fig. 39). The costs of electricity for distribution and sale for a 164 g heavy head would be 733 ISK/m2 with the only use of HPS light and 410 ISK/m2 with the only use of LED lights. This would result in a profit margin of 592 ISK/m2 for HPS and 779 ISK/m2 for LED (Tab. 9).
42 16
17
Assuming, two days would pass between harvest and transplanting, more than 12 circles of growing salad heads would be possible under HPS lights and nearly 11 circles under LED lights. That would lead to a total profit margin per year of 7.199 ISK/m2 for salad grown under HPS lights and 8.367 ISK/m2 under LEDs. Meaning, lighting salad with LEDs would elongate the growing period by four days, but would result in an around 15 % higher profit margin over the year than when lighting with HPS lights.
Tab. 9: Calculation scenarios of profit margin per year. Treatment HPS, HPS, HPS, HPS LED, LED, LED, LED
Days to get 164 g/head
Costs for electricity (distribution + sale) to get 164 g/head (ISK/m2)
Profit margin with a fresh yield of 164 g/head
Number of days between circles from harvest to transplanting
Possible circles per year with 164 g/head (no)
Profit margin after possible circles per year
43
28 32
733 410
592 779
2 2
12,2 10,7
7.199 8.367
DISCUSSION
5.1 Yield and electricityconsumption in dependence of lighting source
The yield of salad was compared with different lighting sources. Irradiation with LED light suppressed leaf growth and yield of salad during the whole growth period. However, the electricity consumption was lower than that of salad treated with HPS lights. After 28 days with different lighting treatments, the fresh weight was highest for salad plants under HPS lights and about 28 % lower for plants under LED lights. In contrast, the electricity consumption could be reduced by about 50 % with LEDs. Similar values measured Pinho et al. (2012) with an electricity consumption of 256 kWh for LEDs and 429 kWh for HPS lights. However, the fresh weight yield of salad (HPS: 219,8 g, LED: 219,0 g) was not dependent on the lighting source, which was in contrast to the presented results. Also, Martineau et al. (2012) measured under HPS and LED lights during a photoperiod of 18 h a similar shoot biomass of salad, even though the average total light irradiance amounted 72,3 µmol/m2/s for HPS and 35,8 mmol/m2/s for LED, respectively. When measured on an energy basis, the LED lamps provide an energy savings of at least 33,8 %.
Sirtautas et al. (2014) evaluated the effect of combination of LEDs and HPS lighting on the growth of salad and found that the 470 nm light had a higher specific leaf area value and resulted in increased plant mass per leaf area.
In the presented experiment was the LED light not used with full power. Therefore, the question is also, if it would be possible to increase the yield of salad grown under LED lights by increasing the used kWh. In addition, the temperature of the leaves and the roots was about 1-3 °C lower in the LED chamber than in the HPS chamber. It is known that the temperature is also influencing growth. It can therefore be expected that by increasing the leaf and root temperature in the LED chamber to the same value as in the HPS chamber, a faster growth would be induced. Both, increasing kWh and temperature in the LED chamber, would possibly result in a higher yield and in a better energy use efficiency.
44 5
5.2
Colour in dependence of the lighting source
The red colour of salad was triggered by the use of LED lights. After one week or even more weeks exposure to LED lights at the end of the growing period, the salad was noticeably redder than plants that received HPS lights. This was due to a higher content of anthocyanins that enhance the red colour in salad and with that improves the external quality and marketability of the product (Rodriguez et al., 2014). Also, Juntunen & Riihimäki, (2011) observed a stronger red colour with salad with LED lights.
However, induction with LEDs for more than one week gave no redder colour compared to only one week LED lights. Therefore, only a short time (one week) under LEDs is enough to induce red colouring and with that anthocyanin synthesis. With that, the quality of red salad could be improved, however, with a reduction in growth and yield.
It can be assumed that a combination of lighting with HPS and LED lights at the same time would increase yield while red colouring would be also triggered and in addition electricity savings could possibly be expected when compared to the only use of HPS lights and need to be investigated in future experiments.
5.3 Profit margin in dependence of the lighting source
The profit margin was increased with the only use of LED lights compared to the only use of HPS lights. However, it took four days more to get the same yield. In the calculation scenarios presented in Tab. 9 only the additional costs for the electricity were taken into account, while for example costs for plant nutrition were not changed. It can be expected that these costs will not change much, as the plant nutrition costs in Tab. 8 would be expected to be lower for the treatment with only LEDs compared to the treatment with only HPS lights, but would be comparable after reaching 164 g. However, to be able to evaluate the profit margin in dependence of the lighting source better, it would be necessary to use not only data loggers for the used electricity, but also how much plant nutrition goes into each treatment. In addition, the profit margin is very much dependent on the price of the LED lights. Therefore, the presented results can only give an overview, but are most likely not presenting the reality.
45
5.4
Future speculations concerning energyprices
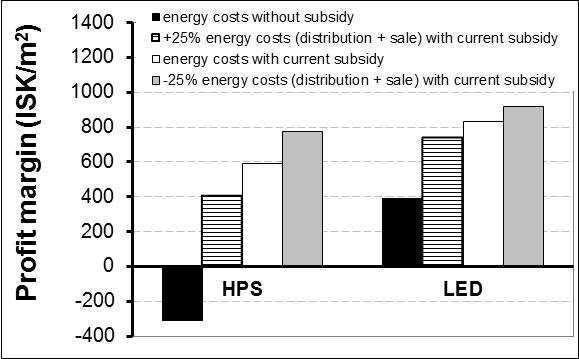
In terms of the economy of lighting – which is not looking very promising from the growers’ side – it is also worth to make some future speculations about possible developments. So far, the lighting costs are contributing to about ¼ of the production costs. In the past and present there have been and there are still a lot of discussions concerning the energy prices. Therefore, it is necessary to highlight possible changes in the energy prices (Fig. 44). The white columns are representing the profit margin according to Fig. 43. Where to be assumed, that growers would get no subsidy from the state for the distribution of the energy, that would result in a profit margin of -300 ISK/m2 for the HPS and 400 ISK/m2 for LED treatment (black columns, Fig. 44). Without the subsidy of the state, probably less Icelandic grower would produce salad over the winter months. When it is assumed that the energy costs, both in distribution and sale, would increase by 25 %, but growers would still get the subsidy, then the profit margin would range between 400 ISK/m2 for the HPS and 700 ISK/m2 for the LED treatment (dotted columns). When it is assumed, that growers have to pay 25 % less for the energy, the profit margin would increase to 800 and 900 ISK/m2 for HPS and LED, respectively (gray columns).
Fig. 44: Profit margin in relation to treatment – calculation scenarios (urban area, VA210).
46
From these scenarios it can be concluded that from the grower’s side it would be preferable to get subsidy to be able to get a higher profit margin and grow salad over the winter.
5.5 Recommendations for increasing profit margin
The current economic situation for growing salad necessitate for reducing production costs to be able to heighten profit margin for salad production over the winter. On the other hand side, growers have to think, if salad should be grown during low solar irradiation and much use of electricity.
It can be suggested, that growers can improve their profit margin of salad by:
1. Getting higher price for the salad
It may be expected to get a higher price, when consumers would be willing to pay more for Icelandic salad than imported ones. Growers could also get a higher price for salad with direct marketing to consumers (which is of course difficult for large growers).
2. Decrease plant nutrition costs
Growers can decrease their plant nutrition costs by mixing their own fertilizer. When growers would buy different nutrients separately for a lower price and mix out of this their own composition, they would save fertilizer costs.
3. Decrease packing costs
The costs for packing (material) from SfG and the costs for the rent of the box are high. Costs could be decreased by using less or cheaper packing materials. The growers could also try to find other channels of distribution (e.g. selling directly to the shops and not over SfG).
4. Efficient employees
The efficiency of each employee has to be checked regularly and growers will have an advantage to employ faster workers. Growers should also check the user-friendliness of the working place to perform only minimal manual operations. Very often operations can be reduced by not letting each employee doing each task, but to distribute tasks over employees. In total, employees will work more efficiently due to the specialisation.
47
5. Decrease energy costs
- Lower prices for distribution and sale of energy (which is not realistic).
- Growers should check if they are using the right RARIK tariff and the cheapest energy sales company tariff. Unfortunately, it is not so easy, to say, which is the right tariff, because it is grower dependent.
- Growers should check if they are using the power tariff in the right way to be able to get a lowered peak during winter nights and summer (max. power -30 %). It is important to use not so much energy when it is expensive, but have a high use during cheap times.
- For large growers, that are using a minimum of 2 GWh it could be recommended to change to “stórnotendataxti” in RARIK and save up to 35 % of distribution costs.
- It is expected, that growers are cleaning their lamps to make it possible, that all the light is used effectively and that they are replacing their bulbs before the expensive season is starting.
- Aikman (1989) suggests to use partially reflecting material to redistribute the incident light by intercepting material to redistribute the incident light by intercepting direct light before it reaches those leaves facing the sun, and to reflect some light back to shaded foliage to give more uniform leaf irradiance.
48
CONCLUSIONS
In conclusion, the results indicate that growing salad under HPS lights is useful in promiting the growth of salad plants after transplanting. Salad showed a clear response to an increase in LED lighting compared to HPS lighting by increasing red colour and reducing growth and fresh yield. However, the electricity consumption was better transferred into yield and gave also a higher profit margin, even though four more days would be necessary under LEDs to get a yield that is comparable to the one with HPS lighting. Therfore, from the economic side it seems to be recommended to use LED lights.
Growers should pay attention to possible reduction in their production costs for salad other than energy costs.
As discussed, further experiments with a higher use of kWh and a higher temperature in the LED chamber as well as a combination of lighting with HPS lights and LEDs had to be tested before final conclusions and recommendations can be made.
7 REFERENCES
AIKMAN DP, 1989: Potential increase in photosynthetic efficiency from the redistribution of solar radiation in a crop. J. Exp. Bot. 40, 855-864.
BROWN CS, SCHUERGER AC, SAGER JC, 1995: Growth and photomorphogenesis of pepper plants under red light-emitting diodes with supplemental blue or far-red lighting. J. Amer. Soc. Hort. Sci. 120, 808-813.
BULA RJ, MORROW EC, TIBBITTS TW, BARTA DJ, IGNATIUS RW & MARTIN TS, 1991: Light-emitting diodes as a radiation source for plants. HortScience 26, 203-205.
EGGERTSSON H, 2009: Personal communication (Notice in writing) from Haukur Eggertsson, Orkustofnun, October 2009.
HOENECKE ME, BULA RJ, TIBBITTS TW, 1992: Importance of “blue” photon levels for lettuce seedlings grown under red-light-emitting diodes. Hort Sci. 27, 427430.
49 6
JUNTUNEN K, RIIHIMÄKI MA, 2011: Ruukkuvojammestuotannon kehittäminen –LED-valaistuksen hyödyntäminen. HAMK university, óbirt.
KRIZEK DT, MIRECKI RM, BRITZ SJ, HARRIS WG, THIMIJAN RW, 1998: Spectral properties of microwave sulfur lamps in comparison to sunlight and high pressure sodium/metal halide lamps. Biotronics 27, 69-80.
MARTINEAU V, LEFSRUF M, NAZNIN MT, KOPSELL DA, 2012: Comparison of light –emitting diode and high-pressure sodium light treatmetns for hydroponics growth of Boston lettuce. HortScience 47 (4): 477-482.
PINHO P, HYTÖNEN T, RANTANEN M, ELOMAA P, HALONEN L, 2013: Dynamic control of supplemental lighting intensity in a greenhouse environment. Lighting Res. Technol. 45, 295-304.
RODRIGUEZ C, 2012: Effekt av lyskvalitet på vekst og innholdsstoffer i salat. Universitetet for miljØ- og biovitenskap. Masteroppgave 60.
RODRIGUEZ C, TORRE S, SOLHAUG KA, 2014: Low levels of ultraviolet-B radiation from fluerescent tubes induce an efficient flavonoid synthesis in Lollo Rosso lettuce without negative impact on growth. Acta Agriculturae Scandinavica, Section B – Soil & Plant Science 64 (2), 178-184.
SCHUERGER AC, BROWN CS, STRYJEWSKI EC, 1997: Anatomical features of pepper plants (Capsicum annum L.) grown under red light-emitting diodes supplemented with blue or far-red light. Ann. Bot. 79, 273-282.
SIRTAUTAS R, VIRSILE A, SAMUOLIENE G, BRAZAITYTE A, MILIAUSKIENE J, SAKALAUSKIENE S, DUCHOVSKIS P, 2014: Growing of leaf lettuce (Lactuca sativa L.) under hight-pressure sodium lamps with supplemental blue, cyan and green LEDs. Zemdirbyste-Agriculture 101 (1): 75-78
TAMULAITIS G, DUCHOVSKIS P, BLIZNIKAS Z, BREIVE K, ULINSKAITE R, BRAZAITYTE A, NOVICKOVAS A, ZUKAUSKAS A, 2005: High-power lightemitting diode based facility for plant cultivation. J. Phys. D: Appl. Phys. 38, 3182-3187.
VALOYA, 2013: http://www.valoya.com/document-repository/brochures-and-guides/ document/valoya-the-story-of-a-leafy-green-lifepdf, sótt: 22.09.2014.
50
LED chamber
HPS chamber
Seedling production
Date tasks observations problems tasks observations problems tasks observations problems
10. nov. preparing mold, filling pots, watering (down, above)
nov. sowing, covering pots with plastic, 19°C
nov.
nov.
14. nov.
uncovering, 19°/ 15°C (day / night), watering (down) with fertilizer, light from 05-23.00
nov. watering
nov.
nov.
nov. watering
nov. red colour visible
nov.
nov.
nov. watering
nov.
25. nov. planting into chamber planting into chamber
26. nov. starting with light treatment at 5.00, harvest start point starting with light treatment at 5.00, harvest start point
nov. already after 1 day much more red colour!
nov.
nov.
nov.
01. dec.
02. dec.
plants are looking much smaller compared to HPS
irrigation changed to 2 1/2h from 1. to 2. irrigation, 6 h from 2. to 3. and so on
irrigation changed to 2 1/2h from 1. to 2. irrigation, 6 h from 2. to 3. and so on
03. dec. 1. harvest
04. dec.
dec.
irrigation changed to 2 1/2h from 1. to 2. irrigation, 4 h from 2. to 3. and so on
plants are much more "hard" when touching them compared to HPS plants, brownish colour 1. harvest
irrigation changed to 2 1/2h from 1. to 2. irrigation, 4 h from 2. to 3. and so on
plants are more green than LED plants, but in colour measurements it it just 1 colour difference
1 8 APPENDIX
11.
12.
13.
15.
16.
17.nov. 18.
19.
20.
21.
22.
23.
24.
27.
28.
29.
30.
05.
51
06. dec.
07. dec.
08. dec. irrigation changed to 2 1/2h, watering at nights at 01:00
09. dec.
10. dec. 2. harvest
11. dec. irrigation changed to 2 h 10 min interval, 8 min irrigation
12. dec.
13. dec.
14. dec.
15. dec.
16. dec.
more red colour from plants that were the week before under LEDs is not visible any more compared to plants that just got HPS light
irrigation changed to 2 1/2h, watering at nights at 01:00
taste difference has decreased compared to last week 2. harvest
irrigation changed to 2 h 10 min interval, 8 min irrigation
irrigation changed to 2 1/2h, 10 min interval, watering at nights at 01:00
17. dec. 3. harvest, irrigation changed to 2 h, interval 8 min, watering at nights at 01:00, ammonium nitrat added
irrigation changed to 2 1/2h, 10 min interval, watering at nights at 01:00
3. harvest, irrigation changed to 2 h, interval 8 min, watering at nights at 01:00, ammonium nitrat added
18. dec.
irrigation mixing tank started leaking fixed, but not able to use for 24 h, other tank used instead
19. dec.
irrigation changed to 1 h interval, 20 min irrigation at 11.00 am, watering at nights at 01:00, using the complete mixing tank again
irrigation changed to 1 h interval, 20 min irrigation at 11.00 am, watering at nights at 01:00, using the complete mixing tank again
irrigation mixing tank started leaking fixed, but not able to use for 24 h, other tank used instead
20. dec.
21. dec.
22. dec.
irrigation changed to 1 h interval, 12 min irrigation at 11.00 am, watering at nights at 01:00
irrigation changed to 1 h interval, 12 min irrigation at 11.00 am, watering at nights at 01:00
23. dec.
irrigation changed to 1 h interval 20 min irrigation at 15.00 pm, watering at nights at 01:00
irrigation changed to 1 h interval, 20 min irrigation at 15.00 pm, watering at nights at 01:00
24. dec. 4. harvest 4. harvest
52


 ChristinaStadler