FINAL REPORT


I Rit LbhÍ nr. 74 „Áhrif mismunandi LED lýsingar á uppskeru og gæði gróðurhúsasalats að vetri“
ChristinaStadler 2017

Duration: 15/09/2016 – 30/06/2017
Project leader: Landbúnaðarháskóla Íslands
Reykjum
Dr. Christina Stadler
810 Hveragerði
Email: christina@lbhi.is
Mobile: 843 5312
Collaborators: Guðmundur Gíslason, Árvirkinn ehf.
Helgi Jóhannesson, Ráðgjafarmiðstöð landbúnaðarins ehf.
Hafberg Þórisson, Lambhagi
Ragnar Sverrisson, Ösp
Magnús Skúlason, Hveratún
Ómar Sævarsson, Heiðmörk
Róbert Logi Jóhannesson, Laugarmýri
Project sponsor: Samband Garðyrkjubænda
Bændahöllinni við Hagatorg
107 Reykjavík
„ÁhrifmismunandiLEDlýsingaráuppskeruoggæði gróðurhúsasalatsaðvetri“
Fig. 1: Salad seedling after germination. 6
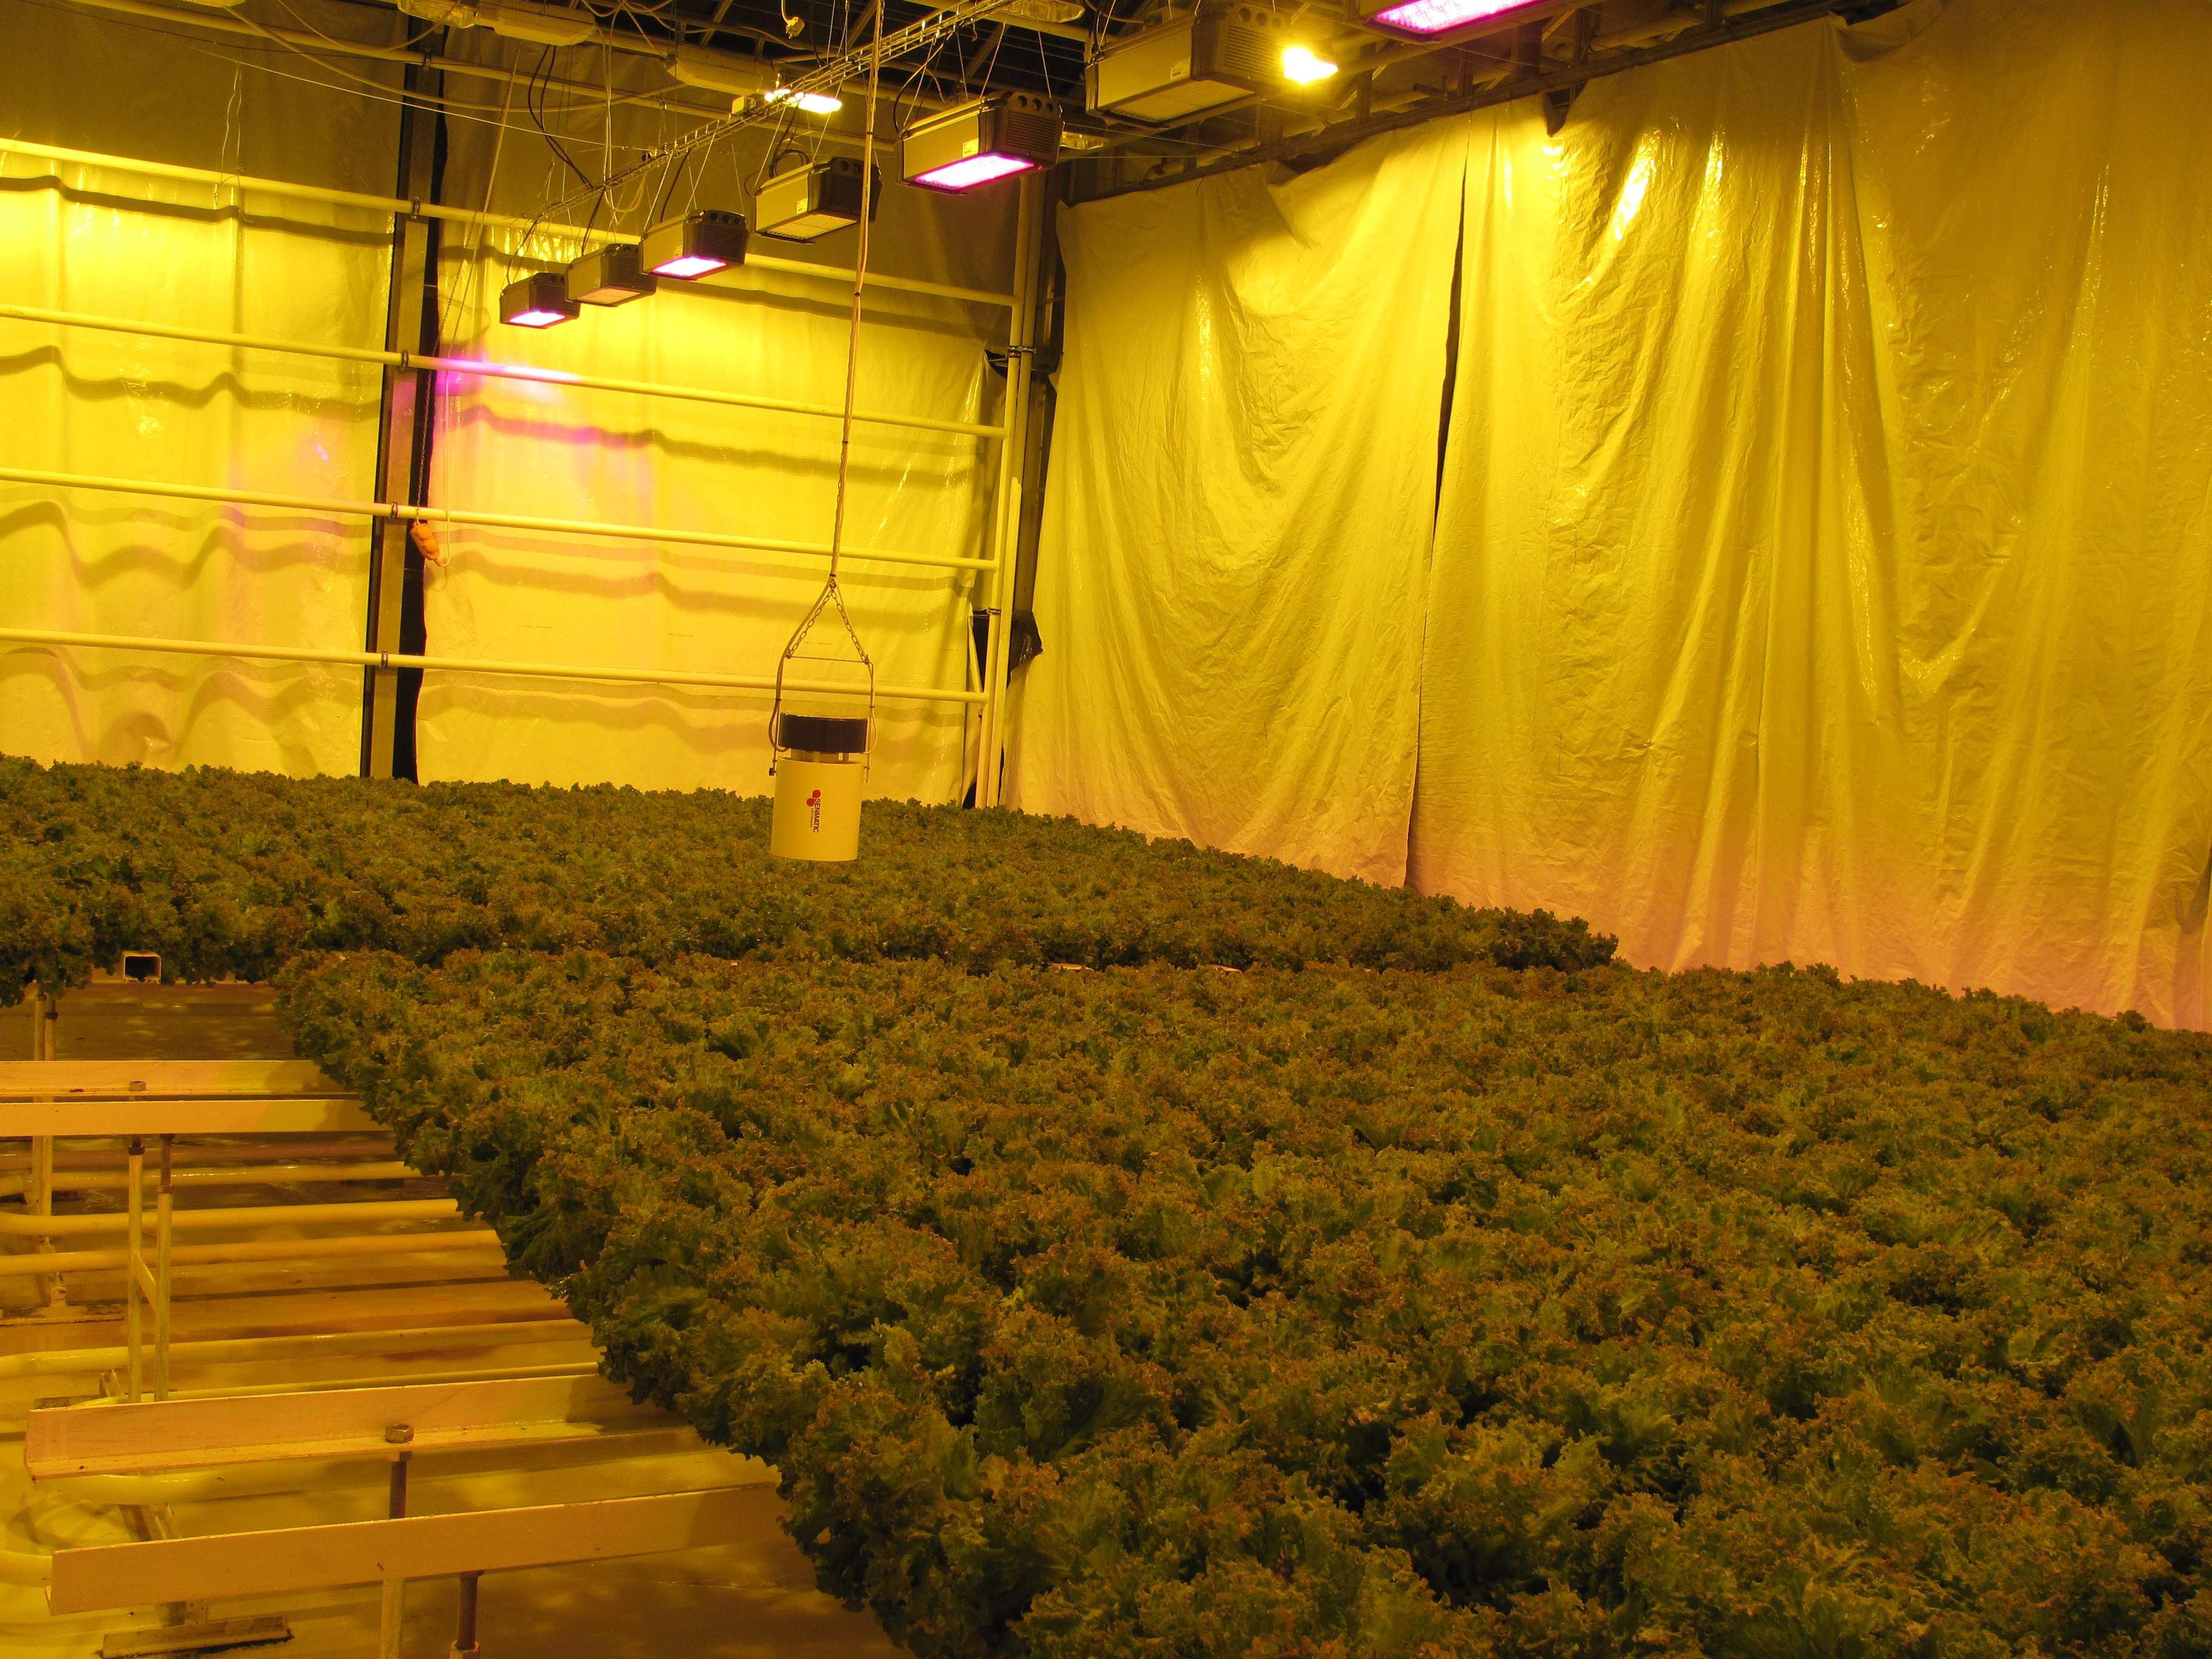
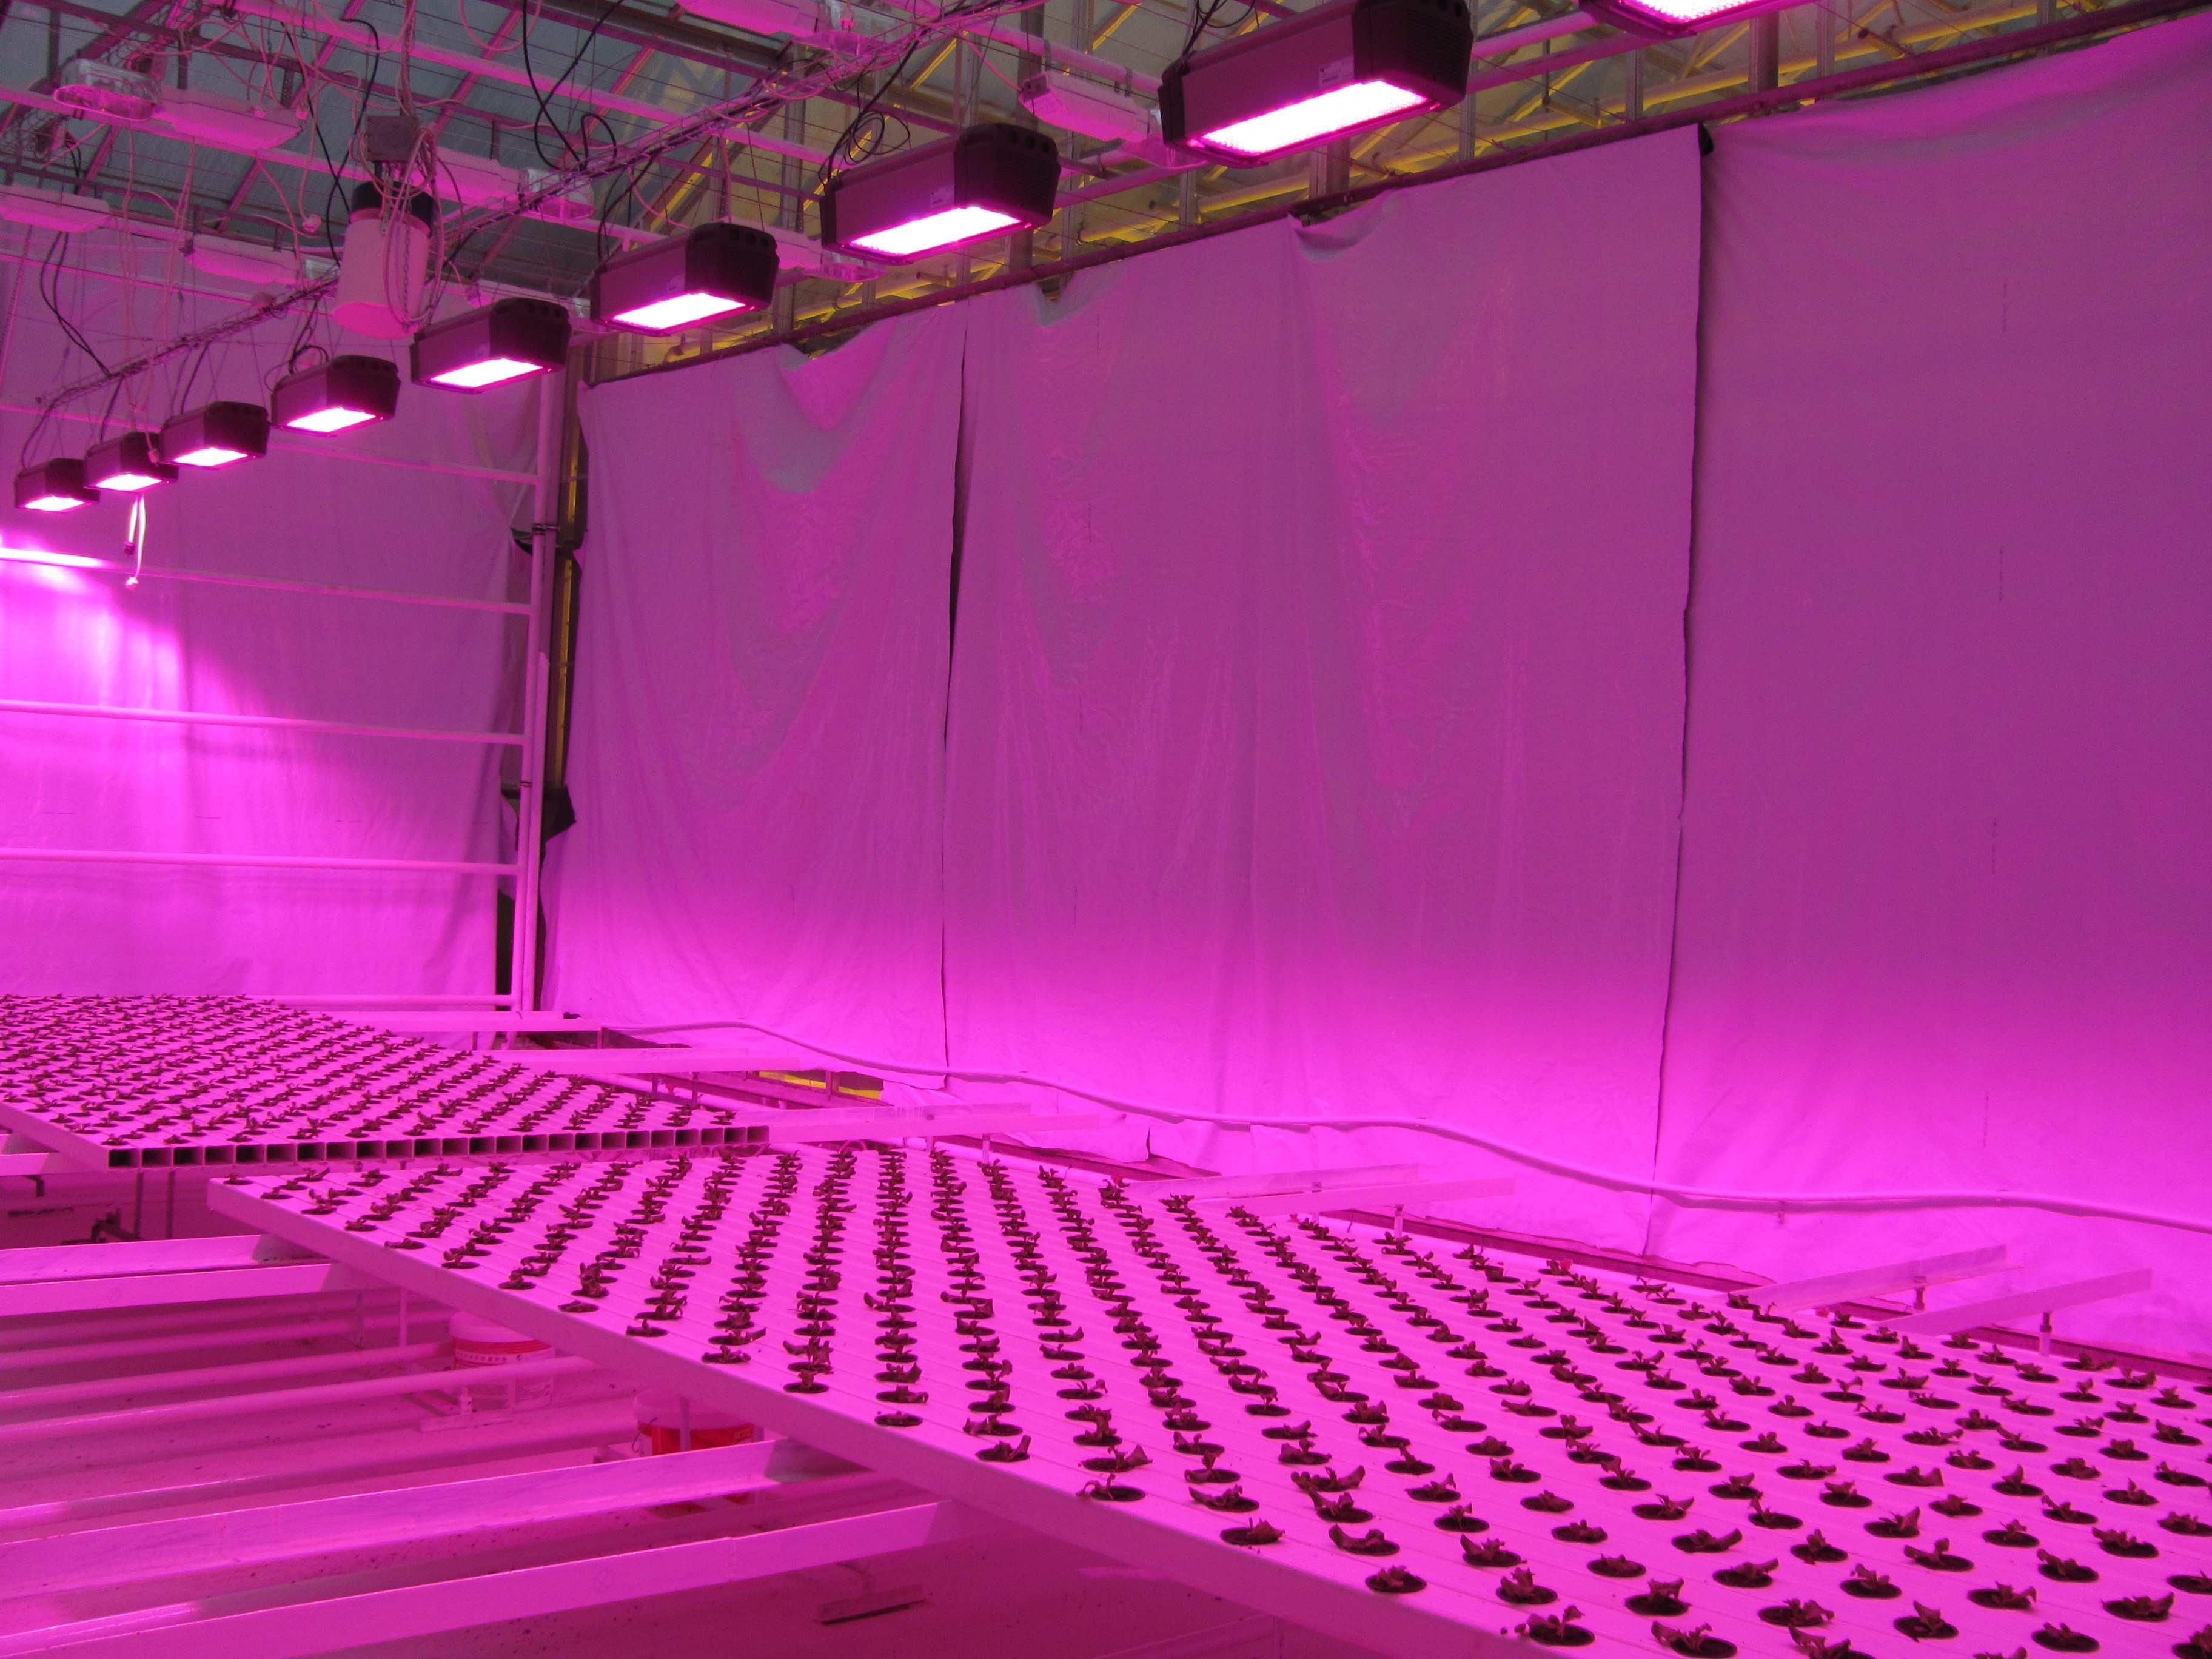
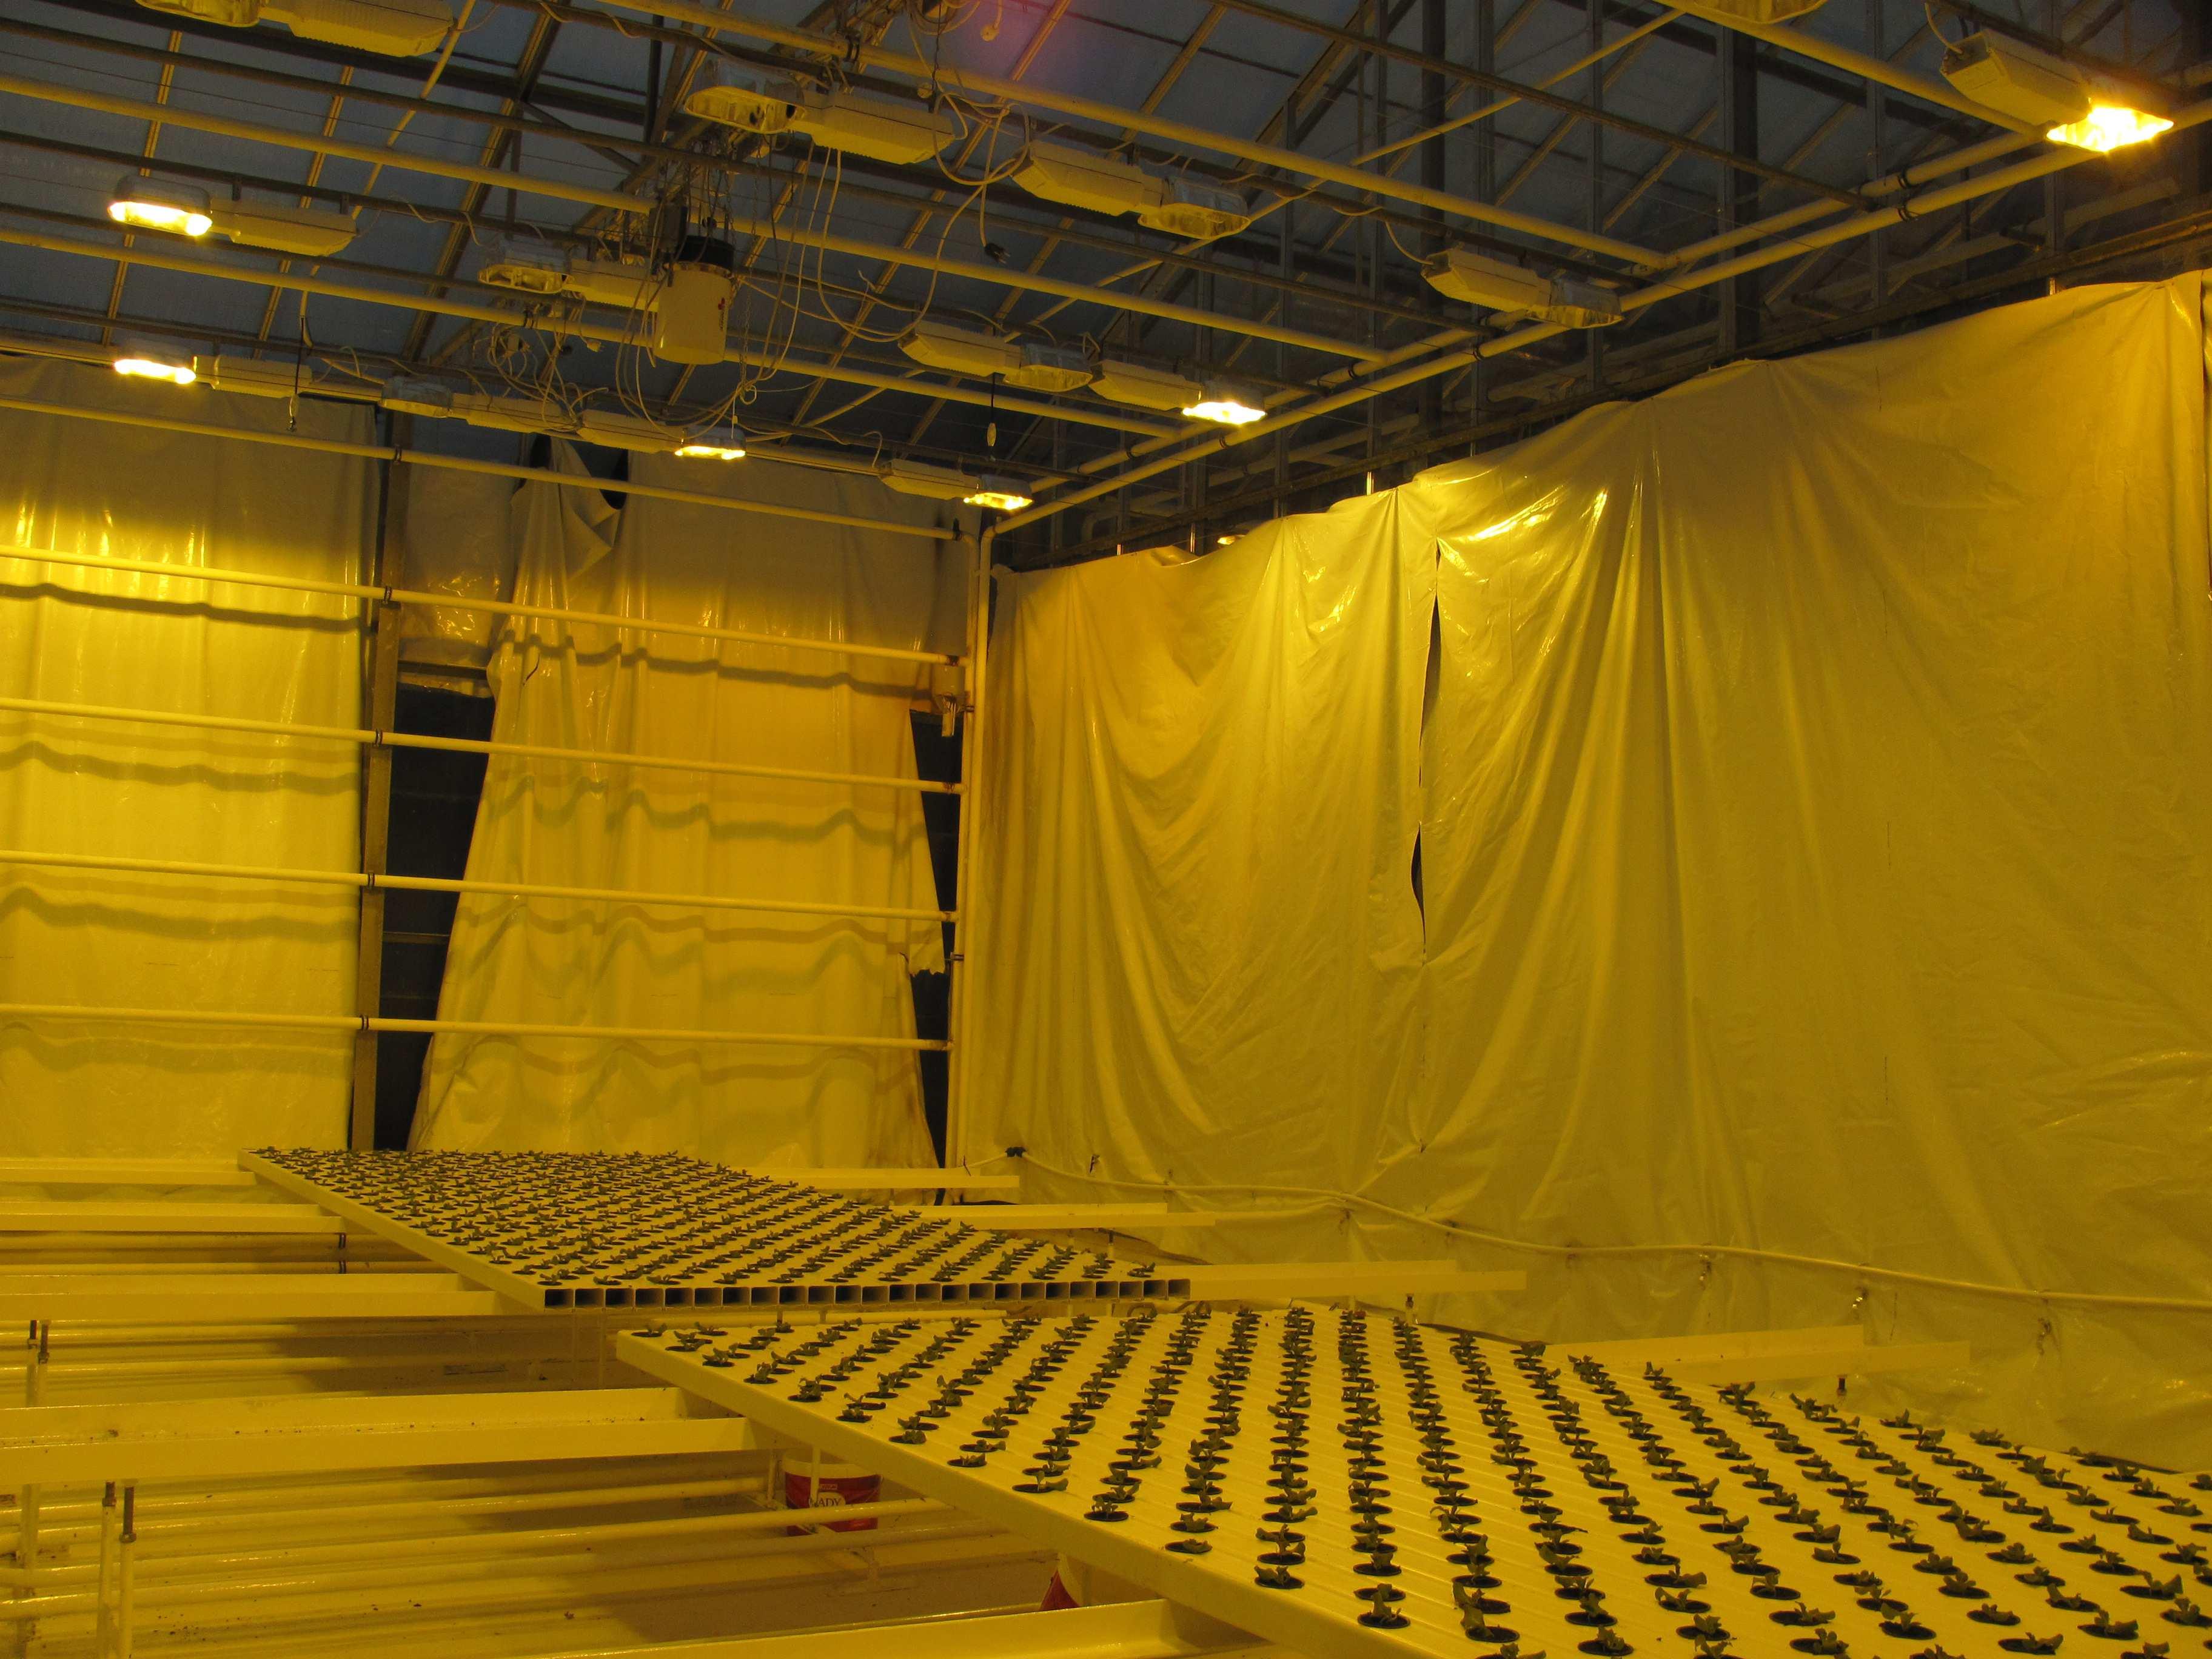
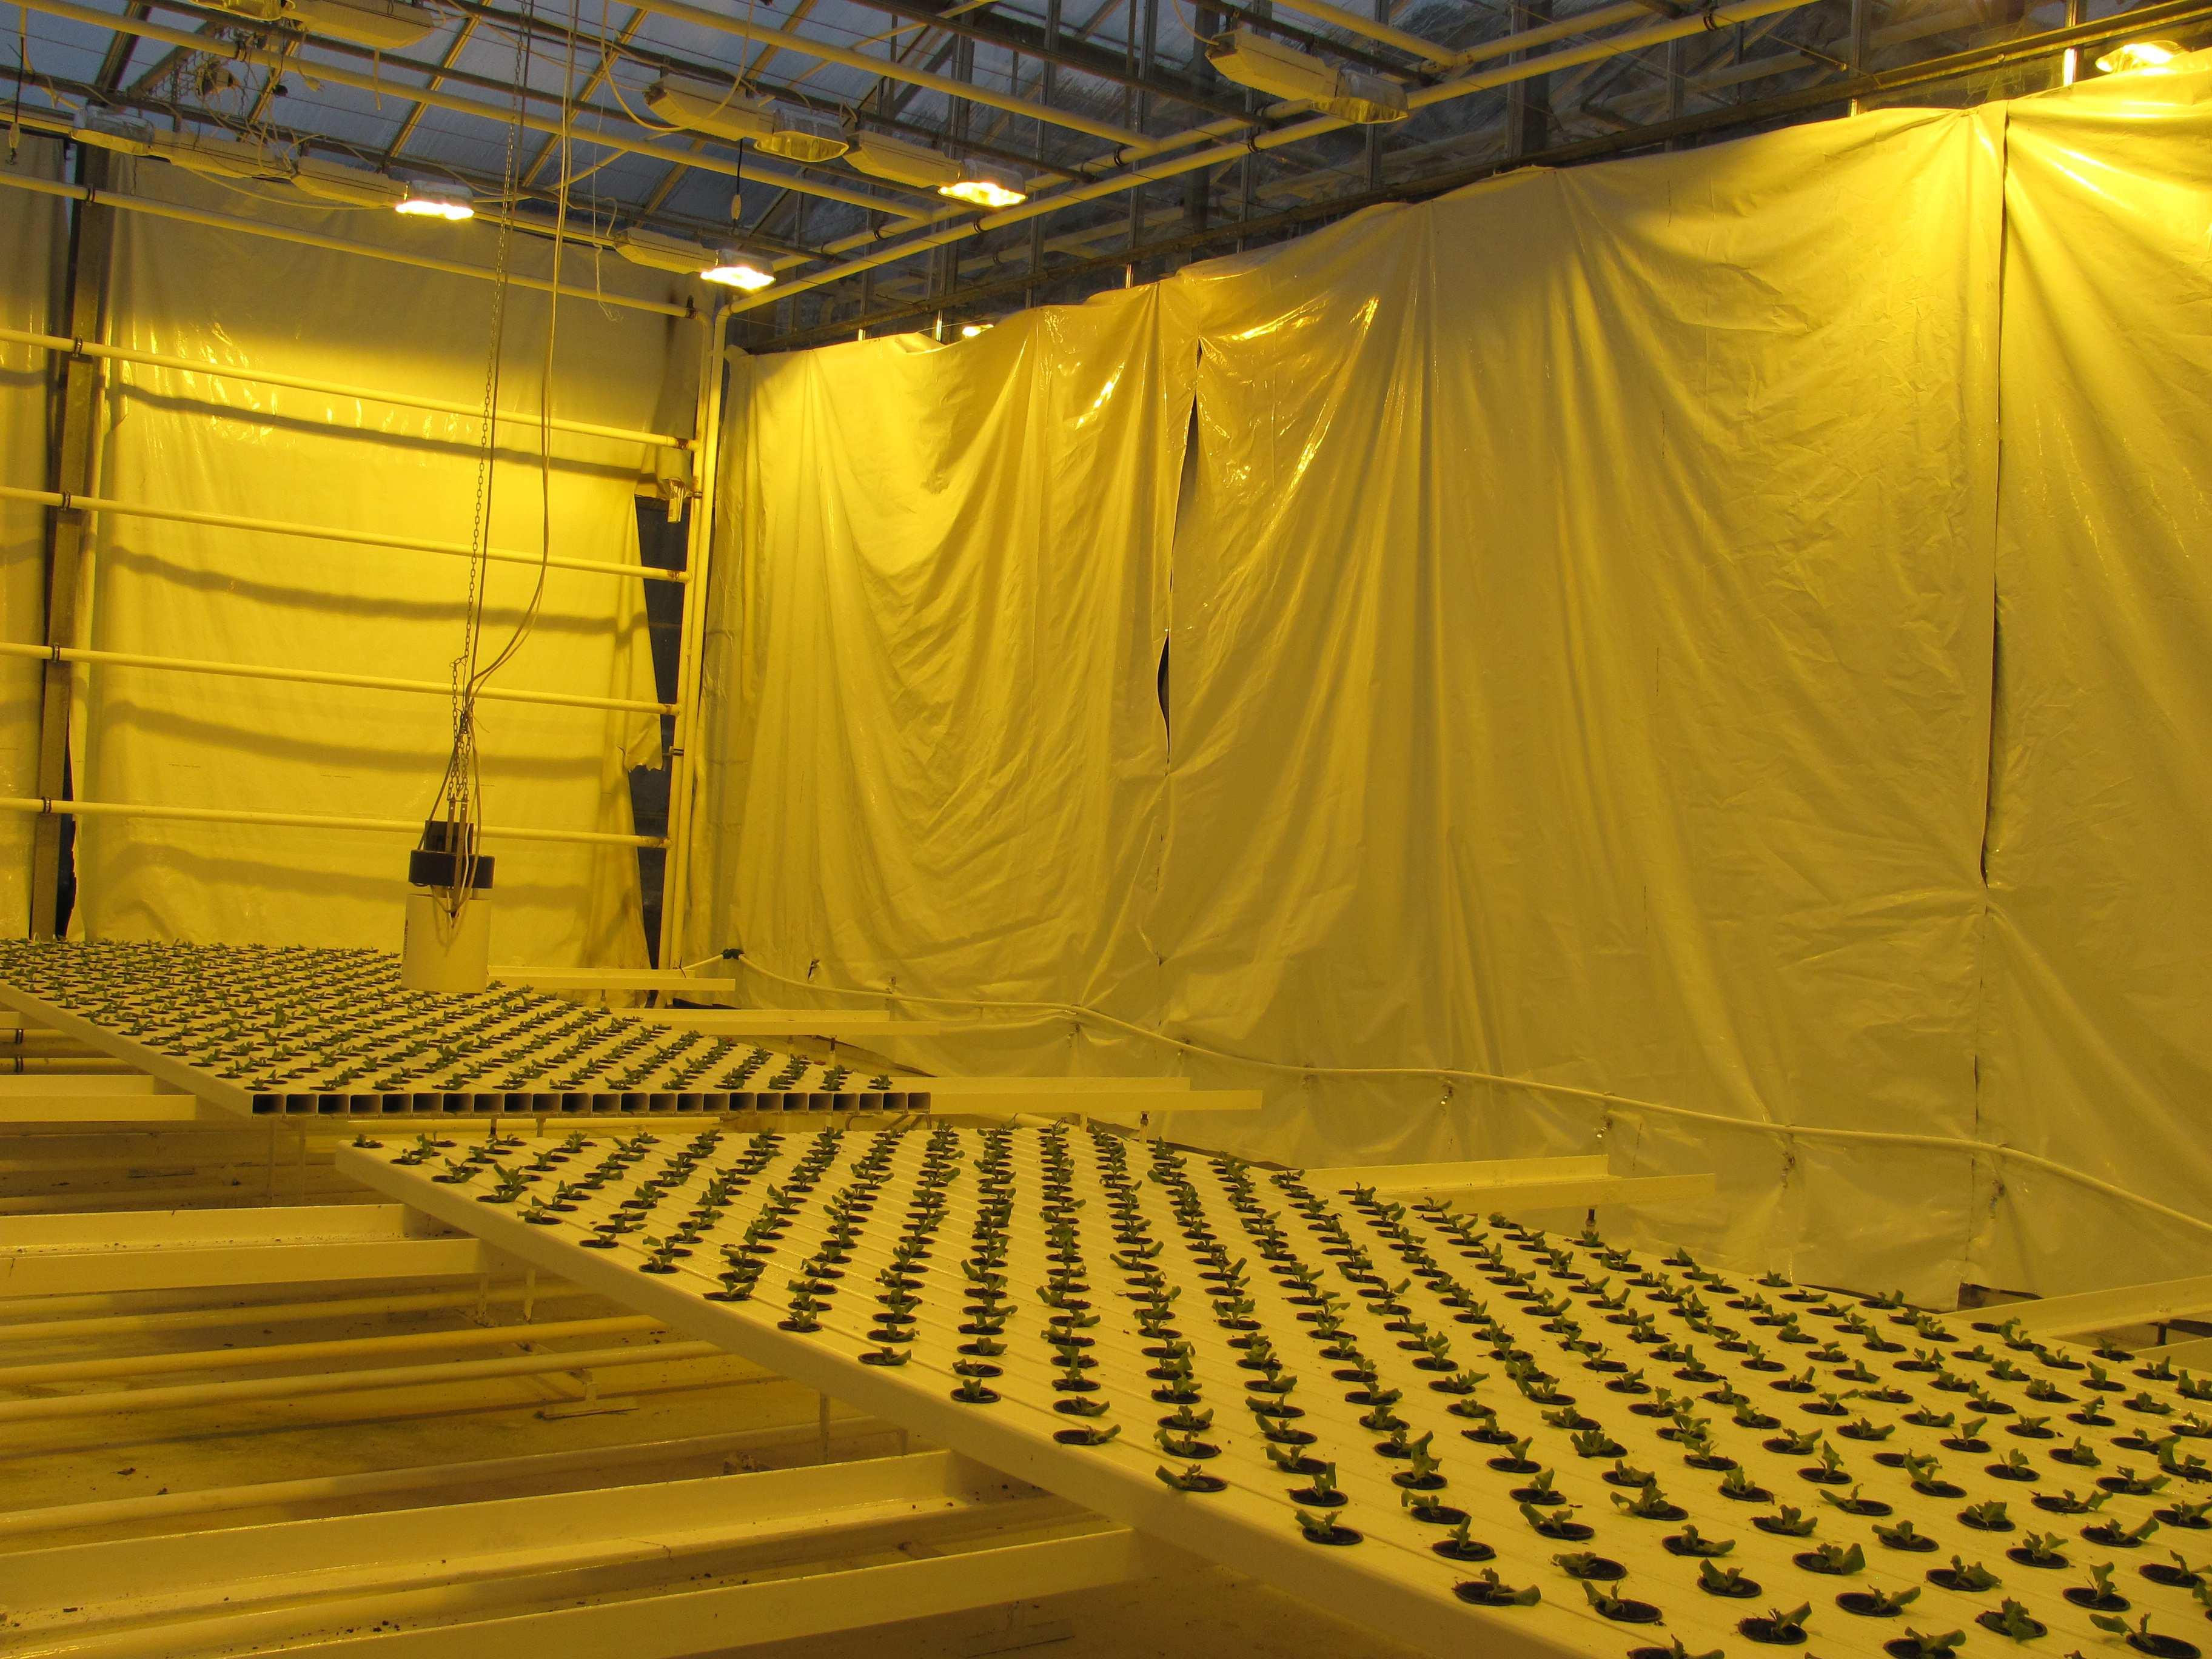
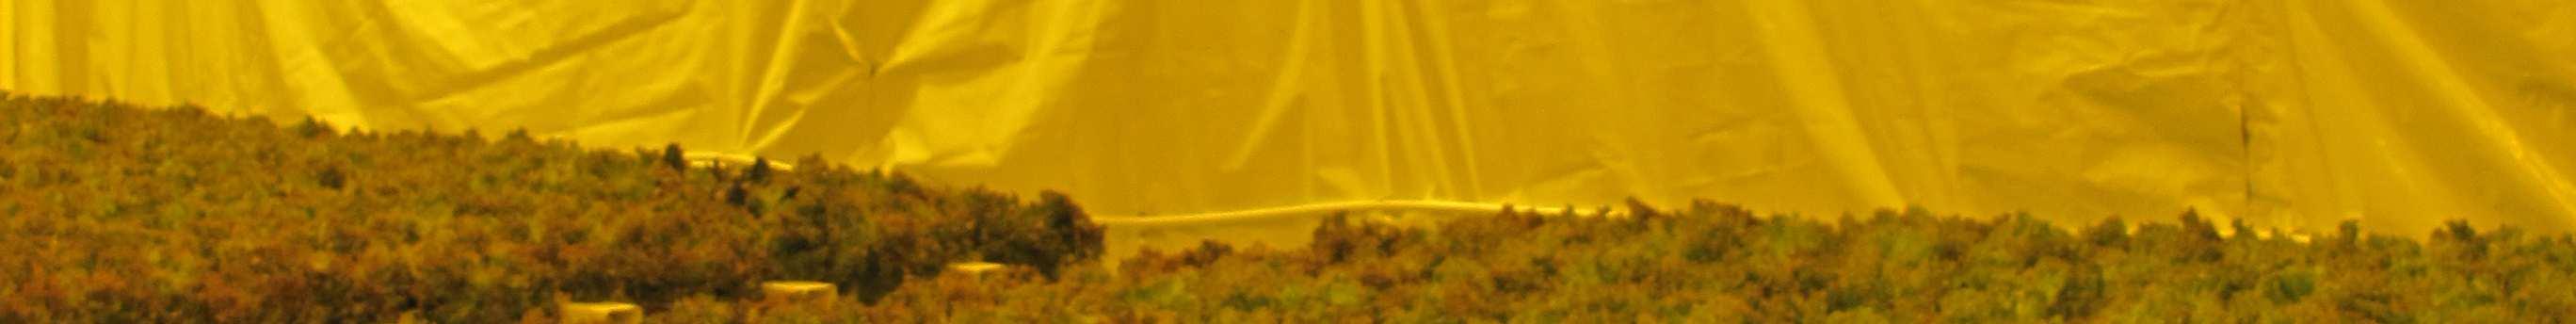
Fig. 2a: After moving plants into different chambers (left: HPS, right: LED, experiment A). 7
Fig. 2b: After moving plants into different chambers (left: HPS, right: HPS+LED, experiment B). 8
Fig. 3: Experimental design of cabinets. 8
Fig. 4: Measurement of hypocothyl length. 10
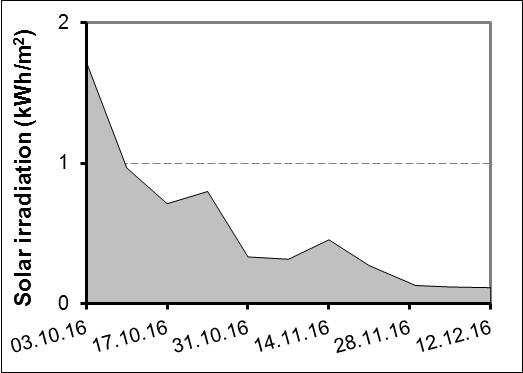
Fig. 5: Time course of solar irradiation. Solar irradiation was measured every day and values for one week were cumulated. 12
Fig. 6: E.C. and pH of irrigation and runoff water in experiment A (a) and experiment B (b). 15
Fig. 7a: Salad one week after growing in the NFT channels (left: HPS, right: LED, experiment A). 16
Fig. 7b: Salad one week after growing in the NFT channels (left: HPS, right: HPS+LED, experiment B). 16
Fig. 8: Leaf number of salad after harvests. 17
Fig. 9: Length of hypocothyl after harvests. 17
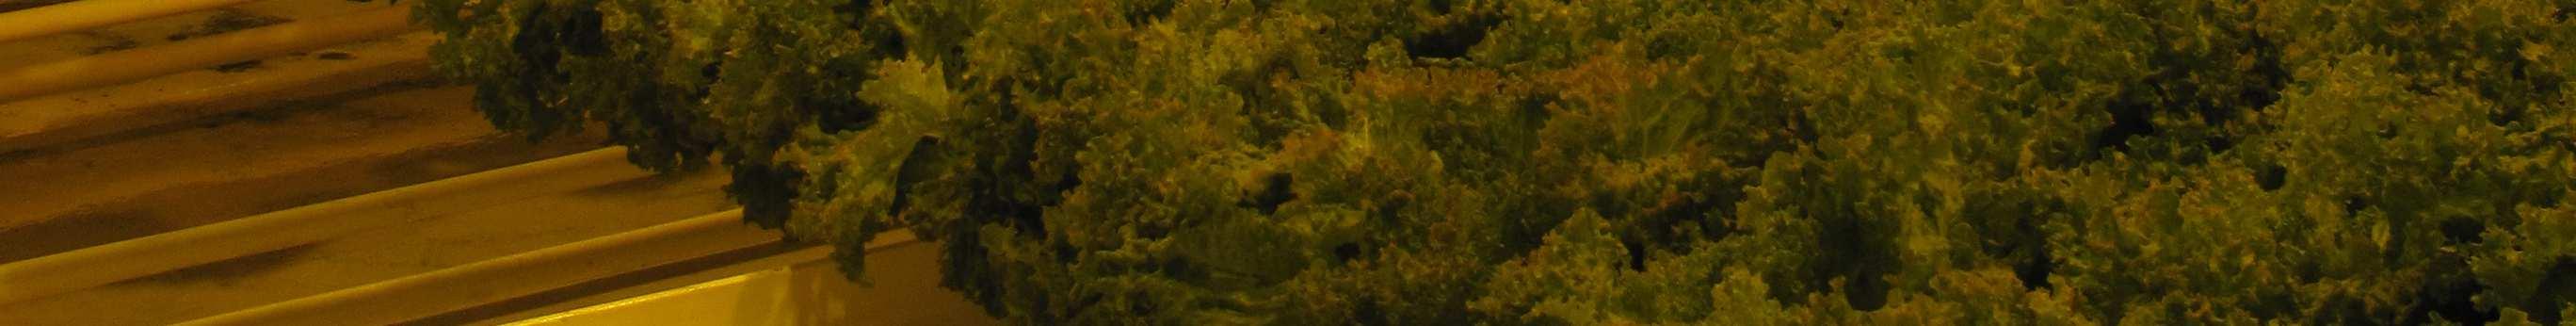
Fig. 10a: Salad after four weeks (left: HPS, right: LED, experiment A). 18
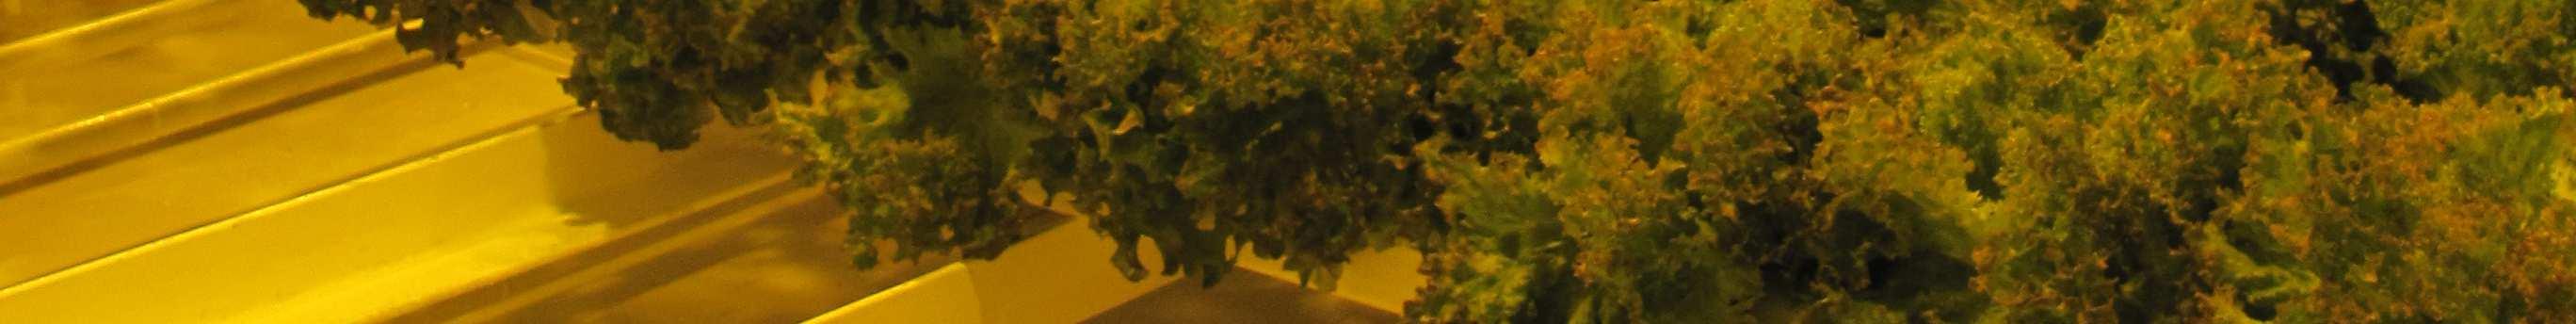
Fig. 10b: Salad after four weeks (left: HPS, right: HPS+LED, experiment B). 18
Fig. 11: Total yield for winter salad after four weeks. 19
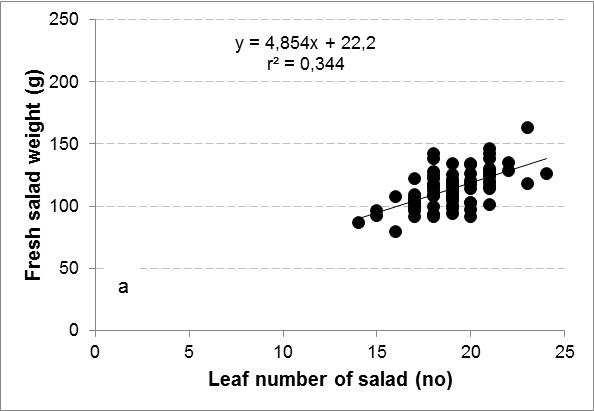
Fig. 12: Relationship between leaf number and fresh weight of salad after four weeks. 19 Fig. 13: Sugar content of salad. 20 Fig. 14: Dry substance of salad. 20
Fig. 15a: Colour of salad after three weeks (left picture) and four weeks (right picture) (left: HPS, right: LED, experiment A). 21
Fig. 15b: Colour of salad after four weeks (left: HPS, right: HPS+LED, experiment B). 21
Fig. 16: Colour of salad after four weeks. 22
Fig. 17: Salad growth index at weekly harvests. 22
Fig. 18: Used kWh in the different chambers. 23 Fig. 19: Yield per kWh. 24
Fig. 20a: Relationship between growing time and yield – calculation scenarios (experiment A). 25
Fig. 20b: Relationship between growing time and yield – calculation scenarios (experiment B). 26
Fig. 21: Revenues at different treatments in experiment A and experiment B. 32
Fig. 22: Variable and fixed costs (without labour costs) in experiment A and experiment B. 32
Fig. 23a: Division of variable and fixed costs in experiment A. 33
Fig. 23b: Division of variable and fixed costs in experiment B. 33 Fig. 24: Profit margin in relation to tariff and treatment. 35
Fig. 25a: Profit margin in relation to treatment in experiment A –calculation scenarios (urban area, VA210). 42
Fig. 25b: Profit margin in relation to treatment in experiment B –calculation scenarios (urban area, VA210). 42
Tab. 1a: Light distribution of the HPS and LED chamber (experiment A). 9 Tab. 1b: Light distribution of the HPS and HPS+LED chamber (experiment B). 9
Tab. 2: Fertilizer mixture according to advice from Azelis. 10 Tab. 3a: Settings of the LED and HPS chamber in experiment A. 13 Tab. 3b: Settings of the HPS+LED and HPS chamber in experiment B. 14
Tab. 4: Lighting hours, power and energy in the cabinets for different light treatments (datalogger values). 24
Tab. 5a: Days to harvest and used energy (experiment A). 25 Tab. 5b: Days to harvest and used energy (experiment B). 26
Tab. 6a: Costs for consumption of energy for distribution and sale of energy for growing under HPS or under LED lights (experiment A). 28
Tab. 6b: Costs for consumption of energy for distribution and sale of energy for growing under HPS and LED lights together or only under LED lights (experiment B). 29
Tab. 7a: Variable costs of electricity in relation to yield in experiment A. 30 Tab. 7b: Variable costs of electricity in relation to yield in experiment B. 31 Tab. 8: Profit margin of winter salad at different treatments (urban area, VA210) for experiment A and experiment B. 34
Tab. 9a: Calculation scenarios of profit margin per year in experiment A. 36 Tab. 9b: Calculation scenarios of profit margin per year in experiment B. 37
HPS high-pressure vapour sodium lamps
kWh kilo Watt hour
LED light emitting diodes pH potential of hydrogen ppm parts per million
W Watt Wh Watt hours
Other abbreviations are explained in the text.
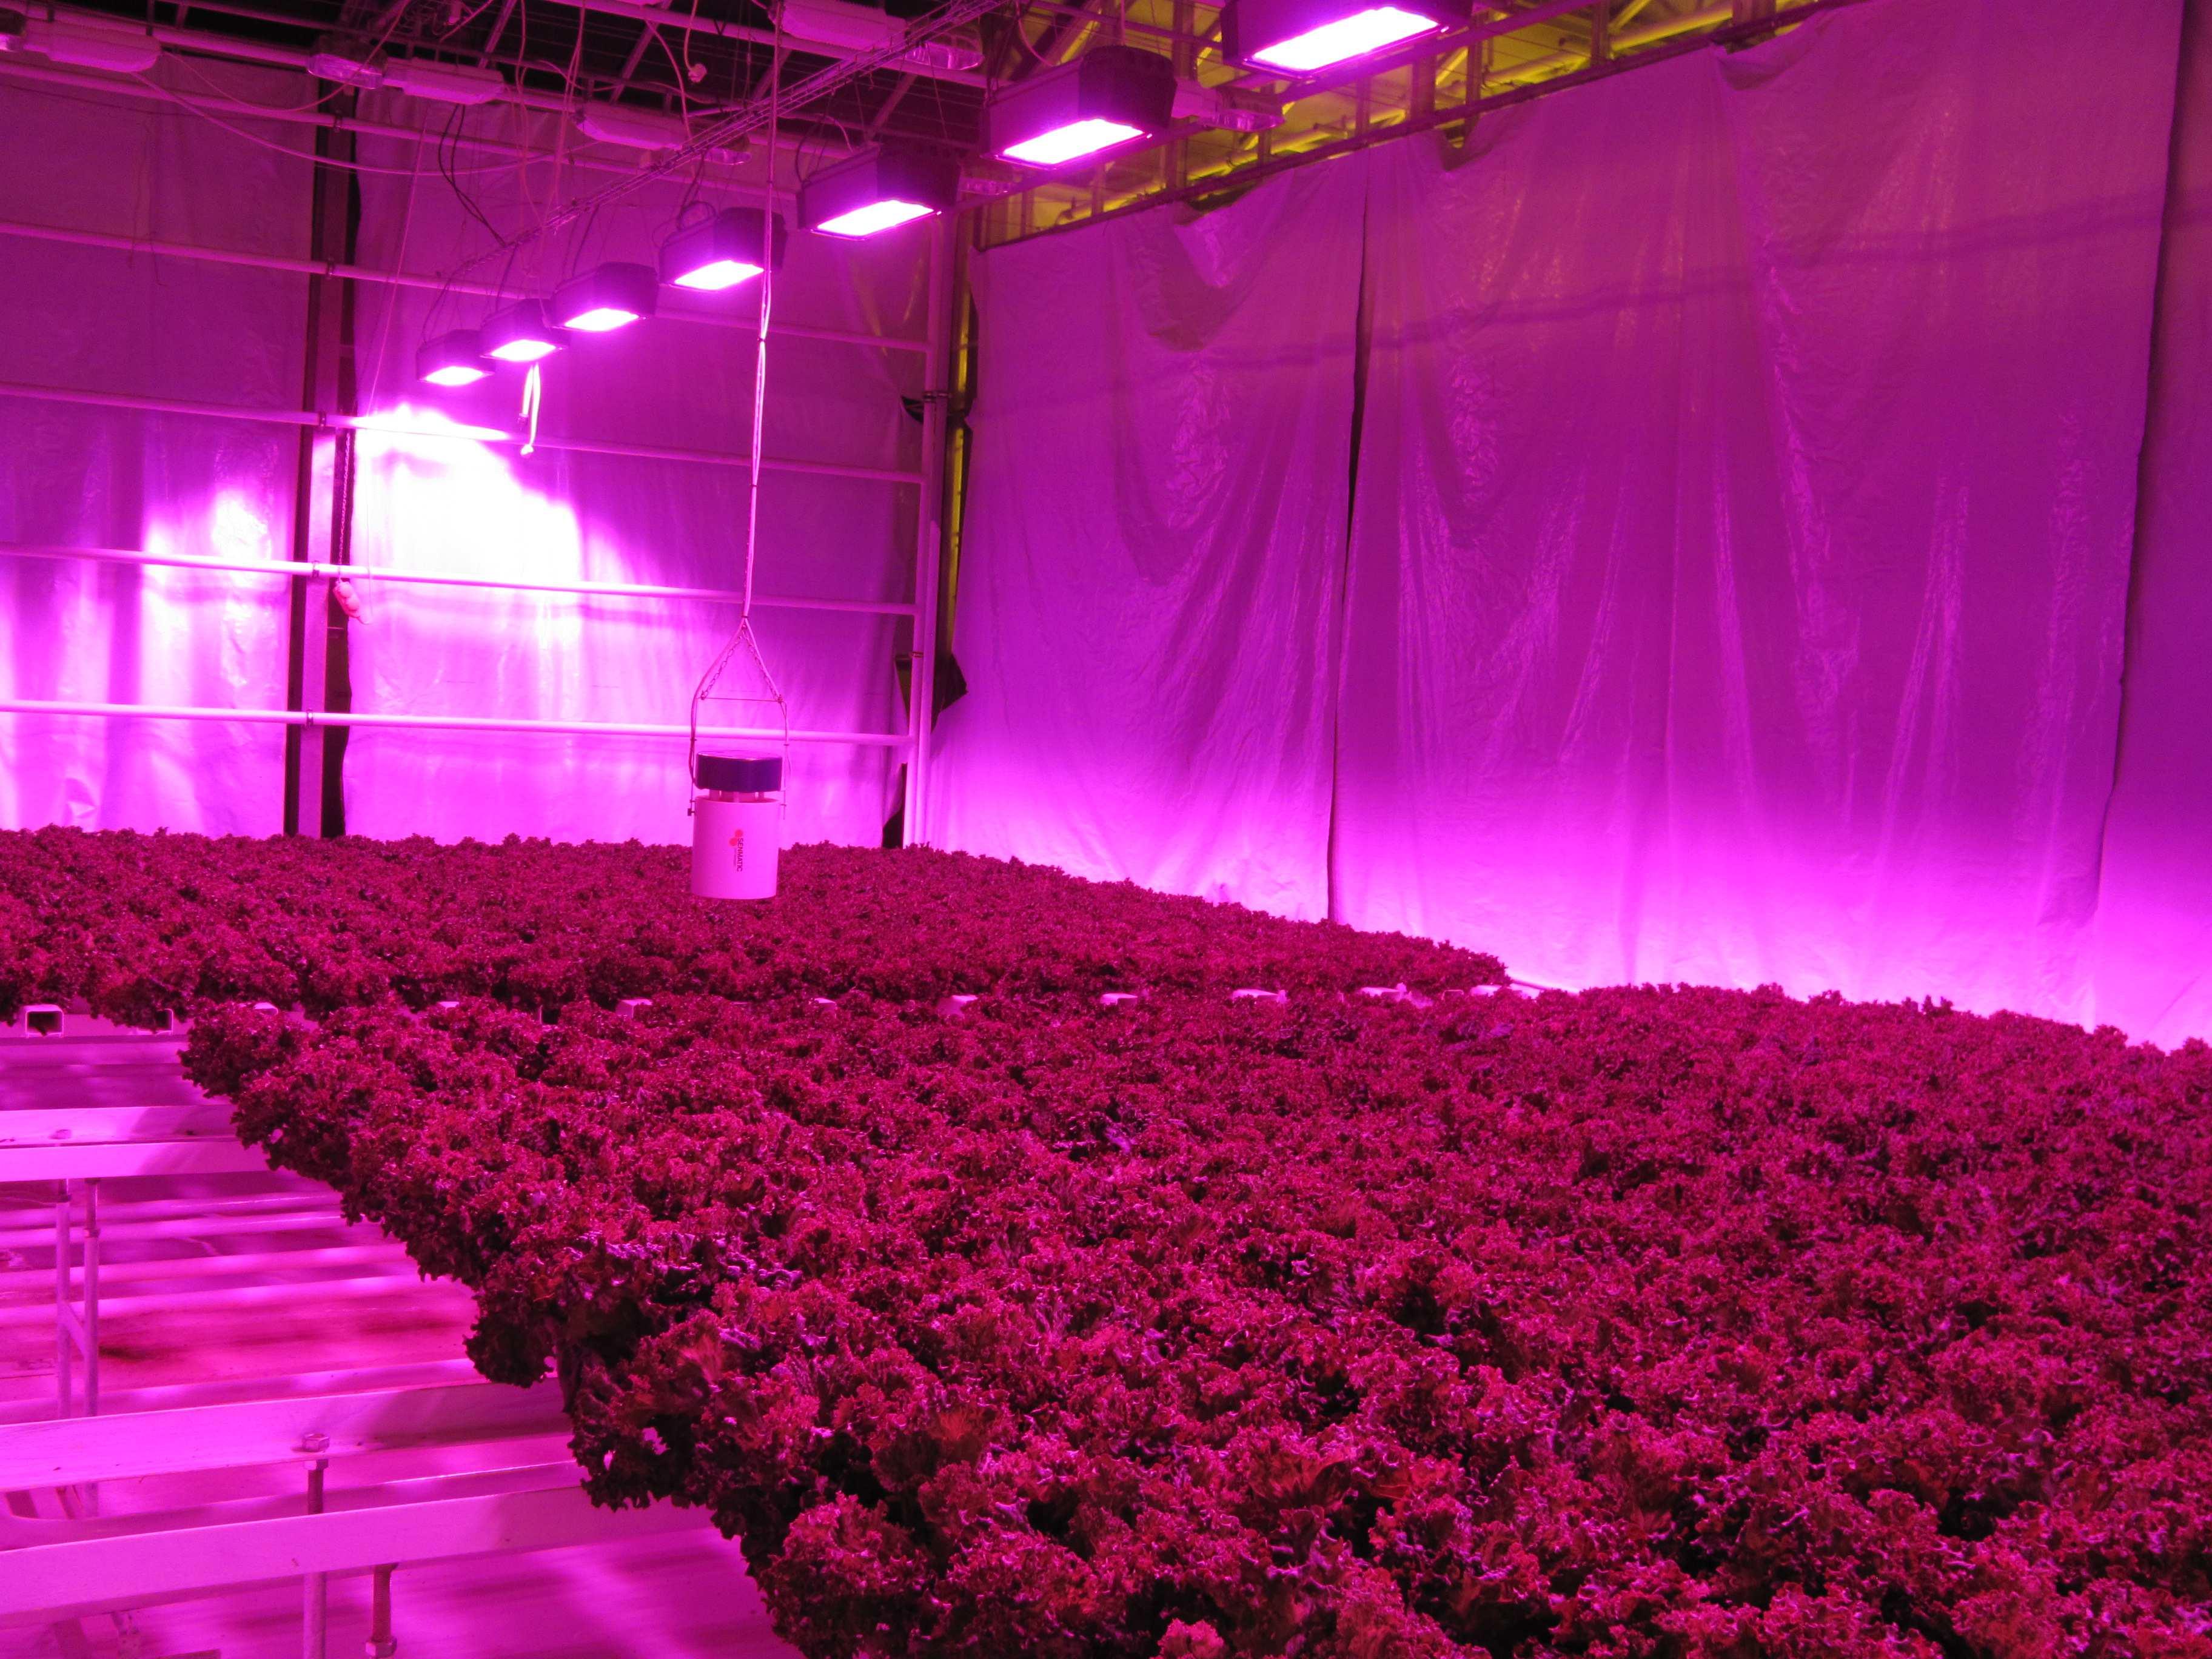
In Iceland, winter production of greenhouse crops is totally dependent on supplementary lighting and has the potential to extend seasonal limits and replace imports during the winter months. However, in autumn and winter is it difficult to get the red colour in red salad. Therefore, adequate guidelines for winterproduction of salad are not yet in place and need to be developed. The objective of this study was to test the growth and yield of red salad under HPS lights compared to LED lights (experiment A) respectively HPS lights compared to the combined use of HPS and LED lights (experiment B) and which lighting treatment is economically viable.
An experiment with red salad (cv. Carmoli) was conducted in winter 2016, from the beginning of October to the beginning of November (experiment A) and from the middle of November to the middle of December (experiment B), in the research greenhouse of the Agricultural University of Iceland at Reykir. Plants were grown in NFT channels in four repetitions under toplighting with high-pressure vapour sodium lamps (HPS) and / or under LED lights for 18 hours. The day temperature in the LED chamber was set one degree higher than in the HPS chamber and the µmol level was 27 % higher under LEDs (experiment A). In experiment B were the µmol levels and the temperatures (day temperature: 19 °C, night temperature: 15 °C) the same between lighting treatments. Salad received standard nutrition through drip irrigation. The plant density was 68, 40, 28 and 22 plants per squaremeter after one, two, three and four weeks after planting.
In experiment A was the fresh weight of salad after 27 days higher for plants grown under HPS lights. The yield was reduced by 11 % when plants were grown under LEDs. However, a redder colour was reached under LED lights. Also, the electricity consumption could be reduced by 37 % with LEDs compared to HPS lights. The utilisation of KWh´s into yield was significantly higher compared to the use of HPS lights. A one day longer growth period would be necessary with LEDs to get the same yield compared to growing under HPS lights. However, this would result in a slightly higher profit margin.
In experiment B was the fresh weight of salat nearly comparable between the combined use of HPS and LEDs and the only use of HPS lights. The red colour was only slightly increased with the use of both HPS and LED lights. Also, the electricity consumption was not better transferred into yield and the profit margin was reduced
by 50 % compared to the only use of HPS lights. One more day would be necessary with the combined use of HPS and LED lights to get the same yield as with only HPS lights.
However, these results are very much dependent on the price of the LED’s and have to be judged cautiously. Possible recommendations for saving costs other than lowering the electricity costs are discussed.
It seems that a satisfactory colouring and at the same time a suitable yield is not possible with lighting with HPS lamps and / or LEDs. From the economic side it is therefore not recommended to use LEDs at the current status. Further studies on the effects of LED lighting on vegetables are needed. Also, experiments with LEDs from different companies had to be conducted before final conclusions and recommendations regarding LEDs can be made.
Vetrarræktun í gróðurhúsum á Íslandi er alveg háð aukalýsingu. Viðbótarlýsing getur þá lengt uppskerutímann og komið í stað innflutnings að vetri til. En að hausti og vetri er erfitt að fá rauðan lit á rautt salat og því eru fullnægjandi leiðbeiningar vegna vetrarræktunar á salat ekki til og þarfnast frekari þróunar. Markmiðin voru að kanna þróun og uppskeru af rauðu salati undir HPS lömpum í samanburði við LED lýsingu (tilraun A) og undir HPS lömpum í samanburði við HPS og LED lýsingu saman (tilraun B) og hvaða meðferð væri hagkvæm. Tilraun með rautt salat (cv. Carmoli) var gerð veturinn 2016, frá byrjun október til byrjun nóvember (tilraun A) og frá miðjum nóvember til miðs desember (experiment B), í tilraunagróðurhúsi Landbúnaðarháskóla Íslands að Reykjum. Plöntur voru ræktaðar í NFT rennu í fjórum endurtekningum undir topplýsingu frá háþrýstinatríumlömpum (HPS) og / eða undir LED ljósi í 18 klst. Daghiti var einni gráðu meiri í LED klefa í samanburði við HPS klefa og stig af µmol var 27 % hærri við LED í tilraun A. Í tilraun B var stig af µmol og hita (daghiti 19 °C og næturhiti 15 °C) milli meðferðir eins. Salatplöntur fengu næringu með dropavökvun. Plöntuþéttleiki var 68, 40, 28 eða 22 plöntur á fermetra, eftir eina, tvær, þrjár eða fjórar vikur eftir gróðursetningu.
tilraun A var uppskera af salati eftir 27 daga meiri hjá plöntum undir HPS ljósi. Uppskera minnkaði um 11 % þegar plöntunar voru ræktað undir LED. En LED ljós skilaði betri rauðum lit á salati. Rafmagnsnotkun var 37 % minni við LED ljós miðað við HPS ljós. Nýting kWh í uppskeru var marktækt hærri samanborið við notkun af HPS ljósi. Einum sólarhring lengra vaxtarskeið væri nauðsynlegt við LED ljós til að fá sömu uppskeru eins og við ræktun undir HPS ljósi. Hins vegar myndi það leiða til örlítið hærri framlegðar.
Í tilraun B var uppskera af salati nánast sambærileg milli notkunar á HPS og LED ljósa og eingöngu með HPS ljósi. Rauði liturinn var aðeins meiri við notkun með bæði HPS og LED ljósum. Uppskeru á kWh var nálagst eins milli meðferða og framlegð minnkaði um 50 % miðað við notkun eingöngu með HPS ljósi. Einum sólarhring lengra vaxtarskeið væri nauðsynlegt samhliða notkun á HPS og LED ljósum til að fá sömu uppskeru eins og með ræktun undir HPS ljósi. Hins vegar eru þessar niðurstöður mjög háðar verði á LED ljósum og þarf því að dæma varlega. Möguleikar til að minnka kostnað, aðrir en að lækka rafmagnskostnað eru ræddir.
Það virðist vera að fullnægjandi rauður litur og á sama tíma góða uppskeru sé ekki hægt að fá við lýsingu með HPS lampar og / eða LED. Frá gæða- og hagkvæmnisjónarmiði er ekki mælt með því að nota LED ljós miðað við núverandi stöðu. Frekari rannsóknir um áhrif LED lýsingu á grænmeti eru þörf. Tilraunir með LED frá mismunandi fyrirtækjum þurfa að fara fram áður en endalegar niðurstöður og ráðleggingar varðandi LED ljósi er hægt að gefa.
It is difficult to grow salad in Iceland and other northern regions due to short days and little sunshine from middle of September until middle of April, but the extremely low natural light level is the major limiting factor for winter greenhouse production. Therefore, supplementary lighting is essential to maintain year-round vegetable production. This could replace imports from lower latitudes during the winter months. Ultraviolet-B (UV-B, 280-315 mm) radiation gives the characteristic red color on red salad. Lack of UV-B radiation gives a brownish leaf colour, which is generally regarded as a low-quality product. The radiation level of UV-B varies depending on the season and latitude. Low or inexistent levels of UV-B radiation in the solar irradiation emitted by low sun angle and / or a small amount of blue light in northern regions as in Norway and Iceland during winter inhibit the production of high quality red salad. Therefore, it is difficult to get the red color in red salad in autumn and winter. The red color also implies increased content of bioactive substances that are considered good health.
Supplemental lighting that is normally used in greenhouses has no or only a small amount of UV-B radiation. High pressure sodium (HPS) lamps are the most commonly used type of light source in greenhouse production due to their appropriate light spectrum for photosynthesis and their high efficiency. The spectral output of HPS lamps is primarily in the region between 550 nm and 650 nm and is deficient in the IV and blue region (Krizek et al., 1998). However, HPS lights suffer from restricted controllability and dimming range limitations (Pinho et al., 2012).
Light-emitting diodes (LED) have been proposed as a possible light source for plant production systems and have attracted considerable interest in recent years with their advantages of reduced size and minimum heating plus a longer theoretical lifespan as compared to high intensity discharge light sources such as HPS lamps (Bula et al., 1991). These lamps are a radiation source with improved electrical efficiency (Bula et al., 1991), in addition to the possibility to control the light spectrum and the light intensity which is a good option to increase the impact on growth and plant development. Several plant species have been successfully cultured under LEDs (e.g. Tamulaitis et al., 2005; Schuerger et al., 1997; Brown et al., 1995; Hoenecke et al., 1992). The question is if salad under LEDs would also result in good yield and if it is possible to improve red colour. Experiments, conducted for example
in Finland (Juntunen & Riihimäki, 2011) have shown that it was possible with LED lights to get a stronger red colour. Also, the finish company Valoya has done research on lighting salad with HPS lights in comparison to LEDs. Plants under HPS lights had a longer hypocotyl and the generative growth was more pronounced compared to the LED treatment. On the other side, less aphids on ice salad were observed when grown under LEDs. Also, the taste of salad and basil was evaluated better under LEDs (Valoya, 2013). In Norway had plants a very small amount of phenol when grown under HPS lights. However, grown under LEDs with 20 % blue and 80 % red increased phenol content (Rodriguez, 2012). Stadler (2015) found a more intensive red colour when salad was grown in the last week of the growth period or even longer under LEDs. However, with HPS was achieved a significantly higher fresh yield in comparison to LEDs. But, two times more kWh was necessary with only HPS lights in comparision with only LEDs. The only use of HPS lights resulted in the highest yield, while the yield with only LEDs was about ¼ less (Stadler, 2015).
Therefore, it should be tested if it is possible to get a satisfactory reddening and at the same time a suitable yield by using either a higher μmol/m2/s with LEDs in addition to a higher temperature than with HPS lamps or by using HPS lamps and LEDs together in comparison to the single application of HPS lamps. The objective of this study was to test (1) which lighting treatment gives a good yield and a satisfactory red colour in red winter salad, and (2) which lighting treatment improves profit margin. This study should enable to strengthen the knowledge on the best lighting method of growing red salad and give vegetable growers advice how to improve red colour in red salad accompanied with a satisfactory yield. The research will determine the development of growth and yield of red winter salad grown under HPS lights compared to LED lights, respectively, to a combination of HPS lights and LED lights.
Two experiments with salad (Lactuca stativa cv. Carmoli) and different light treatments were conducted in two chambers of the Agricultural University of Iceland at Reykir. Seeds of salad were sown on 26.09.2016 (experiment A) and on 31.10.2016 (experiment B) in pots (Ø 6 cm) filled with peat substrate and covered with plastic until germination and kept under 19 °C / 15 °C (day / night). About three days after sowing were pots uncovered from plastic (Fig. 1).
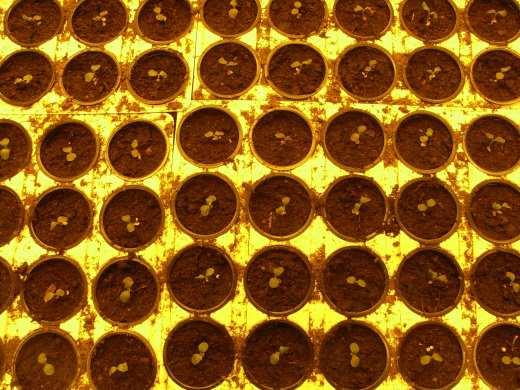
Plants were watered with fertilizer. Salad seedlings received 150 W/m2 HPS lights from 05.00-23.00. Two weeks after sowing, on 11.10.2016 (experiment A) and on 15.11.2016 (experiment B), plants were transferred to a hydroponic growing system with NFT channels, with a slope of 1 cm per m (Fig. 2). The pots were placed in channels (width: 7 cm) in 70 cm height. Each channel was 4,06 m and took 19 pots, with 21 cm between pots. The channels were placed in two rows with a 50 cm
gangway in between. Each row had in the beginning of the growth period 23 channels without space in between. However, one week, two and three weeks, respectively, after planting the seedlings into the NFT channels, the distance between the channels was changed to 5 cm, 10 cm, 15 cm, respectively, giving a plant density of 68, 40, 28, 22 plants/m2, respectively. Salad plants were under different lighting treatments with HPS and / or LED lights with supplemental lighting from 05.00-23.00:
1. HPS 120 W/m2, (Philips bulbs, 600 W), 132 µmol/m2/s, 19 / 15°C (day / night); 800 ppm CO2
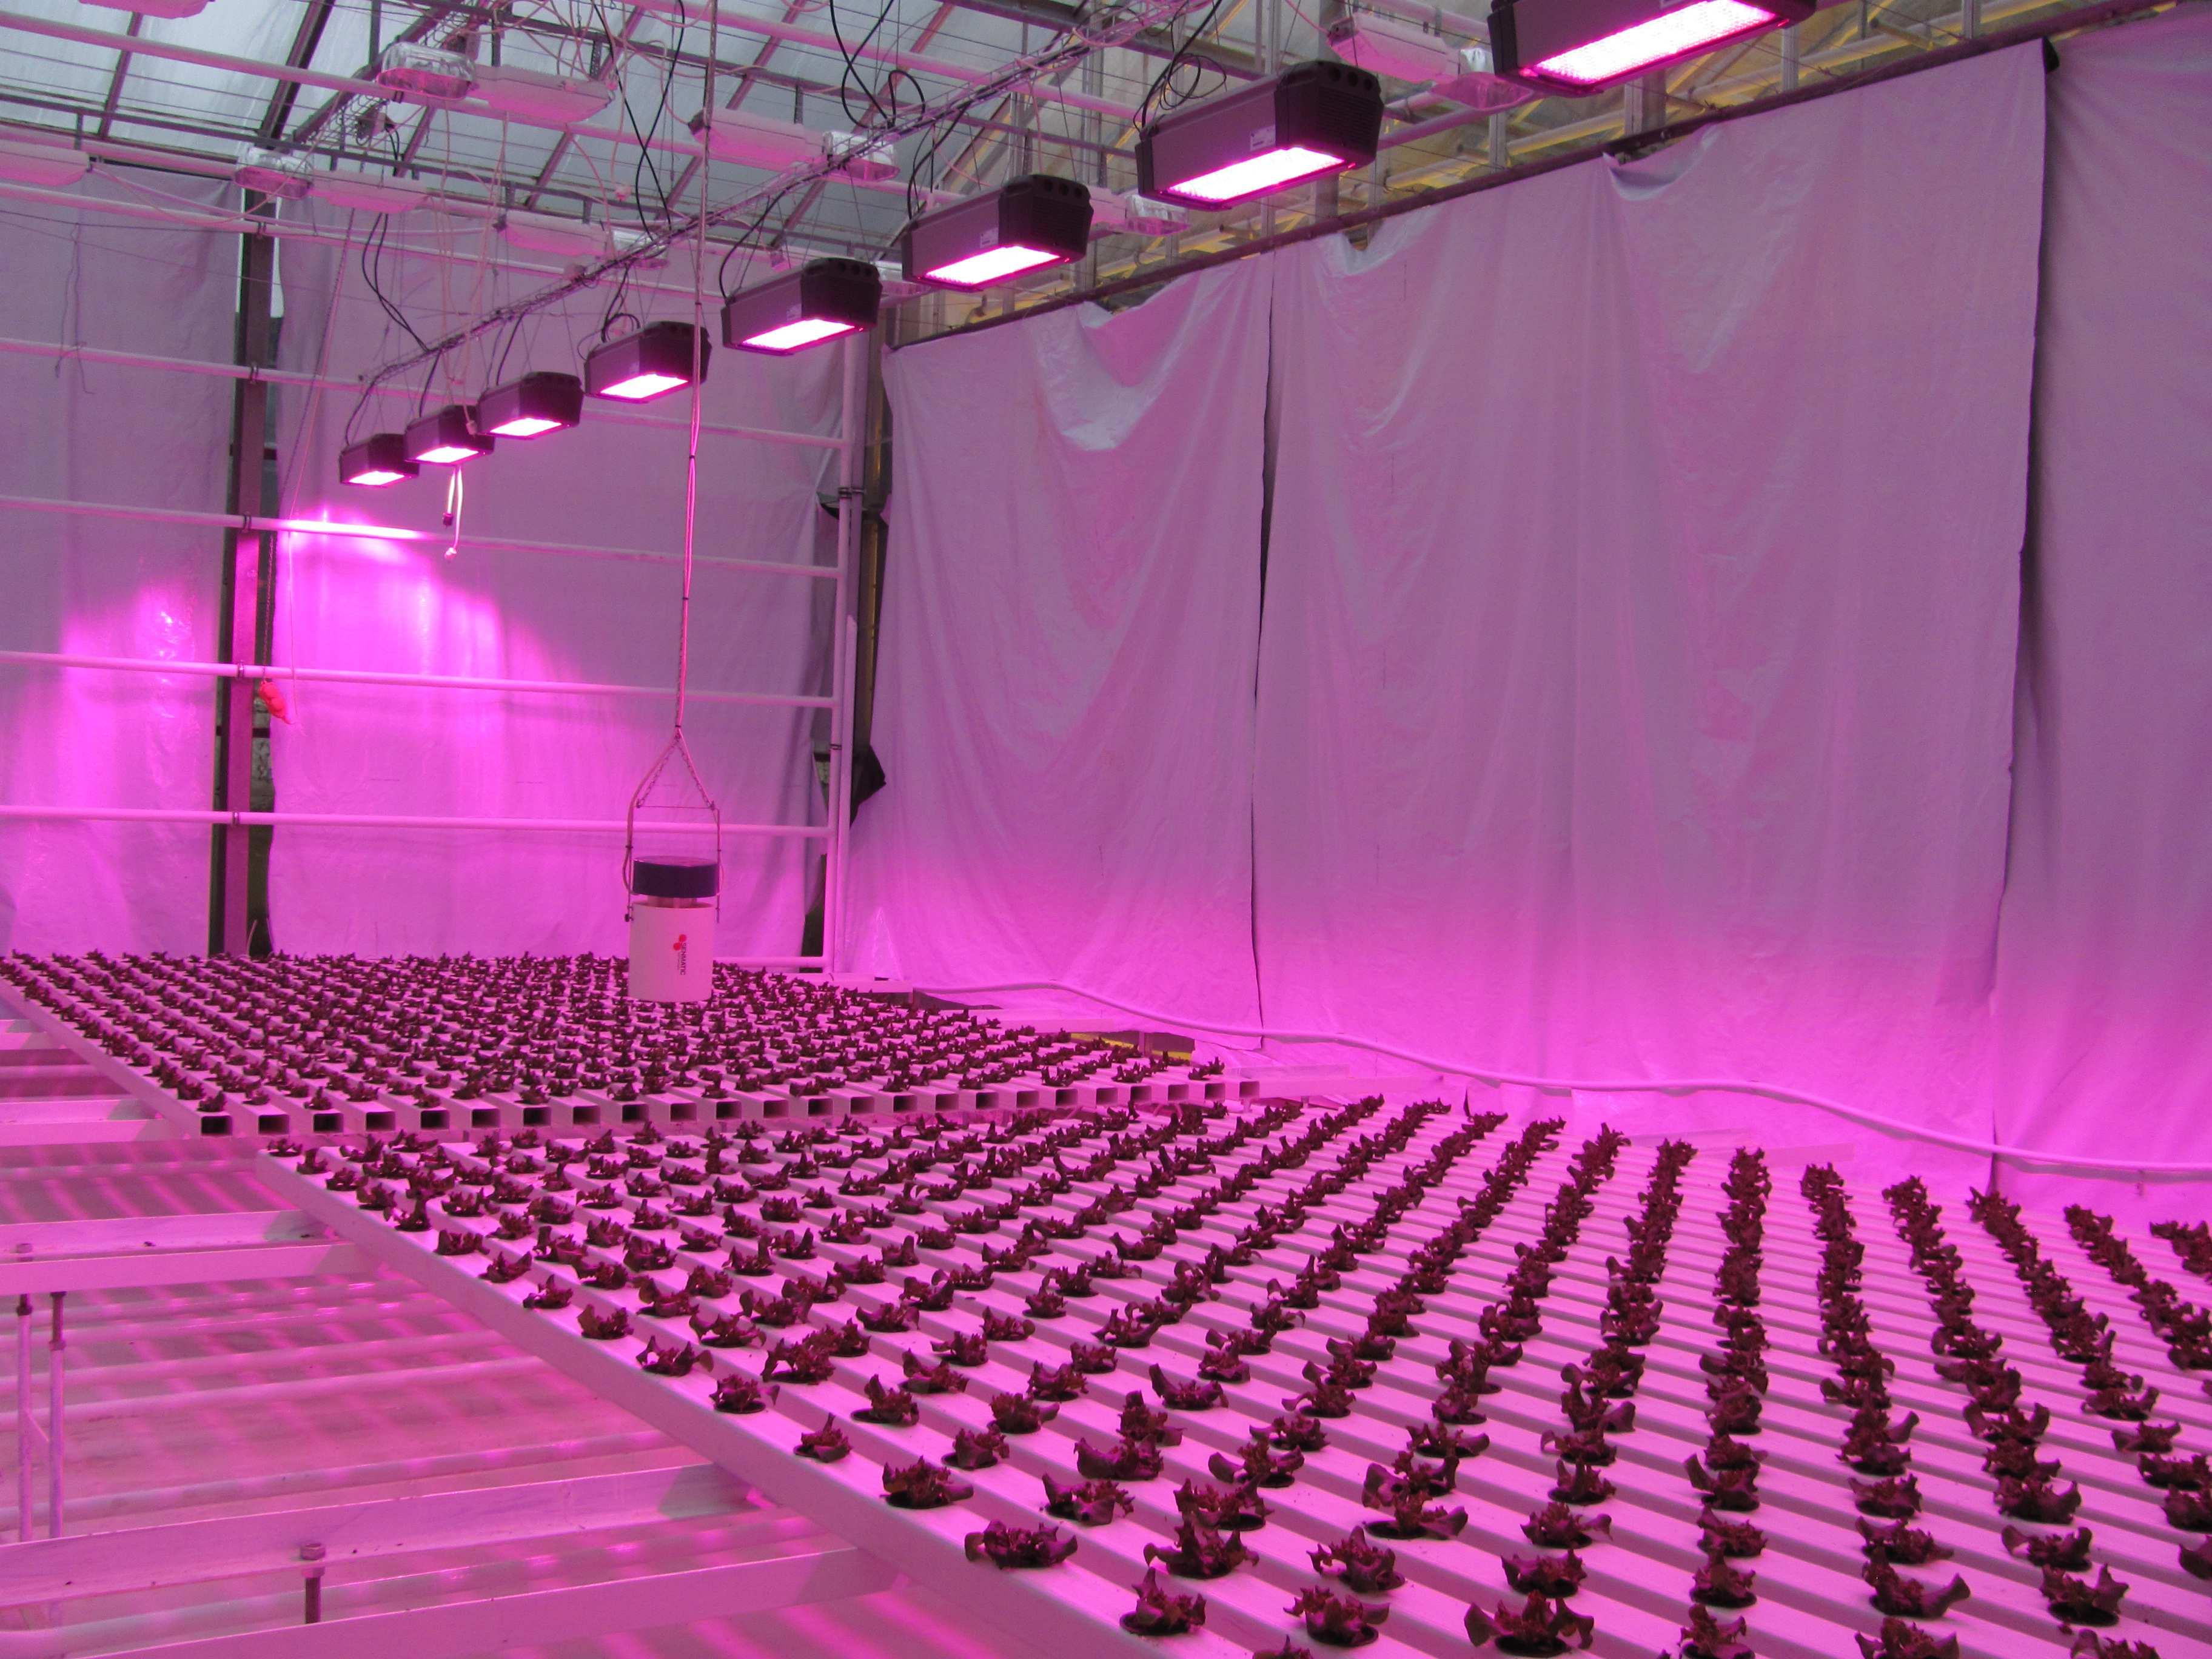
2. LED (Fiona lighting, 80 % rauð, 20 % blá), 167 µmol/m2/s, 20 / 15°C (day / night); 800 ppm CO2
Fig. 2a: After moving plants into different chambers (left: HPS, right LED, experiment A).
1. HPS 120 W/m2, (Philips bulbs, 600 W), 132 µmol/m2/s, 19 / 15°C (day / night); 800 ppm CO2
2. HPS 96 W/m2 (Philips bulbs, 600 W) + LED (Fiona lighting, 80 % rauð, 20 % blá), 136 µmol/m2/s, 19 / 15°C (day / night); 800 ppm CO2
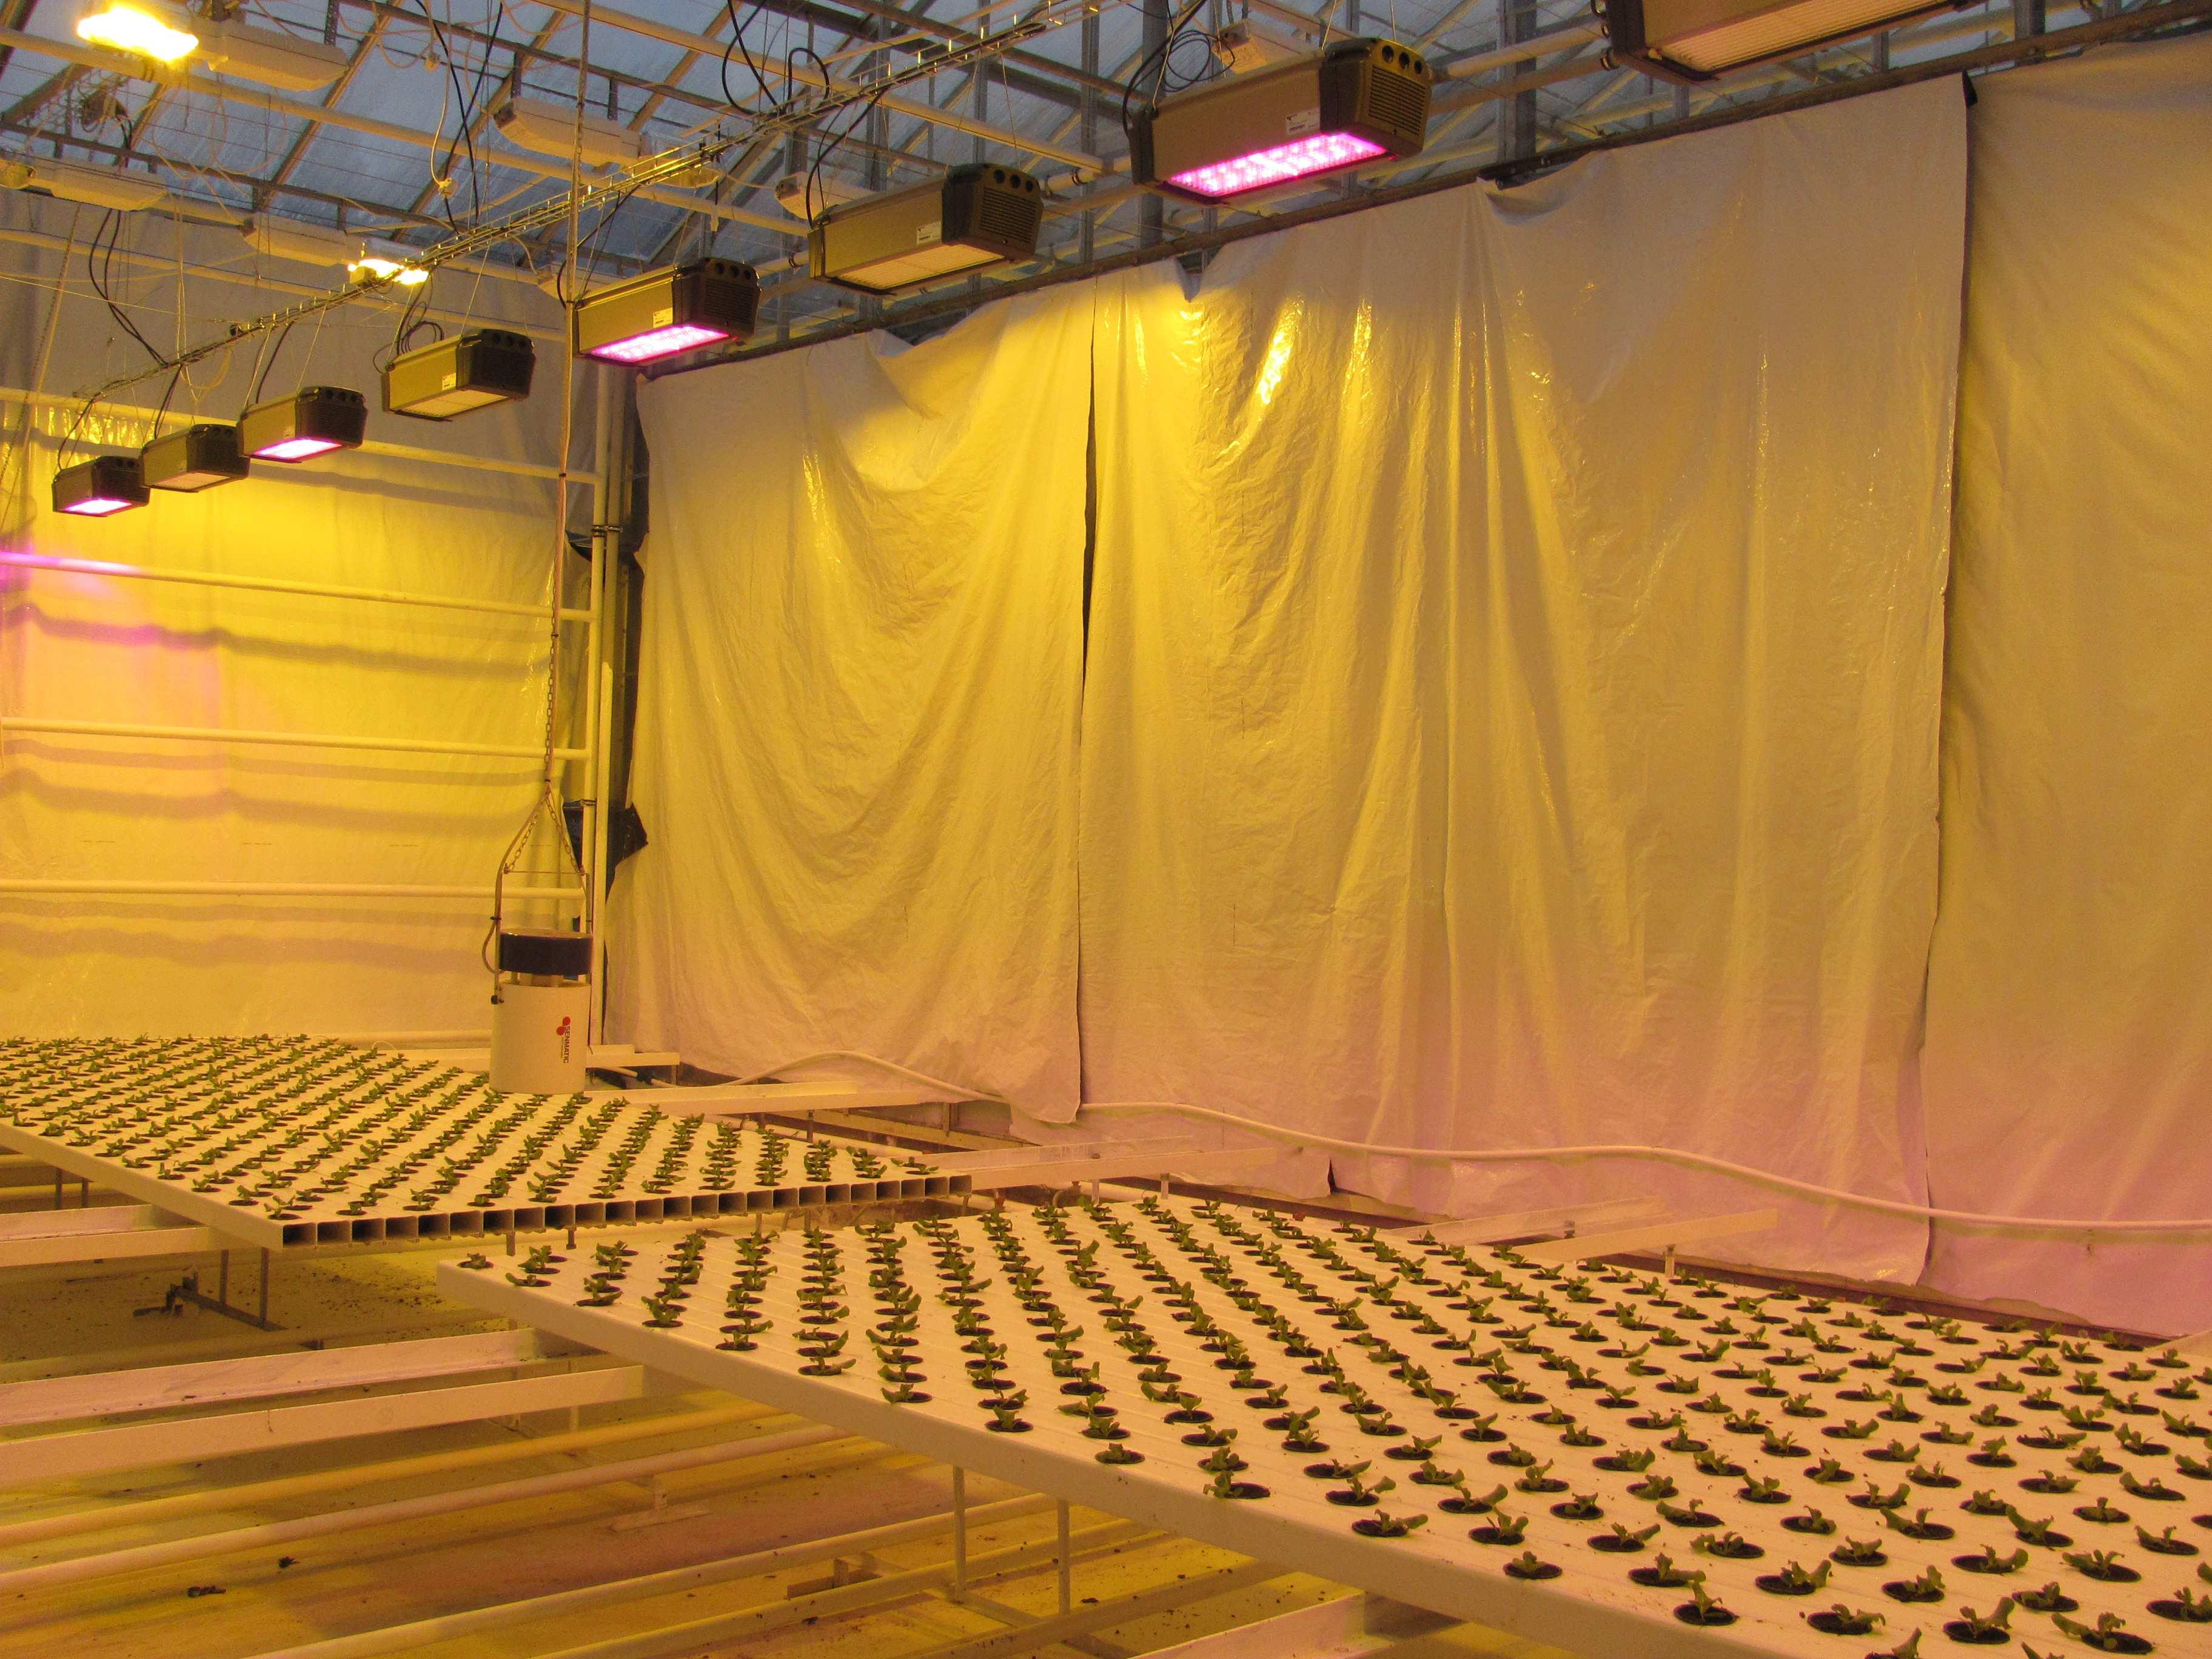
The lamps were distributed in the way that salad got the most equal light distribution, on average, 132 µmol/m2/s in the HPS chamber and 167 µmol/m2/s in the LED chamber (Tab. 1a) and 136 µmol/m2/s in the combined chamber with HPS and LEDs (Tab. 1b). The LED lights were set to 12 % (=20 %) blue light. To get a more even distribution, 80 % power was given to the inner lamps and 100 % power to the outer lamps in experiment A. In experiment B was only part of the lamps turned on and either 20 % power or 30 % power given. In addition, white plastic on all surrounding walls helped to get a higher light level at the edges of the growing area in both experiments. The wavelength of red LEDs was 660 nm and of blue LEDs was 450 nm.
Tab. 1a: Light distribution of the HPS and LED chamber (experiment A).
HPS µmol/m2/s LED µmol/m2/s bed door middle glas average door middle glas average
A 136 141 132 136 164 174 175 171
B 122 125 125 124 165 165 168 166
C 114 125 132 124 164 165 165 165
D 135 142 150 142 161 169 167 165 average 127 133 135 132 163 168 169 167
Tab. 1b: Light distribution of the HPS and HPS+LED chamber (experiment B).
HPS µmol/m2/s HPS + LED µmol/m2/s bed door middle glas average door middle glas average
A 136 141 132 136 133 143 139 138
B 122 125 125 124 132 136 137 135 C 114 125 132 124 132 138 138 136 D 135 142 150 142 133 140 137 137 average 127 133 135 132 132 139 138 136
Salad received standard nutrition consisting of “Pioner Basis 8-5-30” (AZELIS) according to the following fertilizer plan (Tab. 2).
Tab. 2: Fertilizer mixture according to advice from Azelis. Stem solution A (1000 l)
Fertilizer (amount in kg) Calciumnitrate Pioner Basis 8-5-30
Stem solution B (1000 l)
Resistim (as required) E.C. (mS/cm) 100 125 0,5 10 2,2
Pioner Iron Chelate EDDHA 6 %
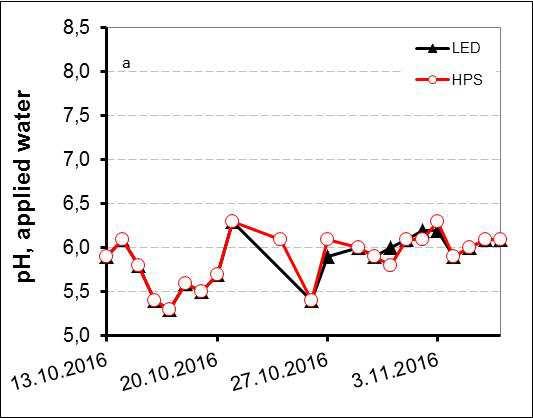
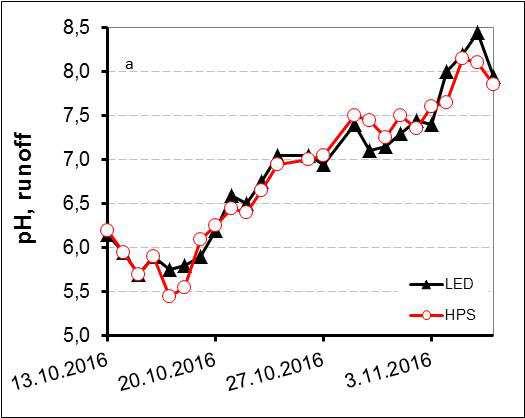
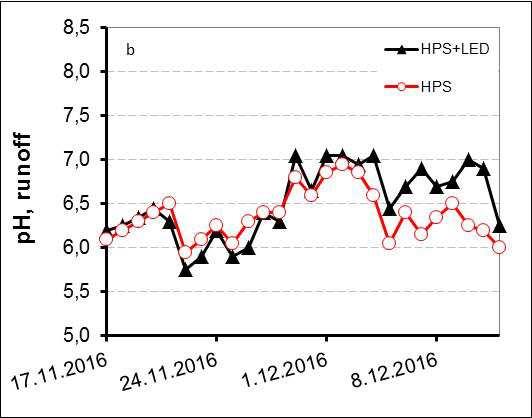
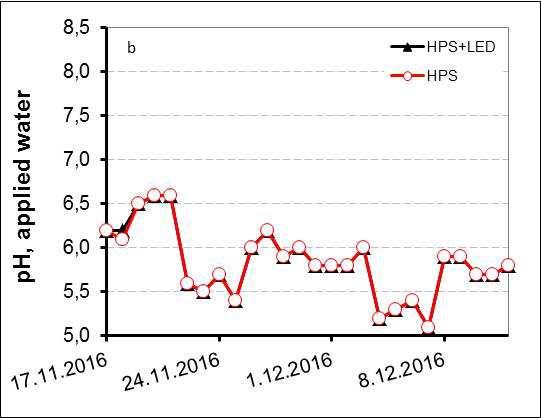
Salad was irrigated through NFT channels. It was aimed on having an E.C. of 1,6 mS/cm and a pH of 5,2-5,5 in the applied water and 5,5-6,0 in the runoff water.
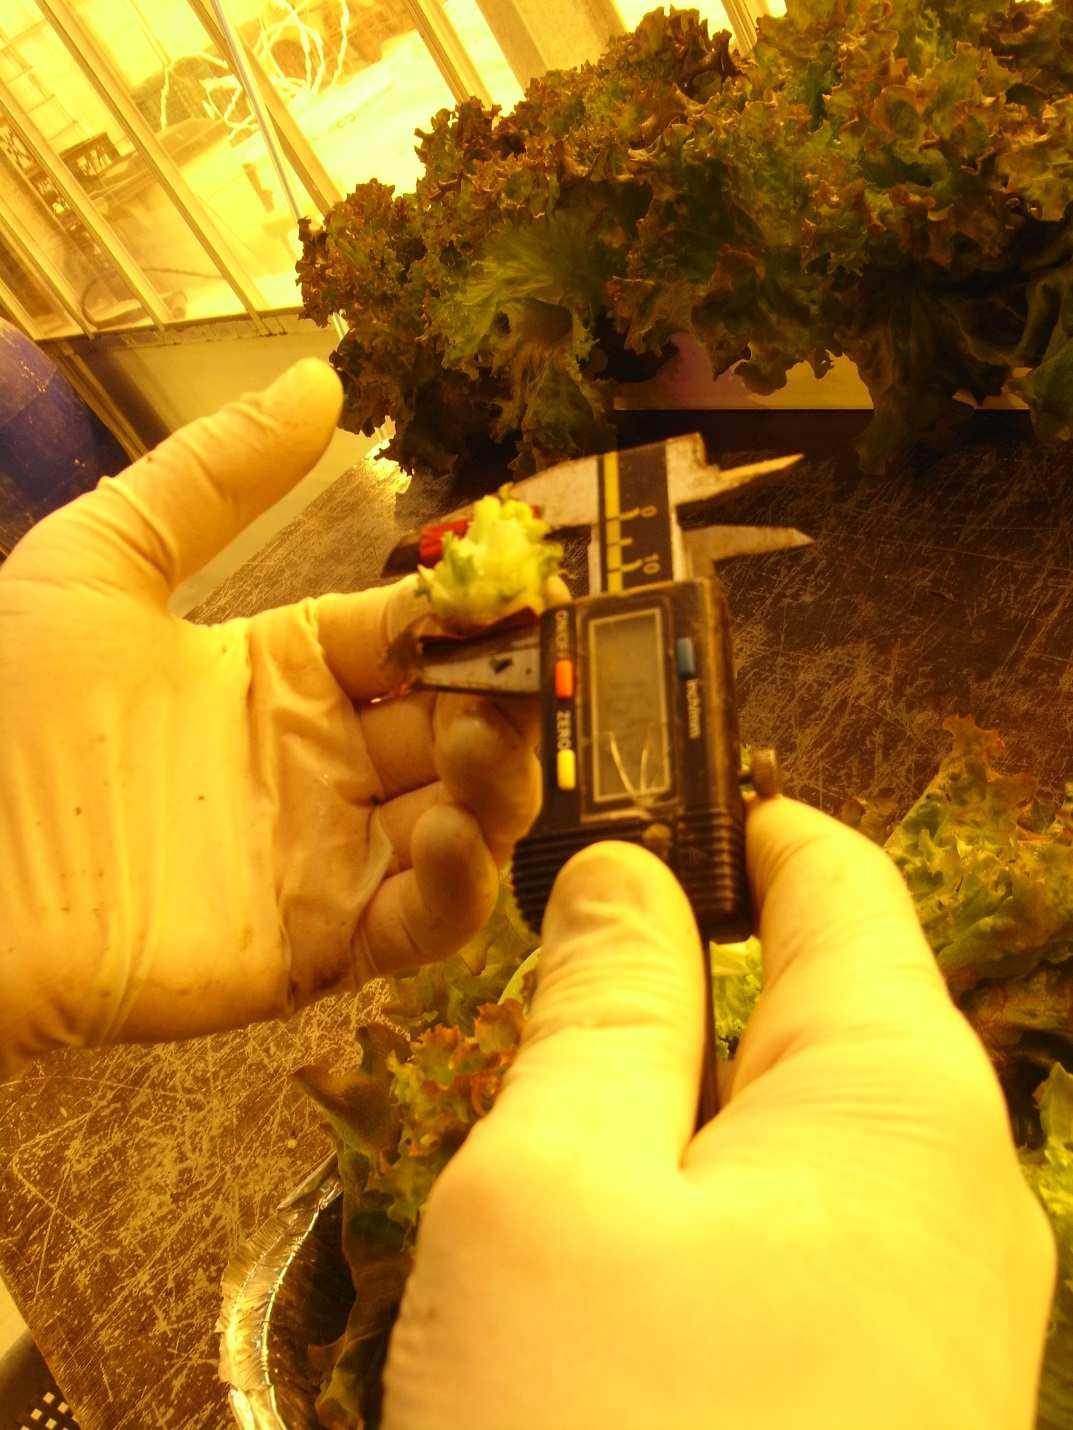
The amount of fertilization water (input and runoff) was measured every day. A total of 10 plants were harvested from each treatment at two different times during the experiment (day 35, day 42 after sowing). At sampling time, hypocotyl length (Fig. 4), number of leaves (a leaf was counted as a leaf when the length of the leaf was 2 cm or more), fresh weight and subsamples were dried at 105 °C for 24 h for total dry matter yield (DM). The salad growth index was calculated. The interior quality of salad was determined. The sugar content was measured with a brix meter , Tokyo, Japan). The colour of leaves was
Fig. 4: Measurement of hypocothyl length.
Substrate temperature and leaf temperature was measured. Energy use efficiency (total cumulative yield in weight per kWh) and costs for lighting per kg yield as well as profit margin were calculated for economic evaluation.
SAS Version 9.4 was used for statistical evaluations. The results were subjected to one-way analyses of variance with the significance of the means tested with a Tukey/Kramer HSD-test at p ≤ 0,05.
Solar irradiation was allowed to come into the greenhouse. Therefore, incoming solar irradiation is affecting plant development and was regularly measured. The experiment was conducted during high winter and thus, the natural light level was during the different lighting treatments very low and stayed at around 1 kWh/m2 (Fig. 5).
Fig. 5: Time course of solar irradiation. Solar irradiation was measured every day and values for one week were cumulated.
The settings of the chambers were monitored (Tab. 3a, Tab. 3b). In experiment A was the air temperature in average 9 % higher in the LED chamber compared to the HPS chamber. This is equivalent to the settings, as in the LED chamber was a temperature of 20 °C chosen, while 19 °C was chosen in the HPS chamber to be able to have comparable leaf and root temperatures between lighting treatments
(Tab. 3a). The floor temperature was in average 30 % higher in the LED chamber, while the wall temperature was 20 % higher in the HPS chamber. The humidity was in average 21 % higher in the HPS chamber. Windows were more than 60 % open in the LED chamber. However, in average was here the CO2 amount about 17 % higher compared to the HPS chamber. The reason for that was, that the sensor in the LED chamber was wrongly callibrated and resulting in lower measured values than the true value.
Tab. 3a: Settings of the LED and HPS chamber in experiment A.
Chamber Average Min Max 1. week 2. week 3. week 4. week
Air (° C) LED HPS 20,8 18,8 19,4 17,9 22,1 20,4 20,7 19,6 20,9 18,9 20,1 18,4 21,2 18,3
Floor (° C) LED HPS 40,4 28,0 37,9 24,1 44,5 40,8 40,5 35,6 39,3 26,8 40,0 25,9 41,9 24,8 Wall (° C) LED HPS 23,4 28,0 19,5 20,3 40,5 37,1 26,5 29,6 26,5 27,4 20,4 29,0 20,7 26,2
CO2 (ppm) LED HPS 928,1 771,1 769,3 515,4 1063,7 853,7 884,1 703,9 900,3 776,5 926,4 808,7 995,5 785,6
Humidity (%) LED HPS 54,2 65,6 38,3 48,3 61,3 72,4 48,8 57,1 53,0 66,0 56,5 67,4 57,8 70,7
Window1 LED HPS 15,1 5,5 0 0 72,5 56,7 24,4 15,2 14,1 5,9 5,9 0,2 17,3 1,9
Window2 LED HPS 10,5 3,0 0 0 55,6 34,9 18,1 10,2 15,7 1,4 8,5 1,4 0,9 0,1 Leaves (° C) LED HPS 17,1 16,8 21,0 19,9 17,6 17,6 16,5 15,9 13,4 14,0 Roots (° C) LED HPS 19,9 20,1 20,7 21,3 20,5 19,9 18,7 18,8 20,0 20,5
In experiment B was the air temperature nearly the same in both chambers. The floor temperature was in average 5 % higher and the wall temperature 35 % higher in the HPS chamber. The humidity was in average 17 % higher in the HPS chamber.
Windows were more open in the HPS+LED chamber. However, in average was the CO2 amount about 5 % higher in the HPS+LED chamber. The reason for that was, that the sensor in the HPS+LED chamber was wrongly callibrated and resulting in lower measured values than the true value. This was observed at the end of November and callibrated correctly.
Tab. 3b: Settings of the HPS+LED and HPS chamber in experiment B. Chamber Average Min Max 1. week 2. week 3. week 4. week
Air (° C)
HPS+LED HPS 19,7 19,1 18,4 17,8 21,8 20,4 18,7 18,0 19,5 18,8 20,4 19,9 20,0 19,8 Floor (° C)
HPS+LED HPS 31,6 33,4 18,8 31,7 39,2 38,7 34,7 35,6 32,0 34,0 31,1 32,1 29,1 32,2 Wall (° C)
HPS+LED HPS 21,9 30,4 11,4 20,6 39,7 44,0 27,2 34,7 19,7 29,3 21,8 27,8 19,4 30,2 CO2 (ppm)
HPS+LED HPS 848,8 803,8 437,3 676,6 999,0 911,3 916,2 772,7 945,9 820,7 826,2 795,1 716,5 822,3 Humidity (%) HPS+LED HPS 54,5 63,9 33,2 49,1 63,6 74,0 44,8 51,8 54,0 62,5 59,4 68,4 58,3 71,1 Window1 HPS+LED HPS 3,4 0,3 0 0 21,6 1,5 1,0 0,3 3,4 0,0 3,9 0,2 5,1 0,7 Window2 HPS+LED HPS 4,7 0,7 0 0 19,5 8,2 0,8 0,5 4,8 0,1 8,6 1,8 4,1 0,3 Leaf (° C) HPS+LED HPS 15,9 15,5 15,3 13,8 15,1 15,6 17,4 17,3 Roots (° C) HPS+LED HPS 19,5 19,9 18,7 18,3 20,0 20,8 20,0 20,6
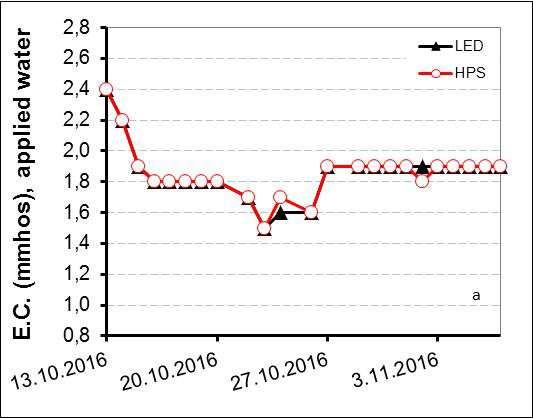
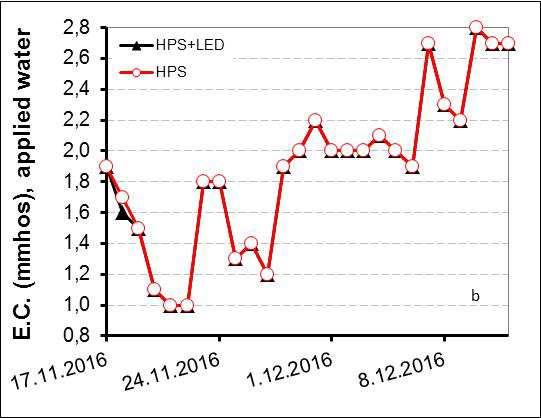
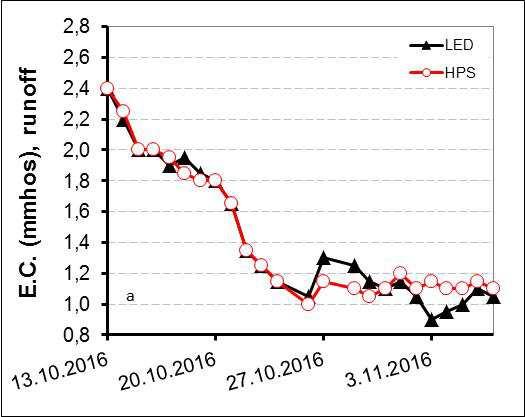
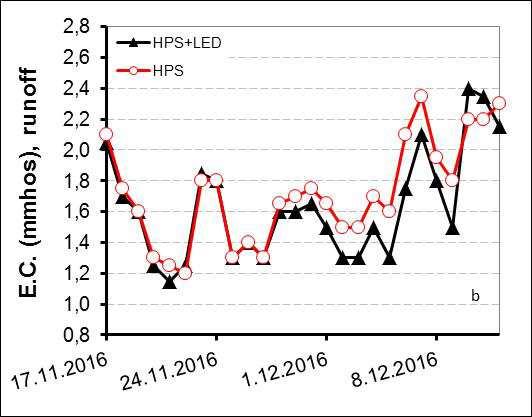
E.C. and pH of irrigation water was fluctuating much (Fig. 6). E.C. of applied water ranged between 1,0 and 2,8 and pH between 5,0 and 6,5. E.C. of runoff stayed mostly between 1,0 and 2,4 and the pH of runoff between 5,5 and 8,0. The E.C. of the applied water was mostly stable in experiment A, while in experiment B increased the E.C. The E.C. of the runoff decreased in experiment A and increased in experiment B. The pH of the runoff increased in experiment A during the growth period. The E.C of the runoff water was in experiment B at the latter part of the growth period mostly higher in the HPS chamber and the pH of the runoff mostly lower in the HPS chamber compared to the HPS+LED treatment (Fig. 6).
Fig. 6: E.C. and pH of irrigation and runoff water in experiment A (a) and B (b).

When the salad seedlings were planted into the NFT channels each plant had two leaves.
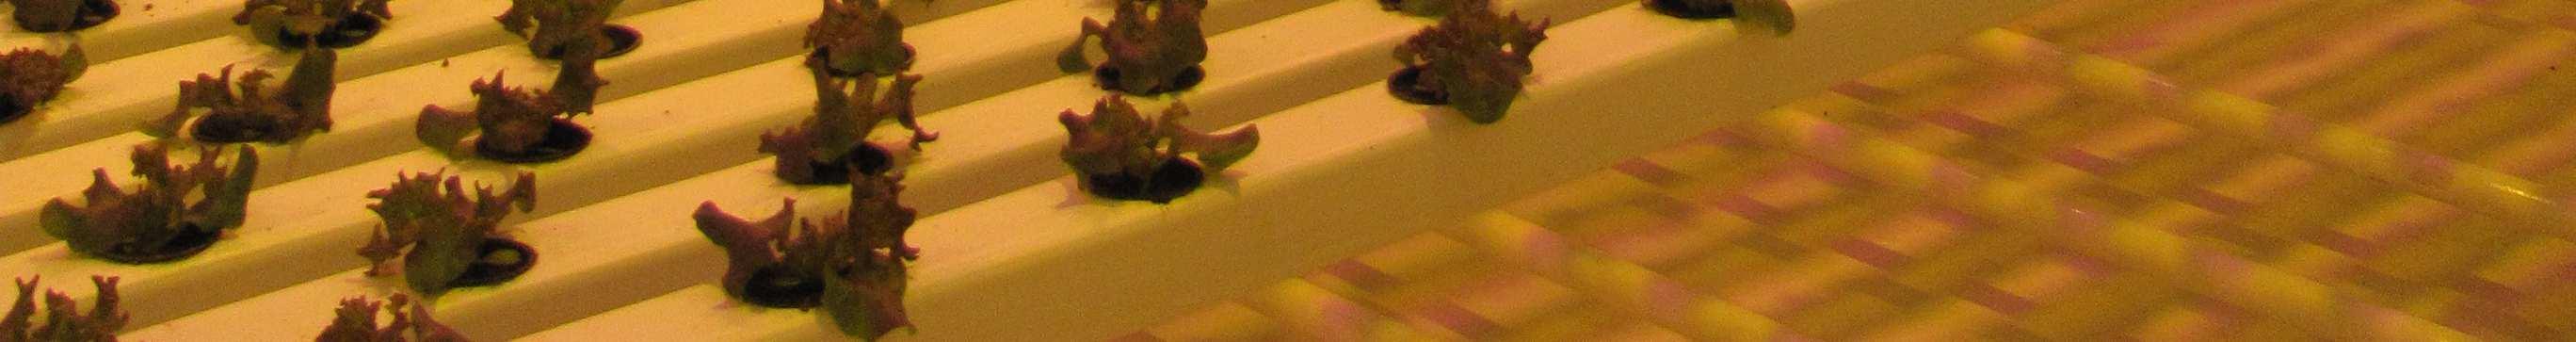
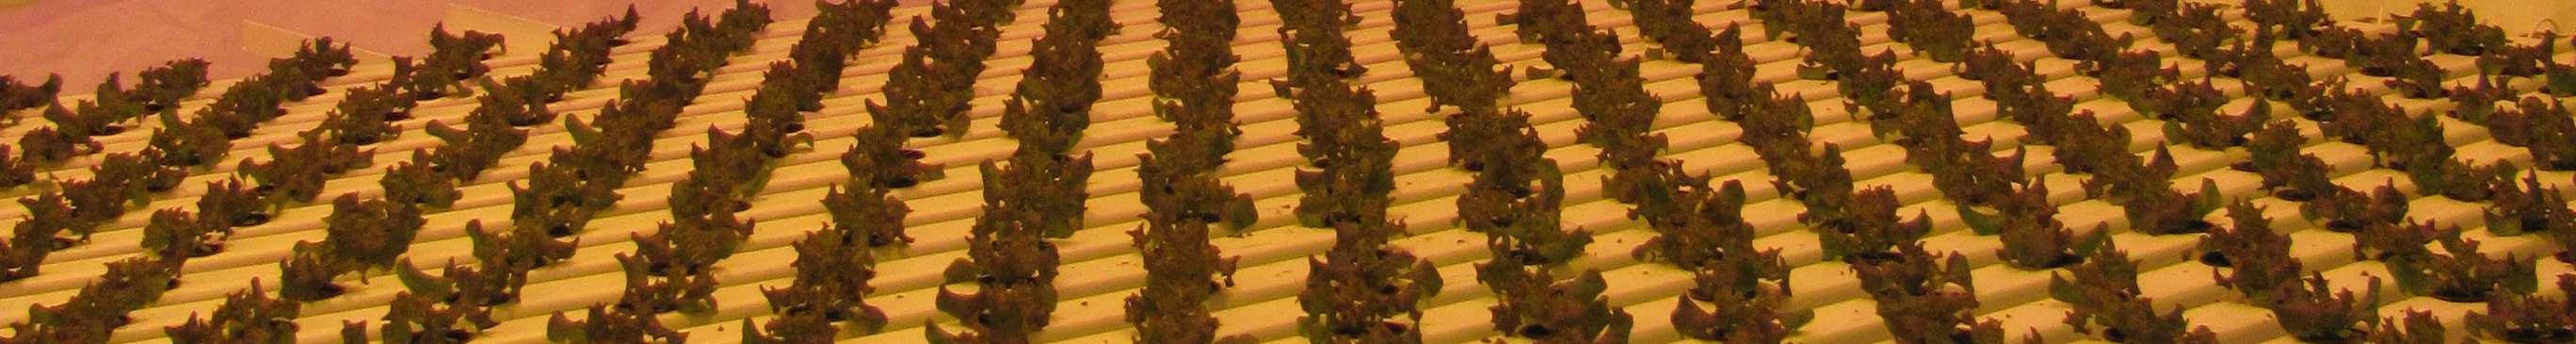
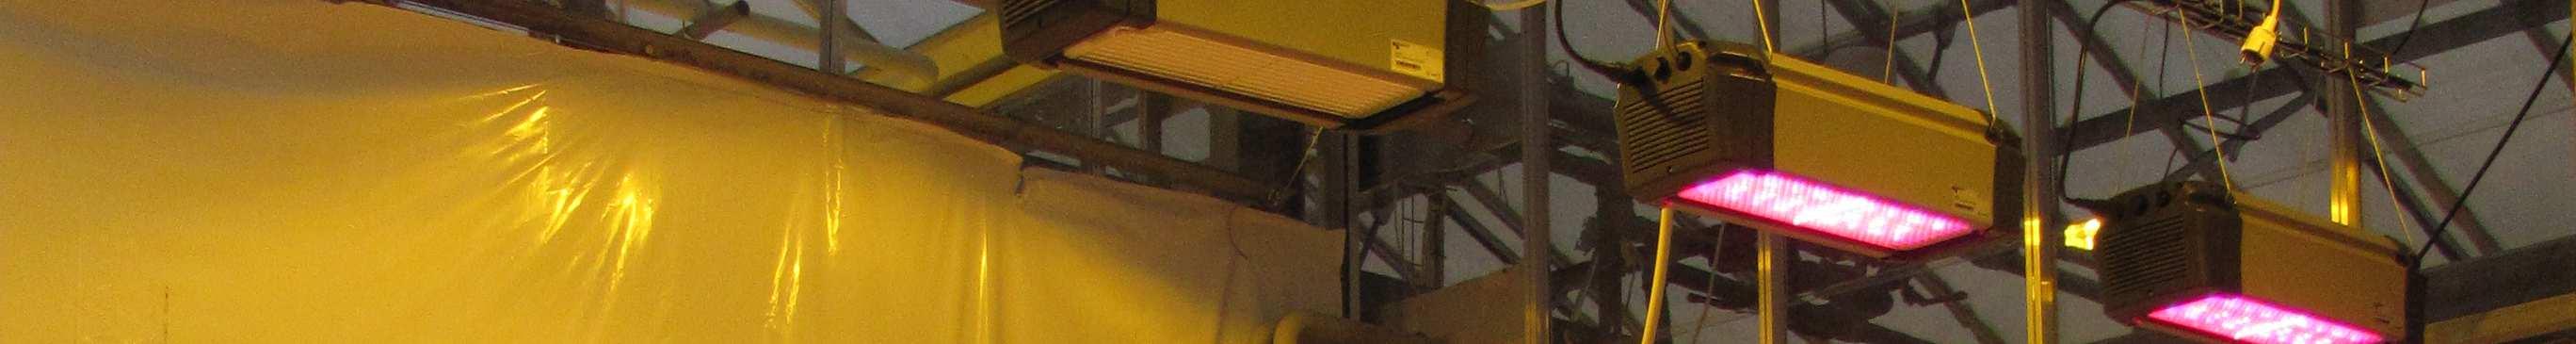
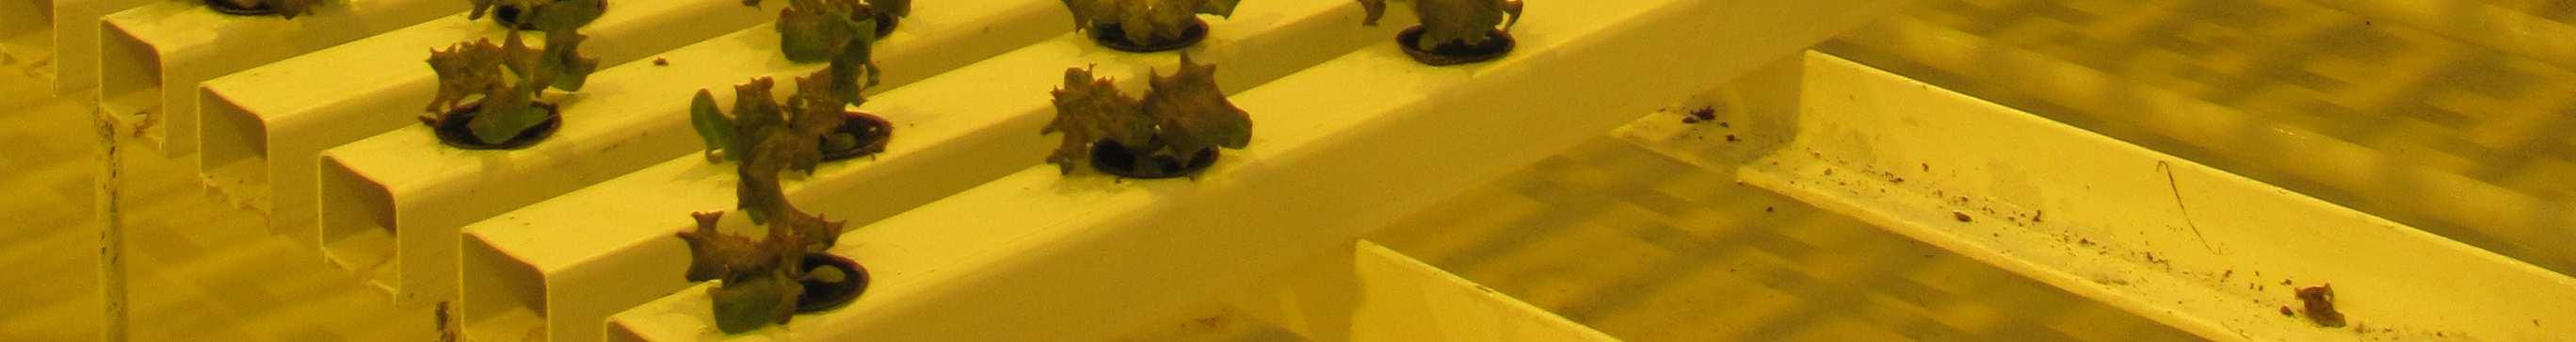
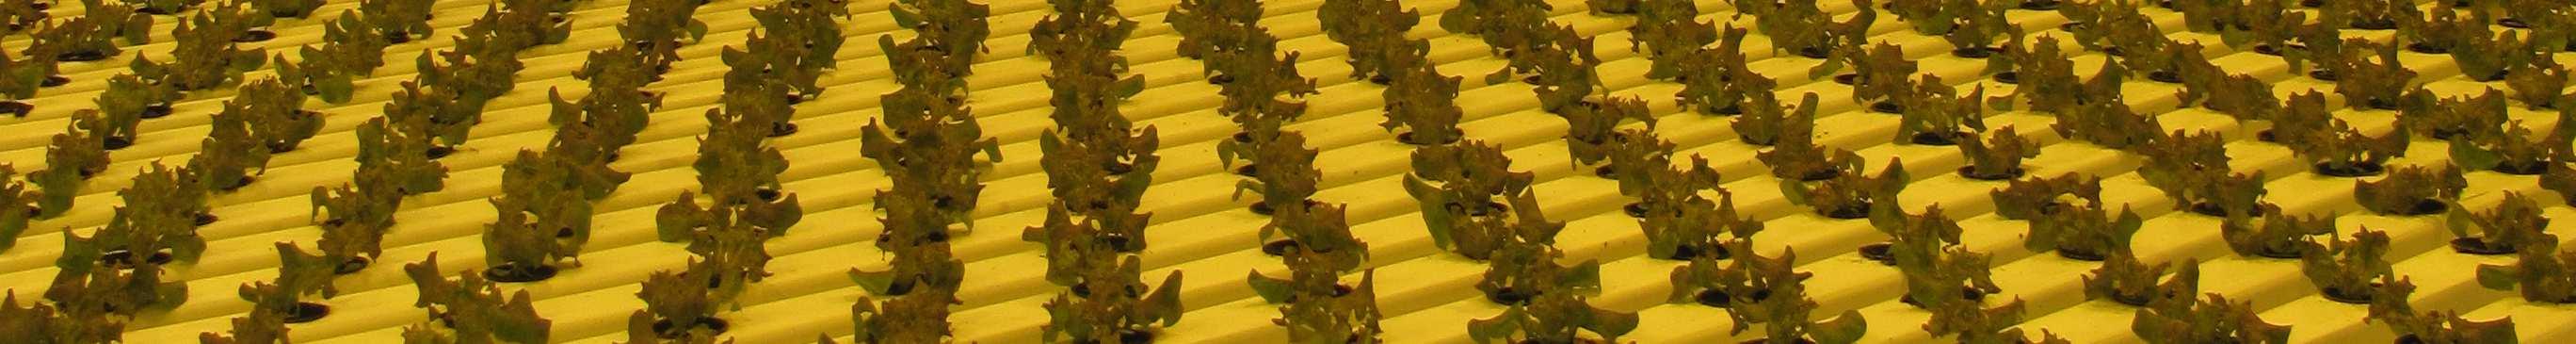
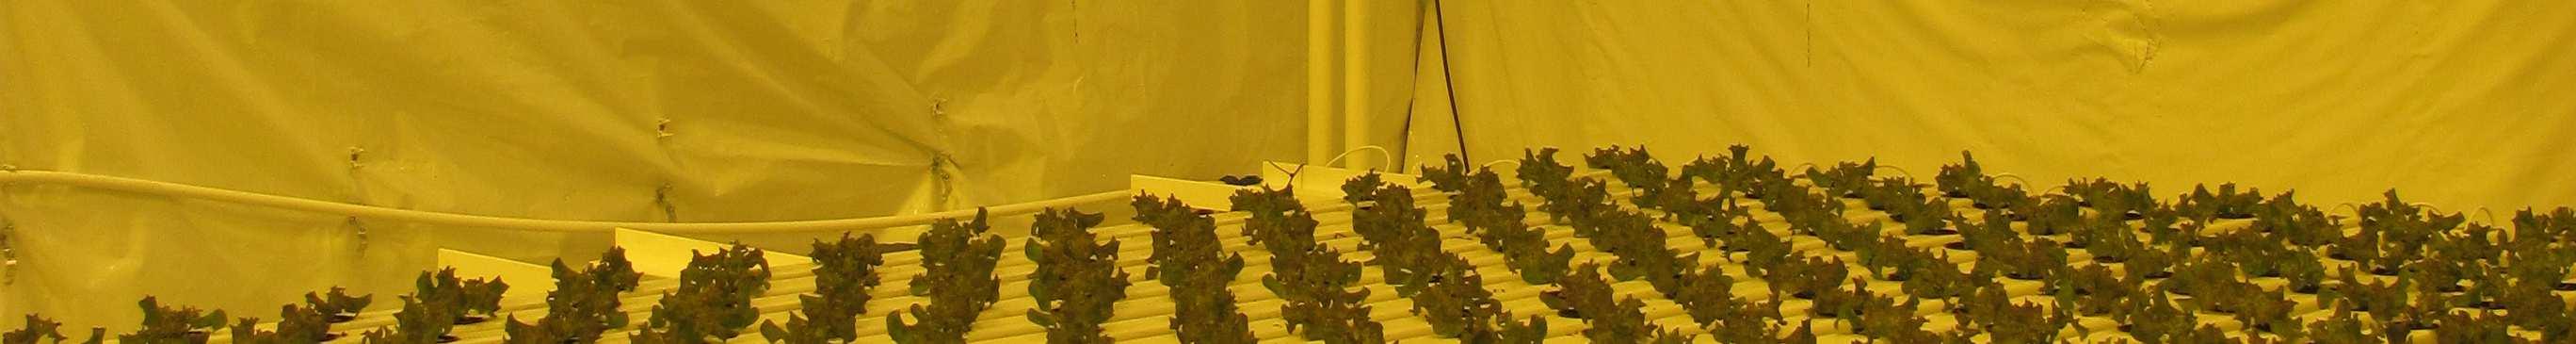
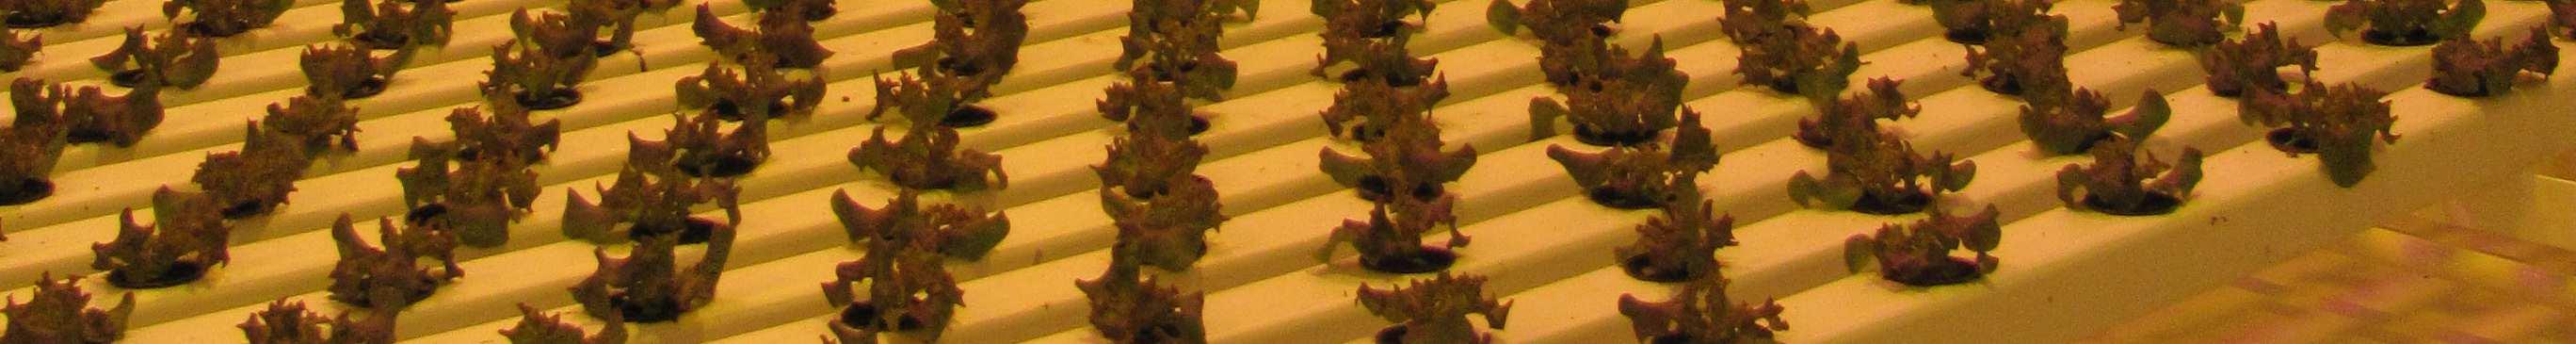
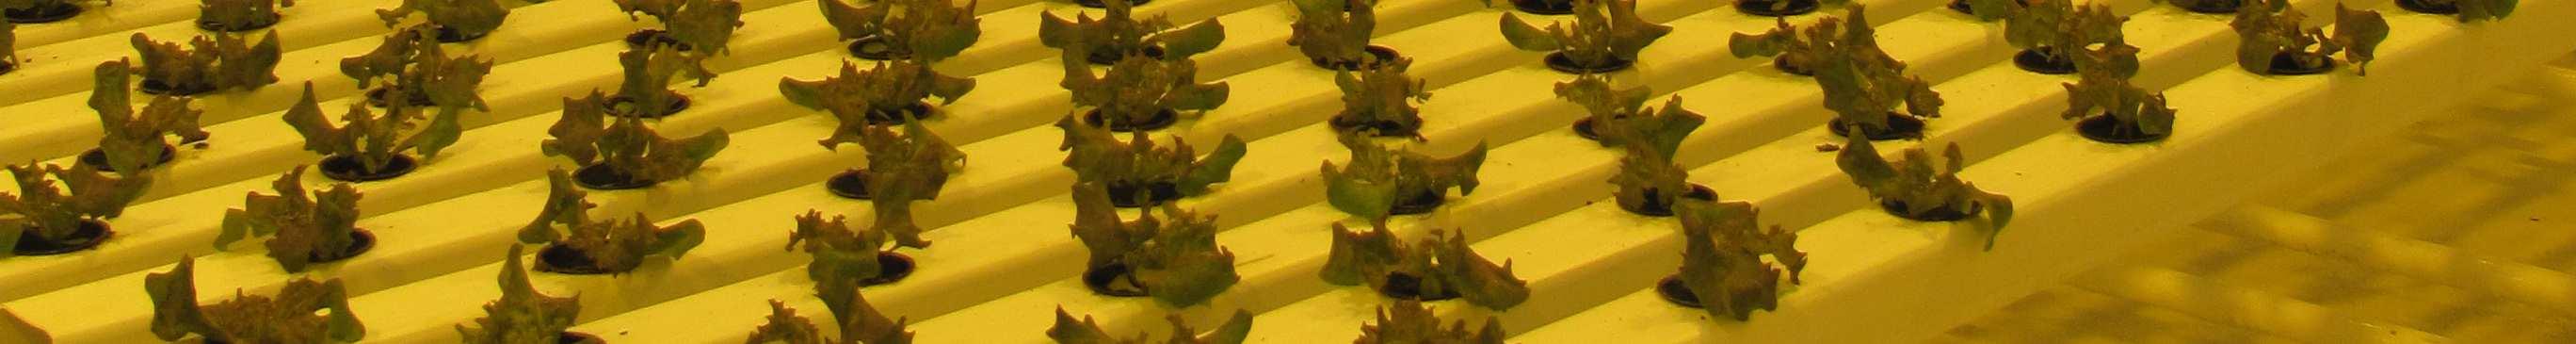
Fig. 7a: Salad one week after growing in the NFT channels (left: HPS, right: LED, experiment A).

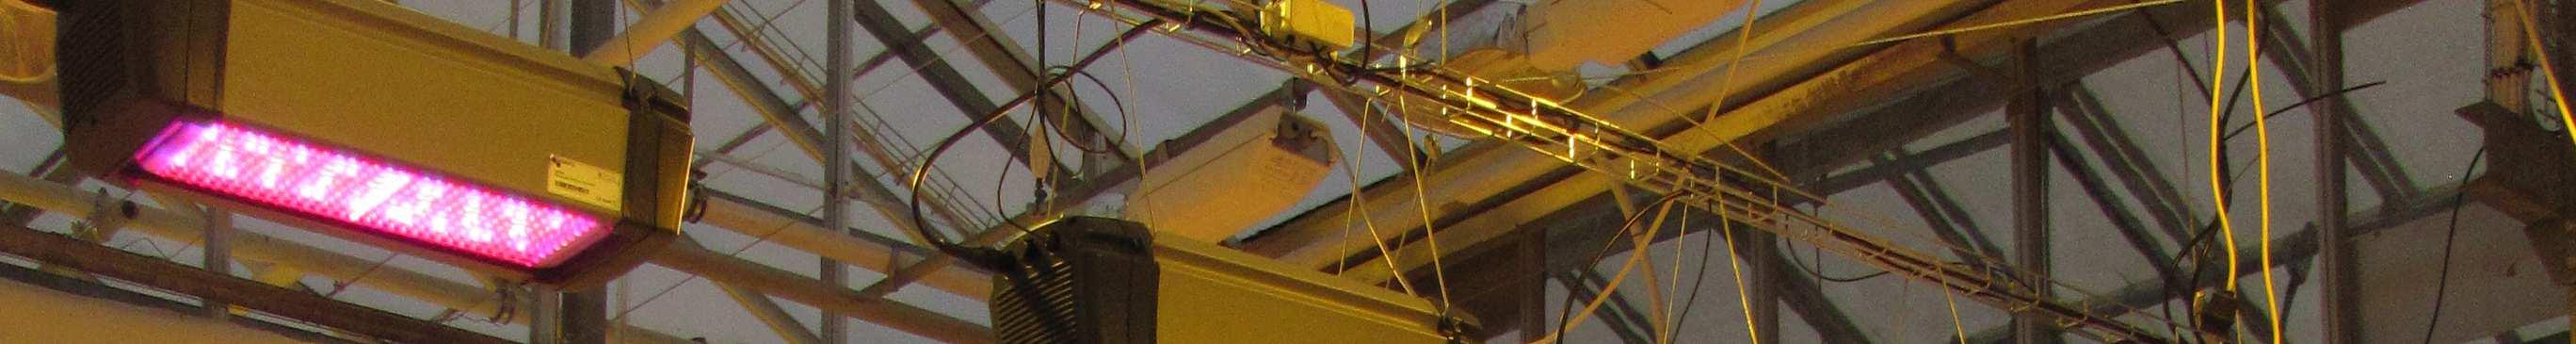
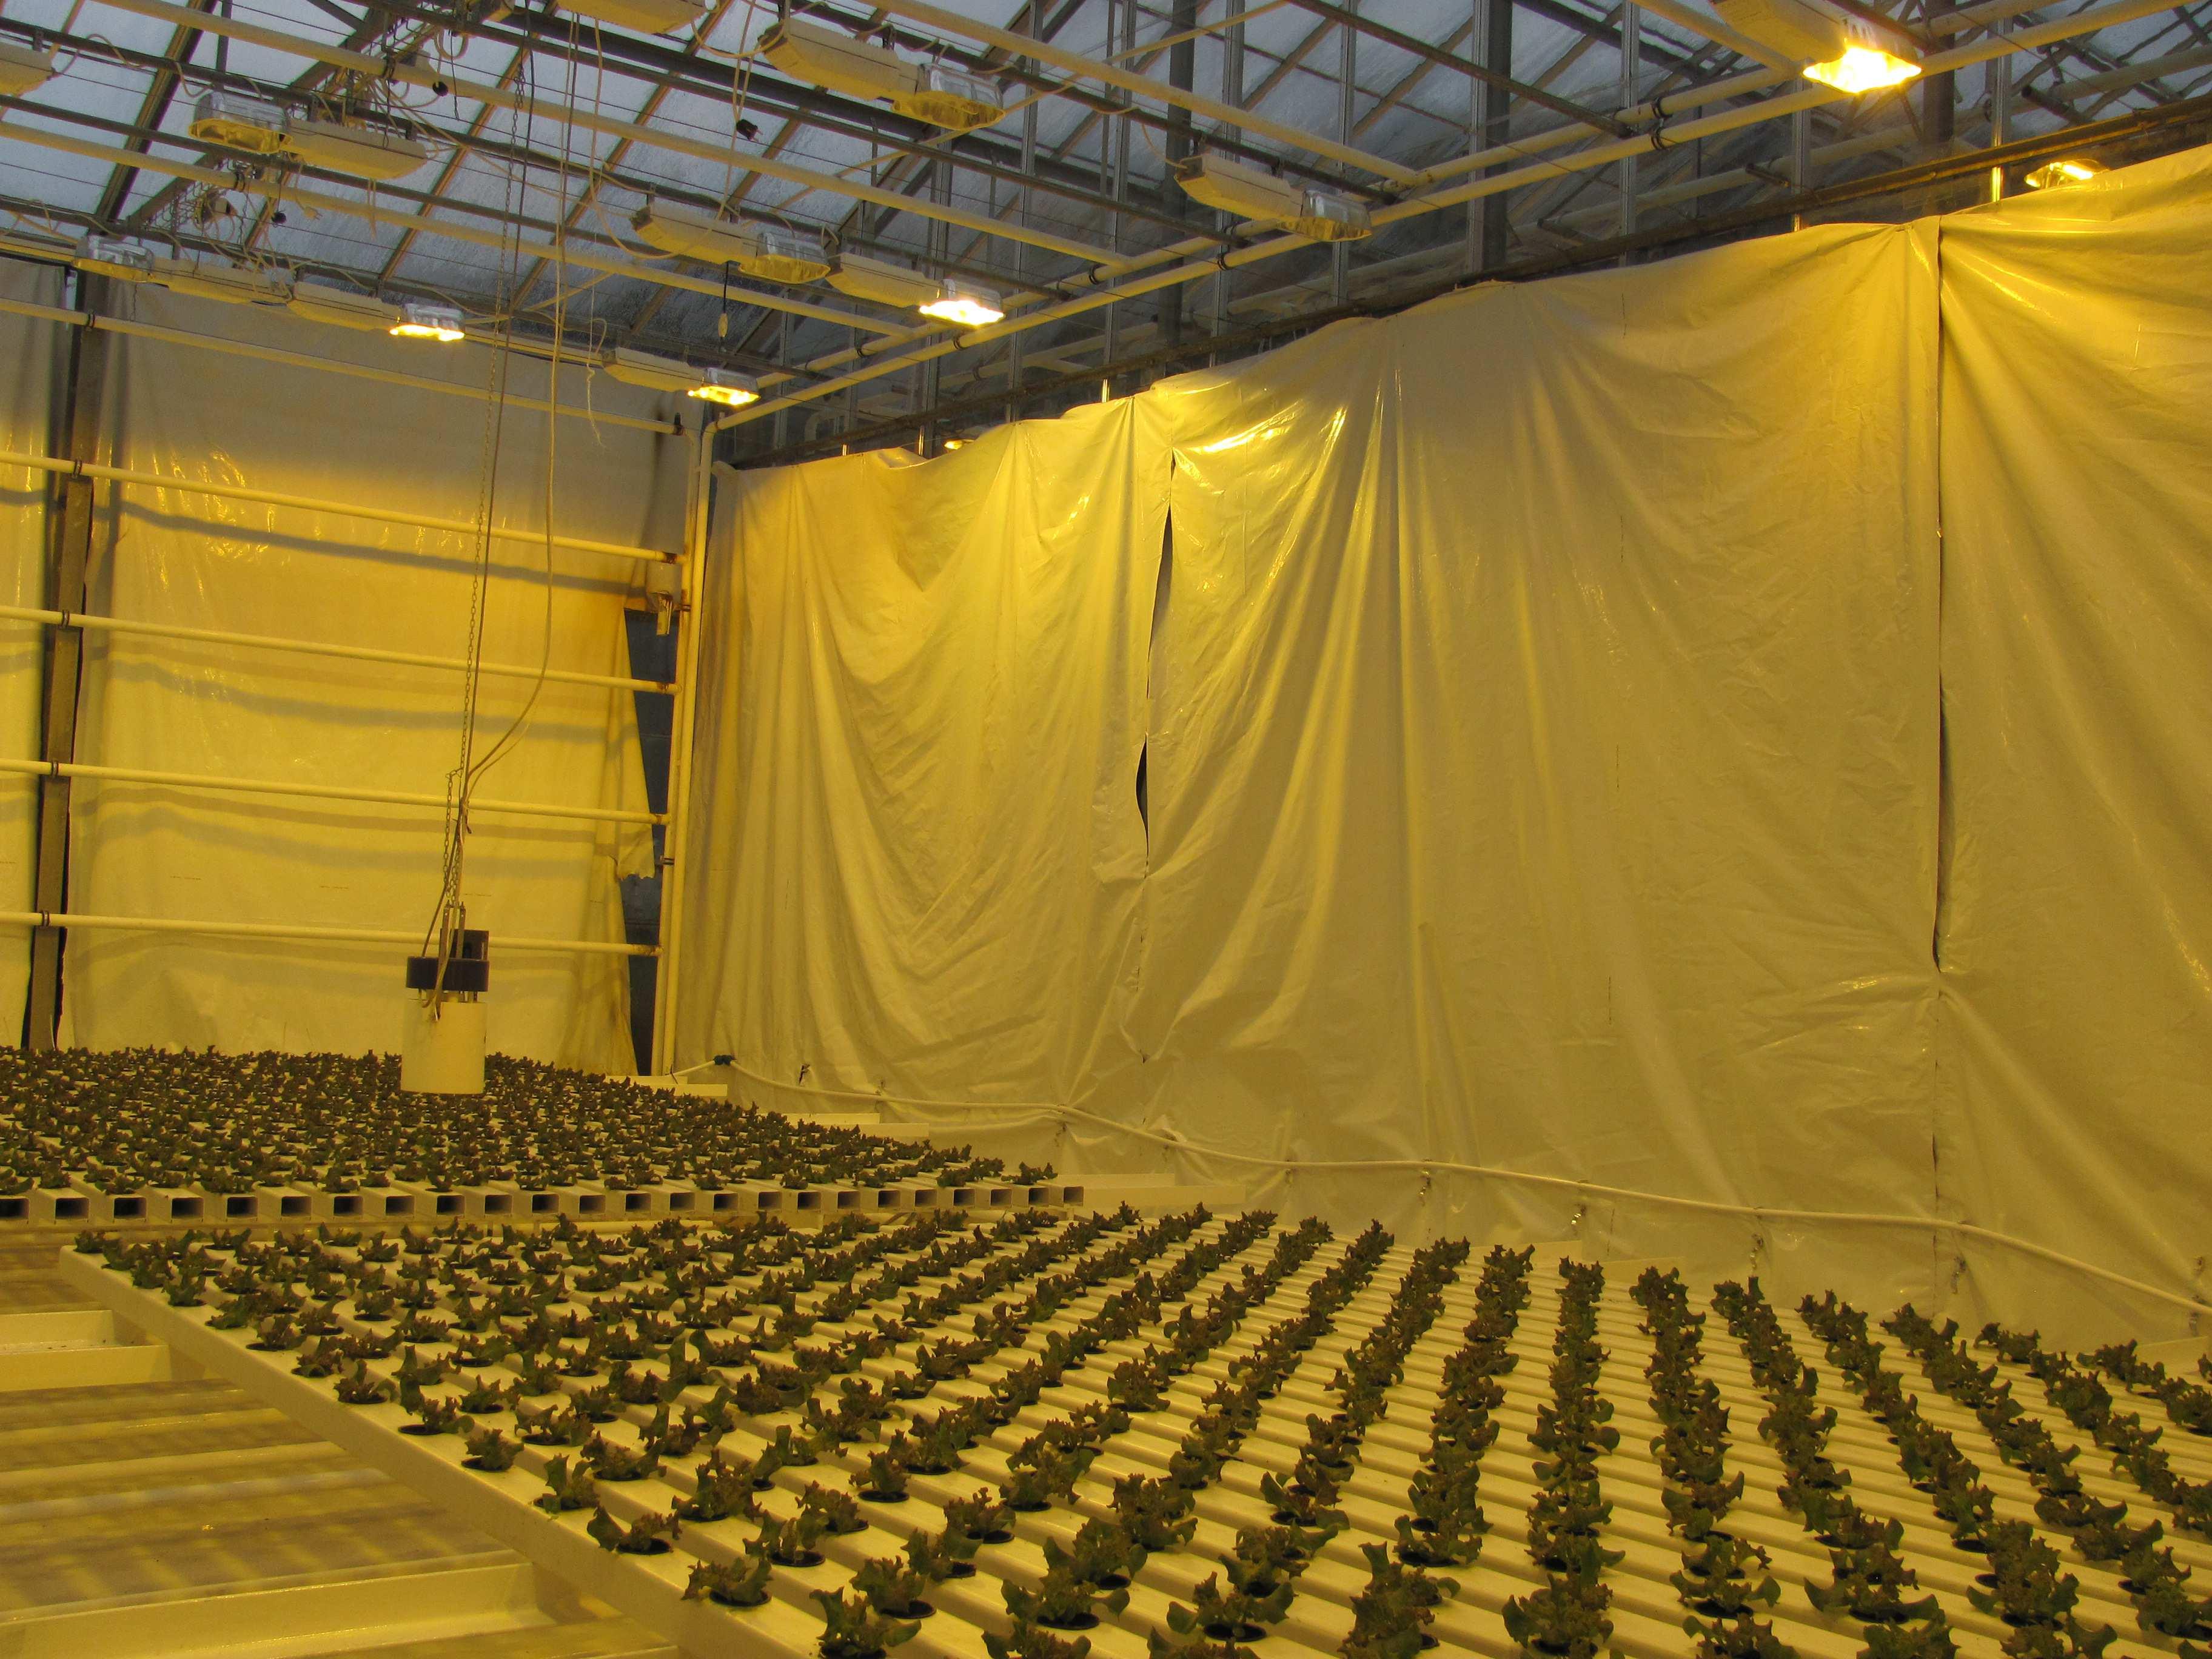
Fig. 7b: Salad one week after growing in the NFT channels (left: HPS, right: HPS+LED, experiment B).
Leaves of salad increased during the growth period and the increase was even faster with proceeding growing period (Fig. 8). Plants that received only HPS lights had tendentially more leaves than plants that received only LED lights (Fig. 8a) or HPS and LED lights together (Fig. 8b).
Fig. 8: Leaf number of salad after harvests. Letters indicate significant differences (HSD, p ≤ 0,05).
The length of the hypocothyl increased during the growth period (Fig. 9). The hypocothyl was at the end of the growth period tendentially higher when salad was grown under HPS lights compared to LED lights (Fig. 9a) or HPS and LED lights together (Fig. 9b).
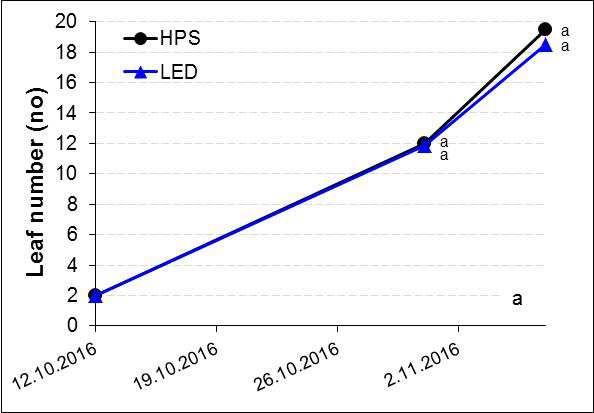
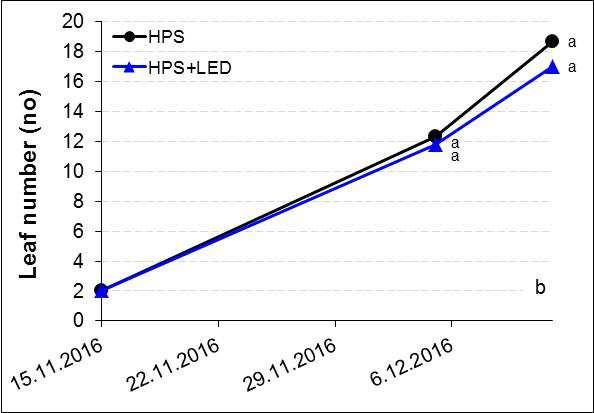

Fig. 9: Length of hypocothyl after harvests. Letters indicate significant differences (HSD, p ≤ 0,05).
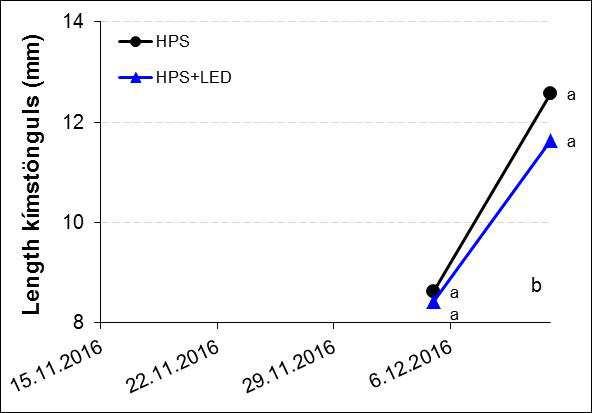


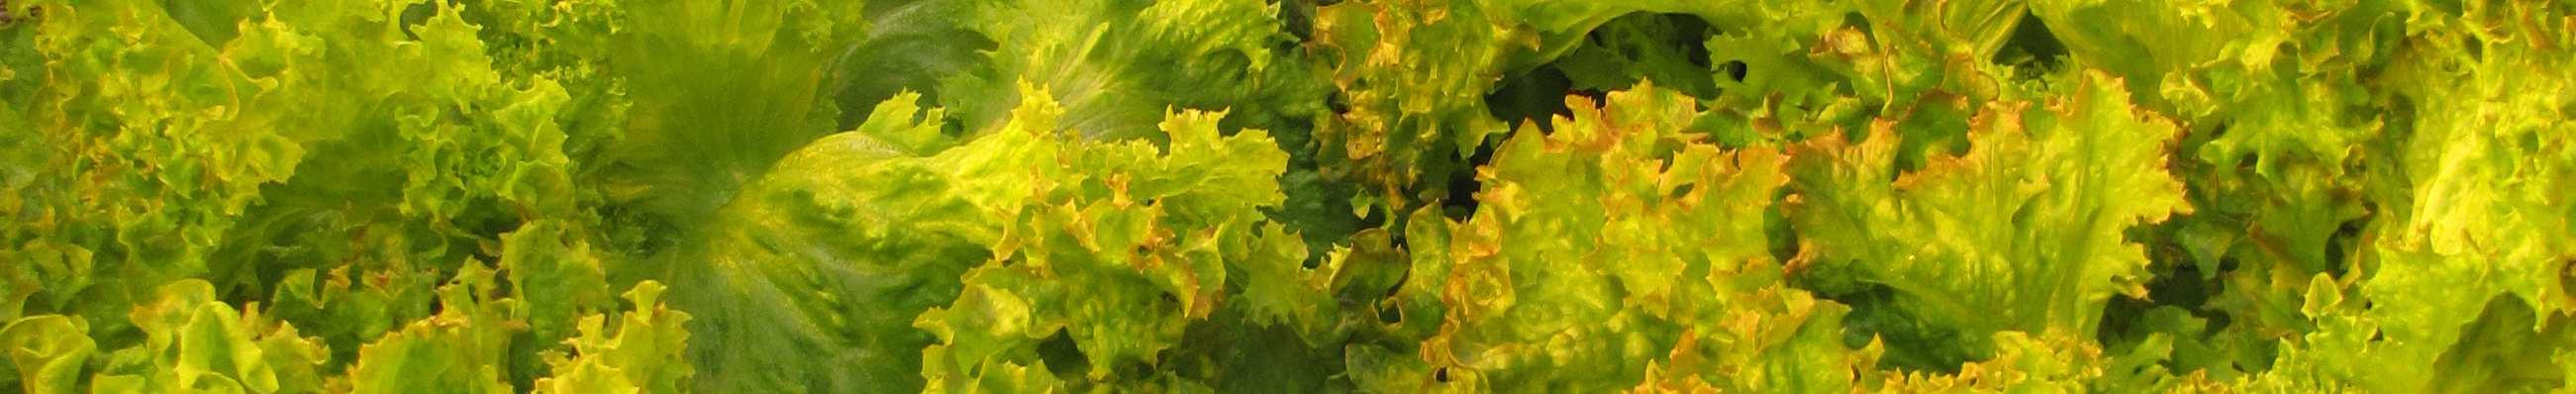
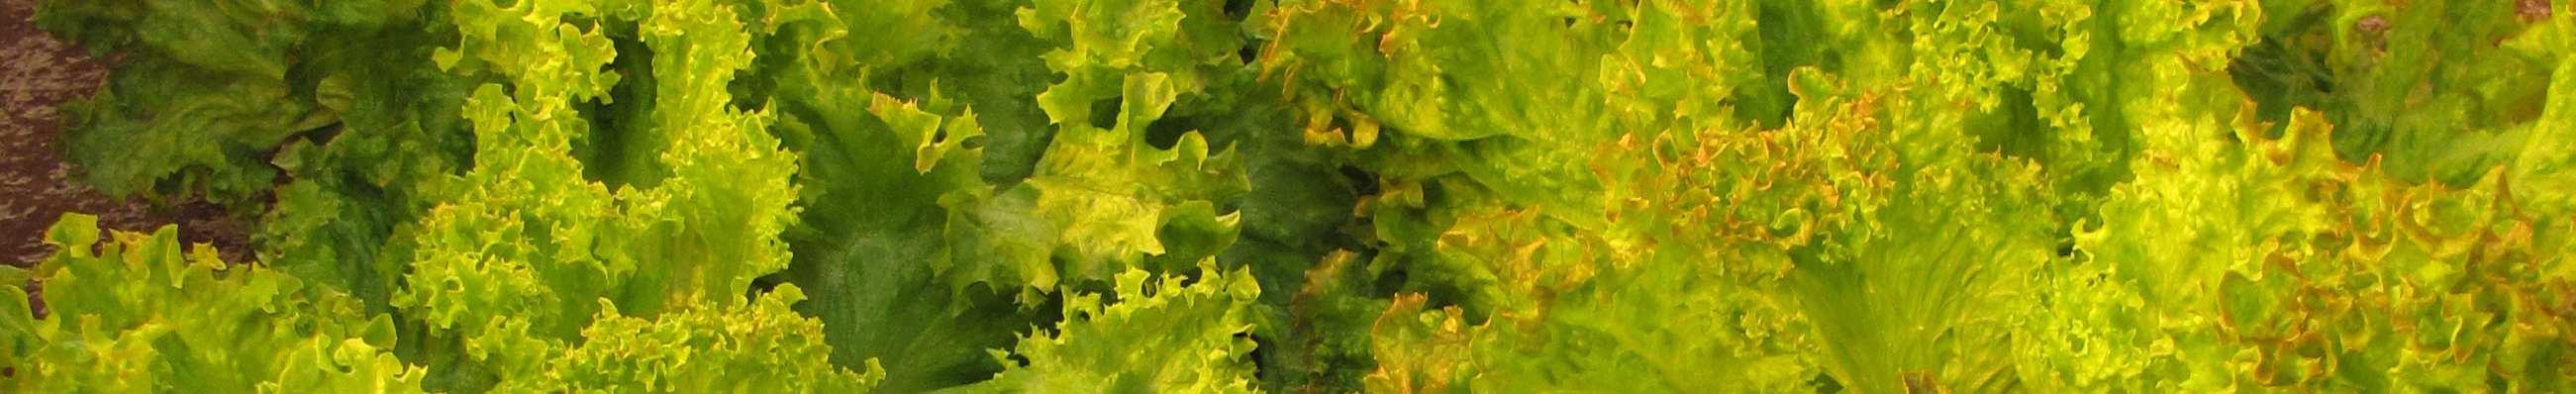
Fig. 10 shows the salad just before final harvest.
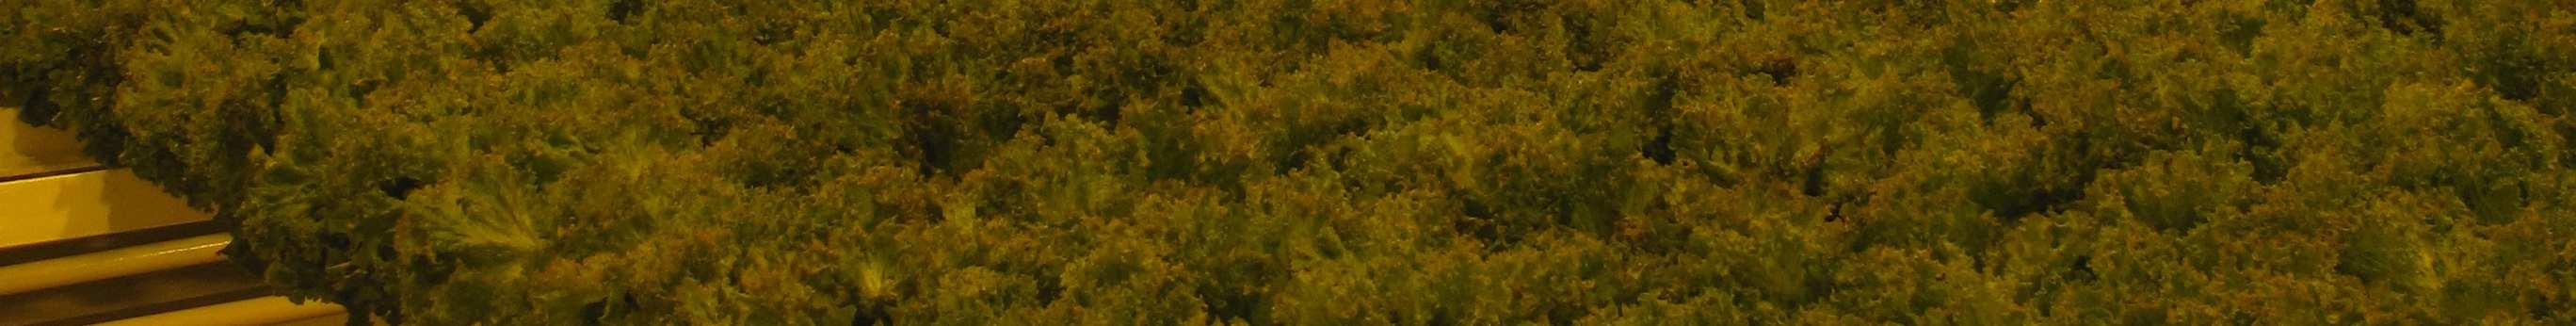
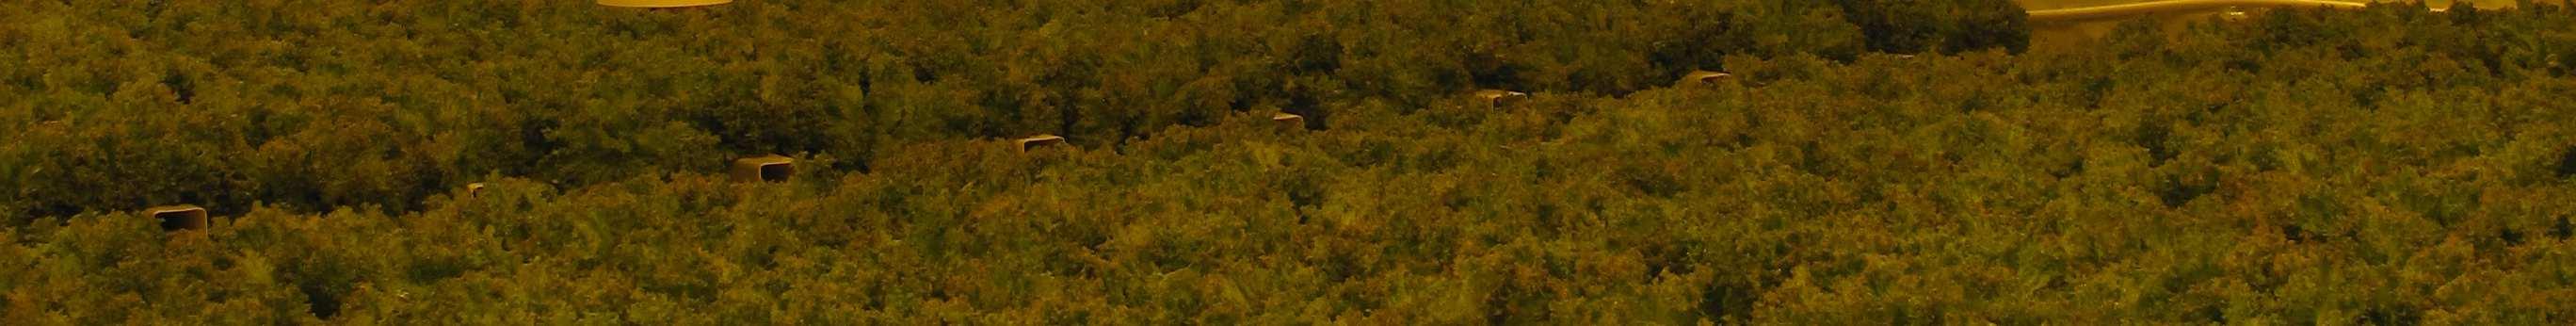
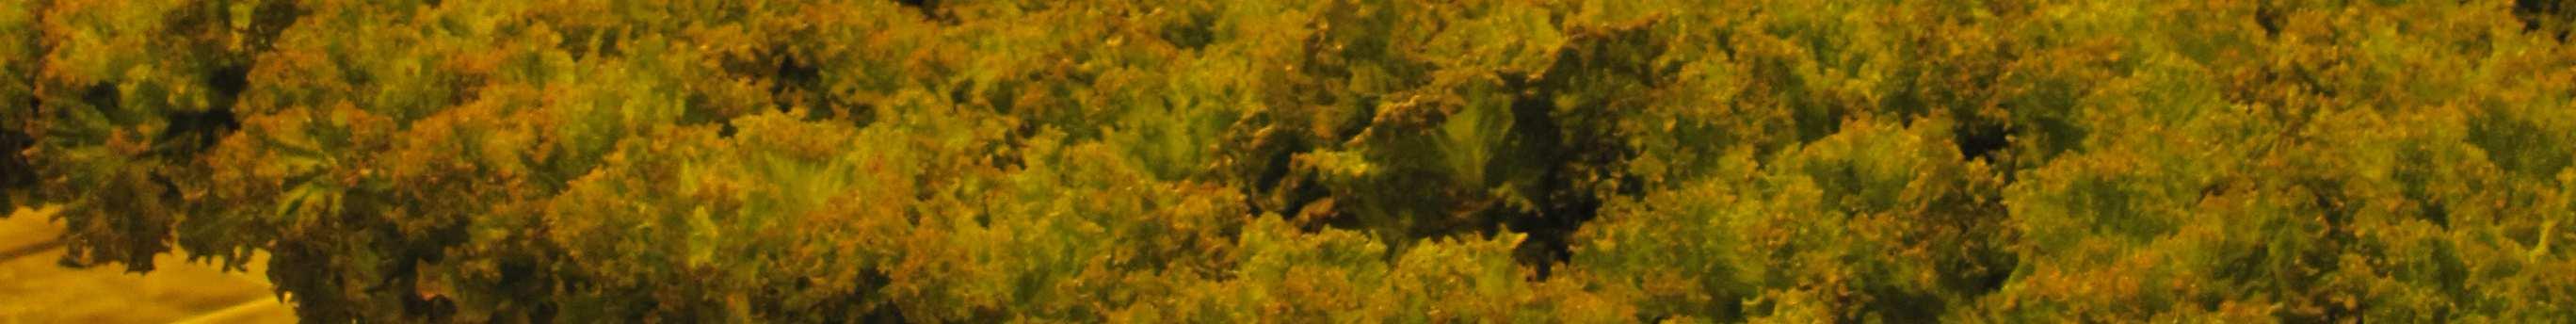
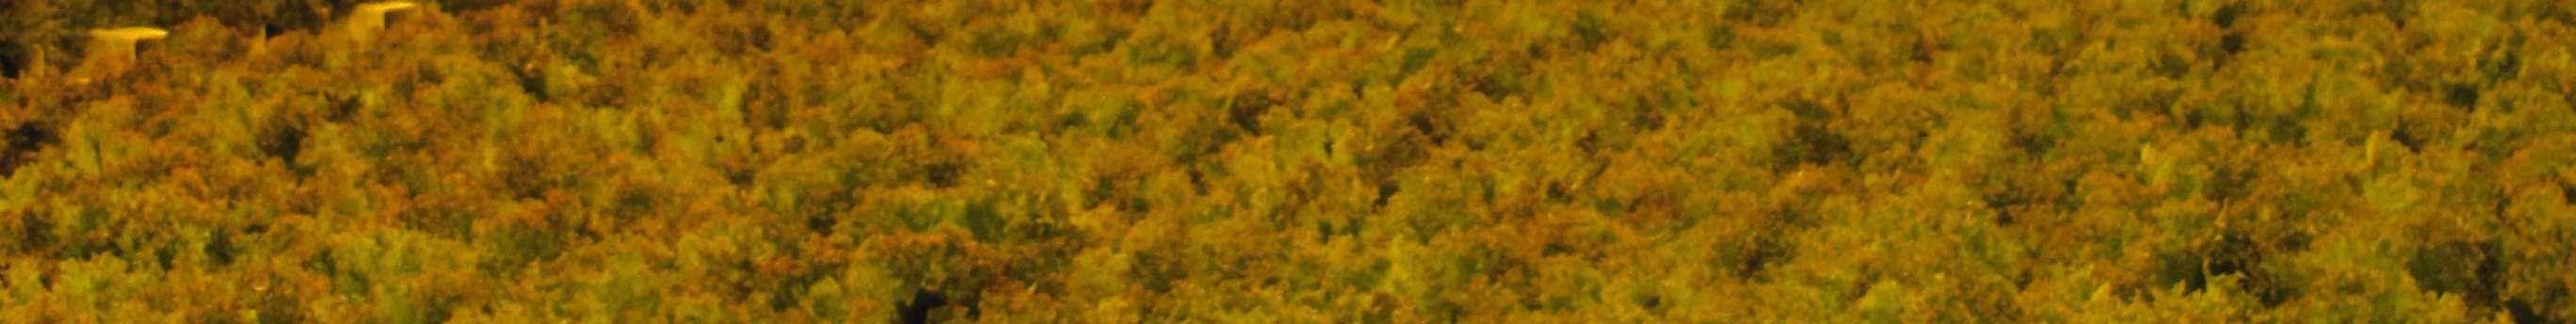
Fig. 10a: Salad after four weeks (left: HPS, right: LED, experiment A).
Fig. 10b: Salad after four weeks (left: HPS, right: HPS+LED, experiment B).
The yield of salad increased during the growth period (Fig. 11). The yield was at the end of the growth period significantly higher when salad received HPS lights compared to LED lights (Fig. 11a), while HPS lights together with LED lights did not
give a significant lower yield compared to the only application of HPS lights (Fig. 11b).
The yield was 11 % lower, when salad was only lightened with LED lights compared to only HPS lights. In contrast, when salad was lightened with HPS and LED lights together, was the yield 6 % lower compared to the only application of HPS lights (Fig. 11).
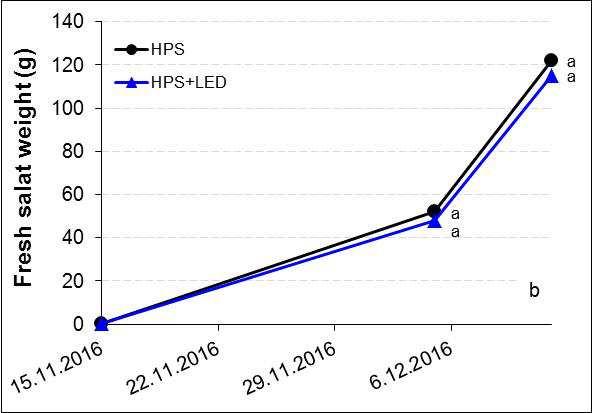
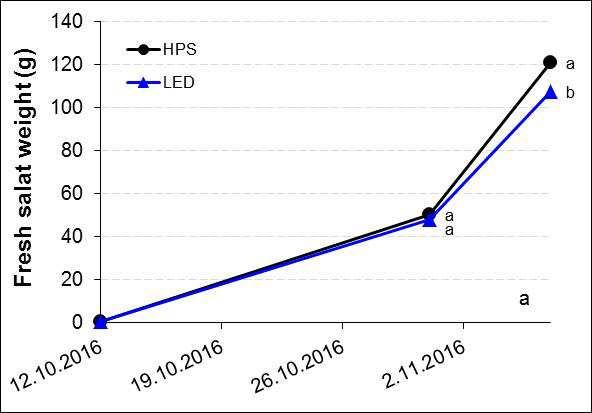
Fig. 11: Total yield for winter salad after four weeks. Letters indicate significant differences (HSD, p ≤ 0,05).
There was a close relationship between the number of leaves and the fresh weight of salad. A higher leaf number involved a higher fresh weight of salad (Fig. 12).
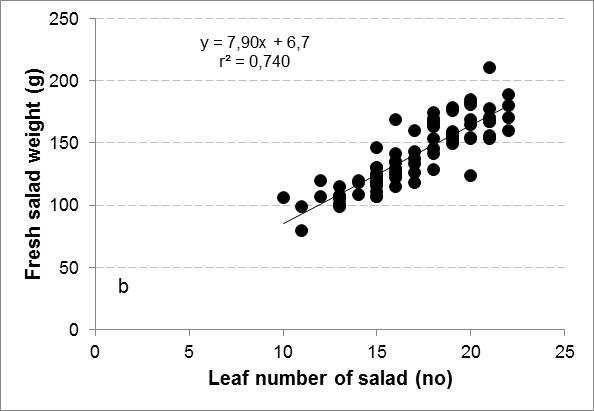
Fig. 12: Relationship between leaf number and fresh weight of salad after four weeks.
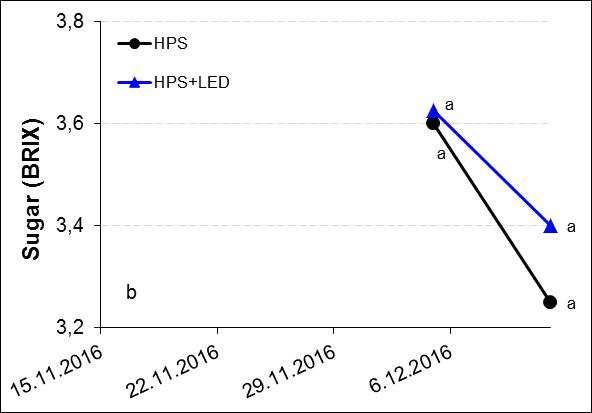
The sugar content was varying between 3 and 4 (Fig. 13). There seem to be no difference in the sugar content between lighting treatments.
Fig. 13: Sugar content of salad.
Letters indicate significant differences (HSD, p ≤ 0,05).
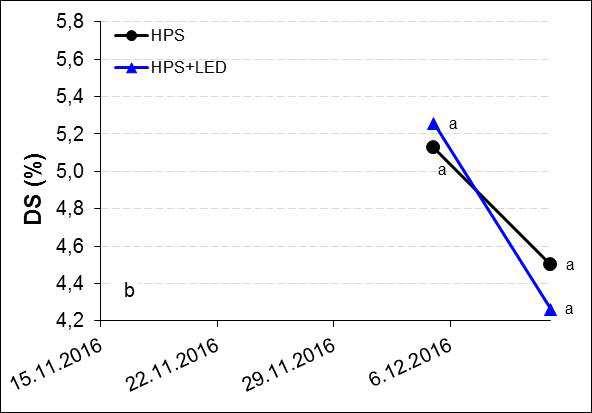
Dry substance (DS) of salad decreased during the growth (Fig. 14). No differences between lighting treatments were observed.
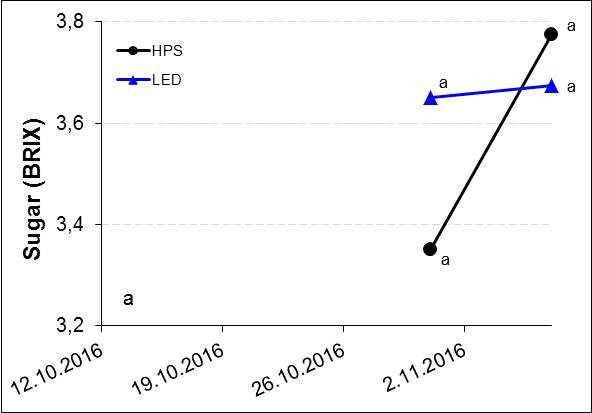
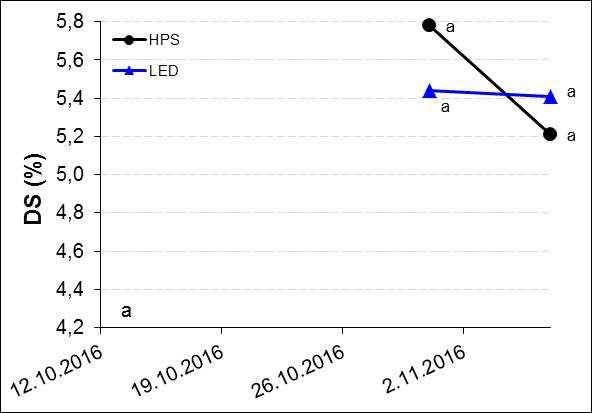
Fig. 14: Dry substance of salad at harvests.
Letters indicate significant differences (HSD, p ≤ 0,05).
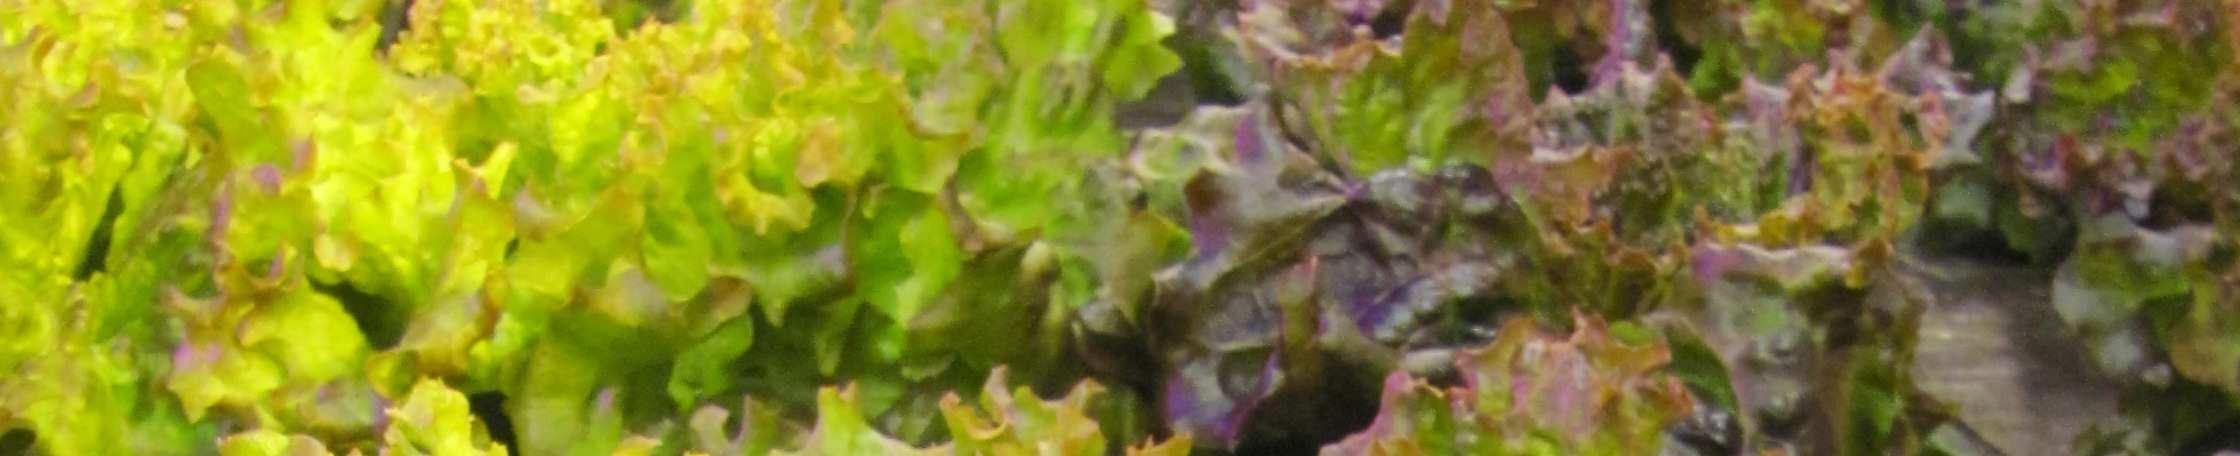
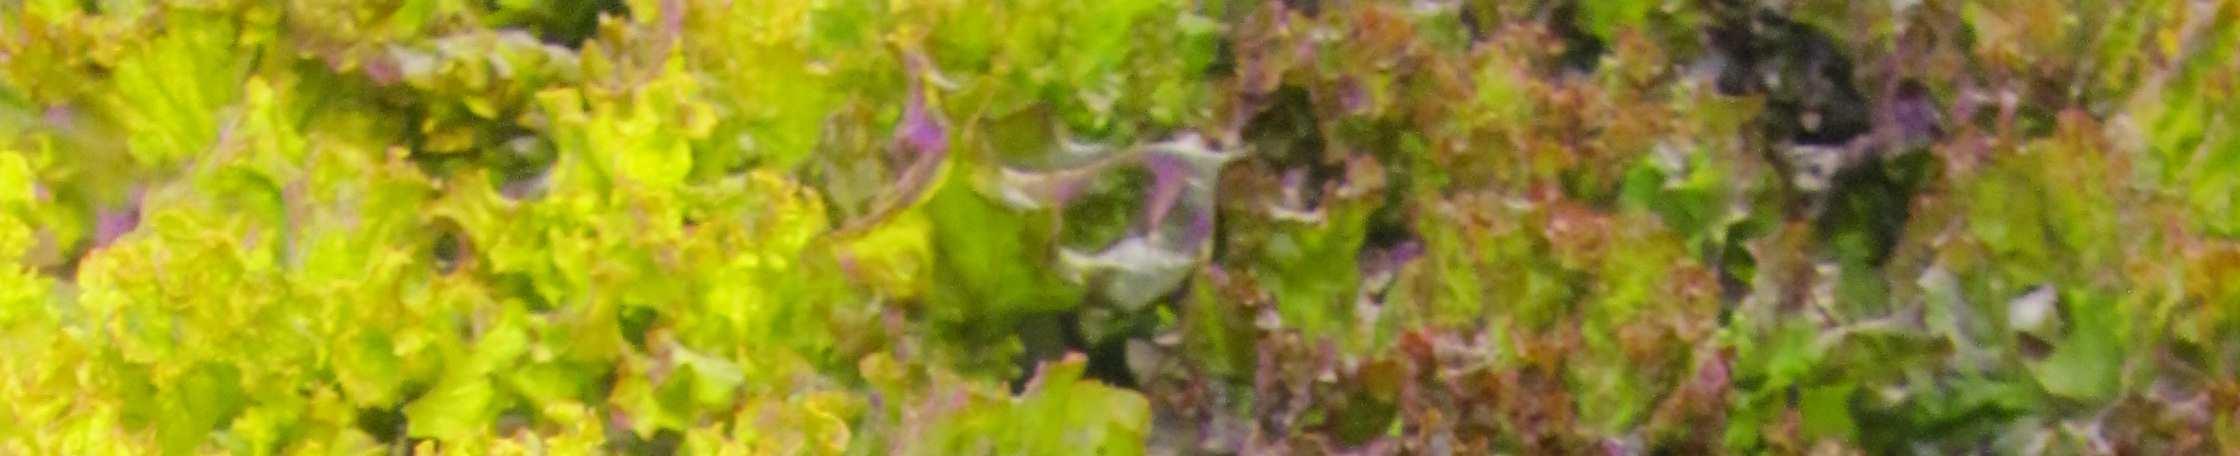
The colour of salad at different treatments is shown in Fig. 15.
Fig. 15a: Colour of salad after three (left picture) and four weeks (right picture) (left: HPS, right: LED, experiment A).
Fig. 15b: Salad after four weeks (left: HPS, right: HPS+LED, experiment B).
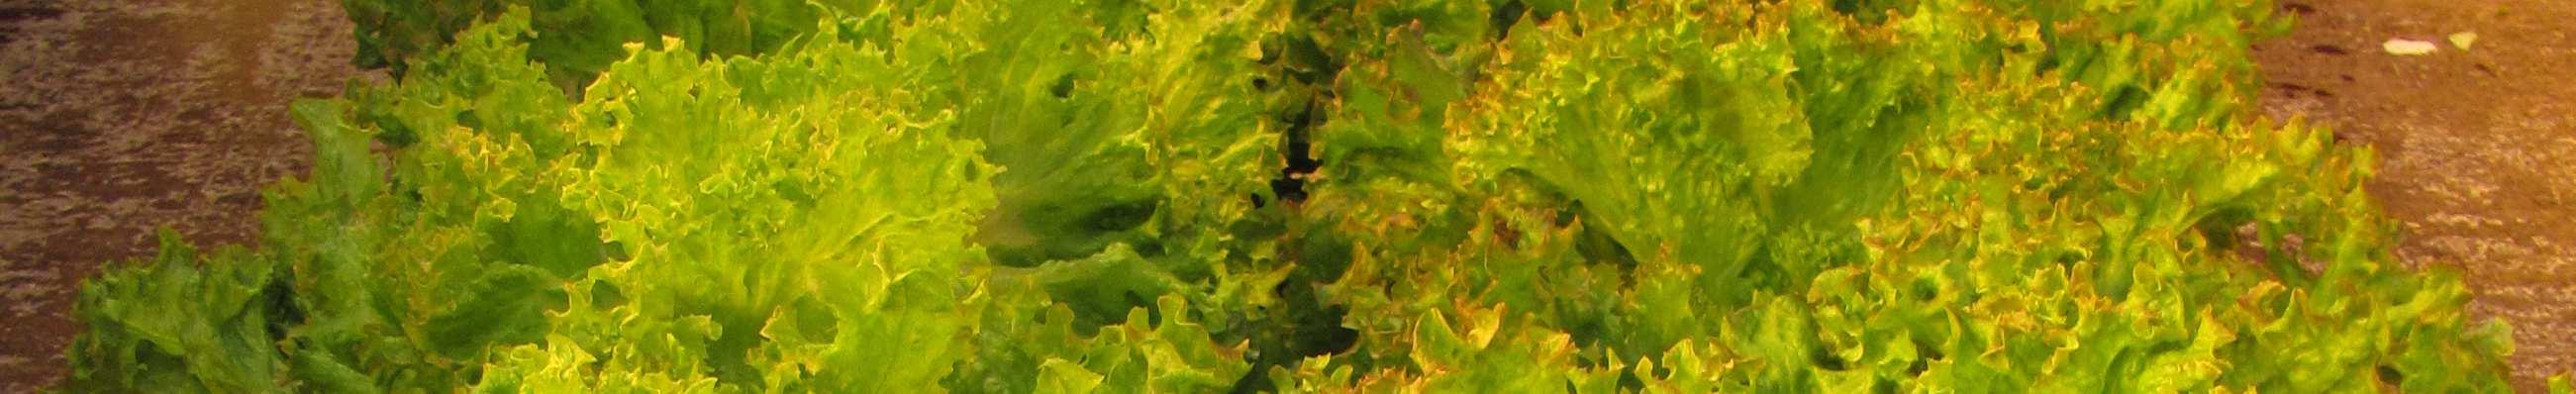
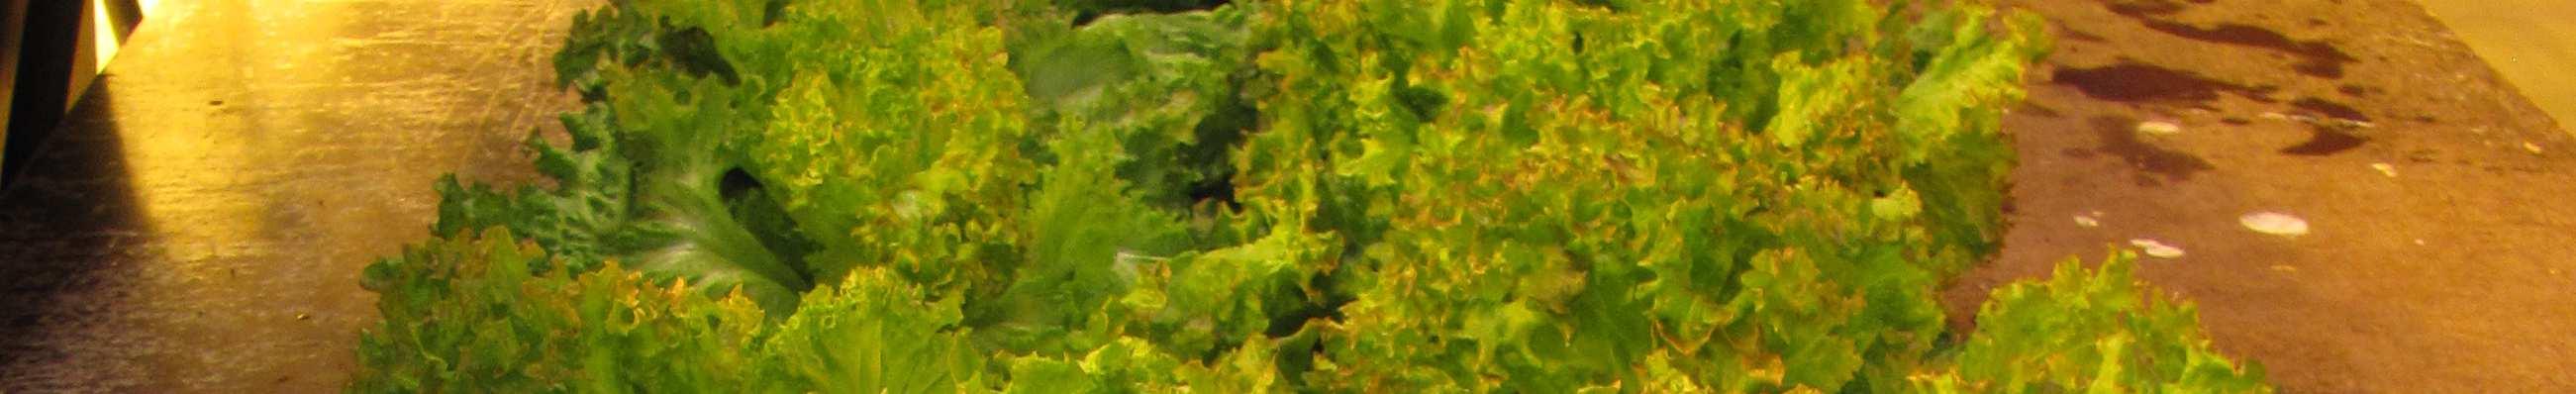
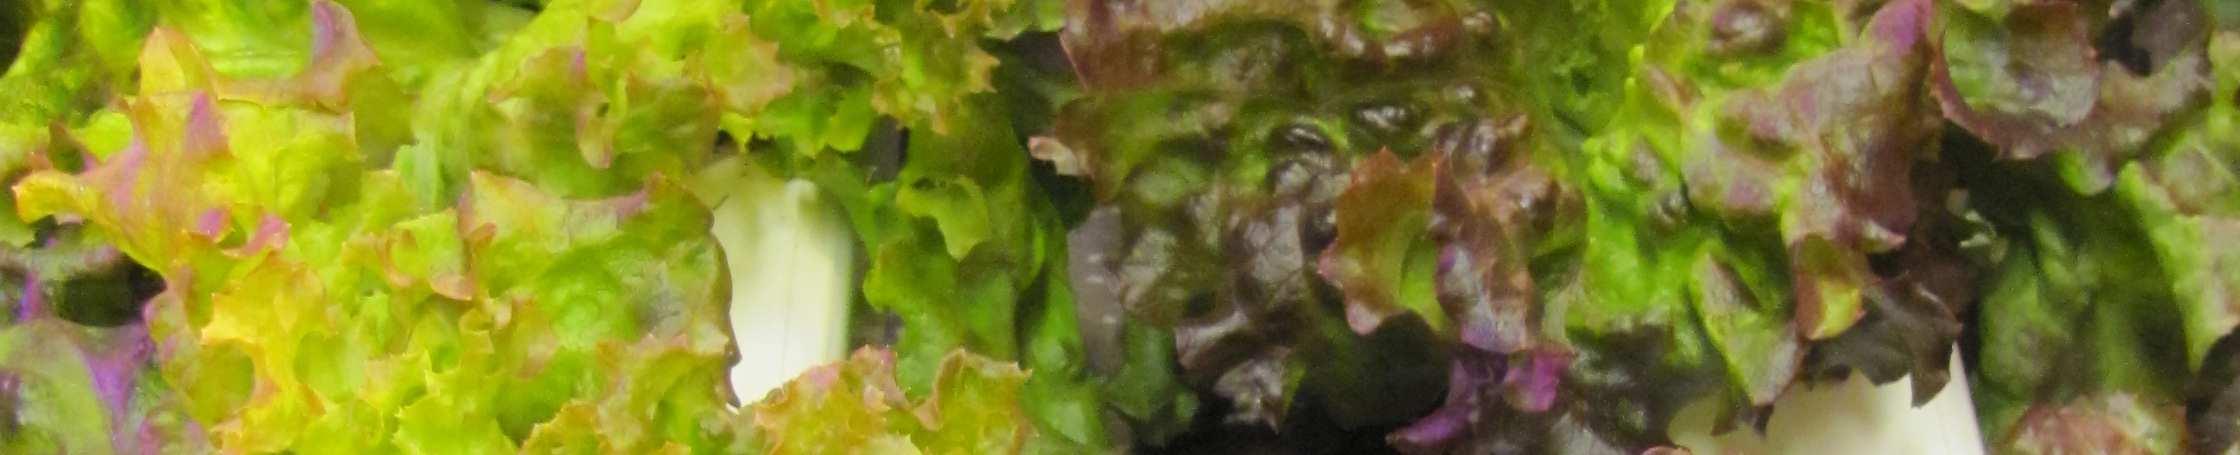
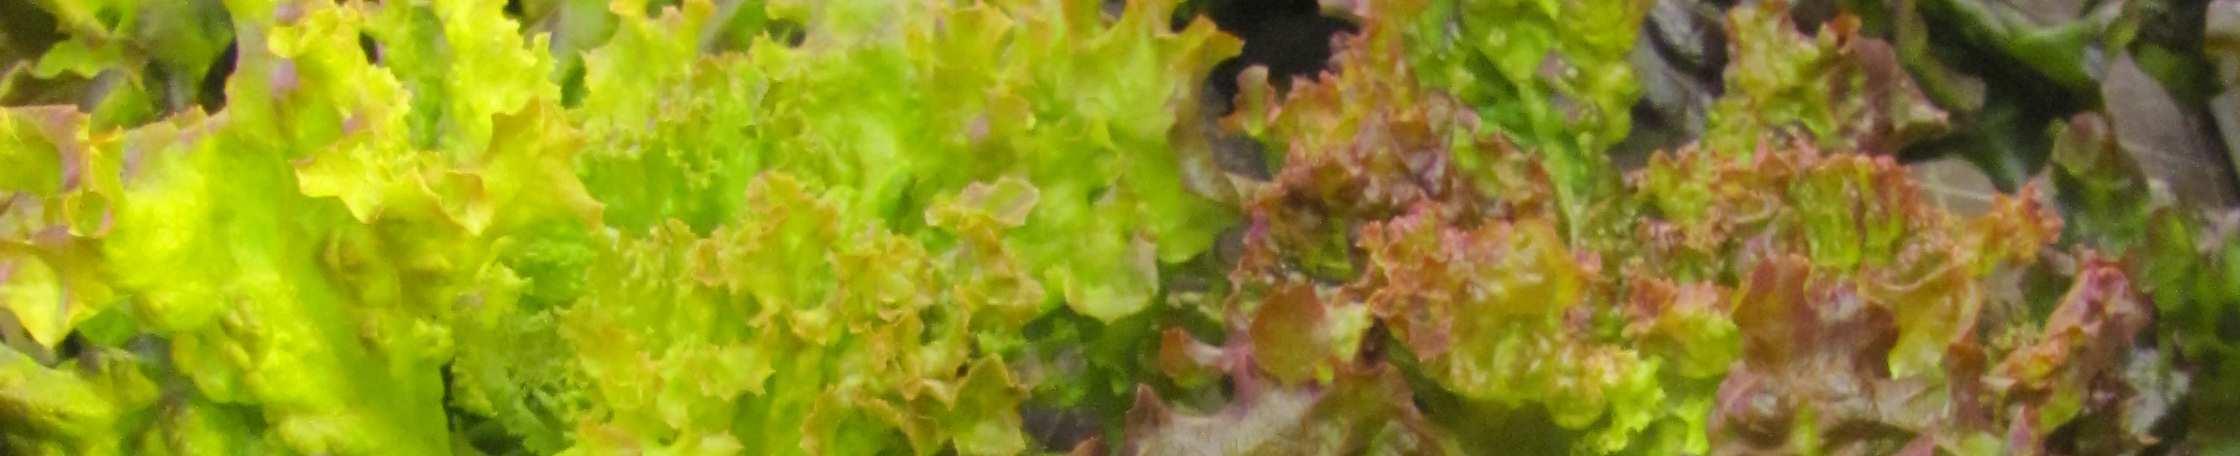
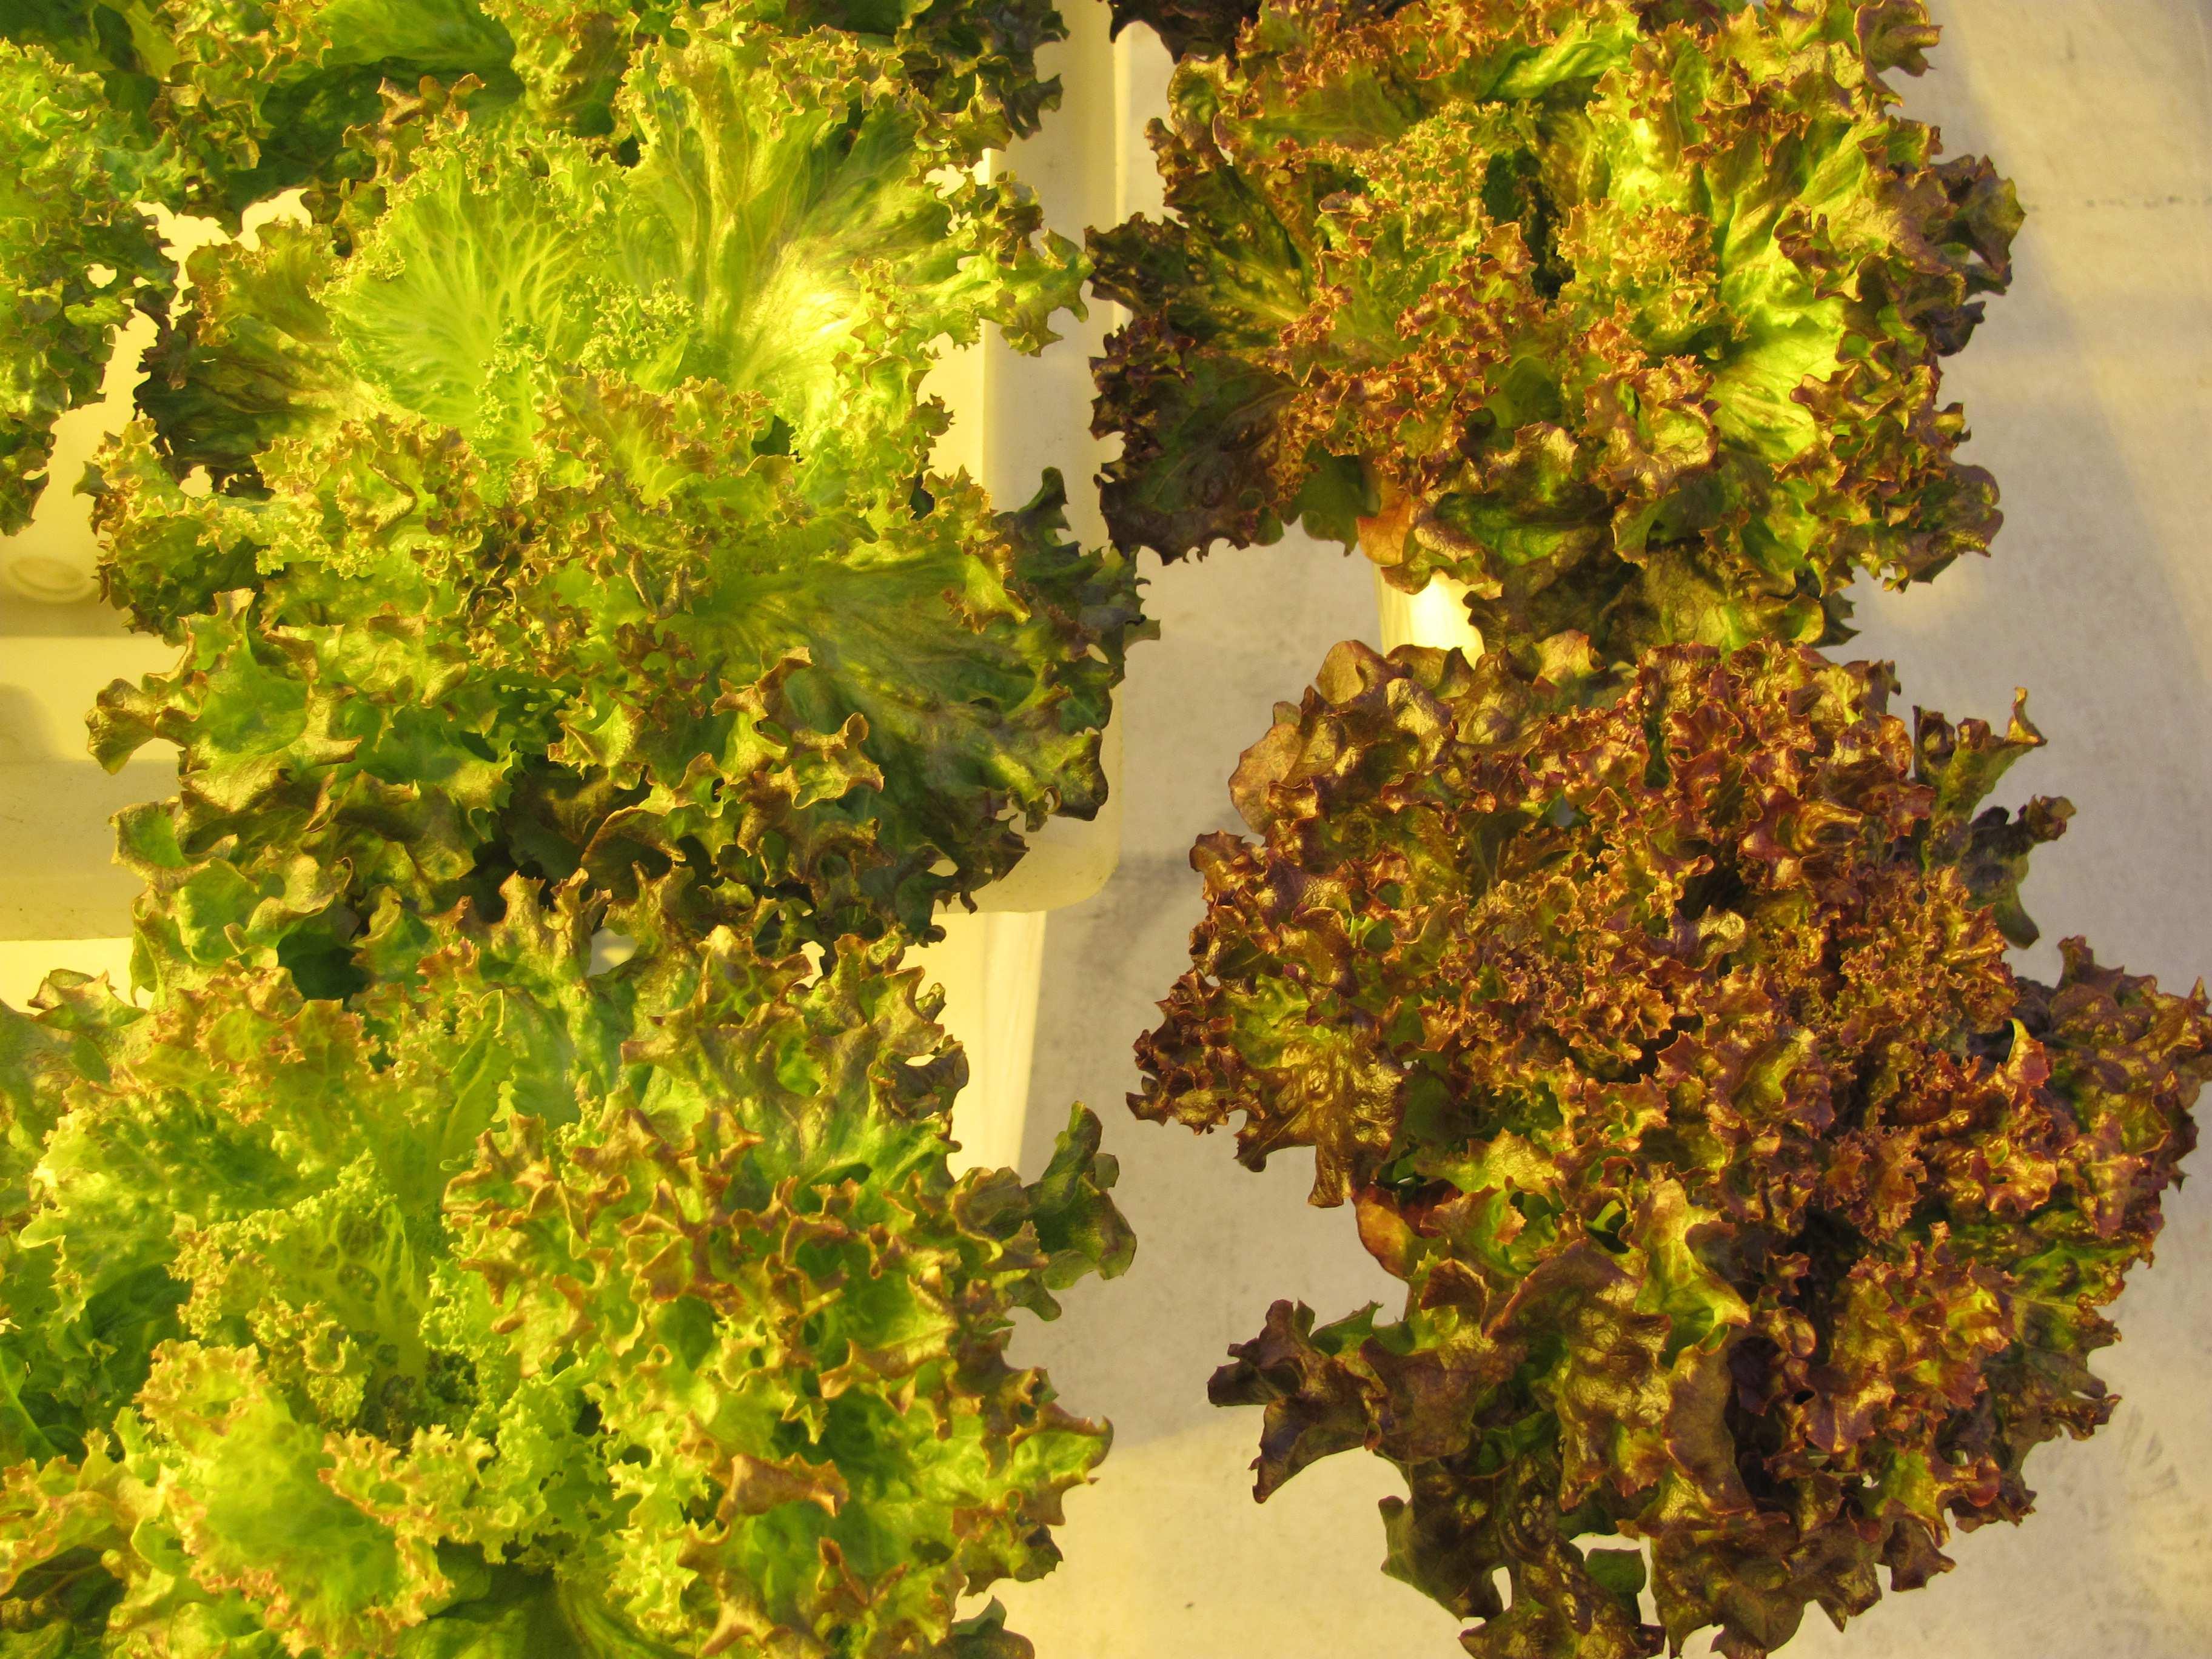
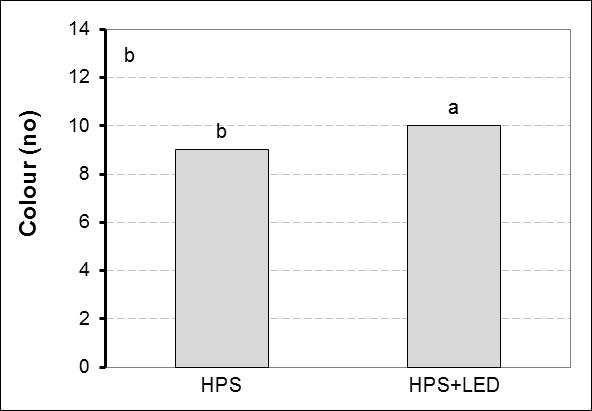
The colour of salad was determined with a colour palette. The colour within one leaf was varying much and the measured colour was supposed to consist of the average colour of the leaf. Number 9 was representing 120 green and 80 red, number 10 was representing 110 green and 90 red and number 13 was representing 80 green and 120 red. This means, a higher number is representing a higher percentage of red. The colour of the leaves was varying between 9 and 13 (Fig. 16).
At final harvest (four weeks after planting) had salad a more intensive red colour when plants were lightened with LEDs (Fig. 16). The difference between different light treatments was more obvious when salad was either grown under HPS or under LED lights (Fig. 16a). There was only a small difference in the colour when salad was under HPS and LED lights together compared to only HPS lights (Fig. 16b).
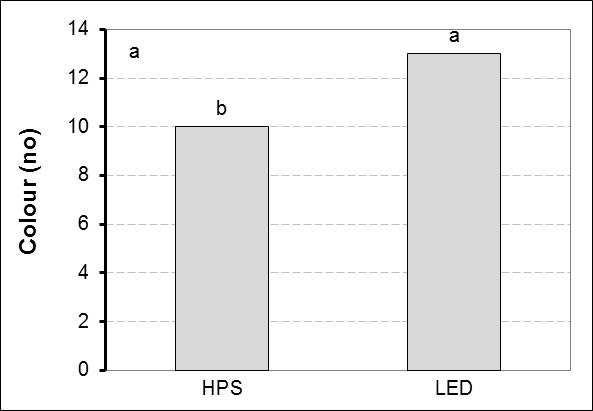
Fig. 16: Colour of salad after four weeks.
The salad growth index was calculated by dividing the fresh weight with the hypocothyl length and multiplying this by the dry matter content.
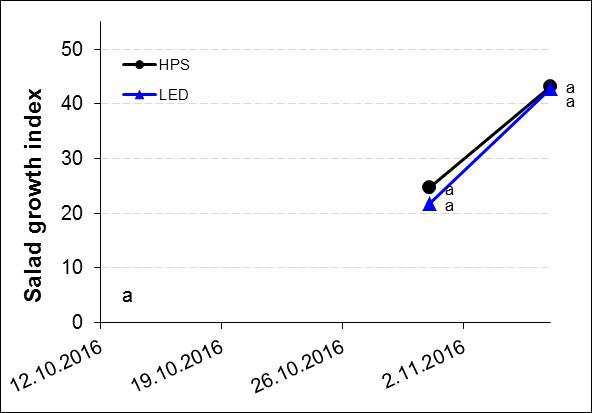
Letters indicate significant differences (HSD, p ≤ 0,05).
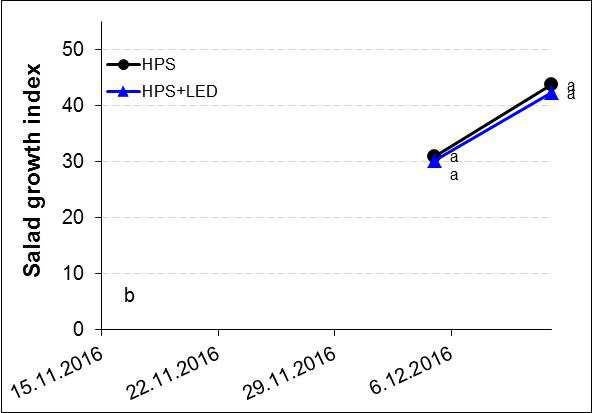
The index increased during the growth period (Fig. 17). No differences in the salad growth index were observed between lighting treatments.
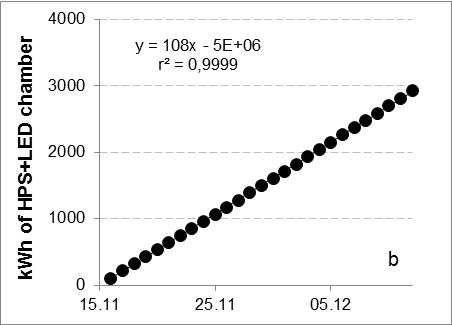
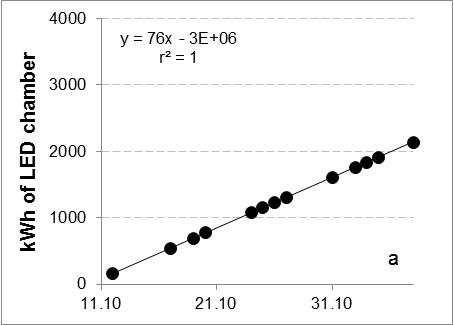
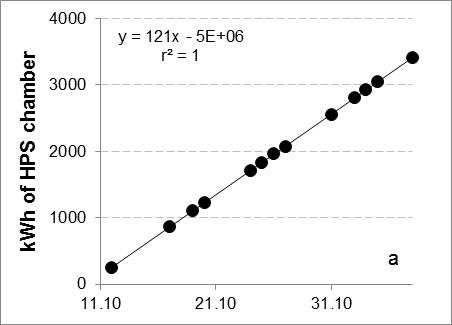
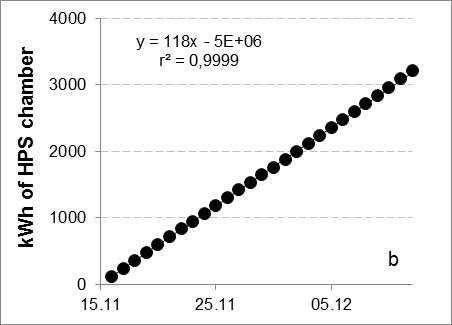
The number of lighting hours is contributing to high annual costs and needs therefore special consideration to consider decreasing lighting costs per kg marketable yield. The total hours of lighting during the growth period of salad were measured with dataloggers (experiment B) respectively read manually (experiment A). The HPS chamber had a daily usage of 121-118 kWh (Fig. 18), while the LED chamber (experiment A) had with 76 kWh (Fig. 18a) nearly 40 % less than the HPS chamber.
With the combined chamber (HPS+LED, Fig. 18b) could the energy usage from 118 kWh reduced by nearly 10 % to 108 kWh.
Fig. 18: Used kWh in the different chambers.
Due to the change of the energy company were no dataloggers in experiment A connected. Therefore, were no lighting hours recorded. However, the kWh’s were
read manually. In experiment B were the lighting hours the same for all lighting treatments. The used kWh increased with the use of HPS lights, while the number was lower with the only use of LEDs and the combined use of HPS and LEDs.
Therefore, also the energy per squaremeter and the power was lower with a higher use of LEDs (Tab. 4).
Tab. 4: Lighting hours, power and energy in the cabinets for different light treatments (datalogger values).
Treatment Hours Power Energy Energy/m
W
HPS *
LED * 2.063
HPS 463 141 3.215
HPS+LED 467 127 2.927
* No datalogger was connected due to the change of the energy company. Values were taken from manually readings.
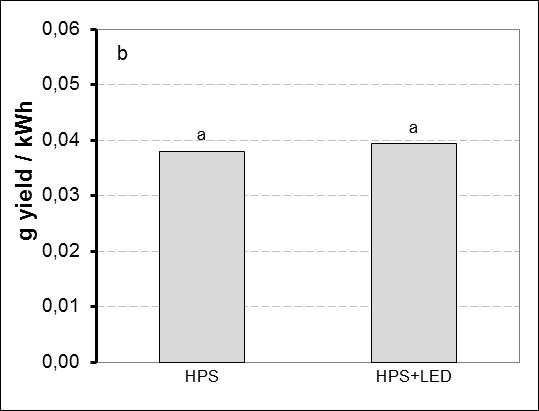
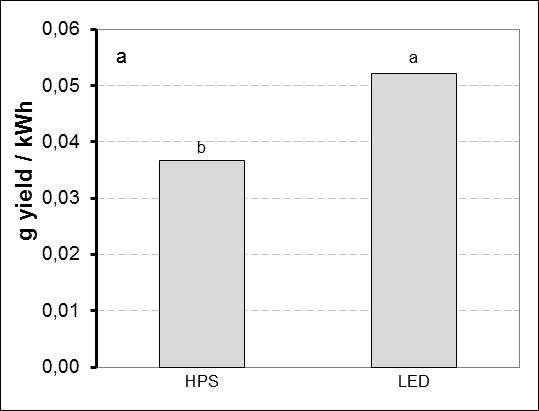
When salad was only lightened with LED lights, significantly more yield was reached per kWh compared to the only use of HPS lights (Fig. 19a). That means that by using LEDs, the kWh’s were transferred better into yield. In contrast, the utilisation of kWh’s was not significantly different, when LEDs were added to the HPS lights in comparision to the only use of HPS lights (Fig. 19b).
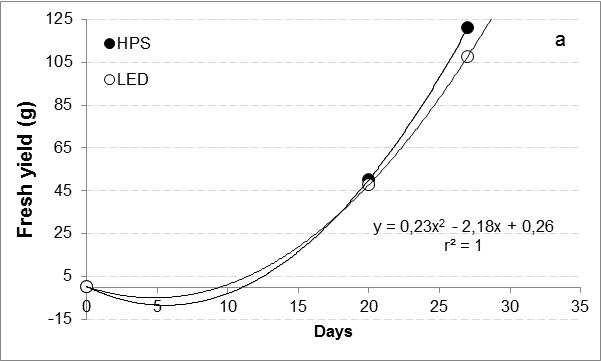
To be able to get the same yield (121 g) as with only HPS lighting after 27 days, salad plants need to be grown 28 days with only LED lights (Fig. 20a, Tab. 5a). That
means that the greenhousearea would be for one more day in use to get the same yield. However, in this case the used energy was around 1/3 less than with HPS lights and the energy per yield with LED lights about 40 % higher compared to the use of HPS lights (Tab. 5a).
Fig. 20a: Relationship between growing time and yield - calculation scenarios (experiment A). Tab. 5a: Days to harvest and used energy (experiment A).
Days to get 121 g
To be able to get the same yield (122 g) as with only HPS lighting after 27 days, salad plants need to be grown for 28 days under HPS and LED lights together (Fig. 20b, Tab. 5b). That means that the greenhousearea would be for one more day in use to get the same yield. Then the used energy would be around 5 % lower compared to the only use of HPS lights and the energy per yield would be the same for both lighting treatments (Tab. 5b).
Fig. 20b: Relationship between growing time and yield - calculation scenarios (experiment B).
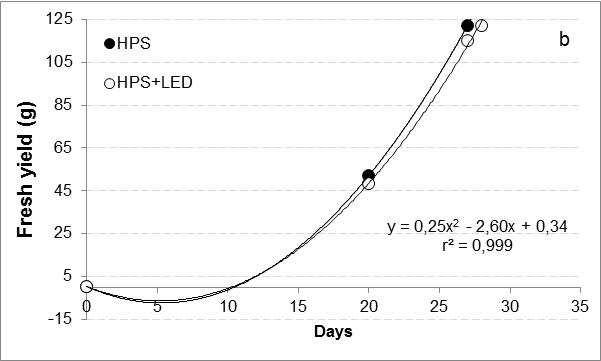
Tab. 5b: Days to harvest and used energy (experiment B).
Treatment Days to get 122 g Energy Energy/yield d kWh kWh/g yield HPS 27 3.215 0,038 HPS+LED 28 3.035 0,038
Since the application of the electricity law 65/2003 in 2005, the cost for electricity has been split between the monopolist access to utilities, transmission and distribution and the competitive part, the electricity itself. Most growers are, due to their location, mandatory customers of RARIK, the distribution system operator (DSO) for most of Iceland except in the Southwest and Westfjords (Eggertsson, 2009).
RARIK offers basically three types of tariffs:
a) energy tariffs, for smaller customers, that only pay fixed price per kWh, b) “time dependent” tariffs (tímaháður taxti, Orkutaxti TT000) with high prices during the day (09.00-20.00) at working days (Monday to Friday) but much lower during the night and weekends and summer, and
c) demand based tariffs (afltaxti AT000), for larger users, who pay according to the maximum power demand.
In the report, only afltaxti is used as the two other types of tariffs are not economic. Since 2009, RARIK has offered special high voltage tariffs (“VA410” and “VA430”) for large users, that must either be located close to substation of the transmission system operator (TSO) or able to pay considerable upfront fee for the connection.
Costs for distribution are divided into an annual fee and costs for the consumption based on used energy (kWh) and maximum power demand (kW) respectively the costs at special times of usage. The annual fee is pretty low for “VA210” and “VA230” when subdivided to the growing area and is therefore not included into the calculation. However, the annual fee for “VA410” and “VA430” is much higher. Growers in an urban area in “RARIK areas” can choose between different tariffs. In the report only the possibly most used tariffs “VA210” and “VA410” in urban areas and “VA230” and “VA430” in rural areas are considered.
The government subsidises the distribution cost of growers that comply to certain criteria’s. Currently 87 % and 92 % of variable cost of distribution for urban and rural areas respectively. This amount can be expected to change in the future.
For calculation of the power, different electric consumptions were made, because the actual consumption is higher than the nominal value of the bulb: one was based on the power of the lamps (nominal Watts, 0 % more power consumption), one with 6 % more power consumption and one for 10 % more power consumption. Based on this percentage of subsidy and the lighting hours (Tab. 6), for a salad production only under HPS lights or only under LED lights (experiment A, Tab. 6a) as well as under HPS and LED lights together or only under HPS lights (experiment B, Tab. 6b), the energy costs per m2 were calculated. The energy costs per kWh for distribution after subsides are around 0,54-1,67 ISK/kWh for „VA210” and „VA230” and 0,46-1,57 for „VA410” and 0,48-1,17 ISK/kWh for „VA430”. The energy costs for sale are for „Afltaxti” around 5,34-12,91 ISK/kWh and for „Orkutaxti” around 5,307,87 ISK/kWh. Cost of electricity was lower for the calculated values. In general, tariffs for large users rendered lower cost.
Tab. 6a: Costs for consumption of energy for distribution and sale of energy for growing under HPS or under LED lights (experiment A).
RARIK Urban 87%subsidyfromthestate VA210 No datalogger was connected due to the change of the energy company
1,03
No datalogger was connected due to the change of the energy company
1,03 No datalogger was connected due to the change of the energy company
41 44 45
No datalogger was connected due to the change of energy company
62 66 69
68 73 75 VA410 0,94 0,94 37 40 41
RARIK Rural 92%subsidyfromthestate VA230 No datalogger was connected due to the change of the energy company
Afltaxti Orkutaxti
1,09
No datalogger was connected due to the change of the energy company
1,09 No datalogger was connected due to the change of the energy company
43 46 48
No datalogger was connected due to the change of the energy company
52 55 57
72 76 79 VA430 0,49 0,49 31 33 34
Comments: The first number for the calculated value is with 0 % more power consumption, the second value with 6 % more power consumption and the last value with 10 % more power consumption.
Prices are from April 2017.
Tab. 6b: Costs for consumption of energy for distribution and sale of energy for growing under HPS and LED lights together or only under HPS lights (experiment B).
Energy ISK/kWh
calculated real
HPS
Energy costs with subsidy per m2 ISK/m2 Treatment HPS+LED
real
RARIK Urban 87%subsidyfromthestate VA210
1,66 0,54 1,67 0,54 985 29 31 32 109 32 34 35 VA410 1,56 0,46 1,57 0,46 93 24 26 27 103 27 29 30
RARIK Rural 92%subsidyfromthestate VA230 1,65 0,65 1,66 0,65 98 34 37 38 109 38 41 42 VA430 1,16 0,48 1,17 0,48 69 26 27 28 76 29 30 32
Comments: The
number for
with
power consumption, the second value with 6 % more power
and the last value with 10 % more power consumption. Prices are from April
Costs of electricity in relation to gramm yield for wintergrown salad were calculated (Tab. 7). While for the distribution several tariffs were possible, for the sale only the cheapest tariff was considered. In experiment A decreased the costs of electricity by 32 % (calculated values) with the use of LED lights instead of HPS lights (Tab. 7a). Tab. 7a: Variable costs of electricity in relation to yield in experiment A.
costs of electricity per kg yield ISK/kg
Yield (kg/m2)
Urban area (Distribution + Sale) VA210
No datalogger was connected due to the change of the energy company
Rural area (Distribution + Sale) VA230
242 257 267
No datalogger was connected due to the change of the energy company
397 421 437
403 427 444 VA410 239 253 263
No datalogger was connected due to the change of the energy company
245 259 269
No datalogger was connected due to the change of the energy company
387 410 425
407 431 448 VA430 233 246 256
In experiment B decreased the costs of electricity by 4 % (real values and calculated values) with the combined use of HPS and LED lights in contrast to the only use of HPS lights (Tab. 7b).
Tab. 7b: Variable costs of electricity in relation to yield in experiment B. Variable costs of electricity per kg yield ISK/kg
Treatment
HPS Yield (kg/m2)
Urban area (Distribution + Sale) VA210 490 314 333 346
348 369 383 VA410 484 310 328 341
Rural area (Distribution + Sale) VA230 489 320 339 352
343 364 377
354 376 390 VA430 460 311 330 342
345 365 379
The profit margin is a parameter for the economy of growing a crop. It is calculated by substracting the variable costs from the revenues. The revenues itself, is the product of the price of the sale of the salad and the salad heads per squaremeter. For each head of salad, growers are getting 123,5 ISK from Sölufélag garðyrkjumanna (SfG). The number of heads / m2 is the same, independent of the lighting treatment and therefore, also the revenues are equal (2.700 ISK/m2) between treatments when differences in yield are unconsidered (Fig. 21).
Fig. 21: Revenues at different treatments in experiment A and experiment B.
When considering the results of previous chapter, one must keep in mind that there are other cost drivers in growing salad than electricity alone (Tab. 6). Among others, this are e.g. the costs for seeds and seedling production and transplanting
600 ISK/m2), costs for plant nutrition (
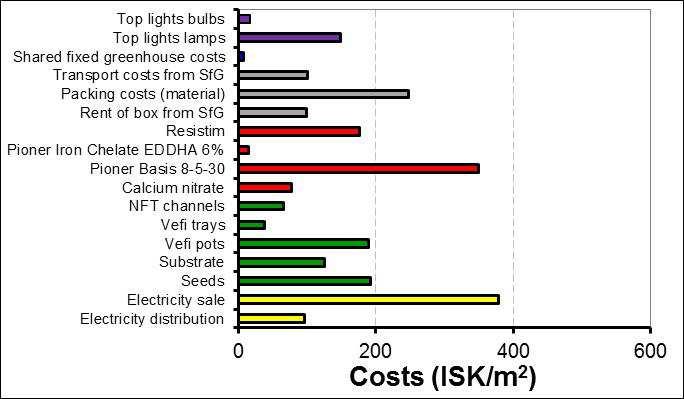
100 ISK/m2), material for packing (
600 ISK/m2), the rent of the green box
250 ISK/m2), and transport costs from SfG
100 ISK/m2) and investment into lamps and bulbs (
200 ISK/m2) (Fig. 22).
Fig. 22: Variable and fixed costs (without labour costs) in experiment A and experiment B (Average from both experiments).
However, in Fig. 22 labour costs are not included in contrast to Fig. 23 and it is obvious, that especially the electricity, the seedling production and transplanting, the
plant nutrition as well as packing and marketing are contributing much to the variable and fixed costs. When LED lights are the only light source (Fig. 23a) respectively added to HPS lights (Fig. 23b), the percentage of costs for electricity on total costs is decreased, while the percentage into lamps and bulbs of the other costs on total costs increased.
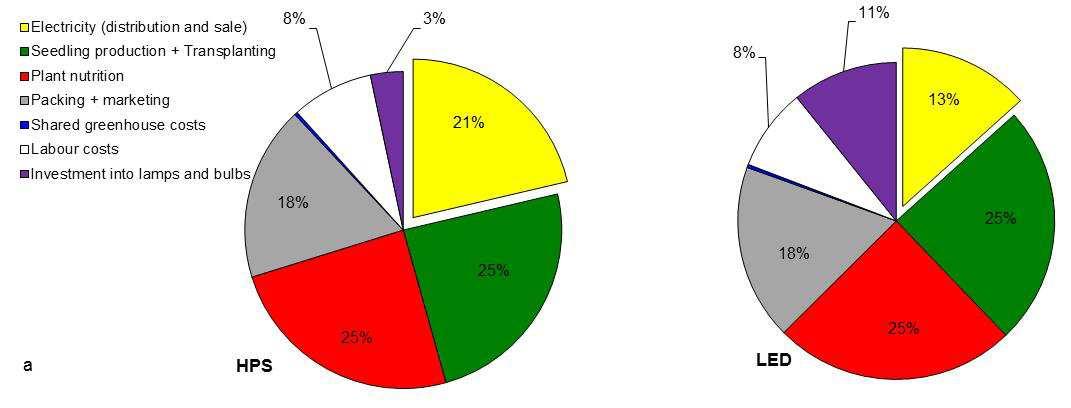
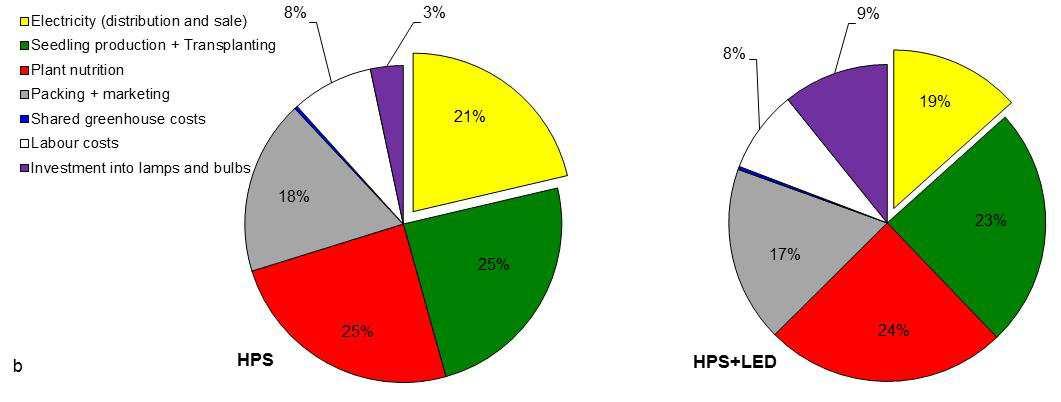
Fig. 23a: Division of variable and fixed costs in experiment A.
Fig. 23b: Division of variable and fixed costs in experiment B.
A detailed composition of the variable costs at each treatment is shown in Tab. 8.
Profit margin of winter salad at
for
(ISK/m
and fixed costs (ISK/m
(urban
90 ISK / 20 head box
packing costs (material for one head of salad): plastic film: 10 ISK / head, label: 1 ISK / head
transport costs from SfG: 4,60 ISK / head
94 ISK/m2/year for common electricity, real property and maintenance
HPS lights: 30.000 ISK/lamp, life time: 8 years, assumption: 12 circles / year
LED lights: 138.368 ISK/lamp, life time: 8 years, assumption: 12 circles / year
HPS bulbs: 3.100 ISK/bulb, life time: 2 years, 12 circles / year
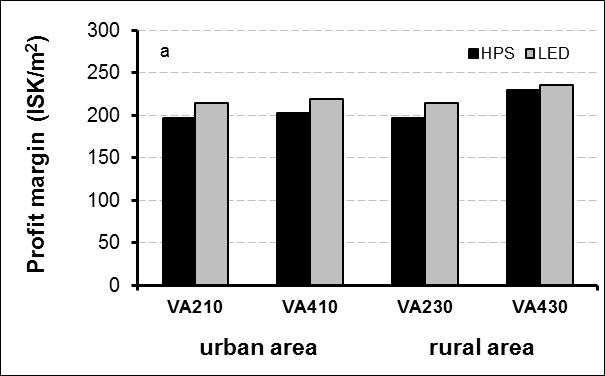
The profit margin was nearly the same in experiment A, independent of the treatment (Fig. 24a) and ranged between 200-240 ISK/m2. However, in experiment B was the profit margin dependent on the treatment (Fig. 24b) and lowest (100 ISK/m2) with the combined use of HPS and LED lights. A larger use (higher tariff: “VA 410” compared to “VA 210”) did not influence profit margin in the urban area. In contrast, in a rural area, a higher profit margin was gained with a higher tariff (compare “VA 430” with “VA 230”). This small advantage of rural areas was due to the state subsidies.
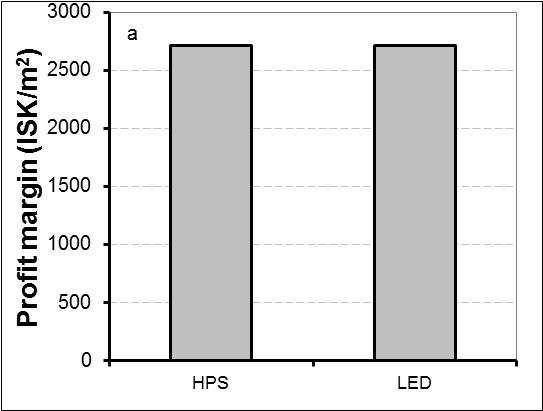
However in the calculation of the profit margin was not taken the fresh weight of the salad heads into account. The fresh weight after lighting with only LED lights was about 11 % reduced compared to the only use of HPS lights (experiment A) respectively 6 % with the combined use of HPS and LED lights (experiment B) compared to the only use of HPS lights. When salad under LED lights or under HPS and LED lights together would be sold with the same weight as when grown under HPS lights, the growing period would increase by one day (Fig. 20). In experiment A would the costs of electricity for distribution and sale for a 121 g heavy head be 538 ISK/m2 with the only use of HPS lights and 346 ISK/m2 with the only use of LED lights. This would result in a profit margin of 196 ISK/m2 for HPS and 202 ISK/m2 for LEDs (Tab. 9a). Assuming, two days would pass between harvest and transplanting, more than 12 circles of growing salad heads would be possible under HPS lights and under LED lights. That would lead to a total profit margin per year of 2.473 ISK/m2 for salad under HPS lights and 2.461 ISK/m2 under LEDs. Meaning, lighting salad with LEDs would elongate the growing period by one day, but would result in the same profit margin over the year than when lighting with HPS lights.
Tab. 9a: Calculation scenarios of profit margin per year in experiment A.
LED
Days to get 121 g/head
Costs for electricity (distribution + sale) to get 121 g/head (ISK/m2)
Profit margin with a fresh yield of 121 g/head
Number of days between circles from harvest to transplanting
Possible circles per year with 121 g/head (no)
Profit margin after possible circles per year
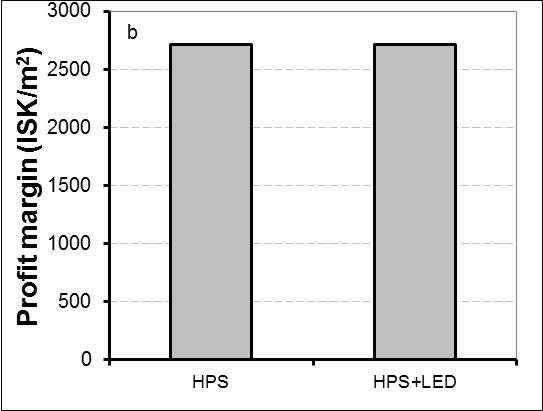
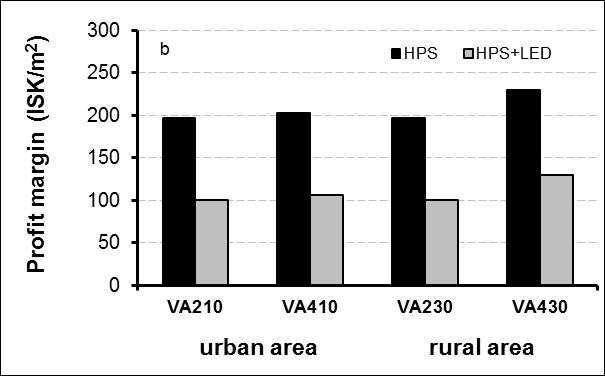
In experiment B, the costs of electricity for distribution and sale for a 122 g heavy head would be 538 ISK/m2 with the only use of HPS lights and 507 ISK/m2 with the use of HPS and LED lights together. This would result in a profit margin of 196 ISK/m2 for HPS and 82 ISK/m2 for the combined use of HPS and LEDs (Tab. 9b). Assuming, two days would pass between harvest and transplanting, more than 12 circles of growing salad heads would be possible under HPS lights and under the combined use of HPS and LED lights. That would lead to a total profit margin per year of 2.473 ISK/m2 for salad grown under HPS lights and 1.001 ISK/m2 under LEDs. Meaning, lighting salad with HPS and LEDs together would elongate the growing period by one day and would result in an about 60 % lower profit margin over the year compared to the only use of HPS lights.
Tab. 9b: Calculation scenarios of profit margin per year in experiment B.
Days to get 122 g/head 27 28
Costs for electricity (distribution + sale) to get 122 g/head (ISK/m2) 538 507
Profit margin with a fresh yield of 122 g/head 196 82
Number of days between circles from harvest to transplanting 2 2
Possible circles per year with 122 g/head (no) 12,6 12,2 Profit margin after possible circles per year 2.473 1.001
The yield of salad was compared with different lighting sources, HPS or LED lights, respectively a combination of HPS and LEDs. It has to be taken into account, that in experiment A was the power 27 % higher and the day temperature one degree higher in the LED chamber than in the HPS chamber, with the aim to get possibly the same yield with LEDs as with salat grown under HPS lights. However, irradiation with LEDs suppressed yield of salad: After 27 days was the fresh weight for salad plants under HPS lights highest and about 11 % lower for plants grown under LEDs. But, the electricity consumption could be reduced by about 37 % with LEDs compared to salad treated with HPS lights. When the power was the same between the HPS and LED treatment, was the yield about 28 % lower for plants under LEDs compared to plants under HPS lights, but 50 % of the electricity consumption could be saved (Stadler 2015). However, in the LED treatment was the temperature of the leaves and roots about 1-3 °C lower than in the HPS chamber. This might also have contributed to the lower yield. To exclude possible temperature effects on yield was the temperature in the presented experiment set one degree higher during the day in the LED chambers. This resulted in comparable leaf and root temperatures in the LED and HPS chamber and however, a lower yield of salad grown under LEDs.
Pinho et al. (2012) measured an electricity consumption of 256 kWh for LEDs and 429 kWh for HPS lights. However, the fresh weight yield of salad (HPS: 219,8 g, LED: 219,0 g) was not dependent on the lighting source, which was in contrast to the presented results. Martineau et al. (2012) measured under HPS and LED lights during a photoperiod of 18 h a similar shoot biomass of salad, even though the average total light irradiance amounted 72,3 µmol/m2/s for HPS and 35,8 µmol/m2/s for LEDs, respectively. When measured on an energy basis, the LED lamps provide an energy savings of at least 33,8 %.
Due to a significantly higher salad yield with red + blue LED in comparision to HPS lights, Wojciechowska et al. (2015) concluded the usefulness of LED lamps for supplemental lighting in horticultural cultivation on a larger scale. LED lighting might be strategically used to enhance the yield and simultaneously nutritional value of salad grown under 90 % red and 10 % blue LED light.
In experiment B was the µmol level comparable between the HPS treatment and the combined use of HPS and LED lights. Yield of salad was not affected by the treatment and also the used kWh was independent of the treatment.
Also, Sirtautas et al. (2014) evaluated the effect of combination of LEDs and HPS lighting on the growth of salad and found that the 470 nm light had a higher specific leaf area value and resulted in increased plant mass per leaf area.
In 2014 compared Stadler (2015) salad grown under HPS and under LED lights. In that experiment were bulbs from Osram used. With the same number of bulbs gave new Philips bulbs in the presented experiment an about 21 % lower use (kWh) per hour. In addition, was also the µmol-value with Philips bulbs about 20 % lower compared to the year 2014 with Osram bulbs. It has to be mentioned that the dataloggers differed between the two years due to the change of the energy company. The question is therefore, if the different dataloggers were measuring equally. Also, the voltage might have been different between the years, which can no longer be traced as the voltage was only recorded in the presented experiment. An other possibility could be that the bulbs from Philips are using less kWh which might be connected to the lower µmol-value of Philips bulbs in contrast to Osram bulbs. To check if the Philips bulbs are giving less kWh, both bulb types were tested in two chambers over several days and results recorded: Philips bulbs used about 3 % less kWh than Osram bulbs. Therefore, a combination of the above mentioned three factors might explain differences between years.
The red colour of salad was triggered by the only use of LED lights. After three weeks exposure to LED lights, respectively after four weeks (end of the growing period), was the salad noticeably redder compared to plants that received HPS lights. This was due to a higher content of anthocyanins that enhance the red colour in salad and with that improves the external quality and marketability of the product (Rodriguez et al., 2014). Also, Juntunen & Riihimäki, (2011) observed a stronger red colour with salad under LED lights. Even after one week under LEDs was the red colour of salad plants stronger in comparision to salat plants grown under HPS lights (Stadler, 2015).
However, induction with LEDs for more than one week gave no redder colour compared to only one week under LEDs. Therefore, only a short time (one week) under LEDs is enough to induce red colouring and with that anthocyanin synthesis. Thereby could the quality of red salad be improved, however, with a reduction in growth and yield (Stadler, 2015). In contrast, the combined application of HPS and LED lights did not appreciable increase the red colour in comparision to the only application of HPS lights in the presented experiment. In addition to the fact that the colour was not markedly triggerd, had the combined use of HPS and LED lights also no effect on yield and the electricity savings were low compared to the only use of HPS lights.
The profit margin was slightly increased with the only use of LED lights compared to the only use of HPS lights. However, it took one day more to get the same yield. In the calculation scenarios presented in Tab. 9 only the additional costs for the electricity were taken into account, while for example costs for plant nutrition were not changed. It can be expected that these costs will not change much, as the plant nutrition costs in Tab. 8 would be expected to be lower for the treatment with only LEDs compared to the treatment with only HPS lights, but would be comparable after reaching 121 g. However, to be able to evaluate the profit margin in dependence of the lighting source better, it would be necessary to use not only data loggers for the used electricity, but also how much plant nutrition goes into each treatment. In addition, the profit margin is very much dependent on the price of the LEDs. Therefore, the presented results can only give an overview, but are most likely not presenting the reality.
However, it could be clearly shown that the combined use of HPS and LED lights is not paying off as profit margin was only half of that compared to the only use of HPS lights. The reason lies mainly in the high expenses for buying the LEDs. Also, the LEDs were not used with full power, it was rather tried to get the best light distribution. This was reached by turning more LEDs on, but not running them with full power. It can be expected that growers using both HPS and LED lights together, would possibly buy less LEDs and run them on full power and accept a possible less
even distribution. Therefore, in total the profit margin might increase compared to the presented experiment.
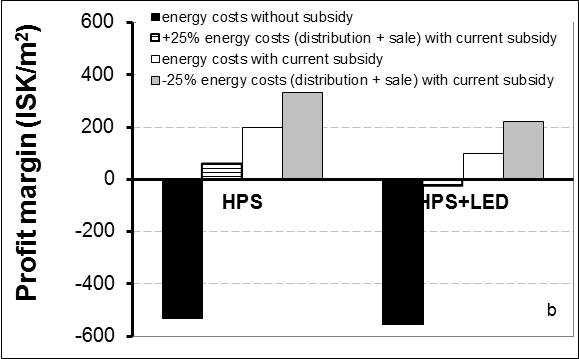
In terms of the economy of lighting – which is not looking very promising from the growers’ side – it is also worth to make some future speculations about possible developments. So far, the lighting costs are contributing to about ¼ of the production costs. In the past and present there have been and there are still a lot of discussions concerning the energy prices. Therefore, it is necessary to highlight possible changes in the energy prices (Fig. 25). The white columns are representing the profit margin according to Fig. 24. Where to be assumed, that growers would get no subsidy from the state for the distribution of the energy, that would result in a profit margin of -500 ISK/m2 for the HPS and -250 ISK/m2 for the LED treatment in experiment A and -500 ISK/m2 for the HPS and -550 ISK/m2 for the HPS+LED treatment in experiment B (black columns, Fig. 25). Without the subsidy of the state, probably less Icelandic growers would produce salad over the winter months. When it is assumed that the energy costs, both in distribution and sale, would increase by 25 %, but growers would still get the subsidy, then the profit margin would range between 50 ISK/m2 for the HPS and 150 ISK/m2 for the LED treatment in experiment A and 50 ISK/m2 for the HPS and 0 ISK/m2 for the HPS+LED treatment in experiment B (dotted columns). When it is assumed, that growers have to pay 25 % less for the energy, the profit margin would increase to 350 and 300 ISK/m2 for HPS and LED, respectively in experiment A and 350 and 200 ISK/m2 for HPS and HPS+LED, respectively in experiment B (gray columns).
From these scenarios it can be concluded that from the grower’s side it would be preferable to get subsidy to be able to get a higher profit margin and grow salad over the winter.
Fig. 25a: Profit margin in relation to treatment – calculation scenarios (urban area, VA210).
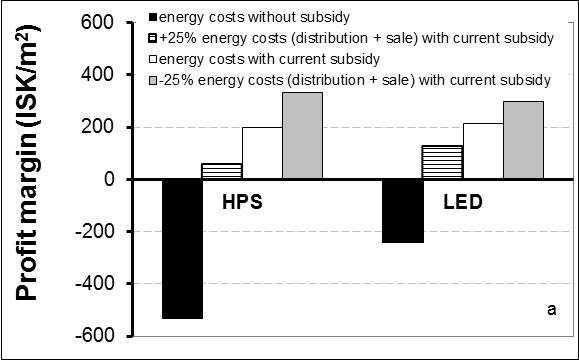
Fig. 25b: Profit margin in relation to treatment – calculation scenarios (urban area, VA210).
The current economic situation for growing salad necessitate for reducing production costs to be able to heighten profit margin for salad production over the winter. On the other hand side, growers have to think, if salad should be grown during low solar irradiation and much use of electricity.
It can be suggested, that growers can improve their profit margin of salad by:
It may be expected to get a higher price, when consumers would be willing to pay more for Icelandic salad than imported ones. Growers could also get a higher price for salad with direct marketing to consumers (which is of course difficult for large growers).
Growers can decrease their plant nutrition costs by mixing their own fertilizer. When growers would buy different nutrients separately for a lower price and mix out of this their own composition, they would save fertilizer costs.
The costs for packing (material) from SfG and the costs for the rent of the box are high. Costs could be decreased by using less or cheaper packing materials. The growers could also try to find other channels of distribution (e.g. selling directly to the shops and not over SfG).
The efficiency of each employee has to be checked regularly and growers will have an advantage to employ faster workers. Growers should also check the user-friendliness of the working place to perform only minimal manual operations. Very often operations can be reduced by not letting each employee doing each task, but to distribute tasks over employees. In total, employees will work more efficiently due to the specialisation.
- Lower prices for distribution and sale of energy (which is not realistic).
- Growers should check if they are using the right RARIK tariff and the cheapest energy sales company tariff. Unfortunately, it is not so easy, to say, which is the right tariff, because it is grower dependent.
- Growers should check if they are using the power tariff in the right way to be able to get a lowered peak during winter nights and summer (max. power -30 %). It is important to use not so much energy when it is expensive, but have a high use during cheap times.
- For large growers, that are using a minimum of 2 GWh it could be recommended to change to “stórnotendataxti” in RARIK and save up to 35 % of distribution costs.
- It is expected, that growers are cleaning their lamps to make it possible, that all the light is used effectively and that they are replacing their bulbs before the expensive season is starting.
- Aikman (1989) suggests to use partially reflecting material to redistribute the incident light by intercepting material to redistribute the incident light by intercepting direct light before it reaches those leaves facing the sun, and to reflect some light back to shaded foliage to give more uniform leaf irradiance.
In conclusion, the results indicate that growing salad under HPS lights is useful in promoting the growth of salad plants after transplanting. Salad showed a clear response to LED lighting (and a higher temperature and µmol level) compared to HPS lighting by increasing red colour, but reducing growth and fresh yield. However, the electricity consumption was better transferred into yield. The profit margin was comparable and one more day would be necessary under LEDs to get the same yield as with HPS lighting.
With the combined use of HPS and LED lights was the yield comparable to the only use of HPS lights and the red colour was only slightly increased. Also, the electricity consumption was not better transferred into yield and the profit margin was reduced by 50 % and one more day would be necessary under HPS+LED to get a yield that is comparable to the one with only HPS lighting.
Therefore, a satisfactory red colouring and at the same time a suitable yield is not possible with lighting with HPS lamps and / or LEDs. From the economic side it is therefore not recommendet to use LED lights at the current status.
Growers should pay attention to possible reduction in their production costs for salad other than energy costs. The obtained results indicate the need of further studies on the effects of LED lighting on vegetables. Also, experiments with LEDs from different companies had to be conducted before final conclusions and recommendations regarding LEDs can be made.
AIKMAN DP, 1989: Potential increase in photosynthetic efficiency from the redistribution of solar radiation in a crop. J. Exp. Bot. 40, 855-864.
BROWN CS, SCHUERGER AC, SAGER JC, 1995: Growth and photomorphogenesis of pepper plants under red light-emitting diodes with supplemental blue or far-red lighting. J. Amer. Soc. Hort. Sci. 120, 808-813.
BULA RJ, MORROW EC, TIBBITTS TW, BARTA DJ, IGNATIUS RW & MARTIN TS, 1991: Light-emitting diodes as a radiation source for plants. HortScience 26, 203-205.
EGGERTSSON H, 2009: Personal communication (Notice in writing) from Haukur Eggertsson, Orkustofnun, October 2009.
HOENECKE ME, BULA RJ, TIBBITTS TW, 1992: Importance of “blue” photon levels for lettuce seedlings grown under red-light-emitting diodes. Hort Sci. 27, 427-430.
JUNTUNEN K, RIIHIMÄKI MA, 2011: Ruukkuvojammestuotannon kehittäminen –LED-valaistuksen hyödyntäminen. HAMK university, óbirt.
KRIZEK DT, MIRECKI RM, BRITZ SJ, HARRIS WG, THIMIJAN RW, 1998: Spectral properties of microwave sulfur lamps in comparison to sunlight and high pressure sodium/metal halide lamps. Biotronics 27, 69-80.
MARTINEAU V, LEFSRUF M, NAZNIN MT, KOPSELL DA, 2012: Comparison of light –emitting diode and high-pressure sodium light treatments for hydroponics growth of Boston lettuce. HortScience 47 (4): 477-482.
PINHO P, HYTÖNEN T, RANTANEN M, ELOMAA P, HALONEN L, 2013: Dynamic control of supplemental lighting intensity in a greenhouse environment. Lighting Res. Technol. 45, 295-304.
RODRIGUEZ C, 2012: Effekt av lyskvalitet på vekst og innholdsstoffer i salat. Universitetet for miljØ- og biovitenskap. Masteroppgave 60.
RODRIGUEZ C, TORRE S, SOLHAUG KA, 2014: Low levels of ultraviolet-B radiation from fluerescent tubes induce an efficient flavonoid synthesis in Lollo Rosso lettuce without negative impact on growth. Acta Agriculturae Scandinavica, Section B – Soil & Plant Science 64 (2), 178-184.
SCHUERGER AC, BROWN CS, STRYJEWSKI EC, 1997: Anatomical features of pepper plants (Capsicum annum L.) grown under red light-emitting diodes supplemented with blue or far-red light. Ann. Bot. 79, 273-282.
SIRTAUTAS R, VIRSILE A, SAMUOLIENE G, BRAZAITYTE A, MILIAUSKIENE J, SAKALAUSKIENE S, DUCHOVSKIS P, 2014: Growing of leaf lettuce (Lactuca sativa L.) under high-pressure sodium lamps with supplemental blue, cyan and green LEDs. Zemdirbyste-Agriculture 101 (1), 75-78 STADLER, C., 2015: Áhrif LED lýsingar á vöxt, uppskeru og gæði gróðurhúsasalats að vetri. Final report, Rit LbhÍ nr. 61.
TAMULAITIS G, DUCHOVSKIS P, BLIZNIKAS Z, BREIVE K, ULINSKAITE R, BRAZAITYTE A, NOVICKOVAS A, ZUKAUSKAS A, 2005: High-power lightemitting diode based facility for plant cultivation. J. Phys. D: Appl. Phys. 38, 3182-3187.
VALOYA, 2013: http://www.valoya.com/document-repository/brochures-and-guides/ document/valoya-the-story-of-a-leafy-green-lifepdf, sótt: 22.09.2014.
WOJCIECHOWSKA R., DŁUGOSZ-GROCHOWSKA O, KOŁTON A, ŻUPNIK M, 2015: Effects of LED supplemental lighting on yield and some quality parameters of lamb's lettuce grown in two winter cycles, Scientia Horticulturae 187, 80-86.
26.sep sowing,coveringwith plastic
1.okt
2.okt
3.okt
5.okt
6.okt
equaldevelopment,buta bitstretched,2leaves
7.okt 3leaves
8.okt
9.okt
10.okt
11.okt planting,20°Cday,800ppm(also withopenwindows),45°Cfloor temperature,measuringtemperature
12.okt
leafandsoiltemperature comparablebetweenboth chambers
planting,19°Cday,800ppm(also withopenwindows),35°Cfloor temperature,measuringtemperature
19.okt 2°Cdifferenceforwindowstoopen, starttoreducefloortemperature1h beforelightsturnoffandturniton 0,5hlater
20.okt measuringsoilandleaftemperature in2hintervalls
21.okt
24.okt 10cmbetweenchannels plantsinLEDchamberare muchmorered,butsmaller thaninHPSchamber
25.okt measuringsoilandleaftemperature
measuringsoilandleaftemperature in2hintervalls
10cmbetweenchannels
measuringsoilandleaftemperature
26.okt
27.okt
31.okt harvest,15cmbetweenchannels, measuringsoilandleaftemperature
1.nóv
harvest,15cmbetweenchannels, measuringsoilandleaftemperature
sowing, coveringwithplastic
2.nóv plastictakenaway
3.nóv
4.nóv daytemperaturefrom 21°Cchangedto19°C
5.nóv
6.nóv
7.nóv finalharvest finalharvest
8.nóv startingwithpreparationsfornext experiment,newbulbsfor8HPS lights,LEDlightson20%middle, 30%end
9.nóv
10.nóv
11.nóv 12.nóv 13.nóv 14.nóv
15.nóv planting problemswithheating valvue(floortemperature toohigh,butwillgodown)
16.nóv 17.nóv 18.nóv 19.nóv 20.nóv 21.nóv
planting problemswithheating valvue(floortemperature toohigh,butwillgodown)
22.nóv 5cmbetweenchannels salatpotsverywet 5cmbetweenchannels salatpotsverywet 23.nóv 24.nóv
28.nóv 10cmbetweenchannels salatpotsverywet 10cmbetweenchannels salatpotsverywet 29.nóv
1.des
5.des 15cmbetweenchannels,1.harvest
6.des
15cmbetweenchannels,1.harvest noobviousdifferenceof colourbetweenchambers
lastharvest lastharvest