The Canatara Park Binders - Addendums (Lambton County Archives)
Addendum
s
The following items are included in this addendum.
The members of the Sarnia Parks Board from 1927 to 1953, and of the Sarnia Parks & Recreation Board for selected years from 1955 to 1977. (4 pages)
I - Note 1: A short history of the navigational problems at the head and mouth of the St. Clair River. (2 maps and 6 pages)
J - Note 2: The story of the channels and islands at Point Edward. (5 pages)
K- Note 3: Historical records of the Mississaga village in the St. Clair Delta. (3 pages)
Note 4: The 1813 letter from General Prevost at Montreal to General Proctor at Amherstburg. (1 page)
L- Note 5: A summary of the evolution and geomorphology of the Point Edward spit. (6 sections)
M- Note 6: Historical maps depicting the St. Clair River, 1650 – 1820. (17 maps and 28 pages)
O-
Note 7: Excerpts from the journals of J.D. Doty and H.R. Schoolcroft. (4 pages)
Note 8: A brief history of Fort St. Joseph 1686 – 88. (5 pages)
P-
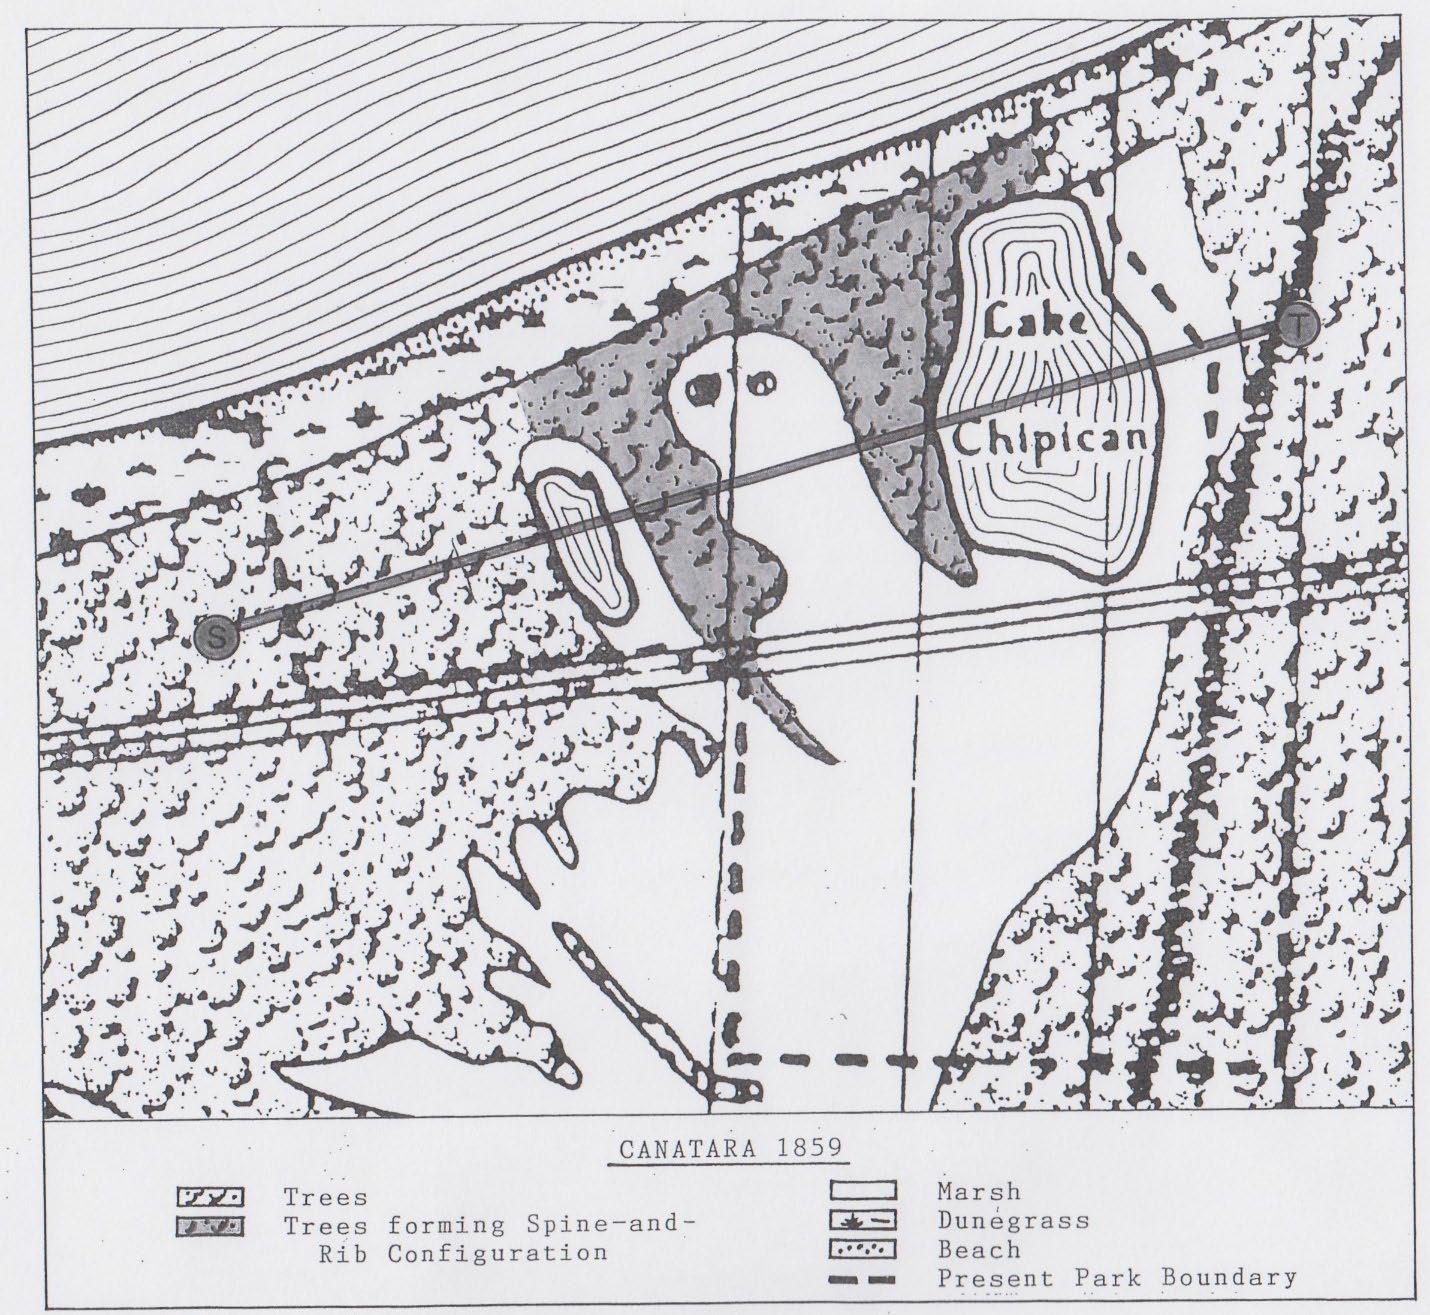
Note 9: Canatara’s “Spine & Rib Configuration”.
Note 10: Canatara’s Oak Woodland.
Note 11: Spits with long narrow necks.
Note 12: The Gravel Supply Factor in the Creation of Canatara Park.
Note 13: Dredging in the Southern Sector of the Point Edward Gravel Deposit.
Note 14: The Influence of the Point Edward Gravel Deposit & Spit on the Human History of the area.
Note 15: Sarnia Bay – 1867 - 1985
Members of the Sarnia Parks Board: 1927 – 1953
Below is a list of the 12 individuals who were appointed by Sarnia Council to fill each of the six seats on the Parks Board during the 1927 – 1953 period. Also recorded are the years each member served on the Board.
Seat one
Seat two
Seat three
Seat four
Seat five
Seat six
G. Wenino 1920 – 1928 (9 years)
J. Hunter 1929 – 1936 (8 years)
M. Hanna 1937 – 1946 (10 years)
N. Perry 1947 – 1954 (8 years)
W. Germain 1923 – 1964 (42 years)
T. Sloane 1925 – 1936 (12 years)
J. Barr 1937 – 1954 (17 years)
W. Watson 1925 – 1953 (29 years)
G. Galloway 1927 – 1950 (24 years)
H. Savage 1951 – 1953 (3 years)
C. Driscoll 1927 – 1943 (17 years)
E. Bedard 1944 – 1954 (11 years)
J. Newton was the secretary – manager of the Board during the 1927 – 1953 period.
The following five members served as chairman during this period.
W. Germain 1927 – 1928, 1937 – 1953
T. Sloane 1929 - 1930
G. Galloway 1931 – 1932
W. Watson 1933 – 1934
C. Driscoll 1935 – 1936
The following individuals were on the Board when they were serving as Mayor during the 1927 – 1953 period.
J. F. Newton 1927 & 1929
W. Scott 1928
A. Kirby 1930 & 1931
J. Barr 1932
H. Lockhart 1933
E. Blake 1934
E. Bedard 1935
W. Crompton 1936
F. Pelling 1937 & 1938
N. Perry 1939
J. Barnes 1940 – 1942
W. Hipple 1943 – 1945
W. Nelson 1946 – 1953
Members of the Sarnia Parks & Recreation (P&R) Board
Listed below are members of the P&R Board for selected years from 1955 – 1977. For each year the first member on the list is the Chairman, the next two are Sarnia Aldermen & the last one is the P&R administrator.
In several years the administrator was replaced by another one, in which case the second administrator is indicated by the number 2.
1955
1957
R. Dunlop H. Page
M. Gowland H. Turnbull
J. Matheson J. Knox
W. Germain W. Germain
H. Page W. Atherton
W. Atherton F. Dyer
H. Byron W. Brennen
H. Savage W. Palmer
1958
1959
F. Dyer E. Steward
H. Turnbull W. Pearson
J. Knox R. Donohue
W. Germain W. Germain
W. Atherton E. Colbert
E. Steward W. Miller
A. O’Hagan A. O’Hagan
W. Palmer W. Palmer
1967 1971
H. Quist N. Lundvall
A. Bradley D. Boushy
L. Weldon R. Ford
L. Berger R. Rothenbury
L. Kirk D. McPhail
D. MacKenzie O. McLeod
E. McCaffery G. Howlett
W. Palmer R. Morrison
R. Harrison (2)
1972
1973
R. Rothenbury D. McPhail
D. Boushy R. Ford
R. Ford M. Coulter
1972 (cont’d) 1973 (cont’d)
D. McPhail J. Manton
J. Manton E. Galloway
R. Casselman D. Holmes
J. Slobodnick J. Slobodnick
R. Harrison R. Harrison
D. DeShane (2)
1974
1975
J. Slobodnick J. Manton
M. Coulter M. Coulter
G. Wood J. Kowalyshyn
J. Manton T. Peddigraw
D. Holmes R. Gordon
J. Kowalyshyn M. Pullan
E. Galloway A. Larocque
D. DeShane D. DeShane
1976
1977
T. Peddigrew D. Gelder
J. Kowalyshyn J. Kowalyshyn
K. Burchill D. Boushy
A. Larocque B. Bouck
B. Redmond J. Link
B. Bouck E. Bednar
D. Gelder D. Bradley
D. DeShane D. DeShane W. Skerrett (2)
Postscript: Members of the Parks Board: 1914 – 1925
From 1914 to 1925 the Board consisted of the mayor, five individuals appointed by Sarnia Council and the secretary – treasurer. For each year the first member in the list is the mayor, the second is the chairman and the last one is the secretary-treasurer. In May 1923 former mayor George Crawford died and he was replaced by Bill Germain.
1914 1915 1916
J.B. Dagan
T. Doherty
W.R. Paul
T. Doherty
A. Lascheuger A. Lascheuger
A.J. Johnston
W.R. Paul
J.D. Mills
A.F. Wade
A.J. Johnston
J.D. Mills
W.J. Proctor
A.F. Wade
W.J. Proctor
A. Lascheuger
T. Doherty
A.J. Johnston
W.R. Paul
J.D. Mills
A.F. Wade
1917 1918 1919
W.J. Proctor
W.R. Paul
A.J. Johnston
W.B. Clark
S. Williams
J. Thomas
A.F. Wade
J.S. Crawford W. Nisbet
W.R. Paul
A.J. Johnston
W.B. Clark
S. Williams
J. Thomas
A.F. Wade
W.R. Paul
A.J. Johnston
W.B. Clark
S. Williams
J. Thomas
A.F. Wade
1920 1921 1922
W. Nisbet
W.R. Paul
G. Wenino
J.T. Woodward
J. Thomas
I. Newton
A.F. Wade
G. Crawford
G. Wenino
A. Gates
J.T. Woodward
W.C. Nelson
I. Newton
A.F. Wade
G. Crawford
G. Wenino
A. Gates
J.T. Woodward
W.C. Nelson
I. Newton
A.F. Wade
1923 1924 1925
T.H. Cook
G. Wenino
A. Gates
G. Crawford
W.C. Nelson
I. Newton
G.A. Andrew J. Barr
G. Wenino
A. Gates
W. Germain
W.C. Nelson
I. Newton
(W. Germain) T. Sloane
T. Sloane
G. Wenino
T. Sloane
W. Germain
W.A. Watson
I. Newton
L. Turnbull
Note 1: Short History of The Navigational Problems at The Head & Mouth of the St.
Clair River.
Two navigational hazards exist at the narrow head of the river: the swift current or rapids and the gravel deposit at the mouth of the Black River.
As noted in Volume 1, most of the early explorers travelled up the St. Clair River in canoes and therefore could portage around the rapids. However, beginning in 1679 with the Griffon, sailing ships had to be pulled through the rapids using either men or animals. Hennepin wrote that twelve crew members pulled the Griffon along the beach at the rapids and General Prevost in the letter provided in Note 4, stated that the native people helped pull sailing craft at the narrow head of the river. In an Observer article (July 18, 1925), Marcus Hitchcock mentioned that in the 1840’s John Robinson used his oxen to pull sailing vessels through the “narrows” as the rapids were often called. Beginning in the 1850’s, steam-powered tugboats were used to tow five or six schooners at a time through the rapids.
Over the years the head of the river has also been a navigational hazard for propeller-driven ships. On several occasions these ships have collided and sunk in the rapids. The last such incident occurred in June 1971 when the Sidney Smith sunk after colliding with the Parker Evans, as recorded in Volume 8. To prevent any future collisions, ships are now prohibited from passing one another in the rapids, but instead must proceed in one direction at a time.
Another hazard at the head of the river is the gravel deposit at the mouth of the Black River shown on Map A5 in Volume 1. As Leverett and Taylor (1915) note, this deposit was formed by gravel that is swept through the rapids from the north on the American side. The upper portion of this deposit consisted of a bar known as the “middle ground”. Mansfield (1899) mentioned the navigational problems created by this deposit:
“….. the middle ground comprised an area of nearly 50 acres and crowded the main channel into a sharp curve close to the Canadian side. The vast through commerce of the lake was thereby exposed to the dangers attending upon passing the narrow and crooked channel with a swift current.”
In 1871 a project was initiated to dredge this gravel deposit to a uniform depth of 15 feet. Over the years this depth has increased until now it is kept dredged to a depth of 27 feet, as shown –coloured orange – on Map N previous page.
As explained in Volume 1, the southern 8 to 10 miles of the St. Clair River consists of a large delta built out into Lake St. Clair. This huge deposit of sand, silt and clay has accumulated over the last 5,000 years from sediment washed down the river from the eroding cliffs along the Canadian shore of Lake Huron. Several distributary channels dissect the delta into five main islands. Much of the delta, particularly the area adjacent to Lake St. Clair, is very low land covered with open marshes. Numerous islets and bars also exist in Lake St. Clair just offshore, creating the “feet” of this “birds-foot” type of delta formation.
The newer, growing section of the delta is located on its western or American side. As Leverett & Taylor (1915) pointed out, this has resulted in a net transfer of land from Canada to the United States.
“The process has a peculiar international relation; the shores of Lake Huron on the Canadian side are being torn away, and through the coarse material is mainly left at Point Edward on the Canadian side, nearly all the fine sediment is carried down the river and built into the new St. Clair delta on the American side.”
The South Channel in the center of the delta forms both the shipping channel and the international boundary. The North Channel on the northwest flank of the delta is the widest distributary, and as shown on Map A in Note 6, was also once used as a shipping channel by sailing craft.
The mouth of each of the distributary channels is clogged with shoals and submerged bars known as “flats”, which present problems for ships, as noted by Hennepin in 1679. When large ships such as steamers & schooners started travelling through the delta in the early 1800’s, their cargoes had to be temporarily transferred to smaller boats called “lighters” in order to pull the ships over the “flats”. Mansfield (1899) described this problem at the “St. Clair Flats”:
“Steamships and vessels are daily compelled in all weather to lie fast aground and shift their cargoes, passengers and baggage in lighters, exposing life, health and property to great hazard; and then by extraordinary heaving and hauling are enabled to get over. To meet this difficulty as far as possible, the commercial men around these lakes have imposed a tax upon their shipping, to dredge out and deepen the channel through these flats.”
However, this initial dredging operation apparently didn’t solve the problem, as Mansfield noted:
“In July 1846, as Captain Mills, who had charge of the dredge reports, 71 steamboats, 37 propellers, 59 brigs, 128 schooners & 81 coasting craft passed the St. Clair Flats. Thirty-one of these vessels were compelled to employ lighters in crossing & all were more or less obstructed and delayed.”
In 1855 a special convention was held in Buffalo to devise a method for solving the problem. According to Mansfield:
“The plan proposed was to dredge a channel 900 yards long & 100 yards wide, at the probable cost of $36,000, driving 1,000 piles costing $2,000, making a total outlay of $38,000. This improvement was carried out in the south channel, the boundary line between Canada and Michigan and about nine miles shorter than the northern route.”
The northern route passed through the wider North Channel, as mentioned by Captain Barr in 1771.
From the 1850’s to the 1950’s, the mouth of the South Channel was periodically dredged to prevent it from becoming clogged with sediment. In the 1960’s a completely new channel, known as the “St. Clair Cut-off” was created that bypasses the mouth of the South Channel. This new channel, which is kept dredged to a uniform depth of 27 feet is shown coloured blue on Map Y on the following page.
Note: On Map N also notice that the submerged remains of the “Gladstone” (as recorded in Volume 4) are shown – coloured yellow – just off-shore of the Canatara beach. Maps N & Y are both portions of navigational charts published in the 1970’s.
Note 2: The Story of the Channels and Islands at Point Edward
The story of these channels and islands has a long history stretching back to the 1840’s, and since then various versions of the story have repeatedly appeared in newspaper items, magazine articles, history books and even government documents. However, not one of the writers who wrote these various versions apparently took the time to carefully examine the historical and geological evidence to determine if the channels and islands at Point Edward ever actually existed. For the most part, they simply repeated what others had written, occasionally adding tidbits of other information – or misinformation – to embellish the story. To determine the validity of the story, the following two questions need to be answered:
1) What historical and geological sources have these writers used to support the story?
2) Did the writers interpret these sources correctly, or did they misread the evidence?
After examining the many versions of the story, it was evident that one or more of the following four sources were used to support it.
1) The source used most often is Louis Hennepin’s 1679 description of the channels and islands in the delta of the St. Clair River. As noted in Volume 1, this source clearly refers to the mouth of the river and not to its head at Point Edward. The use of this source, therefore, indicates that these writers failed to distinguish between the mouth and the head of the river. When correctly interpreted, this source does not support the story. On the contrary, Hennepin’s account of the rapids at the head of the river, combined with the geological evidence, refutes the story.
2) Another source sometimes mentioned is the 1730 Del ‘Isle Map which depicts several large islands and channels at the head of the river. As pointed out in Note 6, this smallscale map drawn by a cartographer in Europe contains many cartographic errors, a particularly flagrant one being the transferring of the delta from the south to the north end of the St. Clair River. This mistake is obvious when this map is compared to the 1730 Boishébert map. In fact, the very accurate Boishébert map, which apparently escaped the attention of all these writers, also refutes the story since it clearly shows that the head of the river consisted of a single, narrow channel – exactly where the geological evidence indicates it would be located.
3) This source is the 1771 report by Captain Barr of Detroit of two river channels, one a league wide with a depth from 18 to 48 feet. As pointed out in Note 1, the two channels referred to by Barr are the South and North channels in the St. Clair Delta. The main shipping channel is the South Channel in the center of the delta. However, when sailing ships started to travel through the river in the 1770’s, they often used the North Channel since it is the widest and easiest for sailing vessels to maneuver in as mentioned by Mansfield (1899). This is another example of writers who mistakenly believed that the mouth of the river was at Point Edward, and thus misread historical documents that refer to the actual mouth of the river at the delta. Of course, the idea that any channel at the head of the St. Clair River in the 1770’s was “a league wide” (i.e., three miles wide) is implausible.
4) This last source does not involve historical records or maps, but rather focuses on two prominent geographic features that existed at Point Edward when the first European settlers arrived, namely Sarnia Bay and the large marsh on the east side of the Point. A number of writers refer to one or both of these features as being the location of former river channels. To people with little or no knowledge of coastal landforms such as bars and spits, or the geomorphic processes that create them, these features do indeed appear as if they could have been the site of former channels. However, as noted in Volume 1, the geological evidence indicates that they are actually typical lagoonal features often located to the lee of large coastal bars, spits and forelands. The east marsh is an enclosed lagoon and Sarnia Bay is an incipient lagoon in the process of being enclosed. (Both these features, of course, have been drastically altered by human activities over the last 150 years.)
In conclusion, none of these four sources supports the story of several channels and islands at Point Edward. On the contrary, when properly understood and examined in conjunction with other historical records and maps, they point in the opposite direction, namely, that there was only one channel at the head of the St. Claire River. This conclusion is also supported by the geological evidence presented in Volume 1 and Note 5. It should also be noted that this geological evidence is conspicuous by its complete absence in the various versions of the story. This is probably due to the fact that the writers were not even aware of its existence.
Furthermore, as mentioned in the notes accompanying Map 5 in Note 6, the French built Fort St. Joseph in 1686 at the narrow head of the St. Clair River to prevent the English fur traders from reaching the Upper Great Lakes. A group of these traders had done this in 1685 by canoeing up the St. Clair River from Lake Erie. If there had been several channels at the head of the river, then there would have been no point in locating a fort on just one of them, since the English could have simply by-passed it by going up one of the other channels.
Note: The earliest reference in the Observer to a former wide river entrance in the Point Edward – Canatara area that I found is the following item (February 12, 1886, p1)
“There is a tradition that less than 200 years ago there was no bay at Sarnia, the river running straight up into the lake. That where Point Edward now stands was all under water.”
Since most people in the 1880’s had no understanding of the geologic timescale, their belief that the wide river entrance existed “less than 200 years ago” is incorrect. In addition, several of the early British maps, such as Maps 11 & 12 in Note 6, portray the head of the St. Clair River as having a wide funnel-shaped entrance. These inaccurate maps, particularly the well-known and readily available 1781 Mitchell Map – probably led people to assume that there had recently been a wide entrance at the head of the river. The 1730 Boishébert Map, on the other hand, wasn’t available until 1960 when it appeared in the “Windsor Border Region.”
It should also be noted that the archaeological evidence indicates that the native people have been at the Point Edward – Canatara area for at least the last two thousand years.
Note 3 Historical Records of the Mississaga Village in the St. Clair Delta
As documented in Volume 1, in 1718 an anonymous traveller, in his journey from the Fort of Detroit to Lake Huron, mentioned that a Mississaga village was located on an island in the delta.
“12 leagues from the Fort of Detroit, always ascending the strait, you will find the Missisagay Indians, who dwell on a beautiful island where they have cleared some land. They number about 60 or 80 men.”
The location of this village is shown on the 1730 Boishébert Map. (Map A8 in Volume 1 and Map 6 in the Note 6 of the addendum.)
Three years later, in 1721, Pierre de Charlevoix travelled up the waterway between Lakes Erie & Huron and also observed this Mississaga village. He described this journey in the following two letters in the book he published in 1744 entitled “Histoire et Descrition Generale de la Nouvelle France.”
Letter 17 (June 18, 1721)
From Lake Erie: “We entered the Strait an hour before sunset and passed the night above a very beautiful island called Boise Blanc. (Today this island is also known as “Boblo Island.”) From the entry of the Strait to the island of St. Clair (Belle Island), which is 5 or 6 leagues, & thence to Lake Huron, it bends somewhat towards the east, inclining to the north, thus the whole of the Strait, which is 32 leagues long, lies between 42°.12” & 43° ½ latitude. Above the island of St. Clair, the Strait widens and forms a lake – St. Clair. It is about 5 leagues long and as many broad.”
Letter 19 (June 30, 1721)
“The course from the fort of the Strait (Fort of Detroit or Fort Pontchartrain) to the end of this traverse is east northeast; from thence you turn to the north by the way of the east and so round till you come to the fourth of 4 leagues, at the end of which you find on your right a village of the Missisagay Indians, seating on fertile soil at the entry of three magnificent meadows. From thence to Lake Huron, I reckon 12 leagues, the country continuing always most beautiful. This is a noble channel, as straight as a line and bordered with lofty forests, interrupted with fine meadows with many islands scattered up and down it, some of which are considerably large. The course through it is always north ¼ east, and in the entrance of Lake Huron the course is due north for 12 leagues more. We entered Lake Huron, the 21st ….”
As mentioned by Cadillac and recorded in a 1736 “Census of the Indian Tribes”, the Mississaga village at Lake St. Clair had for their war device a crane. (Wisconsin Historical Collection. Vol. 17, pp 245 – 52).
Note 4
Letter From General Prevost to General Proctor (Michigan Pioneer Collections, Vol. 15, pp 400 – 01)
Note 5 The Evolution of the Point Edward Spit
This note contains the following 6 sections:
A. A history of the water levels in the Huron basin from Lake Algonquin to Lake Huron
B. Notes concerning a 1996 aerial photo.
C. A seven-stage model of the evolution of the Point Edward spit.
D. Assumptions and other possible origins of the Point Edward spit.
E. Ecological succession in the Canatara area.
F. A list of references mentioned in this note.
A History of Water Levels in the Huron Basin From Lake Algonquin to Lake Huron
A brief history of the events in the Huron basin that preceded and led up to the formation of the Point Edward spit is provided below.
1) The Continental Glacier and Isostatic Uplift
During the Pleistocene Epoch much of North America was covered by an enormous glacier. This ice age ended about 15,000 years ago with the rapid (in geologic time) washing away of the ice sheet. As it retreated northward, a series of glacial & post-glacial lakes formed in the Great Lakes region as shown on the stage maps from Strahler (1973) and Ellis (1974) provided below. As noted by both Strahler and Ellis, as the ice retreated the land began to rebound from the glaciers tremendous weight. This rebounding process is known as “isostatic uplift” and it resulted in a sequence of temporary lakes that in some cases were hundreds of feet below the water level of the present Lake Huron, which is about 580 feet above sea level (asl).
2) Lakes Algonquin, Stanley, Nipissing & Algoma
About 11,000 years ago the Huron & Michigan basins contained glacial Lake Algonquin, which had a water level of about 605 feet asl. It is shown on Ellis’s stage Y map. Then between 10,000 and 10,500 years ago, when the glacier retreated from a very low area around North Bay, Ontario, the waters of Lake Algonquin drained out through the Mattawa & Ottawa Rivers, as noted by both Strahler and Ellis, and shown on Strahler’s Stage E map. As recorded by Ellis, the resulting Lake Stanley had a water level 415 feet below Lake Huron. As the land gradually rebounded, this North Bay outlet gradually rose in elevation until about 5,500 years ago the water level in the Huron basin was once again near the 605 foot level, as it had been during the previous Lake Algonquin stage.
This second 605 foot asl stage is known as post-glacial Lake Nipissing, as also noted by Strahler & Ellis, and shown on Strahler’s Stage F map. It began about 5,500 years ago and existed for approximately 1,500 years. Initially it had three outlets – at North Bay, Chicago & Port Huron. About 4,500 years ago isostatic uplift raised the North Bay area above 605 feet asl and water ceased to flow out this northern outlet.
All the discharge of Lake Nipissing then flowed through the two southern outlets. The Chicago outlet was on bedrock and could not cut deeper, but the Port Huron outlet was in glacial till (unconsolidated material) and this was cut down. As the downcutting of this outlet progressed, the Chicago outlet ceased to function and the entire discharge of the three upper lakes flowed through the Port Huron outlet. This outlet, by the way, includes the entire waterway from the head of the St. Clair River to the mouth of the Detroit River at Lake Erie.
Continued downcutting lowered the water level in the Huron basin 25 feet until it reached the Lake Huron level about 3,000 years ago, as noted by Ellis. There was a brief pause in this 25foot drop during the Lake Algoma stage when downcutting was halted by bedrock in the Detroit River. This stage ended when the Detroit River shifted laterally into a deeper channel, causing the lowering of Lake St. Clair and the resumption of the St. Clair River downcutting. This downcutting ceased when the Lake Huron to Lake Erie channel was reduced to low gradient. This 11,000-year history is summarized in the following two paragraphs from Karrow (1980).
“Glacial Lake Algonquin, with one of its outlets at Port Huron, occupied the Huron basin about 11,000 years ago. The retreating ice front lay along the northern edge of the glacial lake and as the ice retreated, the lake grew in extent. Then, between 10,000 & 10,500 years ago, Lake Algonquin drained to the low Lake Stanley stage in the Huron basin as the North Bay outlet became ice free.”
During the subsequent 5,000 years, as the ice continued to retreat and ultimately to disappear, isostatic uplift raised the North Bay area and the water level transgressed southward across the abandoned Algonquin floor until once again water spilled southward at Chicago and Port Huron creating the Nipissing Stage. During an additional thousand years or so the North Bay outlet rose above the level of Port Huron and went dry, concentrating the outflow southward. Erosion of the Huron outlet led to the decline of the water plane in the Huron basin to the present level.”
3) Radiocarbon Dating
Since 1950, radiocarbon dating of wood and shells found in shore features such as the beaches and bars of these former lakes have allowed researchers to determine approximately when these lakes existed. Figure 1 below is from Karrow (1980) and shows the radiocarbon dates obtained from wood or shells found in the shore features at 600 – 605 feet asl around the southern part of Lake Huron. Notice that all these dates relate to the Lake Nipissing stage rather than the older Lake Algonquin stage.
However, prior to 1950 researchers such as Leverett, Taylor & Goldthwait believed that the shore features at the 600 - 605-foot asl had been created during Lake Algonquin and the Lake Nipissing features occurred at the lower elevation of 592 – 595 feel asl. Since 1950 researchers using radiocarbon dating have demonstrated that these lower features were actually formed during the Algoma stage. In view of this information provided by radiocarbon dating, all the following quotes from Leverett & Taylor (1915) and Goldthwait (1910) have been altered by substituting the correct term “Nipissing” for the features they mistakenly called “Algonquin” and the correct term “Algoma” for the features they mistakenly called Nipissing.”
With this correct terminology substituted, Leverett & Taylors description of the gravel deposit at Point Edward reads:
“The deposit appears to be all of modern or post-Algoma age. At the time of Lake Nipissing the entrance to the St, Clair River was a wide tapering bay opening northward from Corunna; and the gravels from the Nipissing stage, except for one prominent bar upon which London Road enters Sarnia, lie north and northeast of Sarnia and are quite separate from those that have displaced the river at Point Edward.”
Figure 1 from Karrow shows the existing shore features of Lake Nipissing at the end of this lake stage when the bars and spits along its shore had reached their greatest extent about 4,000 years ago when the water level was about 600 feet asl. This shoreline, which includes both beaches and cliffs, is coloured yellow and the bars and spits are marked orange. Notice that large sections of the Nipissing shoreline have been eroded away during the last 3,000 years. (For example, from Brights Grove to just west of Kettle Point.)
Both a mid-bay bar and bay-mouth bar built across the bay south of Grand Bend, converting this bay into an enclosed………
4) The Lake Nipissing Shore Features in the Sarnia – Lambton & Port Huron Area
From: P.F. Karrow (1980).
The Nipissing Transgression Around Southern Lake Huron.
“Can J. Earth Sci.” Vol 17 pp 1271 – 74
From: A. Dreimanis (1958) “Beginning of the Nipissing Phase of Lake Huron”
J. Geology Vol. 66 pp 591 -94
I-A Shows the location of Map I-C
I-B Shows a profile of the Lake Huron bluff between A & B
I-C Shows 1 the Nipissing bar / spit (coloured Yellow)
2 the Nipissing back beach (coloured orange)
3 the partially enclosed lagoon between 1 & 2
From: C.F.M. Lewis (1969) “Late Quaternary History of Lake Levels in the Huron and Erie Basins”
Proceedings of the 12th conference on Great Lakes research, pp 250 – 270
It shows the four radiocarbon dates of mollusk shells found in the back beach (coloured orange) along the inland shore of the lagoon
Also shown are the two dates Dreimanis obtained from logs imbedded in the bar / spit (coloured yellow) that separated the lagoon from Lake Nipissing.
…… lagoon, coloured blue. (The bay-mouth bar is today the eastern section of Pinery Provincial Park, where the largest dunes are located.) The “wide tapering bay” at the foot of Lake Nipissing referred to by Leverett & Taylor is also coloured blue. A large spit mentioned by Karrow (1986) built westward from Bright’s Grove area and converted this bay into a partially enclosed lagoon. (The eastern section of this spit at Bright’s Grove has been eroded away over the last several thousand years.)
The foundation of this Nipissing spit consisted of the large gravel bar shown on Figure 1 from Dreimanis (1958) – provided above. The back beach labelled “Algonquin” on Figure 1 is actually a Lake Nipissing beach, as indicated by the radiocarbon dates recorded on Figure 4 by Lewis (1969) – provided on the left. Notice that Figure 4 shows the location of the Nipissing spit (coloured yellow) in the northern part of Sarnia. Karrow (1980) obtained radiocarbon dates from several oak logs that were embedded within it. Its eastern section has been eroded away while its western end is near the southeast corner of the Sarnia Golf Course. The gravel in it has been excavated from a number of pits over the last hundred years, as recorded by Hodgson (2018) and shown on the 1974 aerial photo provided below.
Furthermore, as shown on Karrow’s Figure 1, another large spit built southward along the west side of the Nipissing shore towards Port Huron. As described by Leverett & Taylor (1915), it enclosed a long narrow lagoon on its landward side:
“The Nipissing beach enters Port Huron as a large spit or barrier ridge projecting south along the shore from old lake cliffs to the north. It is a gravelly, sandy beach ridge or close-set series of ridges, in many places obscured by fine sand & dunes. From Port Huron to Lakeport the ridges rest on a flat clay floor, which slopes very gently towards the lake, and which, behind or west of the main ridge, forms a swampy lagoon 6 or 7 miles long. A back beach skirts the western side of the swamp very closely and is relatively immature when compared with the main ridge. From its position behind the main ridge, it is plain that this beach was made before the main ridge, the latter having been built southward across the shallows at a later time. The position and relations of the main ridge indicate that from Lakeport south, it is a spit built mainly by shore drift from the north ……”
Map A5 in Volume 1 shows the southern portion of this spit, which ended near what is today the corner of Elmwood Street and Gratiot Avenue in Port Huron. Map A5 also shows the western end of …..
1974 Aerial Photo
Approximate edge of Nipissing
Approximate shoreline of Lake Wawanosh
___ ___
1974 aerial photo showing gravel pits (black) & former pits (yellow) between Murphy Road & Blackwell Sideroad.
spit
Nipissing Spit
This aerial photo shows a long spit, with a partially enclosed lagoon on its landward side, similar to the one that formed in Lake Nipissing across what is today the northern part of Sarnia. This view would be looking southeast over the foot of Lake Nipissing with what is now the Bright’s Grove area at the top left. The western growing end of the spit is about where the southeast corner of the Sarnia Golf Course is today.
… the Nipissing nearshore bar along which London Road in Sarnia runs today. Map L, which is based on Karrow’s Figure 1, shows the beaches, bars, spits & lagoons along the southern shoreline of Lake Nipissing about 4,000 years ago, at the end of this lake stage.
5) Shore Features created during the water level drop from Lake Nipissing to Lake Huron
A series of briefly occupied beach ridges, grading downwards in elevation, were formed as the water level fell 25 feet from Lake Nipissing to Lake Huron. In the Sarnia area most of these progressively lower beach ridges, which were situated north of the Nipissing spit, have been either eroded away by Lake Huron or levelled by urban development. Today the best location to observe them is from Newell Street looking west across the Sarnia Golf Course where the ridges have been preserved. In 1910 Goldthwait identified one of the ridges in the northern part of Sarnia as being at the “Nipissing” (Algoma in todays terminology) elevation of 595 feet asl. He described it as: “a gravelly beach with a sandy crest, 700 yards back of the lake near Point Edward.” He also noted that there were:
Several other ridges above and below it, but none so continuous. The upper ones are gravelly and the lower ones sandy.” These ridges form the Algoma terrace shown in Figure 2 in Volume 1.
On the American side Leverett & Taylor noted that a series of post-Nipissing beach ridges descend from the west side of the Nipissing spit down to Lake Huron. One of these would be the Algoma beach, although like many areas around the southern part of Lake Huron, this beach ridge is not distinctive enough to positively identify. In the Sarnia-Bright’s Grove area Fitzgerald et al (1979) noted that: “Lake Algoma is the poorest developed of all the post-glacial features in the area.” Karrow (1980) also pointed out that: “Further work is required to distinguish and trace a separate lower shoreline of the Algoma stage” in the Sarnia & Ipperwash areas.
As the water level fell 25 feet from Lake Nipissing to Lake Huron, the water level in the two lagoons, coloured blue on Karrow’s Figure 1, also fell. When the water reached the Huron level, only the lowest sections of these lagoons retained any water. Lake Wawanosh occupied the lowest part of the lagoon to the lee of the Nipissing spit at Sarnia and Lakes Burwell & Smith were in the lowest part of the lagoon to the lee of the bay-mouth bar to the south of Grand Bend. Large marshes and wet meadows covered the floor of these former lagoons adjacent to the remnant lagoonal lakes.
1974 Ipperwash Photo
This 1974 aerial photo shows the series of post-Nipissing beach ridges in the Kettle Point –Ipperwash area where they have not been destroyed or obscured by urban development. Fitzgerald et al (1979) noted that in this area: “There are a number of ridges or strand lines at 595 feet a.s.l. that indicates short interruptions in the lowering of Lake Nipissing to the Lake Huron Level. These may prove to be Lake Algoma features, but since they are difficult to see, other than by air photo, they haven’t been examined in detail.”
1996 Aerial Photo
B Notes concerning a 1996 Aerial Photo
The aerial photo on the previous page was taken in November 1996 when the second Bluewater Bridge was being constructed. At the top right of the photo is the western portion of the long straight shoreline of Lake Huron that extends east to Bright’s Grove, as shown on Figure 4 from Lewis (1969). Over the last 3,000 years the cliffs along this section of shoreline have retreated southward as more & more material has been eroded, particularly during periods of high water levels in Lake Huron.
At the western end of this straight shoreline, notice that the shore curves to the southwest toward the wide beaches at Canatara Park. This curve is where the wide river entrance at the foot of Lake Huron started to bend southward. As shown on Map A6 in Volume 1, this shoreline ran southward from the east side of Lake Chipican to downtown Sarnia. It was at this bend in the shore that the Point Edward spit began to form about 3,000 years ago. Much of the sand and gravel that formed this spit came from the material eroded from the eastern section of the Nipissing spit at Bright’s Grove. Thus, in this case, erosion or “retrogradation” of one spit has led to deposition or “progradation” at another one.
As noted by Leverett & Taylor, the Lake Huron shoreline on the northern flank of the gravel mass at Point Edward is one where sand and gravel is deposited instead of removed. This is indicated by the following fact. If this shoreline was retreating southward like the one to the east, then evidence of marsh deposits from Lake Chipican to the lee of Point Edward spit would outcrop and be exposed along the Lake Huron shore, as illustrated in Figure 26 below. However, there is no evidence of these deposits, even during periods of high-water levels when the Canatara shore is eroded and the beach sediments are exposed in a low bluff.
During the last hundred years structures such as sea walls, jetties and groynes have been placed along the Lake Huron shore from Bright’s Grove to Point Edward. These structures have interfered with and altered the erosional & depositional process along this shore. For example, on the 1996 aerial photo notice the large deposit of sand & gravel that has accumulated on the eastern or “updrift” side of the eastern jetty at the entrance to the Yacht Club Basin. This sediment has enlarged the whole western section of the Canatara beach. On the other hand, the shore to the west of the western jetty has been starved of beach sediment and therefore has eroded southward. This process……
Note: Both the Toronto spit and the Long Point have retreated landward and consequently marsh sediments originally deposited in the lagoon to the lee of these spits are being exposed on the lakeward side, as shown in Figure 26. Also see Note 11 below.
……. is illustrated on Figure 14, 14A, provided below. The aerial photo also shows the wide beaches along the entire Canatara shoreline. Here the groynes have trapped a particularly large amount of beach sediment due to the fact that deposition naturally occurs on this section of shoreline located on the northern flank of the gravel mass at Point Edward, as noted above. Furthermore, notice that the bank at the head of the river, especially along the American side, is now armoured with a sea wall to prevent erosion.
Based on maps, shoreline surveys and aerial photos, the Canatara shoreline in the last several hundred years has neither retreated nor advanced but remained stable. Although some erosion occurs during large storms during periods of high-water levels, the depositional process gradually restores the beach to its former position. This is known as an “equilibrium shoreline.” In contrast, the eroding shoreline to the east of Point Edward is known as a receding or “retrograding shoreline.”
As recorded in Volumes 4 to 7, during the period from 1920 to the mid 1960’s, various companies, as well as the city of Sarnia, extracted large amounts of sand and gravel from the Canatara beach. From 1920 to 1966 several companies such as the Sarnia Cement Products Co. removed sand and gravel from Canatara’s west beach. In 1925 and 1926 the Huron Sand & Gravel Company used a dredge to excavate gravel from along the Canatara shore. In the 1944 –1945 period the Shaw Construction Co. had a gravel collection and screening plant on the east beach. The city also removed large quantities of beach sediment every year from 1933 to 1966, particularly along the central section of the beach. Despite all this activity – which took place before the groynes were installed in the 1970’s – the beach has remained remarkably stable since during most years sediment is being deposited along this section of the shoreline.
C Hypothetical Stages in the Evolution of the Point Edward Spit
The westward growth of the Point Edward spit across the entrance to the St. Clair River over the last 3,000 years is described in the following seven stages, as depicted in Figure 3 below.
Stage 1
Spits are large accumulations of beach sediment with one end attached to the mainland and the other projecting into a body of water. They occur as result of waves transporting sand and gravel along a shoreline by the process of beach drifting and longshore currents, as illustrated in Figure 14.9 on the following page. In the case of the Point Edward spit……
…. the sand and gravel are carried westward from the eroding cliffs along the Canadian shore of Lake Huron to the east of Point Edward as noted above.
When beach sediment is carried by longshore drift beyond a point where the shoreline changes direction, such as an entrance to a bay or river, much of the coarse sand and gravel is deposited as a subaqueous shoal. The shoal thus started is raised into an embankment which gradually becomes longer, wider & higher. Eventually a ridge of sand and gravel is built above the water level. This ridge then guides the longshore drift further out into the water where still more sediment is deposited. The resulting ridge or point of land is known as a simple spit, as shown in Figure 3 (Stage 1). Incipient wind-blown dunes that form along the spit are colonized by pioneer grasses that bind the dunes together and encourages further sand accumulation.
Stage 2
Waves swinging or “refracting” around the end of a spit cause it to curve or “recurve” landward forming a recurved spit or “hook” as shown in Figures 14.10 & 14.11 above, as well as Figure 3 (Stage 2). In the case of the Point Edward spit, Stages 1 & 2 formed the north and west sides of Lake Chipican. A succession of such recurves is often formed during the growth of a spit and are preserved as a series of ridges on its landward side. The pattern created by these ridges - known as the “spit skeleton” – can be used in deciphering a spit’s growth history.
Stage 3 (a & b)
In the case of the Point Edward spit, a second recurve formed off the west end of the first one, creating what is known as a compound recurved spit (stage 3a). The Children’s Farm in Canatara Park is now located in the shallows between these first two curves. The spit continued to advance by adding a third recurve (stage 3b). Today the Canatara ballfield is located between these second and third recurves.
During this stage sediment was also being swept around the southern tips of the recurves and deposited in the relatively calm water in the sheltered area to the lee of the spit. Here conditions were ideal for a quiet deposition and the formation of a large shoal. The accumulating shoal formed the shallow floor of a marsh that also started to develop to the lee of the spit. In addition, the shoal filled in the mouth of two embayment’s …..
Figure 3
…. between the recurves and thereby created two impounded ponds – Lake Chipican and the ballfield pond shown on Map 1 on the preceding page. Large dunes were also forming along the main stem or “spine” of the spit that ran parallel to the Lake Huron shore.
The first two recurves or “ribs” of the spit that formed during stages 2 & 3a were eventually covered by an oak woodland, as explained in section E of this Note. On Map 1 these recurves appear as tree-covered points projecting southward into the marsh on the landward side of the spit. Although various human activities have resulted in most of this marsh being in-filled over the last hundred years, the two recurves are still recognizable features in Canatara Park, as shown on Map 2 & Photo B on the preceding page.
Stage 4
With continued westward prolongation of the spit, and the consequent narrowing of the river entrance, currents passed the end of the spit with ever increasing velocity. These cross-currents resulted in a succession of closely spaced recurves consisting of single beach ridges which accumulated on the spits prograding westward front (Stage 4). This series of subparallel ridges formed the wave-built beach plain that comprises most of the surface areas of the spit. After each of these ridges was formed, it was covered with small wind-deposited sand dunes.
Concerning the beach plain that often forms on multi-recurved spits, Johnson (1919) noted:
“Considered as a whole, it is a level plain, but in detail it is uneven, consisting of sub-parallel ridges separated by belts of lower land called swales or troughs. The successive beach ridges which are added to a growing spit thus give its surface a corrugated or ribbed aspect.”
The picnic grounds to the west of the Canatara ballfield are located on a small portion of the beach plain. The large shoal of sand and gravel to the lee of the spit also continued to grow during this stage and the marsh on top of it continued to expand.
Stage 5
As the spit approached the western shore of the river entrance the strong current in the now constricted river temporarily halted further westward growth. Sediment was swept around the end of the spit as quickly as it arrived, and as a result, a large recurve lengthened southward until it almost reached the pre-spit eastern shoreline of the river. The spit then consisted of a triangular shaped feature with a large, enclosed lagoon (Stage 5). Such a formation is known as a compound cuspate bar (Johnson 1919). The enclosed lagoon in these features typically contains ponds and a large marsh as is the case with the Point Edward spit. By this stage a ridge of large coastal dunes was also forming along the main stem adjacent to Lake Huron. In addition, the strong current at the west end of the spit – at the apex of the bar – was scouring out the riverbed, creating a deeper channel at this location.
Stage 6
The following events occurred during this stage as the bar apex at the west end of the spit gradually deflected the strong current toward the west shore of the river.
1) A shoal developed in the relatively calm water to the south of the bar apex, on the west side of the long recurve.
2) A recurved spit formed on top of the shoal just south of the bar apex.
3) This recurve displaced the river westward and narrowed the river, which created a rapids at this location.
4) The rapids caused more erosion of the riverbed, which lengthened the deep section of the channel.
5) These events, by further deflecting the swift current or rapids toward the west side of the river, caused the erosion of this side and the forming of an undercut bluff at this location.
The recurved spit formed during this stage is shown coloured yellow on the two photos provided below. They were taken in the 1952 – 1955 period before the head of Sarnia Bay was in-filled. Notice that this recurve is the same shape as shown on Map A4 in Volume 1. On the two photos, the recurve is surrounded by marsh vegetation.
Stage 7
Further erosion of the west bank by the deflected river current was accompanied by the development of a southward pointing recurved spit that formed the west side of a shallow bay located on the shoal to the east of the spit. This portion of the shoal was formed primarily during stages 6 & 7 as sand and gravel gradually accumulated in the calm water to the lee of the spit. As with the lagoon, a marsh developed on the floor of the shallow bay created by the shoal.
As the recurve at the western end of the spit grew southward, it caused both the rapids and the deep channel to also lengthen southward. This, in turn, resulted in further gnawing of the river into the west bank and a lengthening of the undercut bluff. This long recurve that has gradually displaced the river westward is described by Leverett & Taylor:
“Gravel and sand are constantly drifting southwest along the Canadian shore into the head of the St. Clair River, where they have been deposited as a southward pointing spit 1 ½ miles long. As the gravels were rolled into the opening the strong current swept away the finer particles and dropped only the coarse material, adding layer after layer of coarse gravel to the westward front of the spit and constantly crowding the river over against its western bank.”
This long-recurved spit continues to grow southward today. However, as noted above, the armouring of the riverbank with sea walls has prevented any further erosion of the American shore and thereby hindered the westward growth of the spit. The large coastal dunes along the spit main stem also continued to grow until they were removed by the railway sand mining operation in the 1860 – 1930 period.
As mentioned in Volume 1, both the elevator and north slips in Sarnia harbour were created by dredging sections of the gravel deposit that forms the shoal in Sarnia Bay. Today sediment continues to be deposited in the tranquil water of these sheltered slips. This material must be periodically removed so that lake freighters can use the dock facilities in Sarnia harbour. For instance, in the 2016 – 2017 period about 15,000 cubic metres of the sediment that had accumulated over the previous ten years was removed.
D Assumptions and other possible origins of the Point Edward Spit
The seven-stage model outlined above was largely based on the shape or “skeleton” of the landform that appears on Map A4 in Volume 1. The model assumes that:
1) This feature is a spit that grew in a succession of recurves, as is typical of many different types of spit formations.
2) The spit’s entire growth occurred in the post Algoma period.
Point Pelee
Contrary to these two assumptions, some spits have a much more complicated growth history than the hypothetical one described above. For example, Point Pelee in Lake Erie appears today to be a typical cuspate foreland built from sediment derived from eroding cliffs both to the east & west of the spit. However, a careful examination of its relict beach ridges, along with radiocarbon dating and an analysis of the changing water levels in Lake Erie over the last 4,500 years has led some researchers to conclude that it is actually a remnant of a much larger feature that existed 4,300 years ago when the water level in Lake Erie was about 35 feet lower than today, as shown in Figure 4 from Trenhaile & Dumala (1978) on the previous page. Point Pelee then is an example of a spit that evolved as the water level rose over a long period of time, and thus formed along what is know as a shoreline of submergence.
As described above, from 4,000 to 3,000 years ago the water level in the Huron basin fell about 25 feet. During this period shore features such as submerged shoals and bars that formed offshore of Lake Nipissing were emerging above the water as the lake level gradually fell. This is known as a shoreline of emergence. At least some of the gravel deposit and ridges that comprise the Point Edward spit could have originated as a subaqueous shoal at the foot of Lake Nipissing.
As the lake level dropped 25 feet the embankments or ridges on the upper portion of the shoal could have emerged as a number of disconnected bars at the entrance to the river. After emerging, the materials in these bars would have been to some extent reworked and redistributed by waves and shore currents and gradually incorporated into the growing spit formation. Thus, some of the spit may consist of material from an original stage that occurred prior to Lake Huron.
E Ecological Succession in the Canatara Area
Kormondy (1969) supplied the following description of the ecological process known as succession.
“Bare ground, either on land or in water seldom remains that way for very long; “nature” in the form of vegetation moves in with dispatch. As characteristic as the colonization process itself, is the subsequent series of sequential replacements that occur on the site, the successional changes that occur.”
As an example of succession, Kormondy provided photos A & B, on the previous page. They show two small ponds, each located between beach ridges at Presque Isle, a large compound recurved spit on the American shore of Lake Erie. Photo A shows a newly formed pond with the most recent beach ridge on the left & the older one on the right. This is how the ballfield site in Canatara Park would have appeared when it was first formed during stage 3b of the spit evolution.
As soon as the geomorphic processes form the land, ecological processes begin to transform it from the open, barren landscape illustrated in Photo A, to the thickly vegetated, semiterrestrial environment displayed in Photo B. This transformation takes place over a period of hundreds of years and results from ecological succession; a process that involves sequential changes in the type, distribution, and abundance of plant & animal species as well as the gradual accumulation of organic matter at the bottom of the pond. Photo B reveals how the view from the south end of the Canatara ballfield would have appeared before it was in-filled.
The sequential changes which occur in wetlands, such as the open marsh & ponds that existed in the lagoon to the lee at the Point Edward spit, is called a “hydrarch succession”. The changes that occur on the sand dunes and beach ridges of a spit, such as the one at Point Edward, is known as a “xerarch succession”. These two types are described in the pages from Colinvaux (1973) provided below.
In Canatara Park today, hydrarch succession is occurring in several areas in and around Lake Chipican, while the “oak wood” seral stage of the xerarch succession is prevalent on the back dunes and relict beach ridges. Photo C below shows the picnic grounds located on the dry, sandy “beach plain” on the west side of the park. Virtually every mature tree in this photo is a black, white, or burr oak. In contrast, the Tarzanland woodlot is ….
Colinvaux (1973) – Introduction to Ecology
… located on the older beach terrace that existed long before the beach plain was formed during Stage 4 of the spit evolution. This woodlot contains a much more complex forest community with over forty different tree species including both maple and beech. It therefore is at or near the climax stage described by Colinvaux.
As illustrated on the map showing human-made landscape changes in Canatara Park, provided in the introduction to these volumes, most of the wetlands that once existed in the park have been in-filled. On some of these reclaimed areas, such as the former landfill site, secondary succession is occurring. Here a community of pioneer herbs such as goldenrod and thistle is being replaced by a community of pioneer trees such as sumac, boxelder & poplar. In other reclaimed areas, such as the ballfield, a carefully maintained lawn is preventing any succession from occurring.
Spits and their associated lagoons usually contain a wide variety of plant communities representing a series of successional stages. For this reason, they are often set aside as natural parks and ecological reserves. Provided below are several pages from McKeating that describe the diversity of plant communities found in three large parks located on spits along the Ontario shoreline of Lake Erie: Point Pelee, Rondeau & Long Point.
Although Canatara is much smaller than these three parks, it contains many similar plant communities including the dune grassland adjacent to the beach, the oak woodland in the picnic grounds, the wetland communities in and around Lake Chipican, secondary successional communities in several areas of the park and a southern hardwood forest in Tarzanland. As with the Lake Erie parks, Canatara also has many different animal species that are often associated with the different plant communities. For example, Figure 11-8 below shows the different bird species that are associated with the various plant communities around a pond such as Lake Chipican.
The primary principle of vegetation management in the Lake Erie parks is to perpetuate the natural succession of plant communities native to each park. For the most part, this involves allowing these communities to change naturally through time. However, to protect the native plants in the various communities; non-native, invasive species such as Norway maple, phragmites, purple loosestrife and garlic mustard are controlled as much as possible. A similar management strategy was recommended by the …..
…. Canatara Park Preservation Volunteers, as recorded in the Management Plans included in the addendum of Volume 9.
Note: As mentioned above, Lake Huron has had a very stable water level over the last 3,000 years, partly because isostatic uplift has ceased at its outlet. However, the water level of Lake Erie has gradually risen over the last 4,500 years since its outlet - the bedrock-floored Niagara River at Fort Erie – is still rising due to isostatic uplift. This has resulted in significant long-term flooding and erosion issues at these three parks, as noted by McKeating.
The following last lines from McKeating’s article also apply to Canatara Park.
“In an environment of small woodlots, factories, row housing, shopping centres and all the trappings of modern urbanization, that these [3 parks] still crackle with geese, swirl with ducks, flash with colorful migrants, harbor rare orchids, and provide a bastion for reptiles and amphibians is an enduring tribute to those before us who fought for their protection. These places are old – products of the ice age – yet as new as last nights storm.”
F References for Note 5
Billings, W.D. (1968) Plants & The Ecosystems
Cole, L.J. (1903) “The Delta of the St. Clair River” Geol Surv Mich Vol.9 pp10-11
Colinvaux, P (1973) Introduction to Ecology
Dreimanis, A. (1958) “Beginning of the Nipissing Phase of Lake Huron” J. Geol Vol 66 pp 591-94
Fitzgerald, W.D., Janicke, E, and Sirorrson, D.J. (1979) “Quartinary geology of the Sarnia – Bright’s Grove area” Ontario Geological Survey, Preliminary Map 2222
Ehrenfeld, D.W. (1970) Biological Conservation
Ellis, W.D. (1974) Land of the Inland Sea
Goldthwait, J.W. (1910) An instrumental survey of the shorelines of the extinct Lakes Algonquin and Nipissing in Southwestern Ontario” Geol Sur of Can, Mem 10
- Hodgson, D (2018) History of Sarnia Township, 1829 – 1990
- Hough, J.L. (1958) Geology of the Great Lakes
Hough, J.L. (1963) “The Prehistoric Great Lakes of North America” American Scientist Vol 51, pp 84 – 109
Karrow, P.E. (1980) “The Nipissing Transgression around Southern Lake Huron” Can J. Earth Sci Vol 17, pp 1271 – 1274
Karrow, P.E. (1986) “Valley terraces and Huron basin water levels, Ontario” Geol Soc of Am Bull Vol 97 pp 1089 – 97
Kormondy, E.J. (1969) Concepts of Ecology
Johnson, D.W. (1919) Shore Processes and Shoreline Development
Leverett, F & Taylor, F.B. (1915) “The Pleistocene of Indiana & Michigan and the history of the Great Lakes” U.S. Geol Surv Mon 53
- Lewis, C.F.M. (1969) “Late Quaternary history of lake levels in the Huron & Erie basins” Proceedings of the 12th Conference on Great Lakes Research pp 25070
McKeating, G. “The Erie Sand Spits” The Natural History of Ontario
Trenhaile, A.S. & Durmala, R., (1978) “The geomorphology and origin of Point Pelee” Can J Earth Sci Vol 15, pp 963 – 970
Postscript
The material in this Note is a summary of the much more extensive information provided in four binders placed in the Canatara Information Centre in June 1993. These binders, which are missing, dealt with the natural history of the park. Two described the park geomorphology and the other explained the ecology. They were:
11) Shoreline Processes
12) Canatara Landforms
13) Canatara Habitats
14) Restoration Ecology
The first ten binders, of course, describe the human history of the park.
More information concerning the natural features of the park is provided in the addendum to Volume 9. Also refer to Notes 9, 10 & 11 below.
Note 6 Historical maps depicting the St. Clair River: 1650 – 1820
This note examines a sequence of 16 maps produced during the 1650 – 1820 period and assesses how accurately each one depicts the geographic features along the waterway now known as the St. Clair River. A list of the published sources where these maps can be found is also provided. As Kathryn Harding points out in The Shaping of Ontario:
“One of the difficulties in tracing the early mapping of Ontario is identifying the key maps, namely those which stood as summaries of the state of geographic knowledge in their time, or which stood as prototypes for subsequent cartographers.”
The 16 maps examined below were chosen from the dozens made during the 1650 – 1820 period because they are generally considered to be the most important and accurate in their time. Many more maps could have been included but they would not have changed the pattern displayed by these 16 highlighted maps. Most of the maps are portions of small scale maps that show either the entire Great Lakes – eastern North American territory or all Southern Ontario. On the other hand, three maps – 6, 12 & 14 – are large scale maps that, even in their original form, focussed specifically on the waterway between Lakes Erie & Huron. As discussed below, during the 1650 – 1820 period large gaps existed in the knowledge of the geographic features along the St. Clair River, and these gaps are reflected in most of the maps in the form of omissions, distortions and outright fictions.
As Kathryn Harding also notes:
“The history of the mapping of Ontario falls into two distinct periods. The French period, from the beginning of the 17th century to the fall of New France in 1763, was notable in Ontario’s history for the production of small-scale maps, as the existence and then the shape of the Great Lakes & the major inland waterways became known. Geographic information was gathered from missionaries, explorers, coureurs de bois & native Indians. The British period of Ontario’s history, from 1763 until the end of the 19th century, saw the production of much larger-scale cadastral land surveys for the settlement of the United Empire Loyalists and other immigrates.”
Maps 1 – 10, with the very important exception of Map 6, are all small-scale maps produced during the French period. In contrast, Maps 11 – 16, with the exception of Maps 11 & 13, are larger scale maps produced during the British period.
The list below provides a shortened version of the name of the map, the year it was published and the cartographer who drew it. Since maps 3,6,12, & 14 were not published, the year indicates when they were drawn.
1650 – 1700
1 1656 Sanson Le Canada
2 1674 Jolliet Lacs des Canada
3 1670 Galinee Voyage Chart
4 1683 Hennepin Nouvelle France
1700 – 1780
5 1703 Lahontan Canada
6 1730 Boishébert Le Detroit
7 1730 Del Isle Canada
8 1733 Popple Norther Colonies
9 1744 Bellin Lacs du Canada
10 1755 Anville Canada
1780 – 1820
11 1781 Mitchell British Colonies
12 1788-89 McNiff District of Hesse
13 1790 Fitch N.W. Territories of U.S.
14 1795 McKee Chippawa grant
15 1800 Smith Upper Canada
16 1813 Chewett Upper Canada
Map References
The list below provides the reference sources used, along with the maps found in each reference.
Cumming, W.P., Hillier, S.E. & Quinn, D.B. (1974) The Exploration of North America 1630 -1776 New York. Maps 1,8,9, & 11.
Gentilcore, L. & Head, G. (1984) Ontario’s History in Maps Toronto. Maps 1,3,7,11,12,14, & 15
Goss, J. (1990) The Mapping of North America: three centuries of map-making: 1500 –1860 Maps 1,9, & 13
Heidenreich, C.E. (1981) “Mapping the Great Lakes: the period of imperial rivalries. 1700 – 1760” Cartographica, Vol. 18, pp 74 – 109 Maps 5,7,10, & 11
Map 1
Map 1
Mika, N. & Mika, H. (1985) The Shaping of Ontario Belleville, Ontario
Maps 6 & 16
Winsor, J. (1884 – 89) The Colonial History of America Vol. IV
Maps 1,2,3, & 4
An additional source referred to is:
Harding, K. (1985) “Three Hundred Years of Ontario’s Evolution in Maps” In The Shaping of Ontario pp 248 – 53
Sanson d’ Abberville Le Canada ou Nouvelle France, 1656
Maps drawn of the Great Lakes region in the 1630’s & 40’s depict no connecting waterway between Lakes Erie & Huron. The first map to show such a connection is Sanson’s map of North America, published in 1650. Map 1 is a portion of Sanson’s Map of Canada published in 1656.
With reference to the St. Clair River, it simply shows that it flows from “Karegnon” (Lake Huron) to the “Lac des Eause de Mer” (Salt Water lake, that is Lake St. Clair). Typical of the small-scale maps published by the French, it shows no geographic features along the river.
Concerning the name “Salt Water Sea” Lageunesse in the Windsor Border Region noted:
“….this suggests that some of the information had come at least indirectly from the Indians, who were always willing to oblige the explorers looking for the south sea.”
Map 2
Louis Jolliet Carte des Lacs de Canada, 1674
This map is the eastern half of a map drawn by the famous explorer Louis Jolliet. Concerning the St. Clair River, it shows a waterway connecting the “Lac des Hurons” with the “Lac des Eaues Sallee’s”, with no geographic features. Notice that it shows several large islands on the east side of Lake Huron, which also appear on several other maps during the 1670 – 1690 period.
Map 3
René de Bréhant de Galinée Map of Dollier & Galince’s Voyage, 1670
In 1669 Dollier & Galinée left Montreal and proceeded by canoe up the St. Lawrence River, through Lake Ontario to Lake Erie, where they spent the winter near what today is Port Dover. In 1670 they travelled up the waterway between Lakes Erie & Huron. In Galinée’s journal this passage is described as follows:
“At the end of 4 leagues we entered a small lake, about 10 leagues in length and almost as many in width, called by M. Sanson, the Salt Water Lake, but we saw no signs of salt in the lake. We entered the outlet of Lake Michigan (Lake Huron), which is not a quarter of a league wide. At length, after 10 or 12 leagues, we entered the largest lake in all America, called the Freshwater Sea of the Hurons, or, in Algonkin, Michigan.”
After travelling up the east side of Lake Huron to Sault Ste. Marie, they returned to Montreal by the Lake Nipissing – Ottawa River route, thus becoming the first Europeans to circumnavigate the southern Ontario peninsula.
Map 3A is a copy made from Galinée 1670 map & Map 3 shows the southwest portion oriented with north at the top of the page. Concerning the St. Clair River (coloured blue), it shows many small islands or sandbars in the delta with the words “grandes prairies” (extensive meadows) written on the map at this location. This undoubtably refers to the extensive area of open marsh at the southern section of the delta. None of the channels or large islands at the delta are shown, however. This is probably due to the fact that travelling by canoe they could have proceeded up any one of these shallow channels without difficulty. The only geographic features depicted on the map are five tributaries flowing into the river. Neither Fawn or Stag islands are shown, and the narrow head of the river is also not depicted, as they could have easily portaged around the rapids at this location.
In general, although this map was made from direct observations, it still gives only a very sketchy representation of the geographic features along the St. Clair River. This is due to the fact that Dollier & Galinée spent just a day or less travelling up the river, and as Galinée’s journal demonstrates, they weren’t concerned with recording all the geographic features they observed.
Map 4 Louis Hennepin Carte de la Nouvelle France de la Louisanne 1683
This map is from Hennepin’s 1683 book “Description de la Louisanne”. It depicts the waterway between Lakes Erie & Huron as a simple north-south river with no geographic features – not even Lake St. Clair. Notice the four large islands on the east side of Lac D’Orleans or Huron”; similar to the ones shown on Map 2, on which Hennepin’s map is at least partially based.
As noted in Volume 1, in Hennepin’s book he mentioned just two geographic features along the St. Clair River, namely, the shallow channels at its mouth and the rapids at its head. These two features received particular attention because they present major navigational problems for the sailing ship he was travelling on, unlike the canoes which other early explorers used.
Map 5 Lahontan General Map of Canada 1703
As noted in Volume 1, although this map shows no geographic features along the St. Clair River, it does show Fort St. Joseph in the general area of Port Huron, Michigan. From Denonville’s 1686 letter, it is evident that the fort was located at the narrow head of the river. The fort was designed to prevent English fur traders from reaching the upper Great Lakes, as a group of them had done in 1685 by canoeing up the St. Clair River from Lake Erie. The fort was strategically located on the outside of the river bend to provide a clear “line of sight” both down the river and up into the lake, as shown in the sketch on the next page. It may also be noted that if there had been several channels at the head of the river, as some writers have claimed, then were would have been no point in locating a fort at just one of these channels, since the English traders could have simply bypassed it by canoeing up one of the other channels.
According to the fundamental principles of Military Geography, the only logical place to locate a fort along the St. Clair River is exactly where Duluth built Fort St. Joseph…….
Sketch showing the “line of sight” guideline used for placing fortifications at the strategic location on the outside of a river bend. The Americans used the same principle in 1814 for locating Fort Gratiot at the narrow head of the St. Clair River.
….. at the rapids at the narrow head of the river. This is also exactly where the Americans located Fort Gratiot in 1814 and where the British at various times considered building a fort. However, since several French cartographers incorrectly marked Fort St. Joseph at other locations, several writers have maintained that its true location is a big mystery. By the way, on a 1688 map by Jean Franquelin the “Fort Dulud St. Joseph” is marked on the Canadian side of the St. Clair River about where Sombra is today and where the river is the widest – the least likely place to locate a fort.
Map 6 Henri-Louis DesChamps de Boishébert Carte de Detroit Erie’ Montent jusgu’au Lac Huron, 1730
As noted above, most French maps produced in the 1650 – 1760 period were small-scale ones that portray large sections of eastern North America. They therefore show few if any geographic features at the local level such as those along the St. Clair River. As Katheryn Harding observed:
“The contribution of the French to the mapping of Ontario were principally the discovery and outline of the general geography of the landscape – the shape of the Great Lakes and James & Hudson Bay, and the network of rivers and lakes between.”
One of the few exceptions to this general conclusion is Map 6 which shows the geographic features along the St. Clair River with exceptional accuracy for its time. As noted in Volume 1, Boishébert’s map was ……
…. not a published map, but rather one made specifically for French authorities so that they would have a very precise chart of this important and strategic section of the Great Lakes river system. This waterway was regarded as particularly important by the French since it was the route that the English fur traders were using to reach the upper Great Lakes, which the French considered their exclusive territory.
Both Fort St. Joseph & Fort Pontchartrain were constructed to prevent the English traders from reaching the upper lakes through this waterway. As noted above, in 1686 Duluth had located Fort St. Joseph where the St. Clair River is narrowest so that any English traders attempting to reach the upper lakes could be readily seen and intercepted. Likewise, in 1701, Cadillac located Fort Pontchartrain, or the “fort des Francois” as it is called on this map, where the Detroit River is narrowest for the same reason.
Map 7 Guillaume Del ‘Isle Carte du Canada ou de la Nouvelle France, 1730
This is a portion of Guillaume Del ‘Isle’s revision of his father’s 1703 “Carte du Canada”
Concerning the general shape and relative sizes of the Great Lakes, it is regarded as one of the most accurate maps of New France for its time. However, with respect geographic features at the local level it depicts many grossly distorted bays, inlets, peninsulas, as well as illusionary islands and rivers. As Harding points out: “it even shows the rivers and lakes forming a continuous link between the Great Lakes & Hudson Bay, with no drainage divide, so water may in effect flow in two directions at once.” As noted in Volume 1, it is also flagrantly inaccurate concerning the fictitious channels and islands at the head of the St. Clair River.
Map 8 Henry Popple Map of the Northern Colonies, 1733
This is a copy of a small section of Map No. 6 in Popple’s 1733 atlas entitled: “The British Empire in America”. By most accounts this atlas contains the most accurate British maps of ….
…… North America during the 1730 – 1750 period. However, as is readily apparent, concerning the St. Clair River, this map contains many omissions and some outright fictions when compared to the Boishébert map. For example, two large islands are located in the middle of Lake St. Clair, but none are at the mouth of the river. Fort Detroit is situated about where Sombra is today, and as noted above, where Franquelin placed Fort St. Joseph on his 1688 map. In addition, the river is portrayed as being about 5 miles wide and the only geographic features are two tributaries.
In general, this map demonstrates the poor quality of British maps of the Great Lakes during most of the eighteenth century. Since the French controlled most of this territory, British cartographers had to rely on published French maps, the reports of native people and their own imaginations. Even with these restrictions, however, Popple still managed to produce a more accurate representation of the St. Clair River than Del ‘Isle did on his 1730 map or is portrayed on Maps 9 & 11.
Map 9 Bellin Carte des Lacs du Canada, 1744
Bellin’s map of the Great Lakes was published in 1744 in Charlevoix’s “Historie et description generale de la Nouvelle France”, which is based on Charlevoix’s travels through North America in 1721 – 22, as mentioned in Note 3.
Map 9 is a portion of this map that shows the “R du Detroit” as a broad river, 3 leagues wide, with many small islands scattered throughout it’s 12-league length. Other than two tributaries, no other geographic features are depicted. A village of “Mississague’s” is situated on the east bank near the mouth of a tributary. From Boishébert’s map and Charlevoix’s book, we know that this village was located on an island near the apex of the delta, and thus the “tributary” shown here is actually one of the distributaries of the delta.
One of the main sources that Bellin used to produce this map was Charlevoix’s travel notes. As Harding records, Charlevoix contributed several errors: “which persisted for several years since Bellin’s maps were so heavily consulted as sources for ….
… later maps”. One such error is the fictitious islands in the St. Clair River. As recorded in Note 3, Charlevoix wrote that the 32-league strait from Lake Erie to Lake Huron had “many islands scattered up and down it, some of which were considerably large.” Bellin evidently used this reference as a basis for placing many islands in the St. Clair River. These illusionary islands reappear on several later British maps, such as Map 11, as mentioned below.
Map 10 d’Anville Canada Louisiane et Teres Angloises, 1755
This map is a portion of d’Anvilles 1755 map published towards the end of the French period. The shapes and areas of the Great Lakes are generally more accurate than on other maps drawn by French cartographers. Notice that the only islands depicted in the St. Clair River are at its mouth in Lake St. Clair. The “Mississagues” village is also marked in this general area. However, it is still far inferior to the Boishébert map, which d’Anville, of course, had never seen.
Map 11 John Mitchell Map of the British Colonies in North America, 1781
This is a portion of a revised edition of Mitchell’s 1755 map. Notice that the St. Clair River is almost an exact copy of Bellin’s 1744 map, showing a broad river with small islands from head to mouth. In fact, by comparing maps 9 & 11, one can see that Mitchell relied very heavily on Bellin’s cartography both for outlining the Great Lakes shoreline and for locating specific geographic and cultural features. Mitchell also copies Popple’s 1733 map by placing several large fictitious islands in the middle of Lake St. Clair. Also notice that the waterway between Lake Erie & Huron is still called, “The Strait or le Detroit”.
Since Jonathan Carver died before publishing an accurate map of the Great Lakes based on the detailed observations recorded in his journal notes, Mitchell couldn’t use it as a source to update and correct the many errors on his map. Carver’s journals, by the way, were sent to the British museum soon after he died and weren’t discovered until the 1960’s.
Map 12 Patrick McNiff Sketch of Lake Erie, Detroit River, Lake St. Clair And Parts of Lake Huron & Ontario, 1788-89
This is the western portion of the first large scale map showing the waterway between Lakes Erie & Huron since the 1730 Boishébert map. It demonstrates the poor knowledge that the British of the 1780’s had of this region in comparison with the French of the 1720’s. It closely follows Mitchell’s map in portraying the foot of Lake Huron as a broad funnel gradually tapering down to the head of the St. Clair River. In fact, it’s hard to discern where Lake Huron ends, and the river begins. However, it’s certainly more accurate than Mitchell’s map since all the islands in the river except those at the mouth have disappeared. (Although along with all the illusionary islands that disappeared, two real islands – Fawn & Stag – also vanished). This is also one of the first maps on which the name “River St. Clair” appears.
Map 13 John Fitch Map of the Northwest Territories, 1790
This is a portion of Fitch’s small-scale map that is based on surveys made by his land company in the 1783 – 1785 period. Typical of early American maps, it depicts the St. Clair River as a straight north-south channel with several islands at its mouth.
Map 14 Alexander McKee Chiefs of Chippawa Nation grant 12 Mile Square to Crown, 1795
This map, like other British maps in the 1795 – 1810 period, depicts the St. Clair River as a gently meandering 40-mile waterway with no geographic features except several crudely drawn islands at its mouth. Notice that the southern shore of Lake Huron, in contrast to Map 12, is inaccurately shown as having a rugged coastline with several headlands and bays.
The map was drawn to show the area, colored black, which was known as Shawanese Township. Originally this area was reserved for native people, specifically the Ottawa nation, but instead, it was opened up for European settlers in the early 1820’s.
Map 15 D.W. Smith A Map of Upper Canada, 1800
This is the southwest portion of the 1800 map drawn by David Smith, the surveyor general of Upper Canada. It is the first printed map of Upper Canada and was produced at the request of Lieutenant Governor Simcoe. With respect to the St. Clair River, it closely follows Map 14, except that the river is incorrectly depicted as having an NNW-SSE orientation.
As shown on the map, the area adjacent to the St. Clair River was still the territory of the native people, with the British side being part of a large tract marked “Great Tract of Wooded Land” and the American side simply marked “Indians”.
The land comprising Essex & “Suffolk” Counties had been surrendered by the native people in 1790 and the townships surveyed and opened up for European settlement during the 1790’s. Substantial numbers of United Empire loyalists & Americans moved into these counties before the War of 1812. However, only a few “squatters” had settled in the area north of the Sydenham River, in what is today, Lambton County. Shawnee Township, for example, would not be surveyed until 1820.
Map 16 William Chewett A Map of the Located Districts in the Province Of Upper Canada, 1813
This is a small section of Chewett’s detailed map of the Districts of Upper Canada. Concerning the St. Clair River, notice that it is very similar to Map 15 with the important exception that the channels and islands at its mouth are shown with great accuracy. This reflects the fact that a nautical survey of Lake St. Clair and the delta had been made by Owen in 1811. Also note that the south part of Lake Huron is still being incorrectly portrayed as having a very rugged shoreline.
Just a year after the map was published, the Americans built Fort Gratiot at the narrow head of the river, which of course is not shown on this map. Five years later, in 1818, Bayfield carried out a detailed nautical survey of both the river and the southern shore of Lake Huron. The resulting nautical charts, which were published in 1828, provided the first accurate representation of the geographic features along the St. Clair River since the 1730 Boishébert map – drawn almost 100 years earlier.
Map A W.H. Smith Counties of Essex, Kent & Lambton, 1852
This is the Lambton county portion of the map in Smith’s 1852 book “Canada, Past, Present & Future.” Although it was published later than the 1650 – 1820 period dealt with in this note, this map is included since it was one of the first maps to use the 1818 detailed Bayfield nautical survey as a source for depicting the geographic features along the St. Clair River. As a result, it shows these features with even greater accuracy than the 1730 Boishébert Map. Notice that the long spit at the western end of the Point Edward spit complex is correctly shown, as well as most of the channels and islands in the delta. All the tributaries are also accurately portrayed. The only major error involves the placing of Fawn Island too close to the American side.
Marked in red is the northern route that sailing vessels often took through the delta in the 1770 –1850 period. As explained in Note 1, this route was longer than the regular route through the narrow south channel that forms the boundary between Canada & the U.S. as marked on Map A. However, the northern route followed the wide North Channel through the delta which was easier for sailing craft to navigate.
Lambton County had been created in 1849 and by 1852 all of its townships had been surveyed & opened for settlement. Of the four settlements along the Canadian side of the St. Clair River, Port Sarnia was the largest with a population of about 800 in 1852. Five years later it would be incorporated as a town. Point Edward was still a Military Reserve inhabited by several families engaged in fishing – Slocum, Seward & Hitchcock – as described in volume 1.
Only a few primitive roads existed in the county at this time. Besides the original River Road, the Egremont Road from London to Errol and on to Port Sarnia had been opened about 1840. Five years later the Warwick to Port Sarnia road was opened.
Also notice that the lagoonal lakes Wawanosh & Burwell mentioned in Note 5 of the addendum are colored blue.
Lake Huron, by the way, was certainly not 594 feet above sea level as shown on this map, but about 580 feet above, as it is today.
Conclusions
Before making any general comments concerning the accuracy of the 16 maps, it may be helpful to review what the geological evidence presented in Volume 1 reveals about the history of the St. Clair River, and particularly the geographic features at its head and mouth.
The geomorphic processes that operate at the head of the St. Clair River, as explained by Leverett & Taylor, produced a single, deep, narrow channel with a swift current or rapids. In contrast, the processes that operate at its mouth, as explained by Kauffman, produced a number of channels, or “distributaries” clogged with shoals and sandbars. Since these processes operate at a very slow rate, the geographic features along the St. Clair River have not significantly changed over the last several thousand years.
This stability is largely due to the fact that the water level in the Great Lakes have remained remarkably stable over the last several thousand years. In particular, the water level in the Huron basin has not changed significantly, unlike in the previous 13,000 years when the water level rose and fell several hundreds of feet.
Furthermore, as Leverett & Taylor note (P. 496), the St. Clair River is very young in geological terms.
“The St. Clair River bears many evidences of the fact that it is of recent origin. One is its straightness & the absence of any but very slight curves or meanders. The only feature suggesting lateral cutting is the bend in the rapids at the north end of the river due to spit encroachment.”
In short, the deposits at both its head and mouth have continued to gradually accumulate. over the last several thousand years, but otherwise this young river has remained much the same as it appears today.
Therefore, the geological evidence indicates that if a careful survey of the river had been made at any time during the 1650 – 1820 period, the resulting map would have been very similar to the one Boishébert drew in 1730, (and what Carver’s journal notes indicated in 1766).
Since both the geological evidence and the Boishébert map provide an accurate record of the geographic features that existed in the St. Clair River in the 1650 – 1820 period, they can be used to assess the number and type of cartographic errors that exist on the other 15 maps. These errors fall into the following two categories:
1 Errors of Omission
These include features that did exist but are not shown on the map. Not one of these 15 maps show the narrow head of the river and thus they omit any hint of the existence of either the Point Edward spit or Sarnia Bay. Neither Fawn nor Stag Island are specifically marked on any of these maps. Maps 1,2,4,5,7, & 8 also don’t show any of the channels. and islands in the delta at the mouth of the river.
2 Fictional Errors
These include features that did not exist but are shown on the map. Maps 2,4,7,8, & 11 depict one or more illusionary islands and Map 7 also shows four fictitious channels at the head of the river.
In general, these 15 maps demonstrate the limitations of historical cartographic accuracy. Like other historical documents, the accuracy of maps is determined by the accuracy of the information used to create them. Due to the fact that during the 1650 – 1820 period in the Great Lakes this information – particularly at the local level – was often very inaccurate, or even nonexistent; most of the maps produced during this period were also very inaccurate – particularly at the local level.
However, in the case of the St. Clair River it is very fortunate that there is a very accurate map drawn at a very early time that was based on accurate surveys. The accuracy of the Boishébert map is also confirmed by the fact that the geological evidence supports the geographic features depicted on it. It also demonstrates that these features have changed very little over the intervening three centuries, exactly as the geological evidence would indicate.
Journals of J.D. Doty & H.R. Schoolcroft
Note 7 Excerpts from the Journals of J.D. Doty & H.R. Schoolcroft
These exerpts are from the “Narrative Journal of Travels” edited by M.L. Williams and describe the features that Doty and Schoolcroft observed along the St. Clair River in May 1820. They were members of an expedition led by Lewis Cass, the Governor of the Territory of Michigan. It consisted of 43 persons who travelled in 5 large canoes from Detroit to Lake Superior. The purpose of the expedition was to investigate the area that now comprises the upper peninsula of Michigan.
Doty’s notes on the opposite page record that on May 26, he crossed Lake St. Clair and entered one of the channels on the English (Canadian) side of the delta. On May 27, he proceeded from the delta up the river to Fort Gratiot at Sarnia Bay and the rapids. Notice that he mentions that a native village was then located on the Canadian shore opposite the south end of Elk (Stag) Island. He also records that the riverbank on the American side of the rapids consisted of several distinct layers of sand & gravel. These represent sediments deposited in various glacial and postglacial lakes that existed thousands of years ago. On May 28, he passed the rapids and entered Lake Huron.
Schoolcroft’s journal notes for May 27 begin:
“The banks of the St. Clair River are handsomely elevated and well wooded with maple, beech, oak & elm. Settlements continue for a considerable part of the way …..”and continue on pages 80 to 83 on the following page.
Notice that he also mentions the various layers of sand and clay in the bank on the American side of the rapids. This bank was slowly being washed away as the river was displayed westward by the accumulating gravel deposit on the east or Canadian side. The logs he observed that were embedded in the bank were deposited in former post-glacial lakes.
On May 28, Schoolcroft records that:
“We left Fort Gratiot. For the first ½ mile, a strong rapids is encountered, on reaching the head of that, we find ourselves on the level of Lake Huron.”
Journals of J.D. Doty & H.R. Schoolcroft (cont’d)
Note 8 A Brief History of Fort St. Joseph, 1686 – 88
In the 1670 – 1760 period there was a fierce rivalry between the French & English over the control of eastern North America. The English controlled most of the Atlantic seaboard and the Hudson Bay regions, while the French were established in both the St. Lawrence & Mississippi river regions, as well as the Great Lakes. In the mid 1680’s English fur traders from New York were reaching Lake Huron, which the French considered their territory, by travelling up the St. Clair River from Lake Erie. To prevent this, in 1686, Denonville, the Governor of New France, sent the letter provided below to Duluth, the famous French explorer. It was sent via Durantaye, the commander of Fort Missilmackinac, and instructed Duluth to build a fort somewhere along the strait (le Detroit) connecting Lake Erie to Lake Huron. (This strait includes what today is known as the Detroit River, Lake St. Clair & the St. Clair River.)
A summary of this history is recorded in the following paragraph from the “History of St. Clair County, Michigan” (pp 607-08).
“Seven years after La Salle’s expedition, Duluth was instructed by Denonville to establish a fort on the Detroit River. The English were making an effort to connect their interests on Hudson Bay with those of New York, and thereby circumvent their rivals’ schemes for territorial acquisition west of the lakes, and with that, the control of the valuable commerce, looking to the ultimate extinguishment of the French influence along the St. Lawrence and its tributaries. It will be seen therefore, that it was a death struggle for the supremacy over a vast region, and that every political, military, religious and commercial appliance was brought into requisition in aid of the respective parties. To this end the early occupation of this post by the French had a double purpose – one to thwart the English schemes, and the other, say the instructions “to protect our Indians who go hunting, and serve them as a refuge against the enterprises of their enemies and ours”, (i.e. the Iroquois & English). In obedience thereto, Duluth proceeded to erect a fortified trading post which he called Fort St. Joseph.”
As shown on Map 5 in Note 6, this fort was located on the west side of the rapids at the head of the strait. In the second 1686 letter provided below, Denonville describes the strait and the area through which it flows, records the location of the fort, and mentions its situation in relation to three other French posts: Missilimackinac, Niagara, and Frontenac. (Their locations are marked on Map 5 in Note 6)
In the summer of 1687 Duluth apprehended another group of English traders travelling up the strait toward Lake Huron. In September 1687 Lahanton replaced Duluth as commander of Fort St. Joseph. That same year Denonville led a French-native force into the area just south of Lake Ontario where they failed to destroy the Seneca, one of the Iroquois tribes allied with the English.
During 1688, the Iroquois, in retaliation for the 1687 French attack, invaded the lower Great Lakes region and forced the French to abandon their three forts in this area, as recorded in the following passage from the “History of St. Clair County, Michigan” (p 609)
“The failure of the French expedition against the Iroquois left all the posts along the lower Great Lakes greatly exposed, while the channels of supply were entirely interrupted. As a consequence, Forts Frontenac & Niagara were hastily abandoned, and this post (i.e. Fort St. Joseph) left as the only barrier against the English & Iroquois; but being deemed too exposed and insufficient for that purpose, it was also abandoned and the stockade burnt under the supervision of Lahontan, and the forces and supplies transferred to Mackinac, which, from the accessibility by way of the Ottawa route, was to be the object of the concentrated energies of the French.”
According to Lahanton’s account in “Nouveaux Voyages” the fort was burnt on August 27, 1688. Thus ended the short two-year history of Fort St. Joseph.
During King William’s War (1689 – 1697), the French regained the lower Great Lakes region, and in 1701 Cadillac was commissioned to build a replacement for Fort St. Joseph somewhere along the strait. He chose a location near the southern end of the strait, on what is today the site of downtown Detroit. This post was called Fort Pontchartrain or Detroit and is marked on Maps 6 through 16 in Note 6. When the Treaty of Ryswick was signed in 1697, the French dominated most of eastern North America, with settlements and forts along its two great river systems – the St. Lawrence, which included the entire Great Lakes region, and the Mississippi down to the Gulf of Mexico.
1686 Letter from Denonville to Duluth
“You will see by the letters that I wrote to Monsieur de la ….
Note 9 Canatara’s “Spine & Rib Configuration”
Much of Canatara Park is located on a portion of the Point Edward spit. As described in Note 5, the spit consists of a belt of sand dunes adjacent to Lake Huron and a series of southwardpointing beach ridges. As the 1859 map to the left shows, the ridges and much of the dunes were covered by trees, while the intervening lowland contained an open marsh and two small lakes or ponds. This unusual landscape structure of wooded strips or “ribs” alternating with open treeless areas is known as a “spine – and – rib configuration” (coloured green)
The S-T profile marked on the 1859 Map is depicted below. The top profile shows the natural features in 1850 before any major human modifications. It displays a textbook case of the alternating pattern or “catena” in the landform, soil & vegetation associations across a spit formation. Notice that the catena consists of a series of local ecosystems matched to the sequence of ridges.
The bottom 1990 profile shows that the catena has been modified by human activities, particularly in the present ballfield and Children’s Farm sites. However, because these two sites remain largely treeless, the broad-scale landscape structure of OPEN – CANOPIED – OPEN –CANOPIED – OPEN has been retained and the two “ribs” have been preserved. This illustrates the fact that while small-scale ecosystems are sometimes destroyed in urban parks to accommodate recreational facilities, the overall landscape structure as represented by the tree pattern can still be preserved.
Below are two sets of diagrams and photos depicting the Canatara area from the south (figure 3) and north (figure 4). The top diagram in each set shows the original landform features of the spit, while the middle figure displays the tree pattern as revealed by the 1859 map. Notice the close association between the spatial arrangement of the beach ridges and the tree pattern, as well as the “spine-and-rib” configuration (coloured green) in the future park. The bottom 1997 aerial photos demonstrate that while the distinctive tree pattern created by the spit formation has been destroyed outside the park by urban development, the “spine-and-rib” landscape structure (coloured green) inside the park is still largely intact. By both restoring the park’s remnant woodlands and not planting additional trees in the open areas, this rare landscape configuration can be preserved.
–
The Landform – Soil
Vegetation Catena of Canatara Park
Geomorphic Formation – Point Edward Spit
Note 10 Canatara’s Oak Woodland
Early European travellers and settlers observed that the woodland at Point Edward consisted of “heavy groves of oak.” Why was the woodland at Point Edward dominated by oak trees? To answer this question, one first needs to recognize that the Point is composed of a series of sand and gravel beach ridges, as explained in Volume 1 and Notes 5 & 9. Since these ridges were formed very recently in geologic time, their soil is poorly developed and contains few nutrients. In addition, the sandy soil is highly porous & retains little moisture. This low-moisture content of the soil is particularly acute during periods when the water table falls due to low water stages in Lake Huron. Consequently, to grow here trees must be adapted to low-nutrient, drought-prone soil conditions. Unlike most other native tree species, black, white & burr oaks have leathery leaves and thick bark that limits moisture losses. Furthermore, their extensive root systems enable them to effectively gather in the little moisture and few nutrients that do exist.
Another factor that accounts for this oak woodland is fire. As Map A4 in Note5 indicates, before human alterations to the landscape, Point Edward consisted of an isolated stand of oaks surrounded by a fringe of dune and marsh vegetation, that is, open grasslands. During periods of drought the dry grassland was very susceptible to fire, and on the wind-swept, very exposed Point Edward site, sporadic grass fires would quickly spread through the encircled woodland. Oaks, with their thick bark, are more resistant to ground fires than other native trees. Therefore, these drought-tolerant & fire-resistant characteristics of oaks allowed them to thrive in the harsh environment of the Point Edward beach plain where other trees could not survive.
Fire was also an important factor in maintaining the integrity of the extensive marsh areas at Point Edward. During low water stages in Lake Huron the dry marsh vegetation was very susceptible to fire. The marsh fires limited tree and shrub encroachment into the marsh. They also reduced the accumulation of underlying organic debris and thereby slowed the in-filling of the marsh.
The Evolution of the Toronto Spit
Note 11 Spits With Long Narrow Necks
As described in Note 5, the growth of a spit is step functional. During each episode of lateral extension, the newly added end is usually curved landward by waves refracting around it. If the mainland at the spits point of attachment (its “root”) is receding, then the spit itself must also retreat in order to maintain its orientation.
Figures 9 to 14 on the opposite page, which are from an 1854 scientific paper by Sir Sandford Fleming, depict six stages in the growth of the Toronto multi-recurved spit. Notice that it not only grew westerly in a sequence of recurved beach ridges., but also migrated landwards as its root – the Scarborough Bluffs - was eroded back by waves. As a result of this landward migration, the spit developed a long, narrow “neck” – coloured orange. (The neck is the portion of a spit’s main stem from its root to its recurved ridges.) Such long necks, which often consist of only a slender, low sand bar, are sometimes breached by storm waves during periods of high lake levels.
During an 1858 storm on Lake Ontario, waves washed away the portion of the slender neck of the Toronto spit at the point where the A-B cross section is located on Fig. 14. This transformed the western, recurved section of the spit into an island.
Long Point in Lake Erie is another spit with a very long (12 miles), narrow neck that has been breached by storm waves, as noted in the article and map below.
In contrast to these spits, the Point Edward spit has a very short neck due to the following two factors described in Note 5.
1- The root is not retreating.
2- The westward extension of the spit is hindered by the strong current flowing from Lake Huron into the river. The spit, therefore, grew predominately southward in a series of closely spaced recurved beach ridges, and never developed a long narrow neck along its main stem and storm beach. High sand dunes were able to form along its short, stable (i.e., non-migrating) neck and main stem.
Wood, H.A. (1960) Wave Transport of Beach Materials on Long Point, Lake Erie – Can. Geog., Vol. 16, pp 27 – 35
Fleming, S (1854) “Toronto Harbour – Its Formation and Preservation” The Canadian Journal pp 223-230
….. desirable to know approximately where the breach is likely to occur.
NOTE: During the 1973-74 high water stage in Lake Erie storm waves again breached the western section of the Long Point neck (see Figure 6 below). The neck in this area consisted of a very low, thin bar only a few feet above the high-water level of Lake Erie along which Hastings Drive runs. Many of the cottages along this road were washed completely off the neck into the marsh-filled lagoon to the lee of the spit.
Fraser, J.A. et al (1977) “Residents Utilization of Coastal Hazard Assistance Programs, the Long Point Area, Lake Erie” Canadian Water Resources Journal 2,2. Pp 37-50
Day, J.C. & Fraser, J.A. (1979) “Flood & Erosion Hazard Adjustments near Rondeau & Long Point” Journal of Urban & Environmental Affairs 11,1. Pp117 – 35
5 – Long Point
Figure
Note 12 The Gravel Supply Factor in the Creation of Canatara Park
As recorded in Note 5, during most years a large amount of sand & gravel is deposited along the Lake Huron shoreline on the northern flank of the huge gravel deposit in the Point Edward –Canatara area shown on Map A5 in Volume 1. Since the City of Sarnia had to buy gravel for construction purposes every year, the funds used to purchase this gravel could be saved if the city obtained property along the Canatara shoreline where all the gravel could be obtained at no cost. This issue was discussed at the March 21, 1930, Parks Board meeting when the Board was attempting to purchase the White property for park purposes. At that meeting the Board agree:
“to permit the City of Sarnia to secure during the life of the Debenture covering the amount of $17,500, any gravel available along the Lake fronting on the said property and from any additional frontage the Board may acquire” subject to several conditions.
Although the City was unsuccessful in purchasing the White property, the gravel supply issue again arose when the Parks Board recommended that the adjacent Merlo, Merlo & Ray property be purchased for parkland in 1932. As the following excerpts from several Observer articles indicate, the fact that the City could save a large amount of money by obtaining the “unlimited gravel supply” on the Merlo, Merlo & Ray property, was an important factor in convincing Sarnia residents that this parkland purchase was a good deal.
August 13, p5 “With acquisition of the land, Sarnia is assured of a gravel supply. The land has been recognized as an adequate gravel source and future civic construction gravel can be obtained from city property at no cost to the city. It has been estimated by officials that the amount of gravel that can be utilized from the land will more than pay for the price of the land. It has also been pointed out that the removal of gravel would in no way destroy the beach.”
August 16, p5 “Another important feature is that there is an inexhaustible supply of gravel on the property, and it is estimated that the cost of the park would be reimbursed eventually from the gravel of which the city uses in normal times from $4,000 to $5,000 worth a year.”
August 17, p2 “Sarnia is now going through a process of securing a park on the lakefront. It is a property that meets all the requirements of a public recreation ground while at the same time it contains deposits of gravel that would supply the city for all time with that material. The cost of the park could be repaid out of this natural resource.”
August 17, p5 - At a meeting of the Taxpayers & Homeowners Association which opposed the purchase of the Merlo, Merlo & Ray property, Mayor Barr pointed out that the $10,000 spent now for the land would be “returned in years to come through the saving of gravel costs.”
August 23, p5 – At the Council meeting that approved the purchase of the Merlo, Merlo & Ray property, various speakers who supported the park proposal, also pointed out the advantage of obtaining this land for its gravel deposit. For example, F.P. Dawson noted that the proposal “was
supported by the fact that the tract of land contained a substantial gravel supply which would be available to the city for many years. The saving to the city in gravel costs would more than repay the cost of the land.” G. Andrew also stated: “The fact that the land was desirable as a park site was shown by the number of people who found it an ideal spot for bathing. The gravel deposit was also a consideration not to be lost sight of.”
August 24, p2 – In an editorial titled “An Advantageous Proposal” the Observer pointed out that the purchase of the Merlo, Merlo & Ray property was an advantageous deal since not only did it provide Sarnia with a much-needed waterfront park, but also “it provides the city with a supply of gravel, a competent utilization of which will return the $10,000 paid for the property within a few years.”
The gravel supply issue, therefore, was an important factor in Council’s decision to purchase the initial 53-acre parcel that includes most of the beach in today’s park.
Beginning in 1933, Sarnia took advantage of the gravel supply along the beach in its new waterfront park. As shown on Map P3 on the opposite page, the Park’s Board had a “gravel road” (coloured green), constructed through the dunes to the beach. A bulldozer pushed the gravel into piles and the gravel was then loaded into trucks which transported it out the gravel road and down to the city. In December ….
…. 1935 the Board made an agreement with the Sarnia Cement Products Company that allowed the Company to remove gravel from the west end of the Canatara beach at a cost of 10¢ per load. The funds acquired from this gravel sale was used by the Board to create some of the park facilities in the 1930’s and 1940’s.
For many years the City also took advantage of the abundant sand supply in the park. In the early 1940’s during the construction of the Sarnia Polymer rubber plant, the Board allowed Polymer to remove sand from the dunes at the west end of Canatara, and in return, Polymer supplied much of the clay used for raising the elevation of the Canatara ballfield. In addition, as noted in Volumes 7 & 8, the City obtained a large amount of sand from the Canatara beach for sanding the streets during the winter.
Thus, all the gravel and sand that the City procured from Canatara Park over the years more than paid for the cost of the Merlo, Merlo & Ray property, just as the supporters of the 1932 park proposal claimed it would.
Bayview Park & Athletic Grounds: 1894
Note 13 Dredging in the Southern Section of the Point Edward Gravel Deposit
At several times gravel was dredged from the southern section of the large deposit shown on Map A5 in Volume 1.
1. Bayview Park Dredging: 1889- 90
When the Sarnia Parks Board obtained the property on which Bayview Park was developed (see map on the left), it was all low marshland except for the oak grove located at the south end of the long breach ridge that separated Sarnia Bay from the marsh-filled lagoon, as shown on Map A4 in Note 5. As recorded in the two newspaper articles below, a canal was dredged around the entire park property to drain the marsh. The dredged material was then spread over the marsh to raise the elevation of the land. Some of the dredged gravel was also used to cover the walkways & carriage lanes in the park.
Observer, July 15, 1892, p1: Bayview Park History Outlined. “The first thing necessary was to drain the property. This was done by dredging around it to the full extent of its boundaries. The dredging furnished all the gravel used in the drives and paths in the free park.”
Toronto Mail, November 19, 1892: Sarnia’s Bayview Park “Bayview Park comprises about 65 acres (including the athletic grounds) and was a gift of the GTR. With the exception of a small piece of high land, nicely wooded with old oak trees, the whole area when acquired by the town was a marsh, presenting no attraction, but many difficulties in the way of successfully converting it into a pleasure resort. This, however, has been most satisfactorily accomplished. A dredge cut, 30 feet wide, was made from the bay around the entire property, which has most effectively drained, not only the park grounds, but much surrounding land in the village of Point Edward and in the township. It also supplied a large quantity of material – sand, clay & gravel – which enabled the Parks Board to carry out the improvement of the ground at very moderate cost.”
2. Elevator & North Slip Dredging: 1927 – 1930
A large amount of gravel was obtained when both the elevator and north slips were dredged, as noted in the following Observer items.
February 2, 1927, p1: The elevator company is reserving the gravel rights on its property.
August 11, 1927, p1: The first work will be the dredging of the channel from the…..
…. main river channel to the dock of the elevator.
September 12, 1928, P10: Dredging in the basin immediately north of the elevator was commenced yesterday by the Canadian Dredging Company which has the contract for dredging a winter basin 1,500 feet long & 300 feet wide.
August 28, 1929, p1: The dredge “Primrose” of the Canadian Dredging Company took 97,000 yards of gravel in the elevator slip and widened it 100 feet.
November 17, 1930, p12: More gravel was taken from the elevator slip, which is being dredged deeper to accommodate larger freighters.
Most of the gravel was carried away by barges to be used on roads and for construction purposes. The sand that was also dredged from the two slips was conveyed through a pipeline floating on pontoons to in-fill the section of Sarnia Bay just north of the elevator and east of the north slip. In 1932 & 1933 ten thousand poplar trees were planted in this sand-filled section to prevent the loose sand from blowing into the adjacent Bayfield Park as recorded in the Observer article above.
Notes For 3 Sarnia Bay Photos (below)
1. The first photo was taken in the early 1950’s and looks south over what was once Sarnia Bay. The large sand deposit dredged from the elevator and north slips in the 1927 – 30 period, with the poplar trees planted on it in 1932 & 1933, is outlined in yellow. The area between the customs plaza / bridge and sand deposit is a cattail marsh at the head of Sarnia Bay. Notice the tip of the recurved spit (marked X) as shown in the two photos accompanying Stage 6 in Note 5.
2. The second photo was taken at the same time as the first one and looks north over the former Sarnia Bay area, with the sand deposit to the east of the north slip. Notice the Sarnia Yacht Club docks at the bottom right and the gravel basin near the top right where the Club moved to in 1957. The breakwater built by Merlo, Merlo & Ray in 1928 can also be seen at the entrance to the basin.
3. The third photo looks southeast over much of the same area in 1996 when the second Blue Water Bridge was under construction. The last remnant of the marsh at the head of Sarnia Bay is outlined in green. It has since been in-filled to create the site for the Point Edward Casino parking lot.
Sarnia Bay 1
Sarnia Bay 2
Sarnia Bay 3
Note 14 The Influence of the Point Edward Gravel Deposit & Spit on the Human History of the Area
As noted in Volume 1 and Note 5, the gravel deposit (Map A5) and its associated spit (Map A4) created a deep narrow channel with rapids at the head of the St. Clair River. These three geomorphic features have influenced the area’s human history in several ways.
1. As explained in Volume 1, a large number of fish are concentrated in and around the narrow head of the river. This, in turn, attracted the native people to Point Edward to harvest the fish. The first European settlers also came to Point Edward to take advantage of the abundant fish.
2. As outlined in Volume 1 and Note 6, at several times forts have been built at the narrow head of the river due to the fact that vessels can be readily seen and intercepted at this strategic location. Both Fort ST. Joseph and Fort Gratiot were located on the west side of the rapids and a military reserve was set aside on the east side.
3. The builders of the Grand Trunk Railway chose Point Edward as the St. Clair River crossing-point because the rapids prevented heavy ice from clogging the river. This in turn allowed the GTR to operate the railcar ferries during the winter months.
4. The builders of the Blue Water Bridge also chose the narrow head of the St. Clair River as the crossing-point since it provided the shortest distance across the river.
5. The spit, by forming a sheltered bay on its landward side, provided small boats and sailing craft with a harbour that was protected from Lake Huron storms. This protected harbour to the lee of the Point Edward spit was an ideal location for a townsite. In the 1830’s a handful of European settlers took advantage of this fact by establishing a small village at this harbour. The village gradually grew into the City of Sarnia that we know today. (A small village also developed in the protected harbour to the lee of the Toronto spit – see Fig. 14 in Note 11. It grew into the present City of Toronto.)
6. As explained in Volume 1 & Note 5, the Point Edward spit and its related lagoon contained a range of geoecological features including sand dunes, open marshes, ponds and an extensive beach. A spit with these features represents an ideal site for various recreational activities. This recreational potential was recognized at various times such as the 1879 International Park resort, the 1895 Provincial Park proposal, the 1921 Lake Chipican Bird Sanctuary lease, and the 1932 Canatara Park purchase.
7. The gravel deposit underlying the spit explains why a number of gravel-extraction companies were attracted to the Point Edward – Canatara area, as recorded in Volume 4.
In addition, gravel was a factor in the decision to purchase the initial 53-acre parcel of today’s 200-acre Canatara Park, as described in Note 12.
Geomorphic features, therefore, often have a major impact on human history. The gravel deposit, spit and narrow river head all influenced the human activities that took place in the Sarnia –Point Edward area over the last 200 years. Obviously, if a large gravel deposit and multirecurved spit had not grown across the entrance to the St. Clair River, then the human history of the area would have been very different.