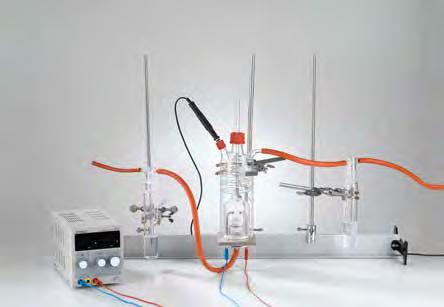
CHEMISTRY EXPERIMENTS
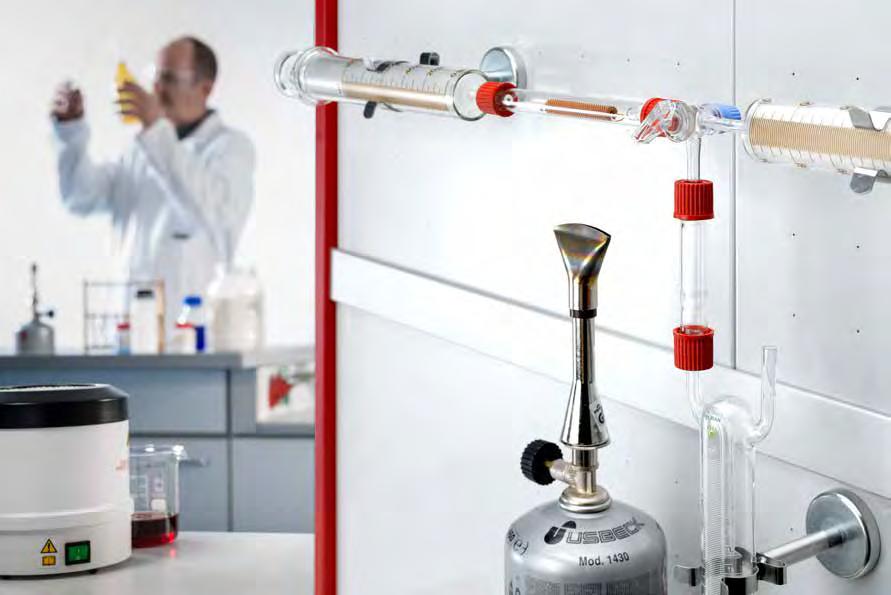
CHEMISTRY
FOR HIGHER EDUCATION UP TO UNIVERSITY LEVEL


FOR HIGHER EDUCATION UP TO UNIVERSITY LEVEL
Experiments are an indispensable part of education to combine theoretical knowledge with experimental learning sessions to ensure sustainable and successful learning.
More than 100 experiments from all areas of chemistry are highlighted in this catalogue. Our proven LEYBOLD quality guarantees durability and safety during the complete experiment setup and conduction. At LEYBOLD you will find a comprehensive experiment collection for students starting with fundamentals up to lab work in advanced chemistry at colleges and universities. The experiments can be adapted to the time requirements and student’s level of knowledge.
We will advise you personally and demonstrate our experiments for you.
Have fun experimenting!


Experimentation has always been a core competence of scientists and ensures to really understand scientifc phenomena.
The planning, carrying out and recording of experiments is an important element of a well-founded education in science. In order to reinforce newly acquired knowledge, experiments must be well matched to the theory. Investing in the practical training of your students, you equip them with important science skills that the labour market requires.
The LD DIDACTIC Group is a leading global manufacturer of high quality teaching and training systems. From the very beginning in 1850 we at LEYBOLD concentrate on how to make academic content understandable and tangible for students at different levels of education. Therefore we are proud that for generations our training and educational systems have made a significant contribution to knowledge transfer in natural sciences.
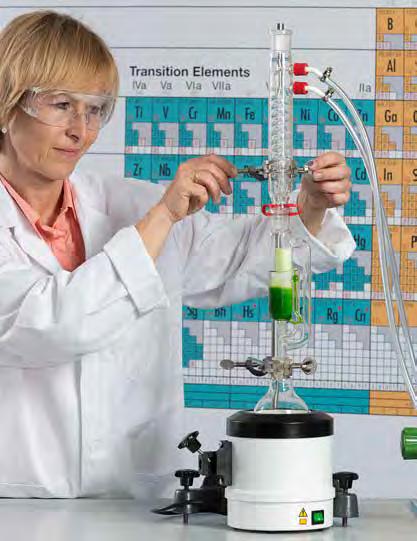
Benefit from 170 years of experience.
Explore more than 100 ready-to-use experiment set-ups. The collection matches international curricula and can be used for bachelor and master courses.
Get an individual, matching end-to-end solution including equipment, measuring devices, software and experiment instructions.
Realise successful and sustainable learning outcomes.
Rely on a future-ready solution for digital education.
Profit from premium quality developed and designed in Germany from a highly specialised development team with didactic background.
Ensure group-based student centred lab work with robust materials and easy-to-use, secure set-ups.
Bank on tried and tested experiments in top schools, colleges and universities worldwide.
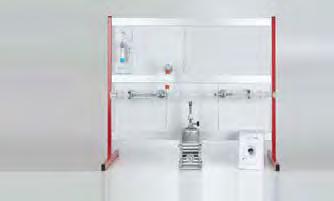
C1.7.2.2 ANALYSIS OF TRIPROTIC PHOSPHORIC ACID BY TITRATION
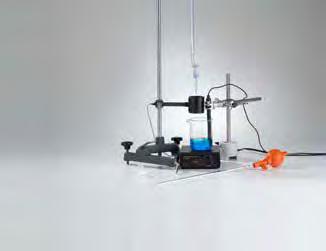
n Example of an automatic titration with a drop counter
n Determination of the first two equivalence points of phosphoric acid with precise measuring system CASSY
n Detection of the buffer effect of solutions (phosphate buffer)

1. 2. 3. 5. 4.
C2.3.2.1
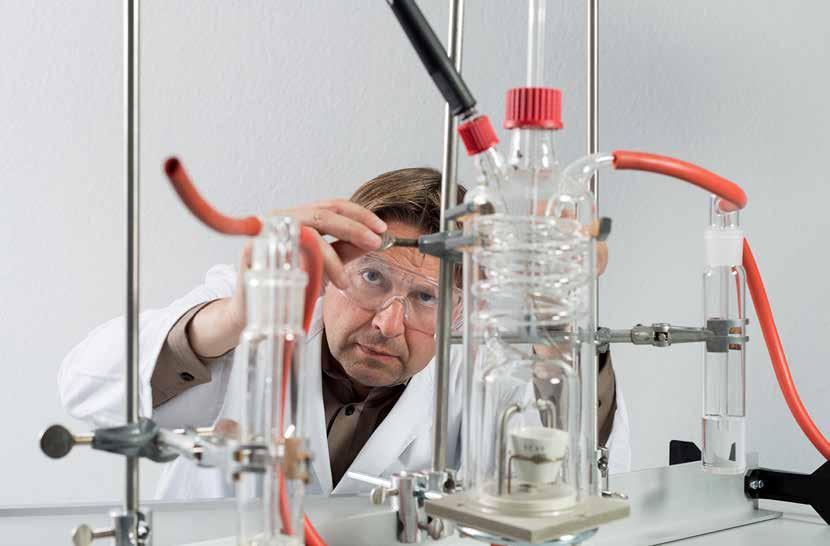
FRACTIONATED PETROLEUM DISTILLATION WITH A BUBBLE TRAY COLUMN
n Investigation and work with crude oil
n Operation and studying of a bubble tray column
n Combination of chemistry presentation system (CPS) and measurement system CASSY in one experiment
C3.2.1.2 GAS CHROMATOGRAPHY
n Studying the basic principles of gas chromatography
n Investigation of temperature effects in gas chromatography
n Evaluation with CASSY measuring system
C4.4.7.2
RECORDING THE CHARACTERISTIC CURVES OF A PEM FUEL CELL STACK
n Analysing alternative energy sources with the fuel cell
n Usage of a metal hydride stick as hydrogen source
n Recording of the characteristics of a fuel cell
C5.1.1.2 SYNTHESIS OF AMMONIA BY THE HABER-BOSCH PROCESS
n Classic experiment from historical chemistry; can also be performed in demonstration
n Understanding how difficult the invention of the HaberBosch process must have been
n Usage of CPS and the metal hydride stick
n Optimal work safety through stable, torsion-resistant construction
n Easy to set up thanks to pre-set assembly axes
n Can be adapted to fit the special requirements of each experimental situation
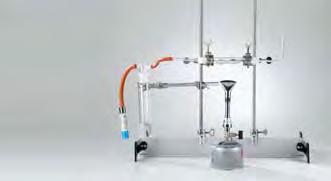
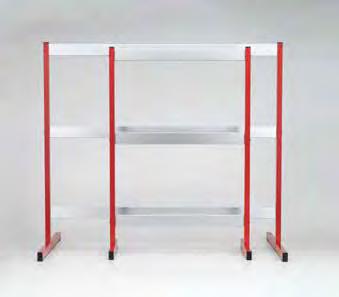
The base rail makes it easy to create large set-ups. The stability of the system comes from a solid T-profile made of anodised aluminium, which enables safe setups even with heavy components.
n Three different base rails are available for different sized set-ups (110 mm, 550 mm and 950 mm).
n Even large set-ups can be assembled on a single base rail.
n Completely assembled set-ups can be moved or stored in a cabinet.
n The base rails can also be used as an optical test bench.

SET-UP ON EXPERIMENT TRAY WITH INTEGRATED RAILS FOR EXPERIMENTS WITH LIQUIDS
SET-UP WITH BASE RAILS FOR PERFECTLY ALIGNED SET-UPS ON A SINGLE RAIL. 3.
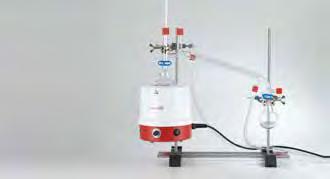
SET-UP ON STAND BASES MADE OF PLASTIC FOR A MAXIMUM OF FLEXIBILITY
The experiment tray is suitable for experiments using liquids.
n The experiment tray acts as a containment basin in case of chemical spills or glass breaks.
n The integrated rails save time when setting up experiments on the experiment tray.
n Fitting universal clamps onto the angular mounting rail makes it possible to install vertical stands.
n The stable, torsion-free construction also makes it possible to move completely assembled systems.
This stand system allows a maximum of flexibility when setting up experiments.
n The stand bases used are very lightweight.
n Thanks to double strut construction, the assembled stand system is almost completely torsion-free, which makes it possible to move apparatus before they have been completely set up.
n The stand can be disassembled to save space during storage.
n The stand is made of solid materials (ABS plastic and stainless steel)
n The stand materials are used in chemistry, biology and physics experiments.
n Clear experimental set-ups against a single-colour background
n Rapid set-up in just seconds
n Predefined distances eliminate the need for painstaking glassware adjustments
n Extremely rapid assembly or modification of the experiment set-ups
n GL screw connectors ensure secure, leak-tight connections between the individual modules – no more fused ground glass joints
n Glassware is mounted securely to the experimentation boards –this reduces the risk of breakage
n Safe and convenient storage in the cabinet with groove profiles
Installing the experimentation panels in the CPS frame.
FAST AND SAFE SET-UP BASED ON MODULES
1.
Install the experiment panels in the profile rails of the CPS frame.
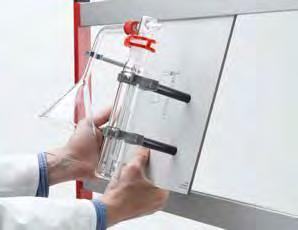
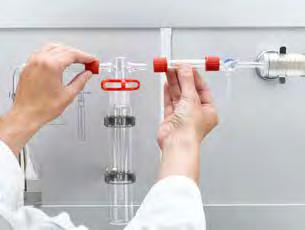

ASSEMBLY AND MODIFICATION OF THE EQUIPMENT IN JUST SECONDS WITH THE MAGNETIC HOLDERS
FAST INSTALLATION AND REMOVAL OF GLASSWARE USING FLEXIBLE CLIPS AND MAGNETIC HOLDERS
2.
3.
Push a GL connector cap (silicone seals are included) onto a glass component (e.g. three-way stopcock) and screw it onto the glass connector.
Slide the second experiment panel up to the first panel and screw the glass component with the attached GL connector cap (e.g. a gas syringe) onto the glass connector. The glassware fits together perfectly because the dimensions are standardised. This ensures secure, leak-tight connections between the glassware of the two experimentation panels.
n Accommodate any number of experimentation panels
n Fit inside every fume cupboard: 50 cm wide for narrow experiments 97 cm wide for wide experiments
ONLINE-PORTAL FOR ORGANISATION & MANAGEMENT OF EXPERIMENTS,

n Complete online portal
n Central organisation & management of experiments and devices
n No installation needed
n For all platforms, tablets, smartphones, laptops or PCs
n Video tutorials included
n Access at anytime from anywhere

n Direct overview of all available devices including quantity and storage location
n Save time searching for equipment
n Detailed information on every item
n Easy inventory of the complete collection
n LD devices and other manufacturers’ devices
n With bar code functionality
n Clear inventory management with borrowing and return function
n Access to the whole LD experiments catalog with all the relevant information for every experiment
n Find desired experiment quickly and reliably
n Set-up own experiment collection
n Easily expand the LD experiments
n Easily create own, new experiments
n Intelligently link devices
n Additional documents are where you need them for the experiment
n Collection of all kinds of documents like PDFs, videos or links to websites or apps; can be shared with students
n Purchased LD literature will be visible at related experiment
n Can be easily shared with all students
n Own experiment instructions can be included

n Manage all LD software and literature
n License codes are safely stored in the cloud, so they are not lost and can be used to install software on new hardware
n School/college/university license
n For any number of users
n Unlimited inventory of devices & experiments
n Numerous experiment instructions available
n Third party access to LeyLab is possible
n Collaborate with colleagues
n User administration with different access levels
n Share information with other lecturers from other institutes
n Enables a centralised organisation (e.g. by ministry) of many institutes and therefore a more efficient use of equipment, documents, etc.
n LeyLab contains all purchased LD experiment instructions, can be accessed from anywhere
n Time-saving preparation - all information is available directly on the experiment - literature, needed devices and location, extra information
n List of conductable experiments with existing devices can be downloaded
n Experiment instructions contain detailed accompanying information with experiment objectives, evaluation and further information
n Easy sharing of experiment instruction
n Free-of-charge online updates of experiment instructions in LeyLab


EXPERIMENTING
n Clearly structured worksheets with hints and illustrations
n Step-by-step guide to perform experiment and warning notices for safe experimentation
n Real example measurement results and diagrams for students own monitoring
n Share experiment instruction in LeyLab with all students
n Via QR code on-site or online classes
n Via link per e-mail, learning platforms or online classes
n Via PDF file per e-mail, learning platforms or online classes

Experiment descriptions from all areas of chemistry for advanced secondary level or for practical exercises in colleges and universities.
n Product key for online use in LeyLab
n Complete package of all experiment instructions within this catalogue
597 320 LIT: Chemistry leaflets, digital (product key)
http://www.leybold-shop.com/597320

Lab Docs Editor is an easy-to-use tool that revolutionises the editing of experiment instructions. Without any knowledge of HTML, the Lab Docs Editor allows the creation of digital and interactive experiment instructions.
Create instruction & assignments; integrate & adapt interactive diagrams and tables; add text and response fields
Insert images, vector graphics, hyperlink, etc.
Prepare and create material lists
Create formulas in LaTeX syntax



2.
FOR ALL MEASURING TASKS


For all teaching & training situations and requirements
Easy use
Fast & precise recording of data acquisition
Wide choice
Libraries for MATLAB and LabVIEW available free of charge
More than 50 CASSY sensors
Compatible across the CASSY system
Measurement data acquisition of more than 50 measured quantities
Automatic detection
Existing sensors can be integrated
3.
SOFTWARE
DATA ACQUISITION, ANALYSING & EVALUATION


Intuitively usable, all-round user-friendly software
Interpretation & evaluation of the measured values
Integrated experiment examples or own configurations
Saving and sharing of measured values
Whether you want to record the measured data from the experiments with or without a computer, or even want to include tablets in your digital class, CASSY has been developed for every need and can be flexibly expanded. You will always find the right combination of measuring device, sensor and measuring software for your specific requirements.
Detailed
https://www.ld-didactic.de/en/products-solutions/data-logging-and-measuring-technology/cassy-sensors.html
For each experiment, the recommended CASSY device and sensor is included in the experiment set-up for ideal data logging of the specific experiment.
With our selection of the measuring equipment for each single experiment we make sure that the devices perfectly meet the requirements of the measurement ranges and the measurement accuracy with no overpowering. While designing and testing every experiment set-up, we furthermore include factors such as technical conditions and ease of use for students into consideration.
If you want to acquire several experiments for your laboratory, we will be happy to advise you on how to optimise the measuring system. YOU GET EXPERIMENT SET-UPS THAT PERFECTLY WORK!


PROVEN SOFTWARE FOR RECORDING & EVALUATING MEASUREMENT DATA FROM ALL CASSY DEVICES
n Supports all CASSY devices and sensors
n Including measurement server for the distribution of live measurements, table and diagram as well as measurement files on tablets or smartphones, etc.
n One licence for use on any number of PCs in a school, college or university
n Automatic detection and display of all CASSYs sensors and sensor boxes
n Automatic loading of typical experiment parameters
n Operable experiment examples included
n Manual or automatic recording of measured values
n Measurement data can be displayed in the form of analog/digital instruments, tables and/or graphs (also simultaneously, with user-definable axis assignment)
n Powerful evaluation functions including various fits (straight line, parabola, hyperbola, exponential function, free fitting), integrals, diagram labelling, calculation of user-definable formulas, differentiation, integration, Fourier transforms
n Using a QR code, students can follow measurement directly on their smartphone/tablet and then evaluate the measured data

CHARGING
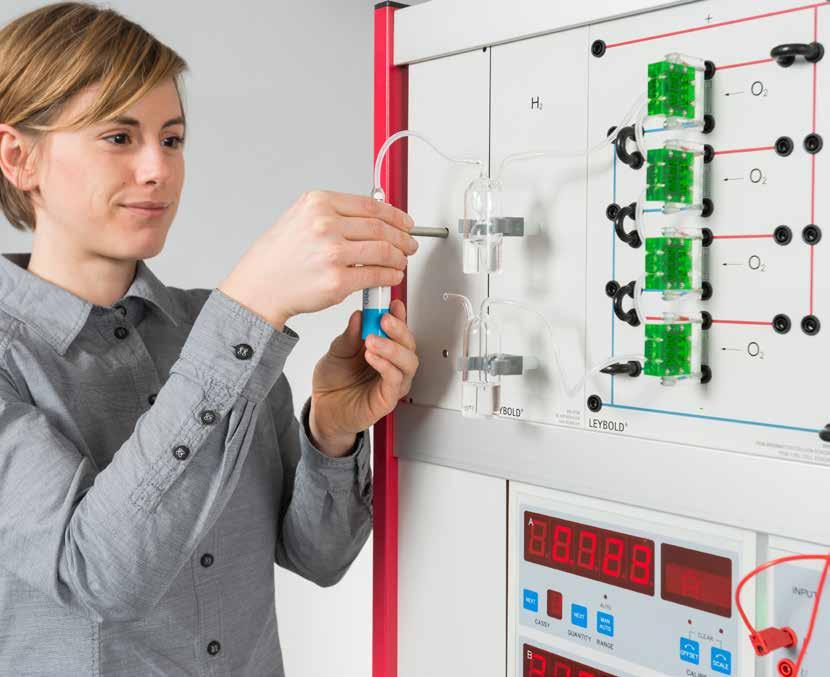
n PEM fuel cell stack consisting of four individual cells which can be quickly connected in series or in parallel
n Clear layout makes the experiments simple to perform and easy to understand
n In combination with the electrical load module: simple recording of characteristic curves and measurement of efficiency factors
n Hydrogen from the HydroStik PRO: no gas bottle needed
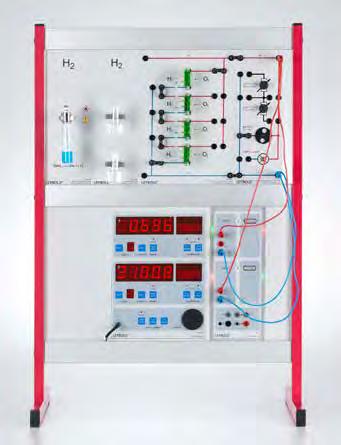
Recording of characteristic curves using Sensor-CASSY 2 and CASSY Display (no computer necessary).
THE EASY WAY TO PRODUCE ALL THE H2 YOU NEED RIGHT FROM THE WALL SOCKET –AND SAVE SPACE AT THE SAME TIME!
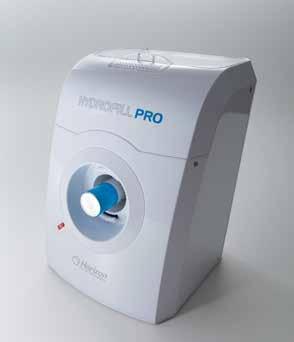
The HydroFill PRO (666 4798) supplies hydrogen through the electrolysis of distilled water. Only a wall socket is required. The hydrogen is stored directly in the HydroStik PRO (666 4796) in the form of a metal hydride. In this way, experiments can be performed with hydrogen without the use of gas bottles, e.g. for experiments with fuels cells.

Charging the HydroStik PRO –as easy as a mobile phone:
1. Place it in the HydroFill PRO charging station
2. Charge it with hydrogen for 4 to 6 hours.
3. Use the hydrogen in experiments.
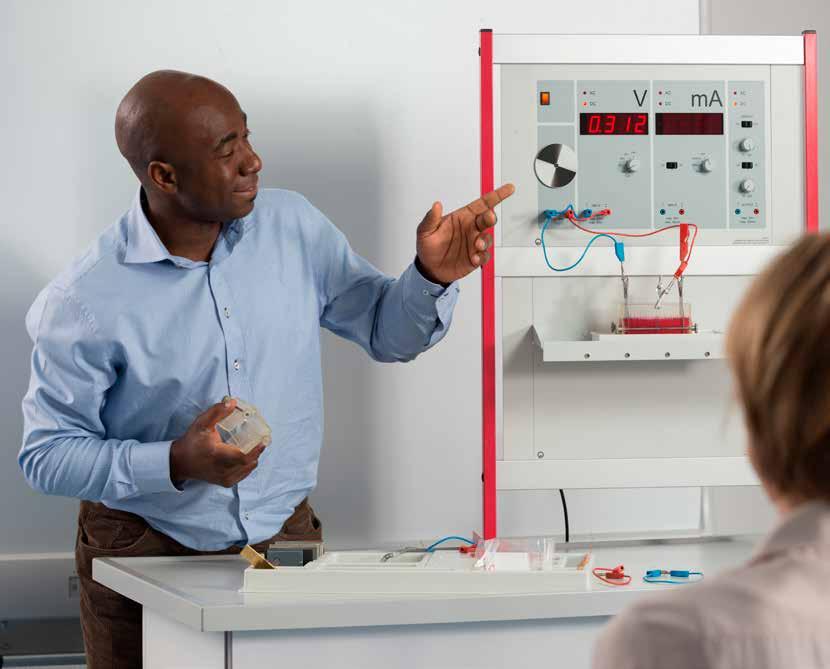
The electrochemistry demonstration system: ideal for performing electrochemical experiments.
n The demonstration system fulfils 3 functions:
n It includes two separate instruments to measure voltage and current.
n It operates as a power supply for direct and alternating current.
n A small integrated motor with segmented disc serves as a power indicator
n Its large, clear displays are easy to read and allow the students to focus on conducting the experiment.
n With the accessory set and experiment instructions, up to 40 experiments can be carried out.
n Topics
n Conductivity of solids and liquids
n Electrochemical series of metals and non-metals
n Corrosion and corrosion protection
n Faraday’s laws
n Galvanic cells
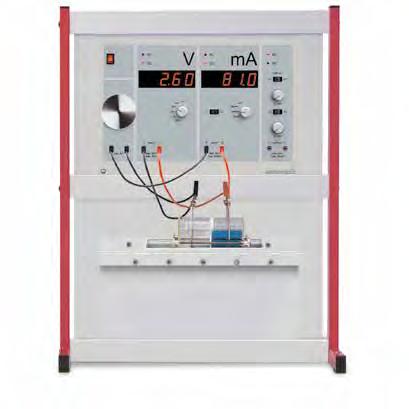
The electrochemical demonstration system can be mounted in a CPS frame. All experiments can then be carried out on the experiment table, which is also mounted in the frame.
Electrochemistry demonstration, CPS, Equipment set 664 4071P
Electrochemistry demonstration unit, CPS664 4071
Electrochemistry accessory set 664 401
Panel frame C50, two-level, for CPS 666 425
Table for electrochemistry, CPS 666 472

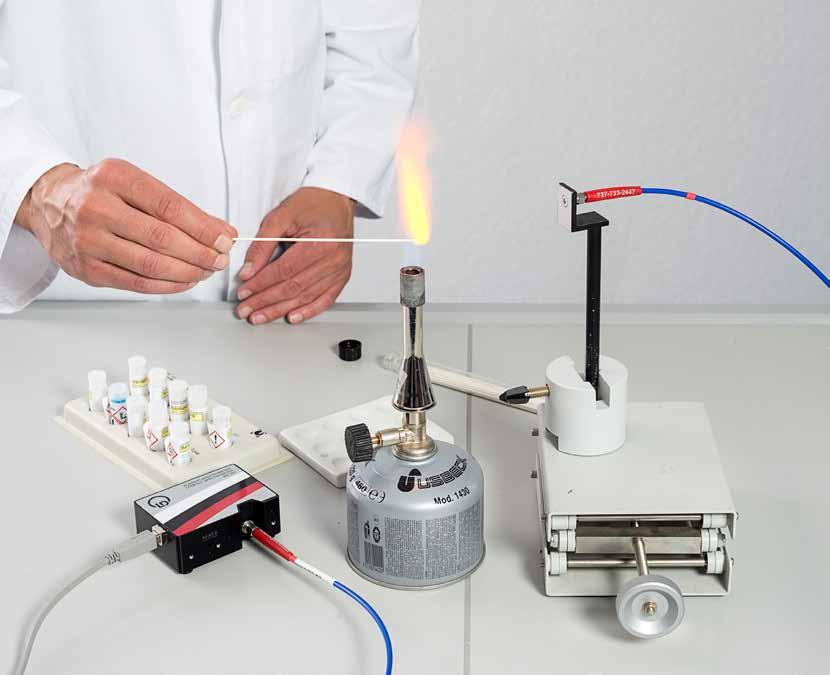
In combination with the fibre optic cable, the spectrometer is particularly well-suited for analysing flame colourations.
n Small device with USB connection
n SpectraLab software: displays spectra while taking measurements
n Simultaneous measurement of all wavelengths
n Cuvette holder with integrated lamp (optional)
n Example experiments
n Flame colouration
n UV/VIS spectra of dyes
n Fluorescence spectra
n Determination of pKa values of indicators
n Variants for VIS or UV/VIS measurements

The cuvette holder also makes it possible to carry out photometric measurements on small quantities.


CONSULTING

LECTURER ACADEMY TRAINING

DETAILED INDIVIDUAL OFFER
AFTER SALES SUPPORT

INSTALLATION AND TRAINING ON SITE
FINANCE
PRODUCTION AND QUALITY CONTROL
TRAINING PROGRAMS TO ENSURE
SUSTAINABLE FACILITIES AND RESOURCES
Specialised training programs for teachers, lecturers and trainers
Methodological, didactic and technical training
Content and training focus is chosen on requirements
Practical work is central point, incl. whole process to perform experiments
Organisation & maintenance of equipment
Seminar has external parts at well-known schools, universities and institutions
Insights into German didactic standards and trends
Comprehensive guides and seminar documentation
Possibility to achieve qualification to train other teachers, lecturers or trainers
The university “Universidad Autónoma del Estado de Hidalgo” achieved a higher educational level for teachers in implementing experiments in classes through practical lab work and theory. They also obtained sustainable know-how in lab management and the all related work flow processes.


The seminar took place in the labs at LEYBOLD, the University of Cologne and an extracurricular place of learning.
Section
Subsection
Experiment set-up
Measurement option
With computer-assisted experiments, the recommended basic unit is shown
Topic
Experiment
Each experiment is identified by a C and a four-digit number.
Short description of the experiment
Experiment results
Equipment list

Determination
664
C1.1.1.1
Determination of the relative atomic mass of metals
The realisation that chemical reactions depend not on the mass of a substance but on the number of atoms marks the transition from alchemy to chemistry as a science. In that way, the molar mass can be used to carry out reactions with the right quantity of material.
In experiment C1.1.1.1, the molar mass of some base metals will be determined. In order to do so, those metals - magnesium, for example - will be reacted with acids.
Different metals of the same weight produce different quantities of hydrogen. When using the same quantity of material, the same quantities of hydrogen are produced. This way, the relative molar mass of the respective metals can be determined.
666
674

C1.1.1
C1.1.1.2
Determination of the molar mass of gases
At constant pressure and constant temperature, any gas occupies the same volume regardless of the type of atom or the composition. So if we know the volume, pressure and temperature, we can then determine the molar mass of gases. The measurement is conducted in experiment C1.1.1.2 with a glass sphere for weighing gases.
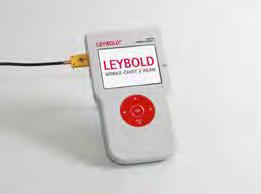
C1.1.2.1
Melting ice, boiling water
There are three states of matter: solid, liquid and gas. Solid materials have a stabile outer shape and a definite volume. Liquids have a definite volume but no longer have a solid shape. Gaseous materials have neither a shape nor a volume: they fill up any available space.
At constant pressure, materials transition from one state of matter to the next at a characteristic temperature. Those temperatures are known and listed as the melting point and boiling point.
Experiment C1.1.2.1 examines the behaviour of water at different temperatures. To that end, ice (solid water) is slowly heated until it melts and then evaporates. At the boiling point and the melting point, the temperature does not change until the substance has transitioned completely to the other state. The boiling point and melting point are easy to determine in this way.

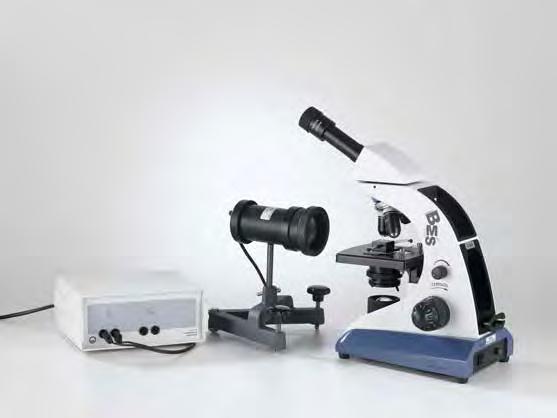
C1.1.3.1
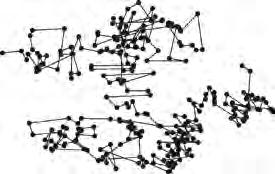
Brownian motion of smoke particles
Matter is everything that takes up space and has mass. We distinguish between pure substances and mixtures. Mixtures can be homogeneous or heterogeneous. Pure substances are elements and are made up entirely of the same type of atom. Each atom consists of a core, the nucleus, and a shell, the electron shell. The speed and direction of a particle floating in a gas changes continuously. J. Perrin provided the explanation for this molecular motion, which was discovered by R. Brown: it is caused by the impacts of the gas molecules on the particle. The smaller the particle, the livelier the motion. It comprises a translational motion and a similarly changing rotation. In experiment C1.1.3.1, a microscope is used to observe the motion of smoke particles in air.
Estimation of the size of oil molecules (C1.1.3.2)
C1.1.3
C1.1.3.2
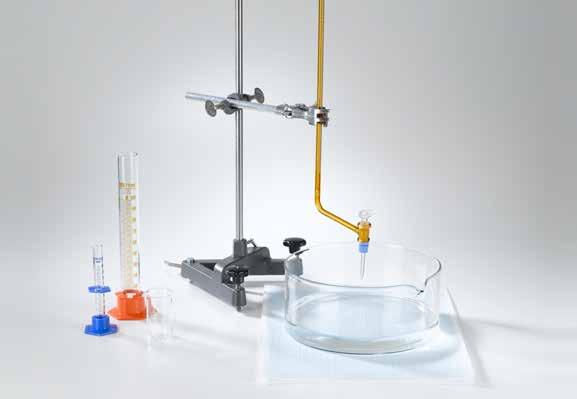
Estimation of the size of oil molecules
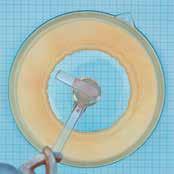
One of the important questions in atomic physics is the question of the size of the atom. The study of the size of molecules provides experimentally easier access on a manageable magnitude. Experiment C1.1.3.2 uses simple means to estimate the size of molecules from the size of a patch of oil floating on the surface of water.
the area A of the oil spot
C1.1.3.4
Analysis of Rutherford scattering MATERIAL PROPERTIES
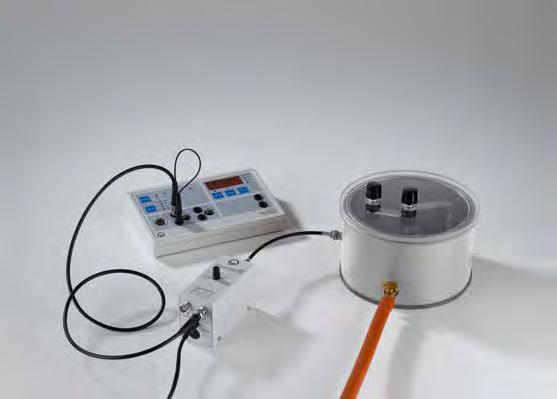
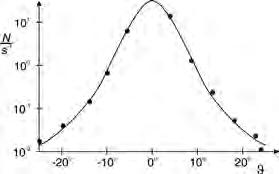
The fact that an atom is “mostly empty“ was confirmed by Rutherford, Geiger and Marsden in a momentous experiment. They let a parallel bundle of a-particles fall on a very thin sheet of gold foil. In so doing they found that the vast majority of a-particles pass through the gold foil almost without any deflection at all and only very few are deflected to any large degree. They concluded from this that atoms comprise a nearly massless, extended shell and a massive core concentrated practically at a point.
Experiment C1.1.3.4, carries out an observation with an Am-241-preparation in a vacuum chamber. Depending on the scatter angle J the scatter rate N (J) of the a-particles is measured with a Geiger-Müller tube.
Determination of the elementary electric charge according to Millikan and proof of charge quantisation (C1.1.3.5)
C1.1.3.5
Determination of the elementary electric charge according to Millikan and proof of charge quantisation
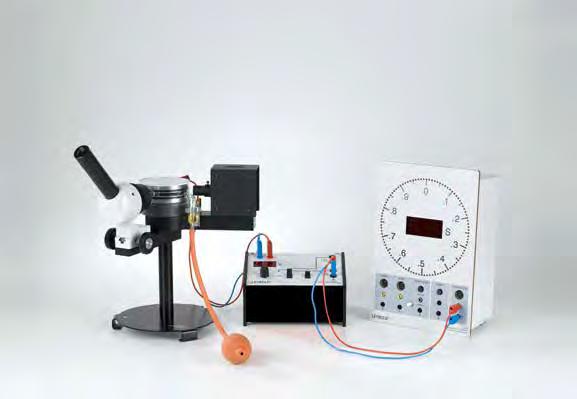
With his famous oil-drop method, R. A. Millikan succeeded in demonstrating the quantum nature of minute amounts of electricity in 1910. He caused charged oil droplets to be suspended in the vertical electric field of a plate capacitor and, on the basis of the radius r and the electric field E , determined the charge q of a suspended droplet:
He discovered that q only occurs as a whole multiple of an electron charge e
In experiment C1.1.3.5, the electric field
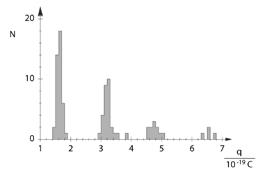
The histogram reveals the qantum nature of the change
is calculated from the voltage U on the plate condenser at which the oil droplet is observed floating straight. To determine the radius, the constant sinking velocity v 1 of the droplet is then measured with the electric field switched off. From the equilibrium between the force of gravity and Stokes‘ drag, it follows that

C1.1.3.6
Franck-Hertz experiment
In 1914, J. Franck and G. Hertz reported observing discontinuous energy emission when electrons passed through mercury vapor, and the resulting emission of the ultraviolet spectral line (l = 254 nm) of mercury. A few months later, Niels Bohr recognised that their experiment supported his model of the atom. The deexcitation of neon atoms can occur indirectly via intermediate states, with the emission of photons. In this process, the photons have a wavelength in the visible range between red and green. The emitted light can thus be observed with the naked eye. Between the grids G1 and G2 reddish luminous layers, clearly separated from one another, can be observed, and their number increases with increasing voltage. These are zones of high excitation density, in which the excited atoms emit spectral light.

C1.1.3.7
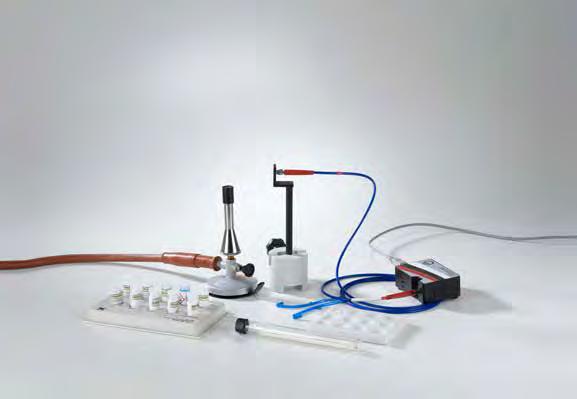
Recording emission spectra of a flame test
656
665 953Dropping
674 6950 Hydrochloric acid, 0.1 mol/l, 500 ml
additionally required: PC with Windows XP/Vista/7/8/10 (x86 or x64)
Spectral lines occur when electrons transition from higher to lower energy levels in the shell of excited atoms. The wavelength of the light emitted during the transition is determined by that energy differential: ν= EE h h
:Planck'sconstant
Because the energies E 1 and E 2 can only take on discrete values, only photons with discrete frequencies are emitted or absorbed. Taken all together, the frequencies which occur are referred to as the spectrum of the atom. The arrangement of the spectral lines is characteristic for the element concerned.
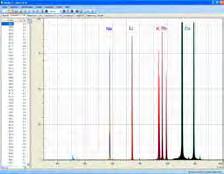
Experiment C1.1.3.7 investigates flame colourations of metal salts. A compact spectrometer with a USB link to the computer makes it easy to record such transient events and to analyse the emission lines which are produced. Unlike in classical observation with the eye, lines in the IR range can also be identified, e.g. for potassium.

Conservation of mass in the reaction of marble with acid (C1.2.1.1)
664
C1.2.1
C1.2.1.1
Conservation of mass in the reaction of marble with acid
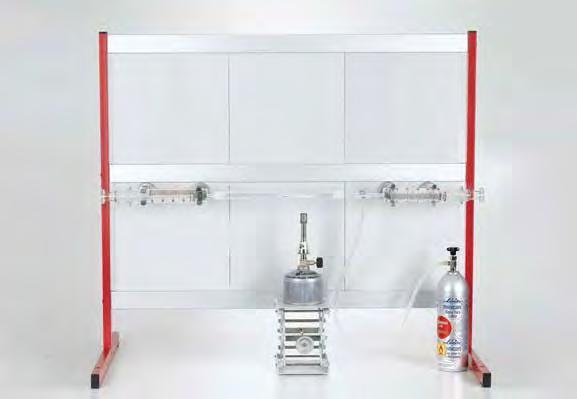
The law of conservation of mass was formulated in 1789 by Antoine Laurent de Lavoisier: For a chemical reaction in a closed system, the sum of the masses of the starting materials is equal to the sum of the masses of the products.
Experiment C1.2.1.1 demonstrates that in a chemical reaction the total mass of the substances involved in the reaction remains unchanged. In the experiment, hydrochloric acid is pipetted into a test tube. Pieces of marble are introduced into a balloon. The reaction is started by tipping the pieces of marble into the acid. Although bubbles form, it can be observed that no mass is lost.
667
362 04Overflow
602
674
C1.2.2
C1.2.2.1
Synthesis of magnesium oxide
The law of definite proportions is one of the laws of proportion and a fundamental principle in chemistry. It is the basis for the concept of the mol, and stoichiometry would also be unthinkable without this law. Two substances always react with one another in equal (= constant) proportions, which means that there are fixed combination relationships. Developed in part through longsome analyses carried out by Berzelius at the beginning of the 19th century, this law made it possible to write reaction equations for the first time.
In experiment C1.2.2.1, the law of definite proportions is confirmed by the synthesis of magnesium oxide. Magnesium reacts with oxygen in a luminous reaction to magnesium oxide.
2Mg+O2Mg2O
The starting material magnesium and the product magnesium oxide can be weighed. In addition, the quantity of oxygen consumed is determined by measuring the volume. The results can be used to determine the mass ratio of oxygen to magnesium. Repeated tests can then show that it remains constant.

Analysis of copper(I) oxide and copper(II) oxide (C1.2.3.1_p)
666
C1.2.3
C1.2.3.1_p
Analysis of copper(I) oxide and copper(II) oxide
The law of multiple proportions states that the ratio of the masses of two elements which combine to form different chemical compounds is always a whole number.
Experiment C1.2.3.1 determines the mass ratios of copper and oxygen in copper(I) oxide and copper(II) oxide. In these compounds, the elements copper and oxygen are combined with one another in different mass ratios. Those different ratios can be determined by quantitative reduction with hydrogen.

Electrolytic water decomposition according to Hoffmann (C1.3.1.1_p)

C1.3.1
C1.3.1.1_p
Electrolytic water decomposition according to Hoffmann
C1.3.1.1_s
Electrolytic water decomposition according to Hoffmann using stand material
Cat. No. Description
666 446 Electrolysis apparatus, CPS 1
666 425 Panel frame C50, two-level, for CPS 1
521 546 DC Power Supply 0...16 V/0...5 A 11
501 46 Connecting leads 19 A, 100 cm, red/blue, pair11
602 953Measuring cylinder, Boro 3.3, 100 ml, glass base11
665 008 Funnel, PP, 50 mm diam. 11
602 004Test tubes, DURAN, 20 x 180 mm, set of 100 11
656 017 Teclu burner, universal 11
607 020 Safety gas hose with clamp 0.5 m 11
666 731 Gas igniter, mechanical 11
661 083 Wooden turnings, 10 pieces 11
674 7920 Sulfuric acid, diluted, approx. 2 N (= 10 %), 500 ml11
664 350 Water electrolysis apparatus 1
Water consists of hydrogen and oxygen, which are bound to one another in the ratio of 2:1. So the formula is H2O. This formula can be derived from decomposition of water by electrolysis. In experiment C1.3.1.1, water is analyzed by electrolysis in the Hoffmann voltameter. The transformation of electrical energy into chemical energy is demonstrated at the same time. First the gases generated - hydrogen and oxygen - can be determined qualitatively. Quantitative assessment of the quantities of gas generated can then be used to derive the chemical formula for the compound water.

Qualitative water synthesis (C1.3.2.1_p)
375
664
665
664
665
666 4661
675
671 8410
300
C1.3.2.1_p
Qualitative water synthesis
C1.3.2.1_s
Qualitative water synthesis using stand material
Cat. No. Description
667 183 Rubber tubing, 1 m x 8 mm diam., DIN 12865
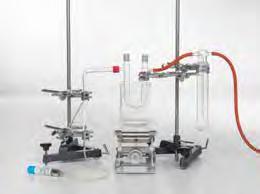
Water is available in large quantities on Earth, but it can also be synthesised in the laboratory. The synthesis of water is a complementary experiment to the electrolytic decomposition of water. In experiment C1.3.2.1, hydrogen is burned. The resulting hydrogen oxide is collected in a U-tube. White copper(II)-sulfate or water detection test paper is used to prove that it is water. 2H+O2HO

C1.3.3.1
Thermal anomaly of water
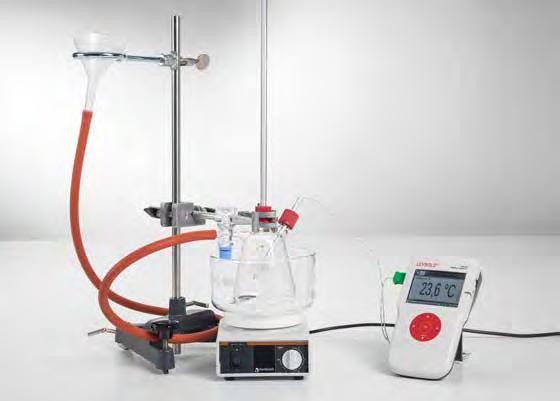
Water is necessary for life. This is because of the special properties of water as compared with other substances. Water is one of the few compounds which exists in nature in all three states of matter: solid (ice), liquid (water) and gas (water vapour).
Water has a density anomaly: up to a temperature of 4 °C, water has a negative coefficient of expansion , i.e. it shrinks when warmed. After passing through zero at 4 °C, the coefficient of expansion becomes positive. So the density of water reaches a maximum at 4 °C.
In experiment C1.3.3.1, the density maximum of water is proven by measuring its expansion in a vessel with a riser. Starting from room temperature, the complete setup is cooled down in an ice water bath to about 1 °C under constant stirring, or after cooling in a freezer, it is warmed slowly by the ambient temperature. The level h, in a riser with a cross-sectional area A is measured as a function of the water temperature J. Because the change in volume relative to the total volume V 0 is small, the result obtained for density is
The ion product of water (C1.3.3.2)
C1.3.3
C1.3.3.2
The ion product of water
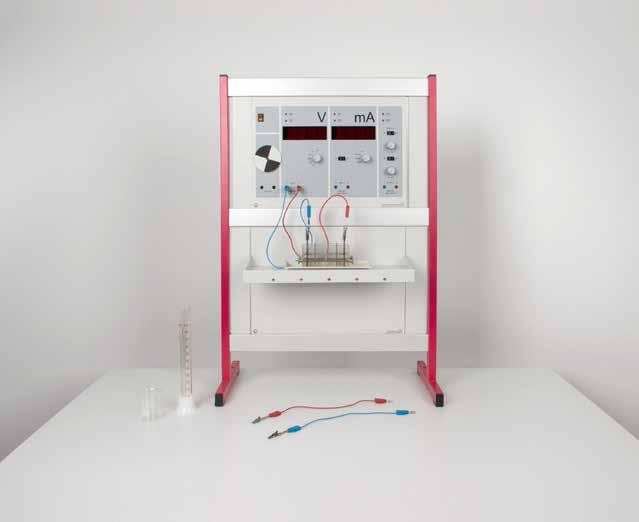
The conductivity of pure water is not zero, although there are no charged ions solved. This contradiction can be explained with the autoprotolysis of water. Two molecules of water react in an equilibrium reaction to a hydroxide and an hydronium ion. These charged particles lead to a measureable conductivity. The ion product of water describes this equilibrium reation. The pH scale is based on it. In this experiment, the ion product of water is determined by setting up a galvanic element and using the Nernst equation.
Determination of the oxygen content of air (C1.4.1.1)
664
664
665
665
C1.4.1
C1.4.1.1
Determination of the oxygen content of air
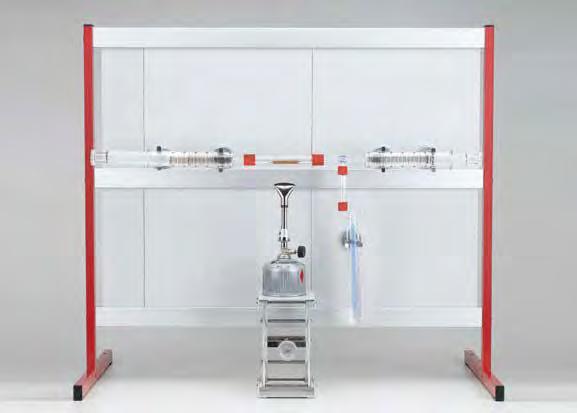
Air is a mixture of different gases. It essentially comprises nitrogen (78 %), oxygen (21 %), noble gases (1 %) and carbon dioxide (0.04 %). It also contains trace quantities of other gases. The component which is vital to us, oxygen, also participates in important reactions, e.g. in combustion and corrosion.
Experiment C1.4.1.1 determines the oxygen content of air. The determination of the oxygen content uses the fact that certain substances can react quantitatively with oxygen to form oxides. For this purpose, the oxygen of a defined volume of air is reacted with copper and removed from the gas space as copper oxide.
2Cu+O2CuO 2 →
From the resulting reduction in volume, the oxygen content of the original air can be easily calculated in per cent by volume. The gas remaining in the apparatus can be studied further: One can find out that it does not sustain combustion.
Determination of the density of air (C1.4.1.2)
C1.4.1
C1.4.1.2
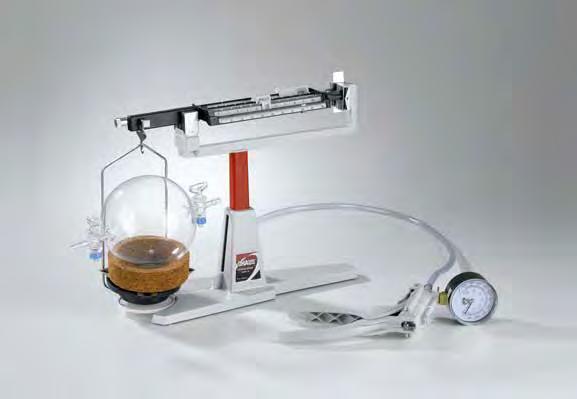
Determination of the density of air
In experiment C1.4.1.2, a sphere of known volume with two stopcocks is used to determine the density of air. The mass of the enclosed air is determined from the measured difference between the total weight of the sphere filled with air and the empty weight of the evacuated sphere.

Production of gases with a Kipp’s apparatus, CPS version (C1.4.2.1_p) Cat.
665
665
674
C1.4.2
C1.4.2.1_p
Production of gases with a Kipp’s apparatus, CPS version
C1.4.2.1_ s
Production of gases with a Kipp’s apparatus
By reacting different chemicals, in most cases a liquid and a solid material, many different gases can be generated. The gases generated can then be used and studied in other experiments. To purify the gases generated, wash bottles with H2SO4 as a desiccator, for example, can be added downstream. Appropriate reagents can also be used to demonstrate assay reactions.
Experiment C1.4.2.1 uses the gas generator according to Maey, the principle of which corresponds to that of the Kipp’s apparatus for the production of hydrogen: zinc granules are added to a setup with frits. Diluted hydrochloric acid is added to the flask, which passes through the frits to reach the zinc. Hydrogen is generated there.
Other gases which can be generated in a similar way include: CO2, H2S and NO.

C1.4.2
C1.4.2.2
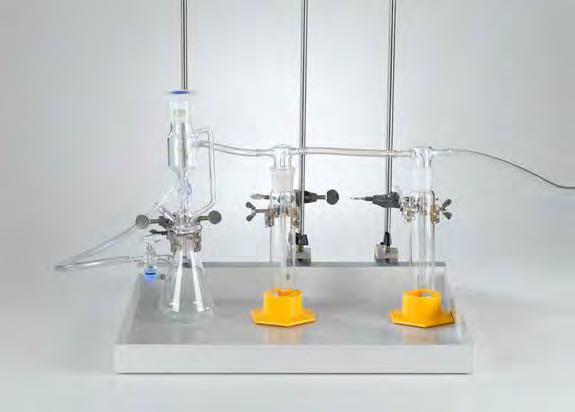
Production of gases with a dropping funnel
In experiment C1.4.2.2, a dropping funnel is used and the solid is introduced into the flask. The reaction is controlled here by adding drops of a liquid and the gas can be drawn off via the stopcock on the side. In the production of oxygen, for example, hydrogen peroxide is dripped onto the catalyst manganese dioxide and decomposes into water and oxygen.
This variant can be used to produce several other gases, including: O2, NH3, Cl2, HCl, SO2, NO2, CO, C 2H2 and CH4
C1.4.3
C1.4.3.1
Hydrogen as a reducing agent
664
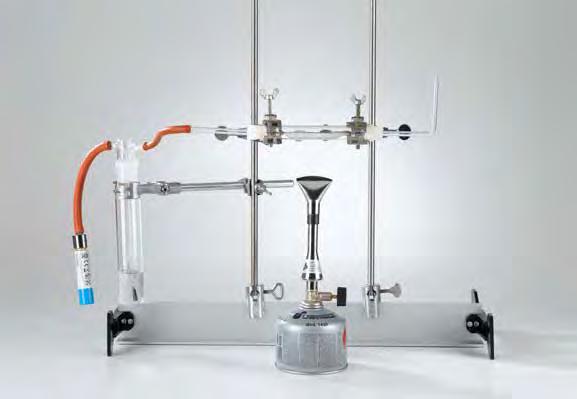
Gases, too, can participate in chemical reactions. In most cases they are added in surplus and their properties enable complete penetration of the reaction space. Reactions with gases are easy to follow because the volume at constant pressure allows a simple determination of the quantity of material. In experiment C1.4.3.1, copper oxide is reduced with hydrogen to form elementary copper. Hydrogen is a good reducing agent. Its ability to react applies not only to free oxygen but also to oxygen compounds. The metal is formed in this way when transforming a metal oxide (as in this experiment) with hydrogen.
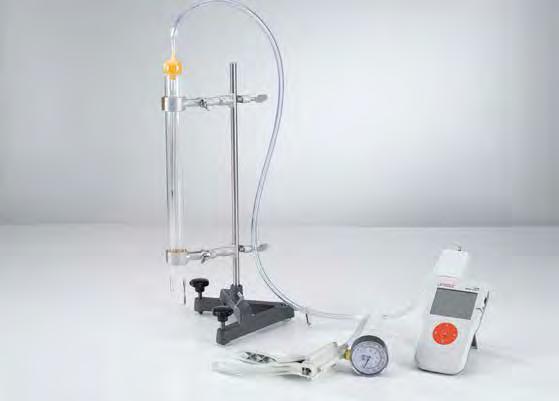
Pressure-dependency of the volume of a gas at a constant temperature (Boyle-Mariotte’s law) (C1.4.4.1)

C1.4.4
C1.4.4.1
Pressure-dependency of the volume of a gas at a constant temperature (Boyle-Mariotte’s law)
In experiment C1.4.4.1 the Boyle-Mariotte law is confirmed by means of a gas thermometer. An air column is maintained at constant room temperature T. At an external pressure p 0 , it has a volume of V0 bounded by a mercury stopper. The pressure p in the air column is then reduced by evacuating air at the open end, and the increased volume V of the air column is determined for different pressure values p . The evaluation confirms the relationship p V = p 0 V0 = const. (Boyle-Mariotte law).

Temperature-dependency of the volume of a gas at a constant pressure (Gay-Lussac’s law) (C1.4.4.2)

GAS LAWS
C1.4.4.2
Temperature-dependency of the volume of a gas at a constant pressure (Gay-Lussac’s law)
In experiment C1.4.4.2 Gay-Lussac’s law is confirmed by means of a gas thermometer. The gas thermometer is placed in a water bath of a specific temperature which is allowed to gradually cool. The open end is subject to the ambient air pressure, so that the pressure in the air column is constant. The volume V of the air column is measured as a function of the temperature T of the water bath. The evaluation confirms the relationship V ∝ T for p = const. (Gay-Lussac’s law).
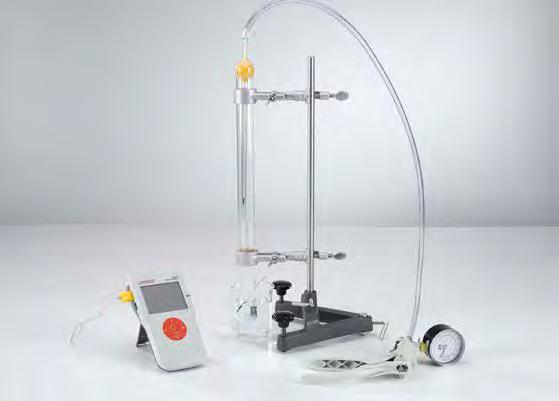
Temperature-dependency of the pressure of a gas at a constant volume (Amontons’ law) (C1.4.4.3)

C1.4.4
GAS LAWS
C1.4.4.3
Temperature-dependency of the pressure of a gas at a constant volume (Amontons’ law)
In experiment C1.4.4.3 Amontons’ law is confirmed by means of a gas thermometer. The gas thermometer is placed in a water bath of a specific temperature which is allowed to gradually cool. Meanwhile the pressure p in the air column is constantly reduced by evacuating the air at the open end. The volume V of the air column remains constant as the temperature drops. This experiment measures the pressure p of the air column as a function of the temperature T of the water bath. The evaluation confirms the relationship p ∝ T for V = const. (Amonton’s law).

C1.5.1.1
Extraction of copper from copper oxide

Most of the ores found in nature are oxides and sulphides: e.g. magnetite (lodestone, Fe3O4), haematite (red iron oxide, Fe2O3), cassiterite (SnO2), tenorite (CuO), cuprite (Cu2O), pyrite (fool’s gold, FeS2) and sphalerite (ZnS). Reduction can be used to extract metals from oxide ores and from the metal oxides formed during the metallurgical process known as “roasting”.
In experiment C1.5.1.1, charcoal is the reducing agent to reduce tenorite (CuO) to elementary copper. When heated, the mixture of tenorite and pulverised charcoal produces red copper and carbon dioxide. A saturated calcium hydroxide solution is used to verify the presence of the carbon dioxide.

for iron
C1.5.3.1
Conditions for iron corrosion
The term “corrosion” refers to the slow oxidation of metal surfaces under the influence of the surrounding medium. Corrosion (rust) destroys large quantities of iron and steel. Corrosion protection (rust protection) is an extremely important topic in the metal industry.
Experiment C1.5.3.1 examines the conditions under which ferrous metals corrode. Wads of iron wool are subjected to different conditions. In one test tube, boiled water is poured over the iron wool, in the second test tube the iron wool is left dry, and the third test tube is rinsed with tap water so that droplets remain in the tube. This test tube is connected to an immersion tube manometer filled with coloured water. The changes in the iron wool and the changes in the immersion tube manometer are observed. It can be seen that under the simultaneous action of water and oxygen on iron, corrosion forms and a measurable negative pressure builds up in the apparatus.

Experiments with the corrosion set (C1.5.3.2)
C1.5.3.2
Experiments with the corrosion set
Experiment C1.5.3.2 demonstrates that every type of corrosion has its origin in chemical and electrochemical processes. Different metals generate an electric voltage when they are immersed in an electrically conductive medium at the same time, such as diluted sulfuric acid. The further apart the metals are in the electrochemical series the higher that voltage.

C1.5.3
C1.5.3.3
Electrochemical
In experiment C1.5.3.3, the cathodic protection anode technique is used to prevent electrochemical corrosion. The method is based on the fact that the speed of electrochemical corrosion processes depends on the electrode potential. If that electrode potential is shifted externally, the corrosion can be inhibited or greatly restricted. In the experiment, a zinc electrode is used as a cathodic protection anode. The metal to be protected is conductively connected to a less noble metal; a corrosion element is formed in which the less noble metal (the cathodic protection anode) dissolves while the nobler metal remains protected.

C1.5.3.4
Iron can be protected from corrosion using chemical processes. Then, the metal surface is treated chemically in a way, that a layer is formed that saves the metal. Especially passivation and phosphatation can be mentioned here.
In this experiment iron nails are corroded. The corrosion of iron is detected using Prussion blue. Treated and untreated nails are compared.
674


C1.6.2.1
Change of modification of sulphur
The oxygen family is the 6th main group in the periodic table. Its elements are also known as “chalcogens”, i.e. ore generators. They include the non-metals oxygen and sulphur, the metalloids selenium and tellurium, and the metal polonium.
The elements of this group must acquire two electrons in order to achieve noble gas configuration. Alternatively, they can form two covalent bonds.
Experiment C1.6.2.1 takes a closer look at sulphur. Sulphur has the ability to form chains and rings, and that makes it the element with the most modifications. Those modification changes are studied by differential thermal analysis. For this purpose, a sample of sulphur is heated and its temperature is measured. During the modification changes, the temperature of the sample no longer increases as compared with a control substance. There is no measurable temperature increase until the modification change is complete.

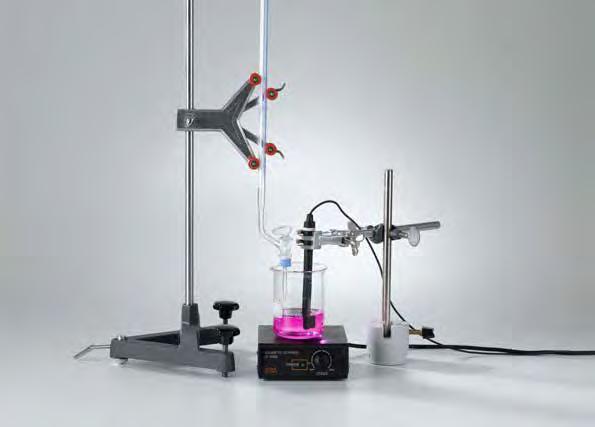
Determination of acidity (pKa value) by titration (C1.7.2.1)
674
Cat. No. Description
ACID STRENGTHS AND pH VALUES
C1.7.2.1
Determination of acidity (pKa value) by titration

675 3400 Water, pure, 1 l 1 additionally required: PC with Windows 7 or higher with WIFI or USB connection 1
In experiment C1.7.2.1, the acidity (pK a value) of acetic acid is determined. Between an acid HA and its base A- the following equilibrium reaction takes place in an aqueous solution : HA +H O HO +A 23 +-
According to the law of mass action, the equilibrium position is described by the equilibrium constant K a: KK KH O a = ⋅ =⋅ = [HO][A] [HA][HO] [HO][A] [HA] 3 +2 3 +;[] 2
By analogy to the pH value, the pK a value is given as the negative base 10 logarithm of the numerical value of K a pK a =-lg[HO]×[A] [HA] 3 +-
The lower the value of pKa, the higher the acidity. The pKa value is numerically equal to the pH value of a solution when the protonated and non-protonated forms are present in equal concentration.

C1.7.2
ACID STRENGTHS AND pH VALUES
C1.7.2.2
Analysis of triprotic phosphoric acid by titration
with Windows XP/Vista/7/8/10 (x86 or x64)
* additionally recommended
Phosphoric acid is a triprotic acid. When dissolved in water, it first gives up one proton and dissociates to dihydrogen phosphate, i.e. it reacts like a monoprotic acid (see formula 1). The addition of sodium hydroxide, e.g. during titration, first leads to complete dissociation of the phosphoric acid into dihydrogen phosphate.
The second protolysis, i.e. the reaction to hydrogen phosphate (see formula 2), occurs only after a high pH value has been reached, approx. pH 9. The third protolysis requires a considerably higher pH value (see formula 3). In experiment C1.7.2.2, the first two protolysis steps of phosphoric acid are determined in an automatic titration.


C1.7.3.1
Determination of the enthalpy of solution of salts

Salts are chemical compounds made of ions. The positively charged cation is often a metal and the negatively charged anion is often a non-metal, as in the case of sodium chloride (table salt). In polar solvents such as water, salts dissolve forming hydrated ions. When a salt is dissolved in water, it can heat the solution up or cool it down. Accordingly, the enthalpy of solution is either negative (heat generating) or positive (heat absorbing). For the dissolution of the crystal, the so-called lattice energy must be applied. In hydration, on the other hand, energy is released. Enthalpies of solution cannot be calculated with certainty, but rather must be determined experimentally.
Experiment C1.7.3.1 determines the enthalpy of solution of various chloride salts. For this purpose, the salts LiCl, KCl and NaCl are dissolved in the transparent demonstration Dewar flask. The enthalpy of solution can then be calculated from the tem-
change.


of
C1.7.3
C1.7.3.2
Determination of the solubility product of silver halides
In experiment C1.7.3.2, the solubility product of silver salts is determined. The solubility product is the product of the concentrations of cations and anions of an electrolyte in a saturated aqueous solution at constant temperature. In a saturated salt solution, a chemical equilibrium exists between the solid and the solution, i.e. just as many ions leave the ion lattice per unit time as enter it in the opposite sense. Using voltage measurements and the Nernst equation, the solubility products of the low solubility salts AgCl, AgBr and AgI are determined.

Soxhlet extraction from leaves
For more information on this experience, see page 75.
C2.3.1ORGANIC
C2.4.2EXTRACTION
COMPOSITION OF ORGANIC COMPOUNDS
C2.1.1.1
Quantitative determination of carbon
C2.1.1.2
Quantitative determination of hydrogen
syringe, 100 ml with 3-way stopcock
656 017 Teclu burner, universal
666 609 Stand tube, 45 cm, Ø 10
Pipetting ball (Peleus ball) 11
667 180 Rubber tubing 7 mm Ø, 1 m 11
604 481 Rubber tubing, 1 m x 4 mm diam., DIN 1286511
665 004Funnel, Boro 3.3, 80 mm diam. 11
604 510 Tubing connector, 4...15 mm 11
661 000 Minican pressurised gas canister, nitrogen 11
660 989Minican pressurised gas canister, n-Butane 11
660 980Fine regulating valve for minican gas canisters11
667 034 Tweezers, blunt, 200 mm 11
672 9410 Copper(II) oxide, wire form, 250 g 11
Cat. No. Description
671 2410 Calcium chloride, granulated, 250 g 11
674 4310 1-Propanol, 250 ml 11
672 1010 Glass wool, 100 g 11
665 918 Gas syringe holder 1 SAP R213 Precision Balance Practum 213-1S 1
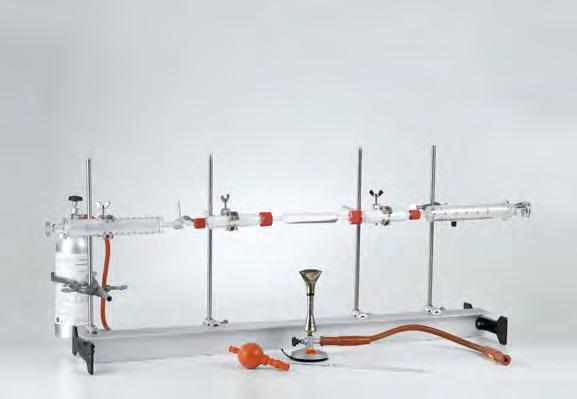
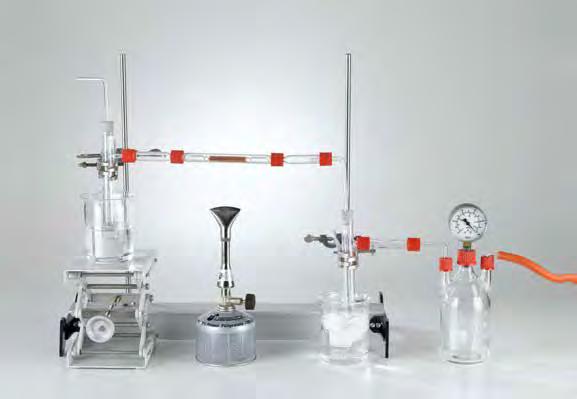
In order to determine the chemical composition of organic compounds, a quantitative elementary analysis is conducted. Combustion analysis is also still used today for the determination of carbon and hydrogen.
In experiment C2.1.1.1, the carbon content of an organic compound is determined quantitatively. In a combustion analysis, the substance is passed over glowing copper(II) oxide at approx. 800 °C - 900 °C. The carbon is converted to CO2 and the hydrogen is converted to H2O. The CO2 gas generated is collected in a gas syringe and the volume is measured.
In experiment C2.1.1.2, the hydrogen content of an organic compound is determined quantitatively. Here, too, the combustion analysis is carried out, whereby the carbon is converted to CO2 and the hydrogen is converted to H2O. The water content is determined from the difference in the weight of the drying tube, and the share of hydrogen is determined from the water content.
C2.1.2.1
Thermal analysis of hydrocarbons
Hydrocarbons are compounds which contain only carbon and hydrogen. A differentiation is made between alkanes, alkenes and alkynes. Alkanes are saturated hydrocarbons. Each C atom forms four single bonds. Unsaturated hydrocarbon compounds have multiple bonds. Alkenes have at least one double bond, alkynes one triple bond. Hydrocarbons can occur in short or long chains. Open chains or branches are found, and they can also comprise ring-shaped molecules.
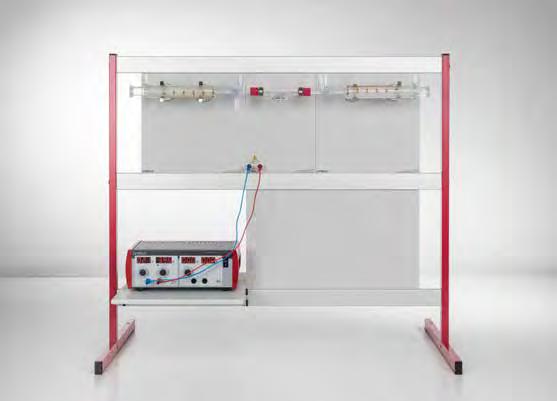
In order to determine the number of hydrogen atoms as compared with the number of carbon atoms, hydrocarbons can be separated into their elements by thermal decomposition. With gaseous hydrocarbons, this can be done with a filament in a combustion chamber. There the gas is split into hydrogen and carbon black (soot). The ratio of hydrogen to carbon in the compound can be derived directly from the increase in gas volume. In experiment C2.1.2.1, the gases methane and ethane are studied in this way.
Oxidation
OXIDATION REACTIONS
C2.2.2.1
Oxidation of propanol
664
Oxidation and reduction reactions also occur in organic chemistry. These involve oxygen transfer reactions, e.g. the oxidation of alcohols to carboxylic acids, or hydrogen transfer reactions, in which, technically, a hydride ion (H-) is transferred. But redox reactions can also occur radically or via displacement or additionelimination mechanisms.
In experiment C2.2.2.1, acetone is produced. To do so, the secondary alcohol 2-propanol is oxidised to 2-propanone (acetone). The oxidising agent used is copper oxide (CuO), which at high temperature gives off oxygen to reducing materials. Continuous air supply immediately re-oxidises the metal copper, however. In order to provide the largest possible Cu-CuO surface area, an anoxidised, rolled up copper mesh is used.
C2.2.2
OXIDATION REACTIONS
C2.2.2.2
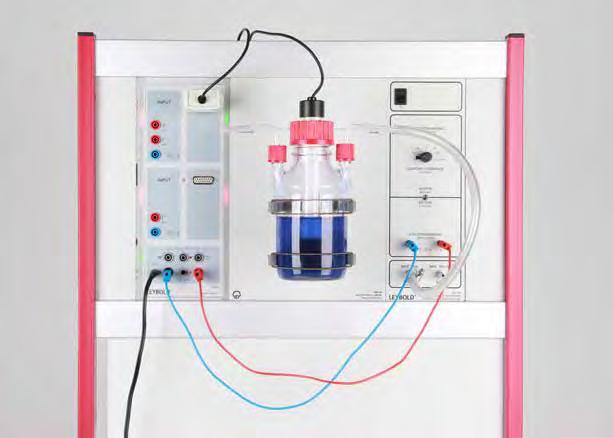
The automated Blue Bottle Experiment - a reversible redox reaction
The blue bottle experiment is a model experiment for a organic redox system. The redox indicator methylene blue is reduced by glucose to its colourless form which is then oxidised by air to form again the coloured version. The air is led into solution by a pump. Additional glucose in solution will then reduce it to its colourless form. The process is reversible. In this experiment a automated version with a two-point control system is used.

The calorific value of coal (C2.3.1.1)
666 429 Calorimeter for solids and liquids, CPS 11
666 819 Stirring top, with GL 32 screw thread 11
666 428 Panel frame C100, two-level, for CPS 11
666 4660 Adhesive magnetic board 300 mm 22
666 4664
S, type K 11
529 676 Temperature probe, NiCr-Ni, 1.5 mm, type K11
667 183 Rubber tubing, 1 m x 8 mm diam., DIN 1286511
604 510 Tubing connector, 4...15 mm 11
667 197 Silicone tubing, 4 mm diam., 1 m 11
521 536 DC Power Supply 2 x 0...16 V/2 x 0...5 A 11
501 45 Connecting lead 19 A, 50 cm, red/blue, pair33
667 7977 Electronic Balance 440-3N, 200 g : 0.01 g11
ADA HCB3001 Precision Balance, 3000 g / 0,1 g 11
667 092Mortar porcelain 70 mm Ø 1

C2.3.1
C2.3.1.1
The calorific value of coal
C2.3.1.3
The calorific value of fuel oil
608 360 Pestle, 54 mm long 1 Cat. No.
660 998Minican pressurised gas canister, oxygen 11
660 980Fine regulating valve for minican gas canisters11
674 9340 Anthracite coal, pieces, 100 g 1
673 8420 Sodium hydroxide solution, 1 mol/l, 500 ml11
674 7850 Sulfuric acid, 95-98 %, 250 ml 11
661 082 Stopcock grease, 60 g 11
665 953Dropping pipette, 7 x 150 mm, 10 pcs. 1
665 954Rubber bulbs, 10 pcs 1
672 1740 Heating oil, 250 ml 1 additionally required: PC with Windows XP/Vista/7/8/10 (x86 or x64) 11
In experiment C2.3.1.1, coal is burned and the heat of combustion is determined with a calorimeter. The calorimeter completely surrounds the sides and top of the combustion chamber. The hot combustion gases generated are fed through a double glass coil and give off their energy to the environment (the glass element and the bath liquid) in the form of heat. In this way, the heat of combustion can be determined using the total heat capacity of the calorimeter.
In experiment C2.3.1.3 the heating value of fuel oil is determined with a demonstration calorimeter. Cat.

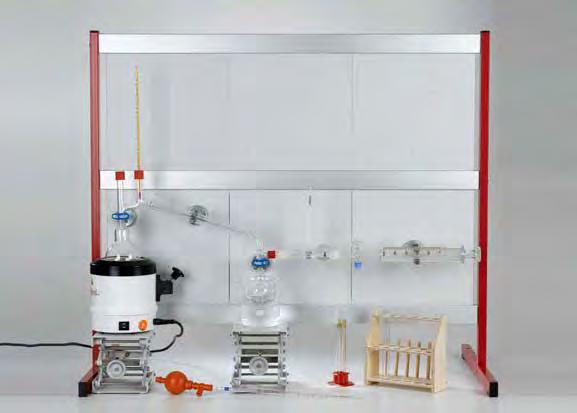
Fractionated petroleum distillation with a bubble tray column (C2.3.2.1)
C2.3.2
FROM CRUDE OIL TO PETROLEUM PRODUCT
C2.3.2.1
Fractionated petroleum distillation with a bubble tray column
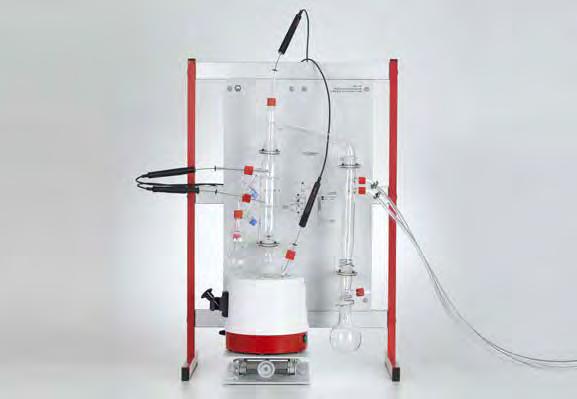
The organic chemical industry is largely based on the raw materials crude oil and natural gas. Those raw materials were formed a long time ago from biomass through biochemical and geochemical processes. Based on its origin, crude oil is classified as a fossil fuel together with natural gas and coal.
These fuels and raw materials cannot be used directly in their natural condition. First they must be refined by various physical and chemical processes. This is done in so-called oil refineries, where different processes are used in order to produce from the crude oil the desired mineral oil products and primary chemicals for the chemical industry.
Crude oil is first separated into different fractions by fractionated distillation. Individual substances cannot be isolated in this way, because the boiling points are very close to one another. Rather, the objective here is to collect hydrocarbons of certain boiling point ranges.
In chemical engineering, crude oil is distilled in bubble tray columns. This process is simulated in experiment C2.3.2.1. The system is fitted with two bubble trays so multiple fractions can be extracted simultaneously.
Catalytic cracking (C2.3.2.3)
C2.3.2.3
Catalytic cracking
Distillation can only extract materials which are naturally present in the crude oil to start with. Because the share of petrol in the crude oil is insufficient to cover the need, however, conversion processes (modification processes) have been developed. They include, along with thermal cracking, also the catalytic cracking which is carried out in experiment C2.3.2.3. Here, paraffin oil is cracked in the heat of a bead catalyst and the gaseous and liquid fractions are collected.
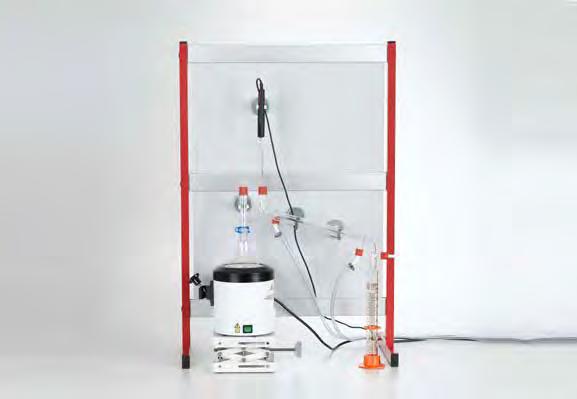
Boiling range distribution of petrol (C2.3.3.1)
Cat.
524 005W Mobile-CASSY 2 WiFi
524 220 CASSY Lab 2
529 676 Temperature probe, NiCr-Ni, 1.5 mm, type K 11
665 338Distillation bridge after Claisen 11
664 301 Round-bottom flask, 250 ml, ST 19/26 11
667 072 Support ring for round flask, 250 ml, cork 11
665 391 Joint clip, plastic, ST 19/26 1
604 501 PVC tubing, 7 mm diam., 1 m 21
604 460 Hose clamp, 8...12 mm 22
665 754 Measuring cylinder 100 ml, with plastic base11
667 305 Screw cap, GL 18, with hole 11
667 295Silicone gaskets, GL 18/8, set of 10 11
666 194 Protective sleeves for temperature probe, set of 511
666 6523 Heating Mantle,
300

C2.3.3
PROPERTIES OF PETROCHEMICAL PRODUCTS
C2.3.3.1
Boiling range distribution of petrol
C2.3.3.2
Boiling range distribution and fractionated distillation of petroleum
for CPS 11
661 091 Boiling stones 100 g 11
670 8200Petroleum ether, 90...110 °C, 250 ml 1
670 8210Petroleum ether, 100...140 °C, 500 ml 1
661 082 Stopcock grease, 60 g 11
665 354Delivery adapter
The petrol fraction is subdivided into several subgroups, so-called special petrols. Petrol benzene boils between 40 °C and 70 °C, for example, and regular petrol boils between 65 °C and 90 °C. In experiment C2.3.3.1, a boiling point analysis is carried out on petrol. For this purpose, different petrol fractions are heated in a distillation apparatus in order to determine the boiling range. In a fractionated distillation of crude oil, fractions of different boiling ranges can be separated. In experiment C2.3.3.2, a fractionated distillation of crude oil is carried out and the fractions are characterised according to their boiling points.

Synthesis and use of indigo (C2.4.1.1)
664
C2.4.1
SYNTHESIS OF ORGANIC COMPOUNDS
C2.4.1.1
Synthesis and use of indigo
The synthesis of new compounds is a major branch of organic chemistry. Because carbon and the heteroatoms oxygen, nitrogen and sulphur can be linked together in so many different combinations, the number of compounds characterised increases year after year. Every synthesis of a new compound consists of carrying out a chemical reaction and subsequently purifying the reaction mixture.
Indigo, a dye, can be produced in a simple organic synthesis. In so doing, o-nitrobenzaldehyde reacts with acetone in a condensation reaction to form isatin. That dimerises into finished indigo. Indigo is not water soluble and can simply be filtered out after the reaction. In experiment C2.4.1.1, this reaction is carried out and the finished indigo is used as a dye.
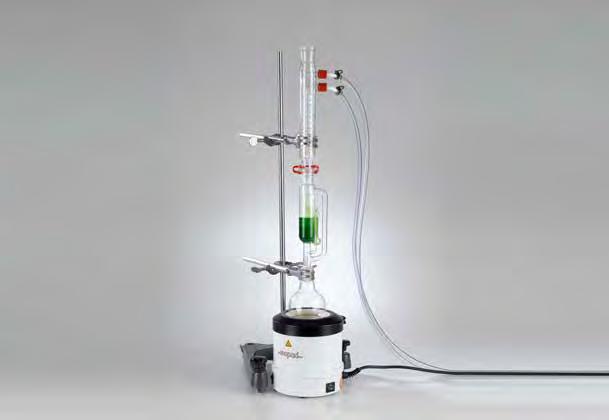
Soxhlet extraction from leaves (C2.4.2.1)
665
C2.4.2
EXTRACTION AS A PURIFICATION PROCESS
C2.4.2.1
Soxhlet extraction from leaves
The term "extraction" refers to the process of dissolving out individual substances from the extraction material, a liquid or solid mixture of substances. For this it takes a suitable solvent - the extraction agent - in which ideally only the substance to be dissolved out (the extract) dissolves. When low solubility or insoluble solids are to be extracted, then a Soxhlet extraction is carried out as in experiment C2.4.2.1. In this case the vapourised solvent condenses on a chiller and drips onto the extraction material in a filter sleeve. It collects in the extraction space, draws the extract out of the extraction material, and is automatically drawn into the flask. From there the solvent evaporates once again (without extract).

Extracting pigments from leaf extract (C2.4.2.2)
C2.4.2
EXTRACTION AS A PURIFICATION PROCESS
C2.4.2.2
Extracting pigments from leaf extract
The solvent extraction of a substance is a simple liquid-liquid extraction. In this case the extraction material is shaken with the extraction agent in a closed vessel, the separatory funnel. The liquids must not be miscible! The substance to be extracted goes over to the extraction agent. In experiment C2.4.2.2 this technique is illustrated by the solvent extraction of a leaf extract with oil.
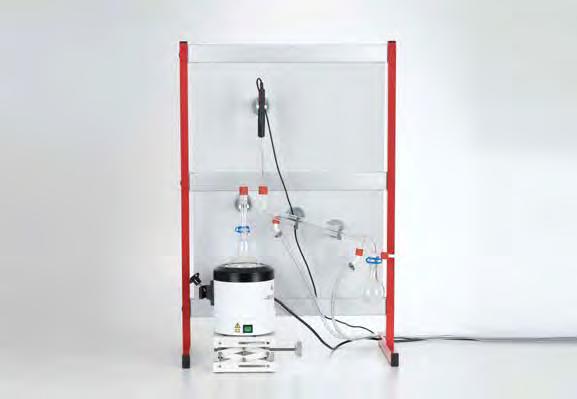
Distillation of red wine (C2.4.3.1)
524
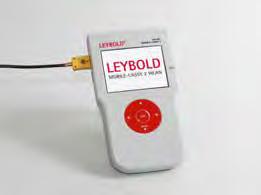
DISTILLATION AS A PURIFICATION PROCESS
C2.4.3.1
Distillation of red wine
Distillation is a purification process for separating fluids from one another. It relies on the different volatilities and boiling points of the components.
In distillation, the liquid mixture is heated and the vapours are recooled. The composition of the vapours differs from that of the liquid, and the same also applies then to the condensate. If the boiling points are far enough apart, then mixtures can be separated by simple distillation. This is the case, for example, in the distillation of red wine in experiment C2.4.3.1. Ethanol boils at 78 °C and water boils at 100 °C. Here CASSY is used to track the temperature curve in computerised form.

Purification of a substance with water vapour distillation (C2.4.3.3)
C2.4.3
DISTILLATION AS A PURIFICATION PROCESS
C2.4.3.3
Purification of a substance with water vapour distillation
In experiment C2.4.3.3, water vapour distillation is used to isolate fragrance and flavouring substances from crushed plant parts. The readily volatile fragrance and flavouring substances are carried away by the hot steam. In addition, the water solubility of these essential oils is temperature dependent. They dissolve in the hot water in the receiver flask. During cooling in the distillation unit, the water and essential oil separate again. In this way, the oil can be easily separated from the solvent water.

Separation of a leaf extract with column chromatography (C2.4.4.1)
Cat. No.
665 592Chromatography column, 235 x 20 mm diam.
665 073 Dropping funnel, 75 ml, ST 29
664
602
665 005Funnel, Boro 3.3, 100 mm diam.
661 038 Round filter, Type 595,
665
C2.4.4
C2.4.4.1
Separation of a leaf extract with column chromatography
09 Bosshead S
555 Universal clamp 0...80 mm
8200Petroleum ether, 90...110 °C, 250 ml
672 1000 Glass wool, 10 g
674 8210 Sea sand, purified, 1 kg
670 0410Acetone, 1 l
661 0581 Silica gel, 35-70 mesh, 1 kg
661 0821 Stopcock grease (grease stick)
After a synthesis, the resulting reaction mixture is often separated by means of column chromatography. Often used is a solidliquid adsorption chromatography, which takes advantage of the different polarities of the individual compounds.
The process of chromatography was developed by Tsvet on leaf pigments at the beginning of the 20th century. Although ridiculed at first, the technique has since become one the most important methods in organic chemistry. In experiment C2.4.4.1, a leaf extract is produced and separated into its components by means of column chromatography.

Separation of petroleum by means of column chromatography (C2.4.4.2)
C2.4.4
COLUMN CHROMATOGRAPHY AS A PURIFICATION PROCESS
C2.4.4.2
Separation of petroleum by means of column chromatography
Crude oil is a liquid mixture of many organic substances. The aromatic substances in the crude oil can be separated on aluminium oxide by means of column chromatography. This is carried out in experiment C2.4.4.2. Using column chromatography, however, it is also possible to assay the different compound classes in crude oil fractions.
C3.2.1GAS
C3.4.3NUCLEAR

C3.1.1
PROPERTIES OF GASES
C3.1.1.1
Determination of the density of gases
A gas is a collection of molecules which are separated by great distances from one another and are in chaotic motion. It completely fills any volume which is available to it. In so doing, it always has the same volume, regardless of which gas it is. Because of the large molecular distances, gases are highly compressible. Density (s) is defined as mass (m) per unit volume (V): s = V m
In experiment C3.1.1.1, a sphere of known volume with two stopcocks is used to determine the density of various gases. The mass of the enclosed air is determined from the measured difference between the total weight of the sphere filled with gas and the empty weight of the evacuated sphere.
DETERMINATION OF PHYSICAL PROPERTIES

C3.1.2
C3.1.2.1
Determination of viscosity with the falling ball viscometer according to Höppler
Liquid particles glide easily alongside one another. A liquid conforms to the shape of the vessel in which it is placed. All objects which are heavier than the liquid sink into it unimpeded. The surface of liquids always remains horizontal. Liquids cannot be compressed.
When a substance (gas, liquid or solid) deforms, it opposes the change in form by a resistance which is generally referred to as its viscosity. If one liquid layer moves at constant speed in a direction parallel to a second layer, then a force friction acts between the two layers. The friction converts the energy of motion into heat. For this reason, the viscosity of a substance is a measure of the internal friction. The viscosity of a substance determines how well or poorly it flows in a pipe (e.g. blood through a vein) and how much resistance it exerts against a solid body moving in it. Viscosity is highly temperature dependant. Experiment C3.1.2.1 studies the dependence of the viscosity on concentration in concentrated sugar solutions at room temperature.

Measurement of surface tension using the „break-away“ method (C3.1.2.2) Cat.
367
C3.1.2
C3.1.2.2
Measurement of surface tension using the „break-away“ method
Liquid particles glide easily alongside one another. A liquid conforms to the shape of the vessel in which it is placed. All objects which are heavier than the liquid sink into it unimpeded. The surface of liquids always remains horizontal. Liquids cannot be compressed.
Surface tension is a property of the surface (boundary layer) between a fluid and a gas, such as air. The surface of a liquid behaves like a stretched elastic film. This effect is the reason that water droplets form, for example, and helps make it possible for certain insects to walk on the water or for a coin to “swim” on the water.
Experiment C3.1.2.2 determines the surface tension of water and ethanol. Here it will be shown that water is characterised by a particularly high surface tension as compared with other liquids. (Published value for water: 0.073 Nm-1, for ethanol: 0.022 Nm-1<)
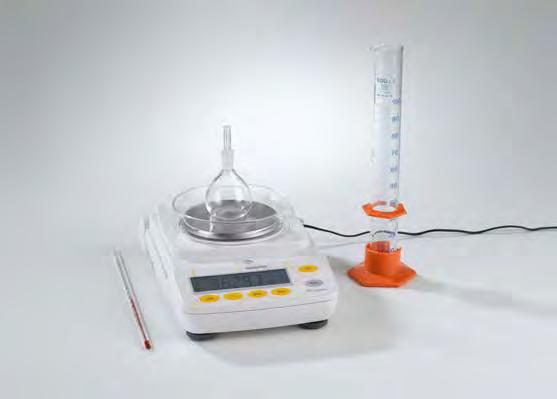

C3.1.2
PROPERTIES OF LIQUIDS
C3.1.2.3
Determination of density according to Mohr-Westphal C3.1.2.4
Determination of density with the pycnometer
362 025 Plumb bob
315 011 Hydrostatic balance
315 31 Set of weights, 10 mg to 200 g
382 21 Stirring thermometer -10...+110 °C 11
665 754 Measuring cylinder 100 ml, with plastic base22
671 9720 Ethanol, denaturated, 1 l 11
666 145 Gay-Lussac pycnometer, 50 ml 1
667 7977 Electronic Balance 440-3N, 200 g : 0.01 g 1
Experiment C3.1.2.3 provides a plummet for determining the of density of liquids. The measurement task is to determine the density of ethanol-water mixtures. Using the plummet, the density is determined from the buoyancy that a body of known volume experiences in the liquid under examination.
Experiment C3.1.2.4 provides a pycnometer according to GayLussac for determining the of density of liquids. The measurement task is to determine the density of ethanol-water mixtures. The pycnometer is a bulb-shaped bottle into which the liquid under study is filled for weighing. The volume capacity of the pycnometer is determined by weighing with a liquid of known density (e.g. water).
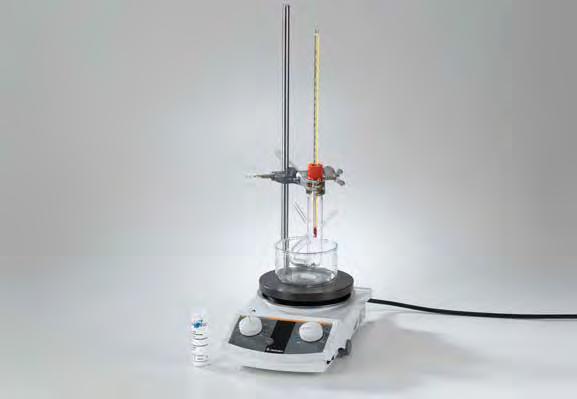
Determination of the melting point of salicylic acid (C3.1.3.1)
667
C3.1.3
C3.1.3.1
Determination of the melting point of salicylic acid
The solid state of a substance is defined as featuring a definite, nearly temperature-independent volume and stable shape. All substances which meet those criteria are known as solids.
In experiment C3.1.3.1, the thiele tube is used to determine the melting point of salicylic acid. The melting point is, along with the boiling point, a characteristic property of every substance. The melting point determination apparatus is filled with paraffin and fitted with a thermometer. A melting point tube is filled with the substance to be assayed. The tube is inserted with the open side into the device in a way that it is positioned alongside the thermometer. The melting point is determined by slow heating in the water bath.

Determination of the density of solids (C3.1.3.4)
DETERMINATION OF PHYSICAL PROPERTIES
C3.1.3.4
Determination of the density of solids
Experiment C3.1.3.4 determines the density of irregularly shaped solid bodies. Weighing is coupled with a measurement of volume. The volume of the bodies are determined by the volume of liquid which the bodies displace from an overflow vessel.
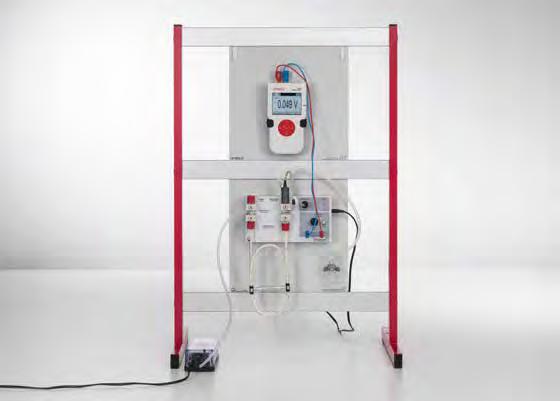

GAS CHROMATOGRAPHY
C3.2.1.1_p
Gas chromatographical analysis of cigarette lighter gas (butane gas)
C3.2.1.1_s
Gas chromatographical analysis of cigarette lighter gas (butane gas) using stand material
665 580 Gas chromatograph LD 1
665 582Hydrocarbon sensor
665 5831 Separation column silicone OV101 11
665 588Base panel for gas chromatograph LD
4660 Adhesive magnetic board 300 mm 1
662 2861 Aquarium pump, 100 l/h 11
664 814 Bubble counter, with flash back valve 11
665 957 Disposable syringe, 1 ml, with Luer fitting 11
665 955Disposable syringe, 5 ml, with Luer fitting 11
665 960Cannula, 0.45 diam., 10 pcs., with Luer fitting11
501 45 Connecting lead 19 A, 50 cm, red/blue, pair 11
666 503 Base plate for bunsen stand, 130 x 210 mm 11
666 523 Stand rod, 450 x 12 mm diam., M10 thread 11
666 555 Universal clamp 0...80 mm 11
301 09 Bosshead S 11
665 589Septa, silicone, 13 mm diam., 10 pcs. 11
667 197 Silicone tubing, 4 mm diam., 1 m 11
660 980Fine regulating valve for minican gas canisters11
660 988Minican pressurised gas canister, ethane 11
660 989Minican pressurised gas canister, n-Butane 11 additionally required: cigarette lighter(s) 1
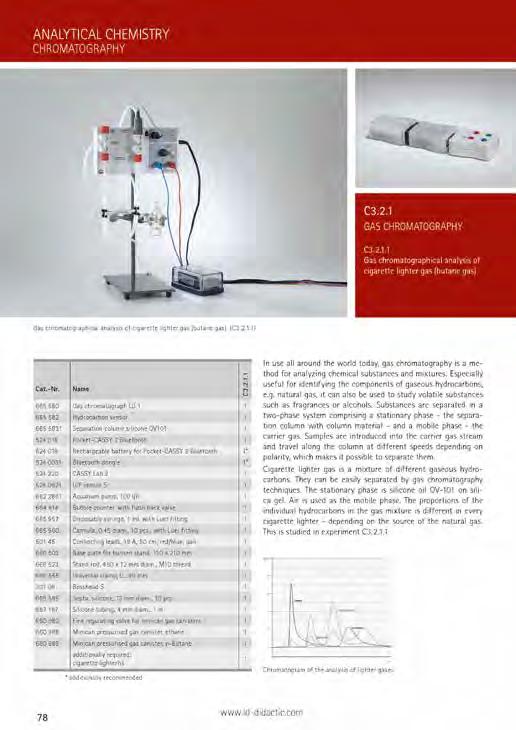
In use all around the world today, gas chromatography is a method for analyzing chemical substances and mixtures. Especially useful for identifying the components of gaseous hydrocarbons, e.g. natural gas, it can also be used to study volatile substances such as fragrances or alcohols. Substances are separated in a two-phase system comprising a stationary phase - the separation column with column material - and a mobile phase - the carrier gas. Samples are introduced into the carrier gas stream and travel along the column at different speeds depending on polarity, which makes it possible to separate them.
Cigarette lighter gas is a mixture of different gaseous hydrocarbons. They can be easily separated by gas chromatography techniques. The stationary phase is silicone oil OV-101 on silica gel. Air is used as the mobile phase. The proportions of the individual hydrocarbons in the gas mixture is different in every cigarette lighter - depending on the source of the natural gas. This is studied in experiment C3.2.1.1.
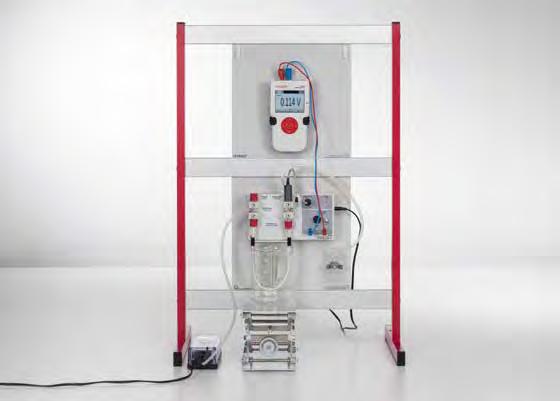
Gas chromatographical separation of alcohols - effect of temperature (C3.2.1.2_p)

GAS CHROMATOGRAPHY
C3.2.1.2_p
Gas chromatographical separation of alcohols - effect of temperature
C3.2.1.2_s
Gas chromatographical separation of alcohols - effect of temperature using stand material
524 005W Mobile-CASSY 2 WiFi
524 220 CASSY Lab 2
665 580 Gas chromatograph LD 1
665 582Hydrocarbon sensor 11
665 584 Separation column with Porapak P 11
662 2861 Aquarium pump, 100 l/h 11
664 814 Bubble counter, with flash back valve 11
602 013 Beaker, Boro 3.3, 800 ml, tall 22 300 76 Laboratory stand II 11
607 5025 Magnetic stirrer with hotplate 11
666 851 Stirring magnet 25 mm x 6 mm Ø, circular 11
382 21 Stirring thermometer -10...+110 °C 11
665 957 Disposable syringe, 1 ml, with Luer fitting 11
665 960Cannula, 0.45 diam., 10 pcs., with Luer fitting11
501 45 Connecting lead 19 A, 50 cm, red/blue, pair 11
666 425 Panel frame C50, two-level, for CPS 1
666 4660 Adhesive magnetic board 300 mm
524 0036 Holder for Mobile-CASSY 2, CPS
665 588Base panel for gas chromatograph LD 1, CPS 1
665 589Septa, silicone, 13 mm diam., 10 pcs.
667 197 Silicone tubing, 4 mm diam., 1 m 11
673 2700Methanol, 250 ml 11
671 9700Ethanol, absolute, 250 ml 11
671 9740 Ethanol, denaturated, 250 ml 11
674 4310 1-Propanol, 250 ml 11
No. Description
674 4400 2-Propanol, 250 ml
666 503 Base plate for bunsen stand, 130 x 210 mm 1
666 523 Stand rod, 450 x 12 mm diam., M10 thread 1
666 555 Universal clamp 0...80 mm 1
301 09 Bosshead S 1 additionally required: PC with Windows 7 or higher with WiFi or USB connection 11
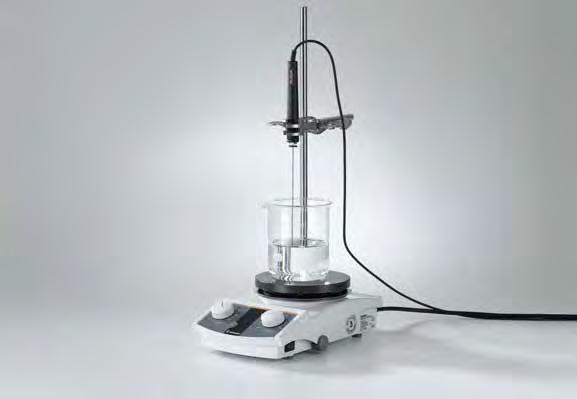
A gas chromatograph can be used to separate not only gaseous substances, but also volatile liquids. Only the gaseous part is separated, however. In such cases, the separation column and the carrier gas can be warmed if necessary. In experiment C3.2.1.2, the gas chromatographic analysis of an alcohol mixture is carried out.
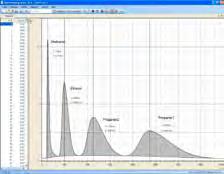
Chromatogram of the analysis of different alcohols
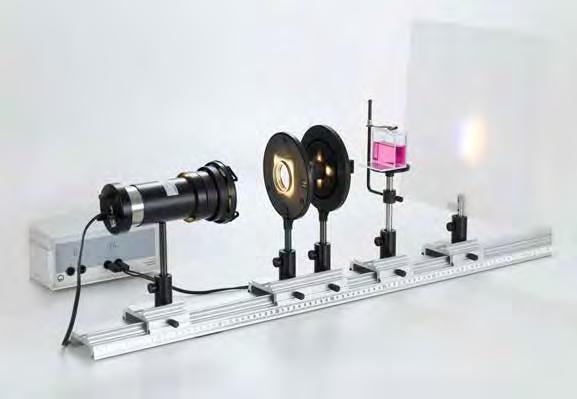
Absorption spectra of pigments on a screen (C3.3.1.1)
460

C3.3.1
SPECTROMETRY
C3.3.1.1
Absorption spectra of pigments on a screen
C3.3.1.2
Recording of absorption spectra with a spectrometer
5672Double microspatula, steel, 150 mm
103 Beaker, DURAN, 250 ml, squat
602 043Beaker, DURAN, 150 ml, squat
665 754 Measuring cylinder 100 ml, with plastic base
additionally required: PC with Windows XP/Vista/7/8/10 (x86 or x64) 1 * additionally recommended
In experiment C3.3.1.1, the light from a lamp is separated out into its spectrum with a direct vision prism. That light is then projected through coloured liquids and compared with the continuous spectrum of the light from the lamp. The original continuous spectrum with the different spectral colours disappears. Only the colour components of the liquid remain visible.
In experiment C3.3.1.2, the solution of a dye is exposed to the light from a lamp. For the absorption spectrum, the light passing through the coloured solution is recorded with a spectrometer. The absorption spectrum is compared with the continuous spectrum of the light from the lamp.

Recording of a fluorescence spectrum with a spectrometer (C3.3.1.3)
664
C3.3.1.3
Recording of a fluorescence spectrum with a spectrometer
The impression of colour observed when looking through liquids is created by the part of the white light which is transmitted („passed through“). Every coloured substance absorbs at characteristic wavelengths. In this way, a characteristic spectrum can be created for a dye.
In experiment C3.3.1.3, a solution of the fluorescent dye fluorescein is exposed to the light from a lamp. For this purpose, the spectrometer is arranged at a right angle to the lamp. In this way, the fluorescence spectrum of the dye can be recorded. This can be compared with the absorption spectrum from experiment C3.3.1.2.

Spectra of a mixture of different-colourd substances (C3.3.1.4)
C3.3.1.4
Spectra of a mixture of differentcolourd substances
To determine the concentration of a dye in a solution with other dyes, the solution must be separated and the concentrations of the individual dyes must be determined. A look at the spectra of the dye mixture and the individual dyes can show whether such a separation is necessary. This method is carried out in experiment C3.3.1.4.
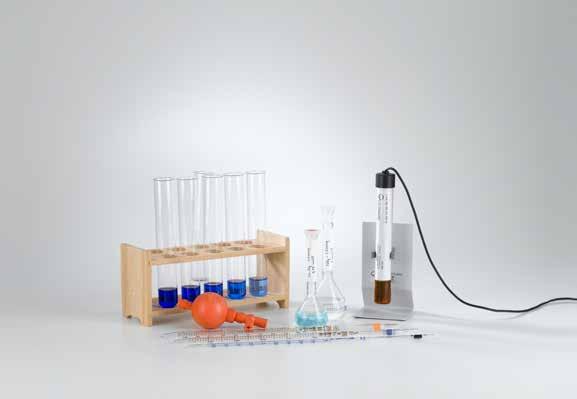
The Beer-Lambert law (C3.3.2.1)
2605 Holder for immersion photometer S
665 793Volumetric flask, Boro 3.3, 100 ml
665 792Volumetric flask, Boro 3.3, 50 ml
664 045Test tubes, Fiolax, 30 x 200 mm, set of 10
665 997 Graduated pipette 10 ml
666 003 Pipetting ball (Peleus ball)
667 054Test tube rack, for 12 tubes, 32 mm diam.
667 7977 Electronic Balance 440-3N, 200 g : 0.01 g
672 9600 Copper(II) sulfate-5-hydrate, 100 g
670 3600Ammonia solution, 25 %, 250 ml
675 3400 Water, pure, 1 l
additionally required: PC with Windows 7 or higher with WIFI or USB connection

C3.3.2
C3.3.2.1
The Beer-Lambert law
The intensity of light diminishes when it passes through a coloured solution. Photometric measurements make use of this fact to determine the concentration of such a solution. For this purpose, the transmittance T of the solution is measured, i.e. the ratio of the intensity of the transmitted light I to the intensity of light exposure I0 .
The extinction or absorption of the solution, i.e. the number of light quanta absorbed, is proportional to the concentration. Transmission and extinction have the following relationship:
If the extinction of a solution is measured, its concentration can be calculated from the result. That relationship is expressed by the Beer-Lambert law. Along with the concentration c of a solution, the extinction also depends on the thickness d of the layer and on the substance-specific extinction coefficient e .
In experiment C3.3.2.1, a dilution series is used to study the proportional relationship between extinction and concentration and to determine the extinction coefficient of blue copper tetraammine.
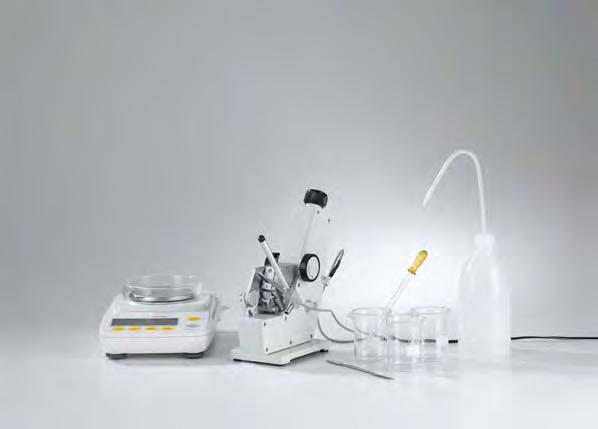
Determination of the refractive index with the refractometer (C3.3.3.1)
667
C3.3.3.1
Determination of the refractive index with the refractometer
Every liquid has a characteristic refractive index n D . The refractive index of a mixture of two liquids is determined by the refractive index of the individual liquids and by their proportion in the mixture. If the refractive indices of the individual liquids are known, then their mixing proportion in a solution can be determined. The refractive index is measured with a refractometer. The refractometer is also useful for determining the Brix value (mass for the soluble solids or sugar content). In experiment C3.3.3.1, the refractometer is used to determine the mass fraction w in % in a solution by measuring the refractive index. (w = the mass of the components / the mass of the mixture. To express the result in percent, the number is multiplied by 100). For this purpose, solutions with different mass fractions of a substance are prepared. In this way, a sample with unknown mass fraction can be determined.
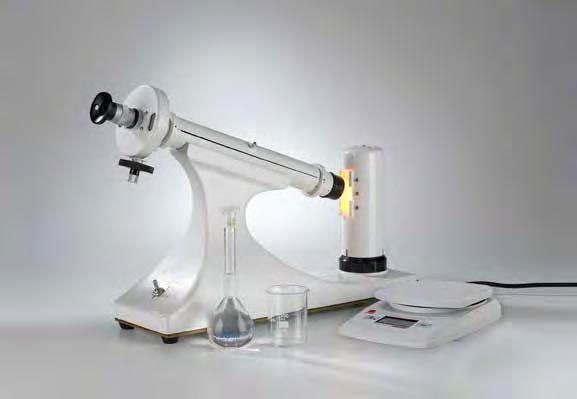
Rotation of the polarisation plane through sugar solutions (C3.3.4.1) OPTICAL
C3.3.4
C3.3.4.1
Rotation of the polarisation plane through sugar solutions
674
The term ‘optical activity’ refers to the property of some materials which rotate the polarisation plane of linearly polarised light as it passes through a substance. The angle of rotation a depends on the molecular structure and the concentration of the dissolved substance, on the distance that the light travels through the solution, and on the wavelength of the light.
Experiment C3.3.4.1 demonstrates that optically active substances can rotate the plane of a linerally polarised beam of light by a specific value. For a given cuvette length d, the angle of rotation a of an optically active solution is proportional to the concentration c of the solution.
To determine the concentration c of the solution, the following expression applies:
specific rotation: [a] (°· ml/g · dm)
The angle of rotation is given as a positive (+) value when the polarisation plane of the light directed toward the observer rotates clockwise (to the right). Counterclockwise rotation is referred to as rotation to the left and expressed as a negative number, hence preceded by a minus sign (-).


C3.4.3
NUCLEAR MAGNETIC RESONANCE SPECTROSCOPY (NMR SPECTROSCOPY)
C3.4.3.1
Nuclear magnetic resonance (NMR) on water, polystyrene, glycerine and Teflon
In a magnetic field B , the magnetic moment of a nucleus associated with nuclear spin I takes on the following energy states: Eg mB mI II mIK
50511027
u uclearmagneton :gfactorofnucleusIg
524
A high-frequency magnetic field with frequency f projected perpendicular to that magnetic field excites transitions between neighbouring energy states when they meet the resonance conditions: hE E h mm ⋅= + ν 1 :Planck'sconstant
This phenomenon is the basis for nuclear magnetic resonance (NMR). Nuclei with an uneven number of protons are active here. The exact resonance frequency of a nucleus depends on the type of the atom and on its chemical surroundings. Along with the outer magnetic field B , a local, inner field also affects every nucleus. This is generated by the nuclei in the immediate proximity. In this way, NMR is useful for analyzing structures.
In experiment C3.4.3.1, nuclear magnetic resonance is demonstrated on polystyrene, glycerine and Teflon. The position, width and intensity of the resonance lines are evaluated.

C3.4.3
ELECTRON SPIN RESONANCE SPECTROSCOPY
C3.4.4.1
Electron spin resonance on DPPH
In experiment C3.4.4.1, electron spin resonance is demonstrated on diphenylpicrylhydrazyl (DPPH). DPPH is a radical in which a free electron occurs on a nitrogen atom. In the experiment, the resonance frequencies can be predefined continuously between 13 and 130 MHz. The aim of the assessment is to determine the g factor.
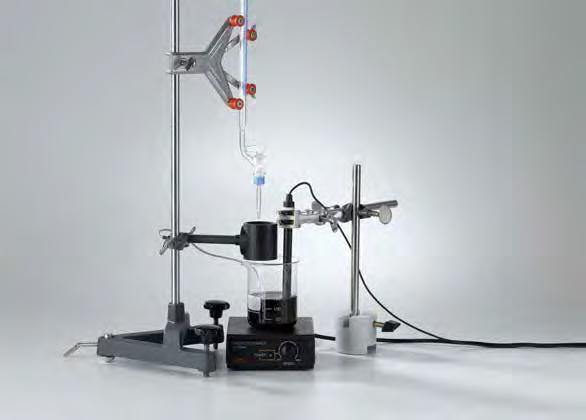

POTENTIOMETRIC AND ACID-BASE TITRATIONS
C3.5.1.1
Determination of acid concentration by titration with drop counter
The classic technique for determining the exact quantity of a substance in solution (quantitative analysis) is titration. Here a reagent is slowly added in drops with a burette until the equivalence point is reached, i.e. the point at which the substance under investigation has reacted completely. In manual titrations, that point is made visible by means of a detection reagent, but it can also be measured by means of instrumentation.
In experiment C3.5.1.1, the acid concentration of balsamic vinegar is determined. Due to the dark colour, coloured indicators cannot be used here. Rather, the pH is measured continuously. This is done with a pH electrode. pH electrodes are potentiometric electrodes which respond ion-selectively only to changes in the potential of protons. The measured potential is then converted to a pH value. In the experiment, a complete titration curve of the titration of balsamic vinegar with sodium hydroxide is recorded using a drop counter.
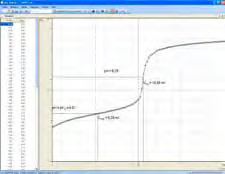
Titration curve of vinegar
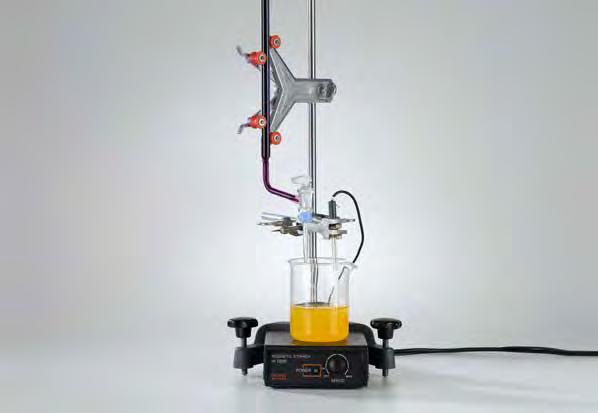
Potentiometric titration of iron(II) ions (C3.5.1.3) QUANTITATIVE

C3.5.1
POTENTIOMETRIC AND ACID-BASE TITRATIONS
C3.5.1.3
Potentiometric titration of iron(II) ions
524
In experiment C3.5.1.3, a potentiometric titration is performed in order to measure the concentration of iron(II) ions. In the process, the iron(II) ions are oxidised with potassium permanganate.
5Fe+MnO+8H5Fe+M2+n+4HO 4 -+3+2+ 2 ƒ
The change in the potential of the solution during the titration corresponds here to the change in pH in an acid-base titration.
Conductometric titration of a hydrochloric acid solution using stand material QUANTITATIVE ANALYSIS

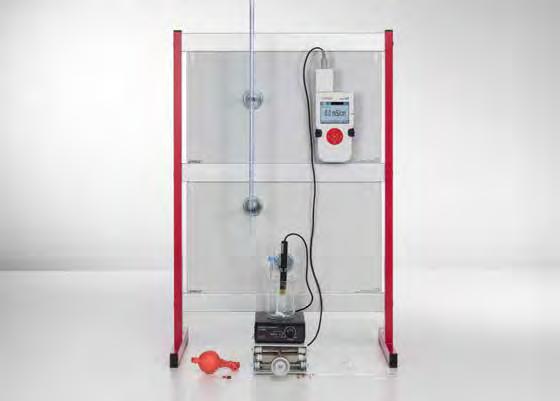
Conductometric titration of a hydrochloric acid solution (C3.5.2.1_p)
524
524
524
CONDUCTOMETRIC TITRATIONS
C3.5.2.1_p
Conductometric titration of a hydrochloric acid solution
C3.5.2.1_s
In conductometric titrations, the equivalence point is determined by measuring the conductivity. This technique relies on the fact that dissolved salts dramatically increase the conductivity of a solution. Acid-base titrations or precipitation titrations can be tracked conductometrically.
In experiment C3.5.2.1, an acid-base titration is performed in which a hydrochloric acid solution is titrated with sodium hydroxide. Because hydronium ions and hydroxide ions have very high conductivity, the equivalence point is easy to determine. During the titration, the conductivity falls at first because more and more hydronium ions are neutralised. HO+O3H2HO +2 ƒ
Beginning exactly from the equivalence point, it starts to rise again because then there is a surplus of hydroxide ions.
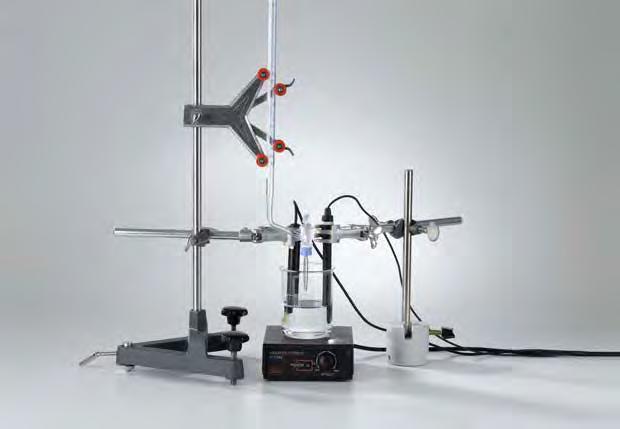
Conductometric titration of a hydrochloric acid solution with pH measurement (C3.5.2.2)

C3.5.2
CONDUCTOMETRIC TITRATIONS
C3.5.2.2
Conductometric titration of a hydrochloric acid solution with pH measurement
In experiment C3.5.2.2, along with conductivity, the change in pH is also traced. It becomes clear that the two measurement methods determine the same equivalence point. This is attributable to the fact that the same chemical process is measured in different ways. Cat. No.
In conductometric titrations, the equivalence point is determined by measuring the conductivity. This technique relies on the fact that dissolved salts dramatically increase the conductivity of a solution. Acid-base titrations or precipitation titrations can be tracked conductometrically.

Conductometric titration using the Electrochemistry demonstration unit (C3.5.2.3)
C3.5.2
CONDUCTOMETRIC TITRATIONS
C3.5.2.3
Conductometric titration using the Electrochemistry demonstration unit
In experiment C3.5.2.3 a conductivity titration is carried out using the electrochemistry demonstration unit. The reaction takes place in an electrolysis cell while two nickel electrodes are used for measuring the electrical potential differences.

Manganometric determination of iron(II) ions (C3.5.3.2)
675

C3.5.3
C3.5.3.2
Manganometric determination of iron(II) ions
In redox titrations, a redox reaction takes place as an assay reaction. Similar to the pH indicator in acid-base titrations, the equivalence point is determined with redox indicators. Oxidation or reduction makes them change their colour at a specific "endpoint potential". Similar to the pH electrode, a redox electrode is used in the instrumental titration.
Manganometry requires no redox indicator because a potassium manganate solution is used as a reference solution. It has a deep violet colour and serves as an oxidising agent. In experiment C3.5.3.2, an iron(II) solution is titrated with a potassium permanganate solution.
5Fe+MnO+8H5Fe+M
The endpoint is reached when the solution retains a constant violet colour. At the same time, a redox electrode is used to measure the potential of the solution.

Determination of water contents with indicator reagents and immersion photometer (C3.6.1.1)
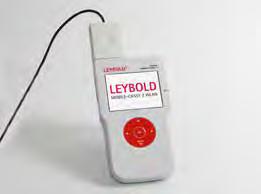
C3.6.1
WATER ANALYTICS
C3.6.1.1
Determination of water contents with indicator reagents and immersion photometer
666
664
667
665 997
The determination of water quality plays a role in many areas today. Not only drinking water and mineral water are analyzed, but, for example, also swimming pools and lakes. Chemical and biological analyses can be carried out. In chemical water analytics, various ingredients are assayed. The concentrations of these substances indicate the quality of the water.
In experiment C3.6.1.1, water samples are tested for several ingredients, e.g. phosphate, ammonium or nitrate. These are photometric assays. The chemical basis for this relies on the fact that the ingredient to be identified forms a coloured compound or turbidity with the reagents added. At an appropriate wavelength, the extinction of the colour or turbidity created in this way is directly proportional to the concentration of the ingredient.
674 7860
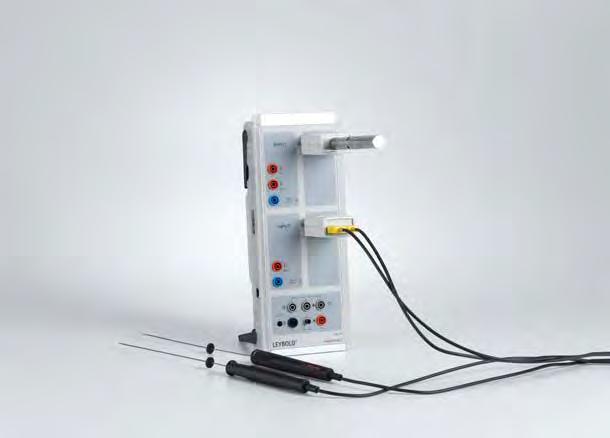
C3.6.2
C3.6.2.1
Continuous measurement of carbon dioxide concentration in the classroom
The air all around us contains mainly nitrogen and oxygen. But the other substances, the ones which occur in significantly lower concentrations - in the ppm range (ppm = parts per million) or even less - are precisely the ones which can be harmful to humans. These are studied in air analyses.
One of the challenges here is the low concentration of the substances. In addition, the analysis of gases requires more complex instrumentation and is less easily accessible than the analysis of liquids.
In this context, it is worthwhile to study the interiors of classrooms or seminar rooms, where it is particularly important to maintain optimal air conditions, in order to facilitate the learning process.
In experiment C3.6.2.1, the carbon dioxide concentration in the classroom is studied for a period of one week. At the same time, the temperature is measured at two positions, e.g. on the radiator and in the classroom. In a room full of people, the CO2 concentration rises rapidly above 1 %, and simply letting some air in can hardly lower it to the value in the atmosphere.
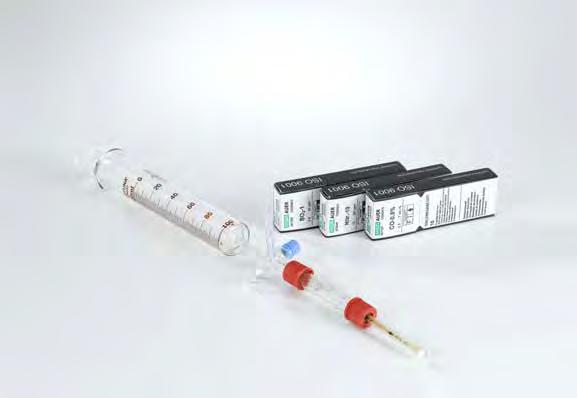
Analysis of cigarette smoke (C3.6.2.2)
665
AIR ANALYTICS
Analysis of cigarette smoke
Smoke from cigarette tobacco contains not only nicotine, but also many toxic substances, including nitrogen oxides, tar and formaldehyde. In experiment C3.6.2.2, cigarette smoke is analyzed for various airborne toxic substances. In so doing, different cigarette brands and strengths can be compared.

of the content of phosphoric acid in a cola drink (C3.6.4.2)

C3.6.4
C3.6.4.2
Determination of the content of phosphoric acid in a cola drink
As an applied science, food analytics forms the basis for the study and assessment of the quality and safety of food.
Phosphoric acid is added to cola in order to heighten the sensation of thirst, as a preservative, and to cover up the sugary taste. In experiment C3.6.4.2, phosphoric acid is titrated with sodium hydroxide. When titrating cola, the first two buffer stages are also clearly recognisable, just as in the titration of phosphoric acid. (It is generally impossible to titrate the third stage in these diluted solutions.) The second stage becomes indistinct in the presence of other ingredients. The phosphoric acid content of the cola beverage can be determined with the first stage.
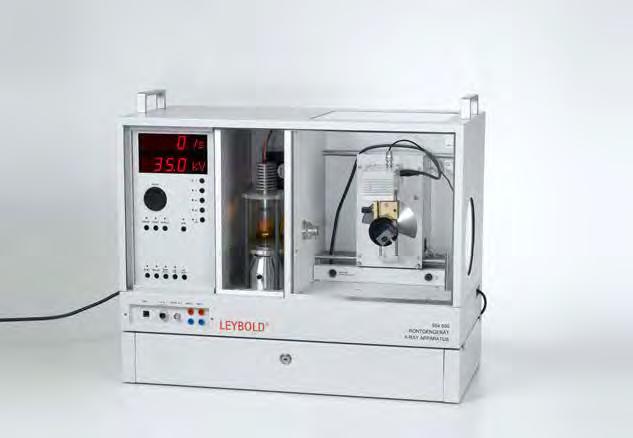
X-ray fluorescence analysis of chemical composition (C3.6.5.1)
554
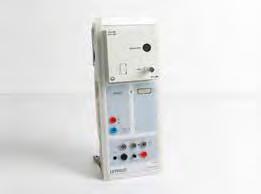
C3.6.5
MATERIAL ANALYTICS
C3.6.5.1
X-ray fluorescence analysis of chemical composition
C3.6.5.2
The chemical composition of a brass specimen
X-ray fluorescence is a method for the non-destructive analysis of the chemical composition of an alloy. Under exposure to Xrays, each of the individual elements emits characteristic X-ray fluorescence, which identifies the element like a fingerprint.
In experiment C3.6.5.1, four alloys are analyzed by means of Xray fluorescence and the composition is determined qualitatively. The alloys are chrome-nickel steel, two brass alloys and a rare earth magnet.
In experiment C3.6.5.2, the composition of a brass alloy is analyzed quantitatively. The weight percents of each component are calculated from the strength of the X-ray fluorescence.
C4.2.1LAW

Catalytic oxidation of tartaric acid with hydrogen peroxide (C4.1.1.1)
524
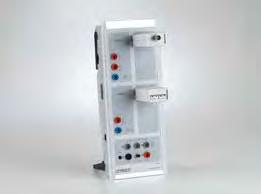
CATALYSIS
C4.1.1.1
Catalytic oxidation of tartaric acid with hydrogen peroxide
The rate of a reaction is defined as the change in concentration over time. For the reaction A+BC ƒ
therefore, the following applies:
One challenge in analyses of this type is to continuously measure the concentration of one of the participants in the reaction.This is possible with reactions in which one or more participants in the reaction change colour or oxidation level, or in which salts form (increase in conductivity).
Apart from elevating the concentration and temperature, the rate of reactions can also be increased by the addition of catalysts. Because catalysts are not consumed in a reaction, a small amount is already enough to enable the conversion of large quantities of the reacting substances.
In experiment C4.1.1.1, hydrogen peroxide is used to convert tartaric acid oxidatively to CO2 and H2O under catalysis. The catalyst cobalt(II) chloride hexahydrate speeds up the reaction, but does not participate in the transformation and remains unchanged once the process has been completed. The reaction is monitored by measuring the redox potential and the temperature.

C4.1.2.1
Hydrolysis of tertiary butyl chloride
The reaction order can be used to test hypotheses about the stepwise course of reactions. The reaction order must be determined experimentally. In order to do so, a diagram is drawn showing of the rate of reaction versus the respective concentration. If the resulting curve is a straight line, then it represents a first-order reaction. A parabola indicates a second-order reaction.
In experiment C4.1.2.1, the hydrolysis of tertiary butylchloride (2-chloro-2-methylpropane) generates tertiary butanol and hydrochloric acid (HCl). In this protolysis reaction, HCl forms hydronium and chloride ions, which cause a strong increase in conductivity:
(CH)-Cl+2HO(CH)C 33-OH+HO+Cl 2333 +→


C4.1.2.2
Determination of the reaction order of the reaction of malachite green with hydroxide ions
The change in conductivity and the concentration of the butylchloride are used to determine the reaction order.
In Experiment C4.1.2.2 malachite green is bleached using sodium hydroxide solution. This bleaching can be followed with an immersion photomoeter. This way, the half time, the reaction order and, based on these data, the reaction rate constant can be determined.
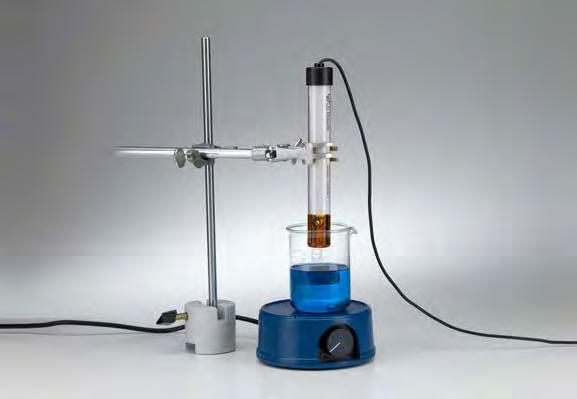

C4.1.3
C4.1.3.1
Reaction of malachite
Cat. No.
The rate of a reaction can be affected by many parameters. These include the temperature and the concentration of the substance involved. The choice of solvent can also play a role.
Reactions in which a participant in the reaction changes colour are a suitable choice if one wishes to observe the course of a reaction. Such reactions are easy to track photometrically, because the decrease and increase in the extinction rate can be directly converted mathematically into concentration changes.
In experiment C4.1.3.1, the reaction of malachite green with hydroxide ions is monitored with an immersion photometer in a glass beaker. Blue-green at first, the solution loses colour when sodium hydroxide is added. This simple system makes it possible to investigate how the rate of reaction is affected by temperature, concentration and the choice of solvent.
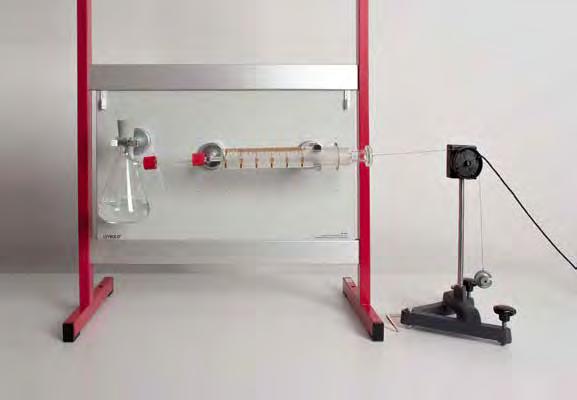
Concentration
524 220 CASSY Lab 2
ADA HCB602H Precision Balance, 600 g /0,01g,
Cat. No. Description

INFLUENCING THE RATE OF REACTION
C4.1.3.2
Reaction rate and degree of division: marble in hydrochloric acid
C4.1.3.3
Concentration and reaction rate: Magnesium in strong and weak acids
If marble (calcium carbonate) is put into hydrochloric acid, it dissolves. This produces carbon dioxide and calcium chloride. Carbon dioxide is released. The reaction mixture therefore becomes lighter. In experiment C4.1.3.2 the reaction is carried out on a balance and recorded with CASSY Lab 2. If different degrees of fragmentation of marble are used, the influence of the degree of fragmentation on the reaction rate can be examined. When in contact with acids, ignoble metals such as magnesium dissolve to form hydrogen. If the hydrogen is collected in a timeresolved manner, this reaction can be observed very easily.
In experiment C4.1.3.3 the hydrogen is collected with a piston sampler. The recording is done with CASSY, in that a displacement transducer registers the movement of the piston sampler. In this way the reaction speed can be quickly compared with different acids, e.g. hydrochloric acid and acetic acid.
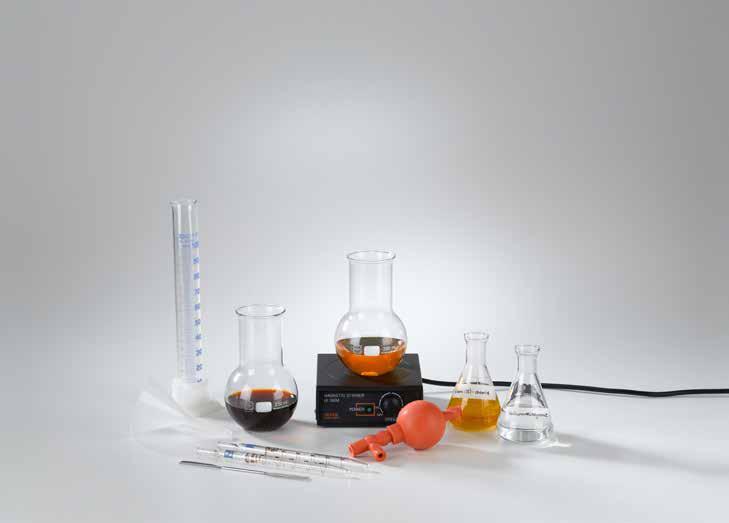
Influencing the equilibrium (C4.2.1.1)
664
664
C4.2.1
Influencing the equilibrium
One of the most important laws in chemistry is the law of mass action. It provides insight into the mechanism of chemical reactions while also offering the chemist the ability to affect a chemical reaction in a way that favours the creation of specifically intended molecules. The law of mass action states that in a chemical reaction the concentration of the starting materials remains in an absolutely constant proportion to the concentration of the final materials.
Experiment C4.2.1.1 studies the chemical equilibrium of the reaction of thiocyanate with iron. The chemical equilibrium is a dynamic equilibrium in which the starting materials and final products are present alongside one another in the reaction mixture. Under equilibrium conditions, exactly so many parts react in one direction as back in the opposite direction. In so doing, the concentrations of the participants in the reaction remain constant and their quotient is expressed as the equilibrium constant K. By adding one of the substances involved, a new equilibrium is established.
For the reaction being investigated here Fe+3SCNFe(SCN) 3+3 ƒ
the equilibrium constant can be calculated as follows: [Fe(SCN)] [Fe][SCN]3+3=K -3

Determination of the acidity constant of bromothymol blue (C4.2.2.1)
467
C4.2.2
PROTOLYSIS EQUILIBRIUM
C4.2.2.1
Determination of the acidity constant of bromothymol blue
The reaction of acids (AH) with water - protolysis - is an equilibrium reaction.
AH+HOA+HO 23 + ƒ
The equilibrium constant Ka , also known as the acid dissociation constant, is a measure of the strength of an acid.
KK KH O a = =⋅ = [HO][A] [HA][HO] [HO][A] [HA] 3 +2 3 +;[] 2
It indicates the magnitude of the ratio between the protonated and non-protonated form of the acid. In most cases, however, the pK a value, i.e. the negative base 10 logarithm of the acid dissociation constant, is given.
In experiment C4.2.2.1, the pH-dependent colour of the indicator bromothymol blue is used to determine the pKa value of the dye. The colouration enables the simultaneous determination of the concentration of the protonated (yellow) and non-protonated (blue) form of the indicator, with which, in turn, the HendersonHasselbalch equation.
661
675
can be used to compute the pKa value.

C4.2.3.1
Determination of the complex disintegration constant of Silver diamine complex.
Complex compounds consist of a central atom, usually a metal, around which ligands are coordinated. These ligands can be exchanged more or less easily. Ligand exchange reactions are equilibrium reactions. In stable complexes, the equilibrium lies on the side of the starting materiel, the starting complex. In instable compleses the equilibrium lies on the side of the products. The silver diamine complex consits of a central silver ion around which ammonia is coordinated as a ligand. The diamine-silver complex arises when ammonia is added to a silver salt solution. Then, the water ligands are replaced by ammonia ligands at the hydrated silver ion because the ammo-nia ligands have a stronger bond. In this experiment, the complex formation constant is determined.
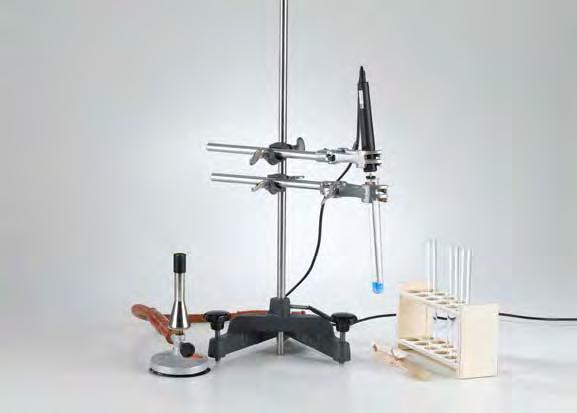
Differentiating between endothermic and exothermic reactions (C4.3.1.1)
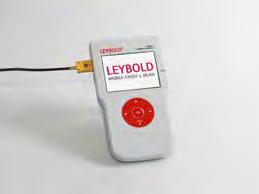
C4.3.1
C4.3.1.1
Differentiating between endothermic and exothermic reactions
664
667
667 031
604
Every chemical reaction is characterised by a transformation of material. That transformation is closely connected with an energy transformation and/or energy change. In this way, heat energy is either consumed or heat is created, i.e. the reaction proceeds endothermically or exothermically.
In experiment C4.3.1.1, copper(II) sulfate in the pentahydrate form and in the anhydrous form is used to demonstrate the principle of endothermic and exothermic reactions. Here the reaction of copper(II) sulfate-5-hydrate under high heat to anhydrous copper(II) sulfate represents the endothermic reaction. The anhydrous copper(II) sulfate obtained in this way reacts in turn with water while generating heat, thereby demonstrating an exothermic reaction.
672
675 3400
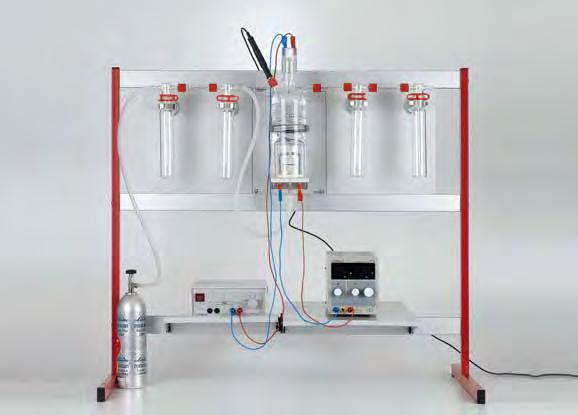
Determination of the heat of combustion of benzoic acid (C4.3.3.1_p)
667
529 676 Temperature probe, NiCr-Ni, 1.5 mm, type K11
667
667
tubing, 1 m x 8 mm diam., DIN 1286511
521 536 DC Power Supply 2 x 0...16 V/2 x 0...5 A 11
521
660 998Minican pressurised gas canister, oxygen 11
660 980Fine regulating valve for minican gas canisters11
ADA HCB3001 Precision Balance, 3000 g / 0,1 g 11
667 7977 Electronic Balance 440-3N, 200 g : 0.01 g11
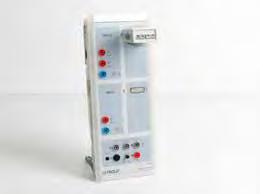
C4.3.3
CALORIMETRY
C4.3.3.1_p
Determination of the heat of combustion of benzoic acid
C4.3.3.1_s
Determination of the heat of combustion of benzoic acid using stand material
Cat. No. Description
608 360 Pestle, 54 mm long 11
667 092Mortar porcelain 70 mm Ø 11
670 8300Benzoic acid, 50 g 11
673 8420 Sodium hydroxide solution, 1 mol/l, 500 ml11
674 7850 Sulfuric acid, 95-98 %, 250 ml 11
667 325 Calorimeter for solids and liquids 1 666 603 Base rail, 95 cm 1 301 09 Bosshead S 8
615 Universal bosshead 4 301 72 Universal clamp, 0...120 mm 2 666 555 Universal clamp 0...80 mm 5
301 27 Stand rod 50 cm, 10 mm Ø 4 additionally required: PC with Windows XP/Vista/7/8/10 (x86 or x64) 11
In experiment C4.3.3.1, the temperature rise in the demonstration calorimeter is measured while burning benzoic acid. The substance is weighed before and after the combustion process. The combustion takes place in an oxygen atmosphere, whereby ignition is initiated by a filament. The energy released is calculated using either a previously determined heat capacity of the filled calorimeter or the individual theoretical values of the heat capacities of the glass jacket and calorimeter liquid. The quantity of heat Q is calculated according to the following formula: QT mC mC kk HOHO 22 =× ×+ × ∆ (()())

Determination of the enthalpy of neutralisation of acids and alkali solutions (C4.3.3.3)

C4.3.3
C4.3.3.3
Determination of the enthalpy of neutralisation of acids and alkali solutions
The term ‚calorimetry‘ refers to the measurement of quantities of heat which are linked to biological, chemical or physical processes. They can be both exothermic and endothermic. Quantities of heat are determined by means of calorimeters.
When strong acids and strong alkalis react with one another, energy is given off to the surroundings in the form of heat - the so-called ‚heat of neutralisation‘.
In experiment C4.3.3.3, measured quantities of hydrochloric acid and sodium hydroxide at the same temperature are neutralised together. The temperature increase DT is measured and from that result the quantity of heat Q P is calculated:
From the quantity of heat, the following equation can be used to calculate the molar heat of neutralisation DRH m:
671

Determination of enthalpy of mixing (C4.3.3.4)

C4.3.3
CALORIMETRY
C4.3.3.4
Determination of enthalpy of mixing
When two substances A and B are mixed together without initiating a chemical reaction, heats of mixing are released or consumed. If the mixing process takes place at constant pressure, the heat of mixing is equal to the enthalpy of mixing.
The cause of the enthalpy of mixing lies in the differences of the interaction energies of the similar molecules in the pure components along with the interaction energy between the different types of molecules in the mixture. If the interaction between similar molecules is stronger than between dissimilar ones, the mixing requires energy, so the solution cools down. In the opposite case, the solution warms up.
Experiment C4.3.3.4 determines the enthalpy of mixing of two solutions with different concentrations and measures the heat of mixing released.
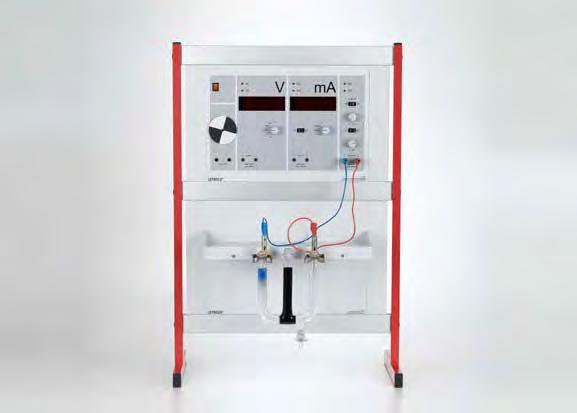
Ion transport in liquids (C4.4.1.1)
Cat.
664 091 Double U-tube, 160 mm, with 2 G4 filters
44 Connecting leads, 19 A, 25 cm,
C4.4.1
C4.4.1.1
Ion transport in liquids

Unlike solids, in which current is transported via electrons (1st order conductor), liquids can transport charges only via ions (2nd order conductor). The conductivity depends on both the number and the mobility of the ions present in the solution. Conductivity relies on the migration of ions in the electric field. Anions (negative) migrate to the positive pole, cations (positive) migrate to the negative pole. In experiment C4.4.1.1, this migration is observed directly. The coloured anion permanganate (MnO4 -) and the coloured cation copper tetraammine (Cu(NH3)42+) are used for this purpose. In this way, the direction of migration and the magnitude of the speed can be determined.

C4.4.1
CONDUCTIVITY AND IONS
C4.4.1.2
Determination of migration velocity of permanganate ions
In a solution ions migrate toward the oppositely charged pole. The speed of migration depends on many factors, including the size and hydration of the ions. Experiment C4.4.1.2 determines the speed of migration of permanganate ions.

Determination of specific conductivity (C4.4.1.3)
C4.4.1
C4.4.1.3
Determination of specific conductivity
The conductivity of a solution depends on the type and quantity of the dissolved ions. Every type of ion has a specific conductivity k , which is the reciprocal of the specific resistance V . The conductivity depends on the length of the conductor (electrode distance) l and on the cross-sectional area of the electrodes q according to the following formula:
Experiment C4.4.1.3 determines the specific conductivity of tap water. The effect of electrode distance on conductivity can also be investigated.

Electrolytic dissociation: Dependence of conductivity on electrolyte concentration (C4.4.1.4_p)
C4.4.1
CONDUCTIVITY AND IONS
C4.4.1.4_p
Electrolytic dissociation: Dependence of conductivity on electrolyte concentration
C4.4.1.4_s
Electrolytic dissociation: Dependence of conductivity on electrolyte concentration using stand material
664
665
665
The conductivity of a solution is concentration-dependent. A distinction is drawn between strong and weak electrolytes. While strong electrolytes are completely dissociated, the dissociation of weak electrolytes is highly concentration-dependent. In experiment C4.4.1.4, this behaviour is investigated in potassium chloride and acetic acid, and among other things the equivalent conductivity is determined.
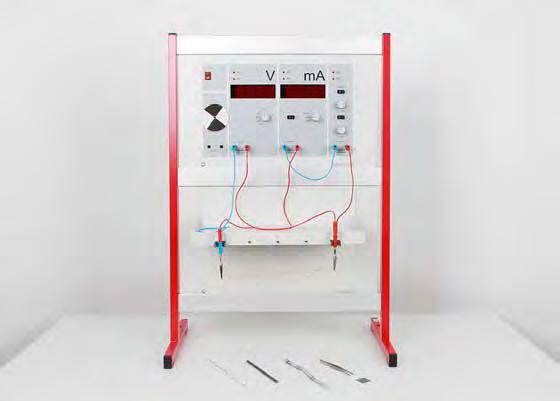
C4.4.1
C4.4.1.5
Conductivity of solids
C4.4.1.6
Temperature-dependency of the conductivity of solids
664 4071 Electrochemistry demonstration unit, CPS 11
666 425 Panel frame C50, two-level, for CPS 11
666 472 Table for electrochemistry, CPS 11
590 02Small clip plug 22
664 401 Electrochemistry accessories set 11
666 714 Cartridge burner, DIN type 1
In solids, current is transported by electrons. Only substances that have free electrons can conduct electricity (1st order conductor). In metals the electrons are in a cloud around the atomic nucleus and can easily move from one atomic nucleus to the next. They therefore conduct electric current. In experiment C4.4.1.5 different metals and non-metals are examined for their conductivity. Conductivity in solids depends on the mobility of the electrons contained. This mobility is temperature-dependent. Semiconductors, e.g. silicon, have a special position here. They only conduct electricity at higher temperatures. Conductors such as iron, on the other hand, lose their good conductivity at higher temperatures. In experiment C4.4.1.6 the conductivity of iron and silicon is measured at different temperatures.

Conductivity of aqueous solutions (C4.4.1.7)
C4.4.1
C4.4.1.7
Conductivity of aqueous solutions
Liquids can also conduct electricity. A basic requirement for this is the presence of charged particles (ions), e.g. salts dissolved in water. In experiment C4.4.1.7 different liquids and solutions are examined for their conductivity. Solutions that can conduct the electric current are called electrolytes. In the additional part, strong electrolytes are distinguished from weak electrolytes.
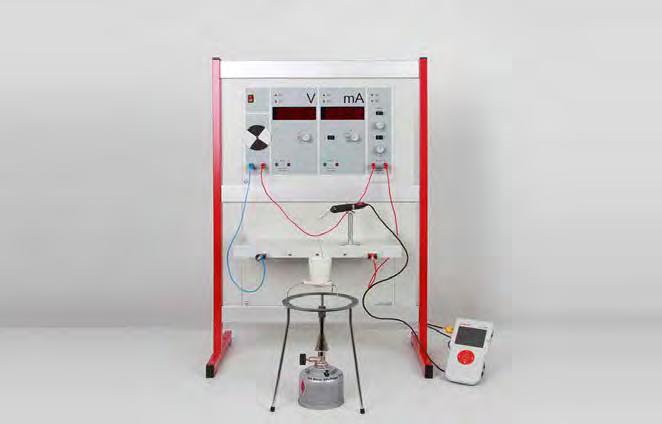
Conductivity of melts (C4.4.1.8)
664

CONDUCTIVITY AND IONS
C4.4.1.8
Conductivity of melts C4.4.1
Liquids conduct electricity when ions are present. Salts should therefore conduct electricity when they are present in liquid form, i.e. as a melt. In experiment C4.4.1.8, a salt mixture is melted and its conductivity measured. We use a mixture of lithium chloride and potassium chloride because, due to the eutectic, it has a melting point of only 355 °C.

The electrochemical series (C4.4.3.1_p)
Cat. No. Description
664 4071 Electrochemistry demonstration unit, CPS 1
664 401 Electrochemistry accessories set 1
666 425 Panel frame C50, two-level, for CPS 1
666 472 Table for electrochemistry, CPS 1
667 7977 Electronic Balance 440-3N, 200 g : 0.01 g 11
665 754 Measuring cylinder 100 ml, with plastic base11
602 032Beaker, DURAN, 150 ml, tall 4
665 212 Glass stirring rod 200 x 8 mm Ø 11
672 9600 Copper(II) sulfate-5-hydrate, 100 g 11
675 5410 Zinc sulfate-7-hydrate, 250 g 11
674 8610 Silver nitrate, 25 g 11
670 9650Lead nitrate solution, approx. 1 M, 500 ml 1*1*
671 9110 Iron(II) sulfate-7-hydrate, 250 g 11
524 005W Mobile-CASSY 2 WiFi 1
602

C4.4.3
ELECTROCHEMICAL POTENTIALS
C4.4.3.1_p
The electrochemical series
C4.4.3.1_s
The electrochemical series using stand material
additionally recommended
If a metal M is immersed in a solution of its ions Mn+, then its dissolution and deposition tendency creates a potential. MM+ne
A measurable potential difference occurs only after two different of such half-cells are combined to form a galvanic cell (voltage, electromotive force EMF).
There are noble and base metals. This property depends on the potential of the half-cell of a metal. In experiment C4.4.3.1, voltage measurements on combinations of different metals are used to create an electromotive series of the metals. In so doing, the noblest or basest halfcell can serve as reference point.
The experiment can be carried out in two variants: With the demonstration unit for electrochemistry or using CASSY and a salt bridge.

Standard potentials of metals (C4.4.3.2_p)
Cat. No. Description
664 4071 Electrochemistry demonstration unit, CPS 1
664 401 Electrochemistry accessories set 1
666 425 Panel frame C50, two-level, for CPS 1
666 472 Table for electrochemistry, CPS 1
602 043Beaker, DURAN, 150 ml, squat 3
667 7977 Electronic Balance 440-3N, 200 g : 0.01 g 11
665 754 Measuring cylinder 100 ml, with plastic base11
672 9600 Copper(II) sulfate-5-hydrate, 100 g 11
675 5410 Zinc sulfate-7-hydrate, 250 g 11
674 6910 Hydrochloric acid, 1 mol/l, 1 l 1
672
664
667
591 53 Plate electrodes copper 76 x 40 mm, set of 10
591 54 Plate electrodes, zinc, 76 x 40 mm, set of 10
571 26 Adapter leads 2/4 mm, 30 cm, blue, set of 5
Cat. No. Description

C4.4.3
C4.4.3.2_p
Standard potentials of metals
C4.4.3.2_s
Standard potentials of metals using stand material

501 861 Crocodile-clips, polished, set of 6 1
672 6800Potassium nitrate, 100 g 1 674 7920 Sulfuric acid, diluted, approx. 2 N, 500 ml 1
To determine the potential of a half-cell, a reference parameter is necessary. By international agreement, the half-cell H2/H3O+ has been established as reference cell. That standard hydrogen electrode has been arbitrarily assigned the potential E 0 = 0.00 V. In experiment C4.4.3.2, a standard hydrogen electrode is used to measure the standard potentials of various metals. This can be done either with the demonstration unit for electrochemistry or with CASSY and the prefabricated standard hydrogen electrode HydroFlex.

Standard potentials of non-metals (C4.4.3.3)
C4.4.3
C4.4.3.3
Standard potentials of non-metals
In experiment C4.4.3.3, the standard potentials of different nonmetals are measured. For this purpose, the halogens are first produced from the salts by electrolysis using the electrochemistry demonstration unit. In the solution, the potential of the elementary halogens can then be measured against the standard hydrogen electrode for a short time.
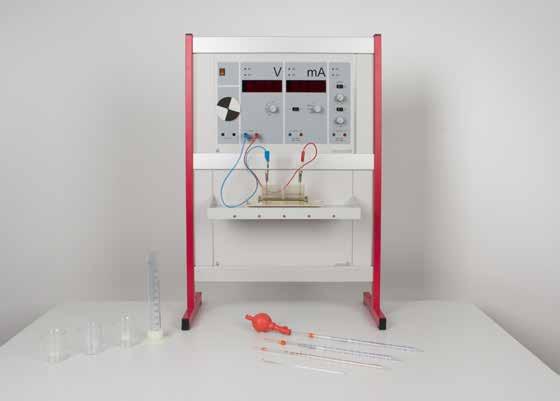
Concentration potentials (Nernst equation) (C4.4.3.4)
664
C4.4.3
C4.4.3.4
Concentration potentials (Nernst equation)
If two similar half-cells which differ only in the concentration c of their electrolyte solutions are combined, then a potential difference also forms between those half-cells. The general relationship is described in the Nernst equation:
The potential E therefore depends on the temperature in Kelvin T and on the proportionality factor R , the universal gas constant. Other parameters which play a role include the ion valence n and the Faraday constant F. The dependence on concentration and temperature are investigated in experiment C4.4.3.4.
672
673

C4.4.3
ELECTROCHEMICAL
C4.4.3.5
Temperature dependency of the potential (Nernst equation)
In a galvanic element that consists of identical half cells with different temperatures, a potential difference can be measured. The system aims to even the temperature differences which leads to solution and precipitation of copper in the half cells. In experiment C4.4.3.5, a galvanic element is set-up that consists of identical half cells with different temperatures. The potential difference is measured over time.
665
673


C4.4.4
C4.4.4.1_a
The Daniell cell
C4.4.4.1_b
The large Daniell cell
Cat. No. Description
664 4071 Electrochemistry demonstration unit, CPS 11
666 472 Table for electrochemistry, CPS 1
666 425 Panel frame C50, two-level, for CPS
664 401 Electrochemistry accessories set
665 754 Measuring cylinder 100 ml, with plastic base1
602 023
Boro 3.3, 150 ml, squat
664 132 Beaker, Boro3.3, 600 ml, squat
665 212 Glass stirring rod 200 x 8 mm Ø
665 997 Graduated pipette 10 ml 22
666 003 Pipetting ball (Peleus ball) 11
675 3400 Water, pure, 1 l 11
672 9660Copper(II) sulfate solution, 1 mol/l (15 %), 500 ml1
675 5510
673 8411
664 397
672
sulfate solution, approx. 1 M, 500 ml
hydroxide solution, 0.1 mol/l, 1 l
A galvanic cell comprises two half-cells which are connected to each other via an electrically conductive element. Each half-cell contains one electrode which is immersed in an electrolyte. The electrode material can contain metals or non-metals.
In the galvanic cell, the process is the reverse of electrolysis. Chemical energy is converted into electrical energy.
Experiment C4.4.4.1 studies the characteristics of a Cu/Zn cell (Daniell cell). In a Daniell cell, a copper plate is immersed in a copper(II)-sulfate solution and a zinc plate is immersed in a zinc sulfate solution. The solutions are separated from each other by a diaphragm (porous partition wall). The redox reaction does not begin until the copper plate and the zinc plate are connected by an electrically conductive cable.
The Leclanché cell with Electrochemistry demonstration unit (C4.4.4.2_a)

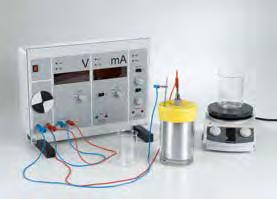
C4.4.4
C4.4.4.2_a
The Leclanché cell with Electrochemistry demonstration unit
C4.4.4.2_b
The large Leclanché cell
Cat. No. Description
664 4071 Electrochemistry demonstration unit, CPS 11
666 425 Panel frame C50, two-level, for CPS
666 472 Table for electrochemistry, CPS 1
664 401 Electrochemistry accessories set 1
664 132 Beaker, Boro3.3, 600 ml, squat
602 023 Beaker, Boro 3.3, 150 ml, squat
665 217 Glass stirring rod, 500 mm x 8 mm diam., set of 101
ADA CB501 Compact scale 500 g : 0.1 g
665 754 Measuring cylinder 100 ml, with plastic base1
665 751 Measuring cylinder 10 ml, with plastic base
666 584 Filtration stand for two funnels
665 005Funnel, Boro 3.3, 100 mm diam.
609 082Folded filter 125mmØ Typ: 595
The Leclanché cell is a zinc/coal battery. Here the negative pole is the steel-jacketed battery cup made of zinc. The positive pole is formed by a graphite bar which is surrounded by a mixture of graphite powder and manganese dioxide. An ammonium chloride solution (20 %) thickened by starch serves as the electrolyte. This prevents the cell from spilling out.
Experiment C4.4.4.2 demonstrates the principle of this dry cell. The voltage of the cell is first measured with the electrochemistry demonstration unit in the no-load condition. The Leclanché cell is then connected to the motor, and the voltage and current are measured simultaneously.

The Magensium Air Element
The magnesium-air cell is a galvanic cell. It is composed of a halfcell with a magnesium electrode in a sodium-chloride-solution and a half-cell containing a membrane, which enables the use of atmospheric oxygen for the redox reaction. Since atmospheric oxygen can continuously be supplied, the magnesium-air cell is considered a fuel cell.
In this cell, magnesium is oxidized at the anode, the electrons migrate towards the cathode, drive an electrical load and finally react with oxygen. Overall magnesium hydroxide is formed under the release of electrical energy.
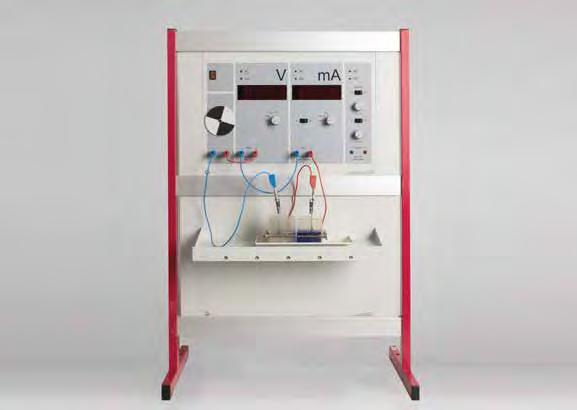
Influence of electrolyte concentration on the Daniell element (C4.4.4.4)
C4.4.4
C4.4.4.4
Influence of electrolyte concentration on the Daniell element
C4.4.4.5
Influence of the electrode gap on the Daniell element
Cat. No. Description
664 4071 Electrochemistry demonstration unit, CPS 11
666 425 Panel frame C50, two-level, for CPS 11
666 472 Table for electrochemistry, CPS 11
664 401 Electrochemistry accessories set 11
665 754 Measuring cylinder 100 ml, with plastic base11
602 023 Beaker, Boro 3.3, 150 ml, squat 42
664 115 Beaker, DURAN, 600 ml, tall 1
665 212 Glass stirring rod 200 x 8 mm Ø 11
665 997 Graduated pipette 10 ml 22
666 003 Pipetting ball (Peleus ball) 11
675 3400 Water, pure, 1 l 11
672 9660Copper(II) sulfate solution, 1 mol/l (15 %), 500 ml11
675 5510 Zinc sulfate solution, approx. 1 M, 500 ml 11
673 8411 Sodium hydroxide solution, 0.1 mol/l, 1 l 11
664 132 Beaker, Boro3.3, 600 ml, squat 1
In a Daniell element, electrical energy is generated with zinc and copper electrodes. The voltage supplied by such a galvanic element depends on the material of the electrodes and solutions. The current, on the other hand, depends on the concentration of the solutions. This will be investigated in experiment C4.4.4.4. Not only the type of electrode material and the concentration of the electrolyte solutions can have an influence on the performance of the Daniell element and thus of every galvanic cell. In experiment C4.4.4.5, therefore, the influence of the distance between the two electrodes is investigated. The further apart they are, the greater the internal resistance of the galvanic element becomes and the performance decreases. The ions in solution then have to cover a greater distance.
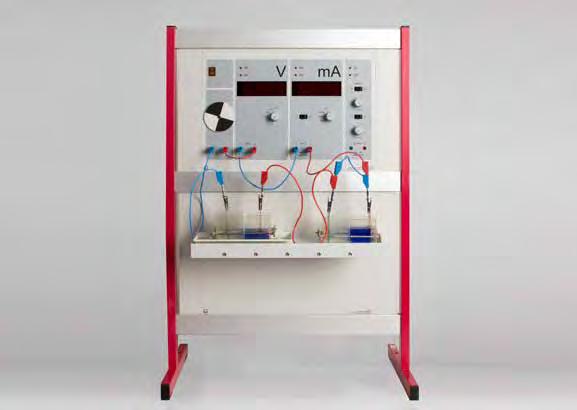
Serial and parallel connection of elements (C4.4.4.6)
C4.4.4.6
Serial and parallel connection of elements
A simple galvanic element such as the Daniell element usually does not provide enough power to operate loads. For this reason, in batteries several elements are connected in parallel and in series. In experiment C4.4.4.6, the influence of parallel and series connection on the performance of the Daniell element will be investigated.
665
675
673
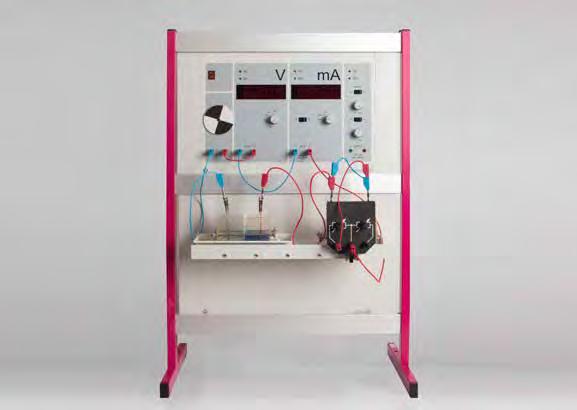
Recording characteristics of a Daniell element with the electrochemistry demonstration unit (C4.4.4.7_a)
C4.4.4
C4.4.4.7_a
Recording characteristics of a Daniell element with the electrochemistry demonstration unit
The performance of galvanic elements is represented by characteristic curves. In experiment C4.4.4.7 the load characteristic and the power curve of a Daniell element are recorded. The optimum working resistance can then be determined.

C4.4.4
C4.4.4.8 Edison
Thomas Edison patented his accumulator in 1908. This was the first steel secondary element patented. In a secondary element or accumulator, the back reaction of the electricity generating reaction is possible. Thus, the cell can be charged and discharged. The Edison accumulator was used frequently up to the 1970ies. Today, modern accumulators include the Li-ion- or the Ni metalhydride battery.
In this experiment, the Edison accumulator is set-up, charged and discharged.

Electrolytic polarisation (C4.4.5.1_p)
664 4071 Electrochemistry demonstration unit, CPS 1
666 425 Panel frame C50, two-level, for CPS 1
666 472 Table for electrochemistry, CPS 1
665 754 Measuring cylinder 100 ml, with plastic base1
664 401 Electrochemistry accessories set 1
673 8410 Sodium hydroxide solution, 0.1 mol/l, 500ml 11
672 9660Copper(II) sulfate solution, 1 mol/l (15 %), 500 ml11
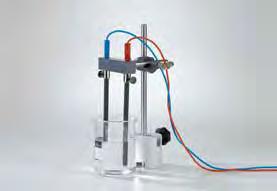
C4.4.5
ELECTROLYSIS
C4.4.5.1_p
Electrolytic polarisation
C4.4.5.1_s
Electrolytic polarisation using stand material
When a direct electric current flows through an electrolyte it provokes a chemical reaction. The resulting changes in the electrolyte and the electrodes are referred to as ‘electrolysis‘.
A chemical reaction can take place because the direct current provides electrons to the solution locally at the negative pole (cathode) and at the same time electrons are transferred from the solution into the electrode at the positive pole (anode). As a result, reduction takes place at the cathode and oxidation at the anode.
x 40 mm, set of
591 61 Plate electrodes, carbon, 76x40 mm, set of 5
664 420 Mesh electrodes, platinum, 55 x 40 mm, set of 2
664 131 Beaker Boro 3.3,
In experiment C4.4.5.1 the voltage during an electrolysis is raised starting from zero. Note that there is no significant flow of current until a certain voltage level is reached. That voltage is called the decomposition voltage or the deposition voltage. It is the combination of the polarisation voltage and the overvoltage. Both parameters depend on the electrode material. Different electrode materials are investigated in experiment C4.4.5.1.

of
Cat. No. Description
666 446 Electrolysis apparatus, CPS
666 425 Panel frame C50, two-level, for CPS
382 35Thermometer, -10...+50 °C/0.1 K
531 831 Joule and wattmeter
521 546 DC Power Supply 0...16 V/0...5 A 11
501 46 Connecting leads 19 A, 100 cm, red/blue, pair11
501 45 Connecting lead 19 A, 50 cm, red/blue, pair 11
665 755 Measuring cylinder 250 ml, with plastic base1
674 7920 Sulfuric acid, diluted, approx. 2 N (= 10 %), 500 ml11
664 350 Water electrolysis apparatus 1
602 953Measuring cylinder, Boro 3.3, 100 ml, glass base 1

C4.4.5
ELECTROLYSIS
C4.4.5.2_p
Determination of the Faraday constant
C4.4.5.2_s
Determination of the Faraday constant using stand material
In electrolysis, the electrical conduction processes are linked to a material deposition. The quantity of material deposited is proportional to the transported charge Q which flowed through the electrolyte. In this respect, the process is an application of Faraday‘s law.
z = valency number of ions of the substance F = Faraday constant
Experiment C4.4.5.2 determines the Faraday constant F. For this purpose, a Hofmann voltameter is used to produce a certain quantity of hydrogen. The number of moles n of hydrogen atoms deposited can be calculated from the volume V using the ideal gas equation. At the same time, the amount of electrical charge Q required for this can be determined from the electrical work W The experiment can be conducted using CPS or standard stand material.
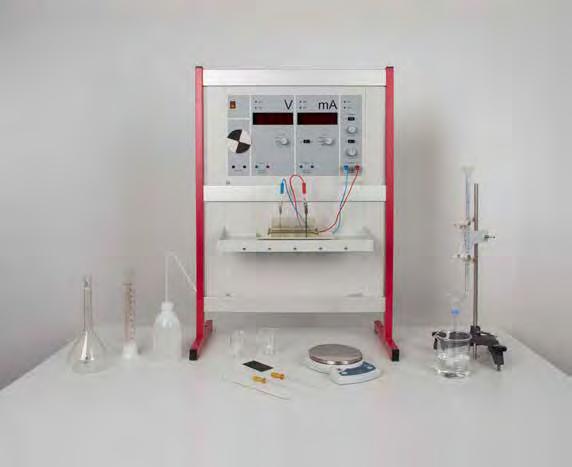
C4.4.5
ELECTROLYSIS
C4.4.5.3
In 1833 Michael Faraday described the laws of electrolysis. He showed that there is a quantitative relationship between the amount of charge and the conversion of a chemical reaction at the electrode during electrolysis.
In this experiment, the Faraday laws are to be checked by electrolysis of aqueous zinc iodide solution and the Faraday constant F is to be determined. Zinc iodide is used because the products zinc and iodine can be quantitatively detected by weighing or by titration.
675
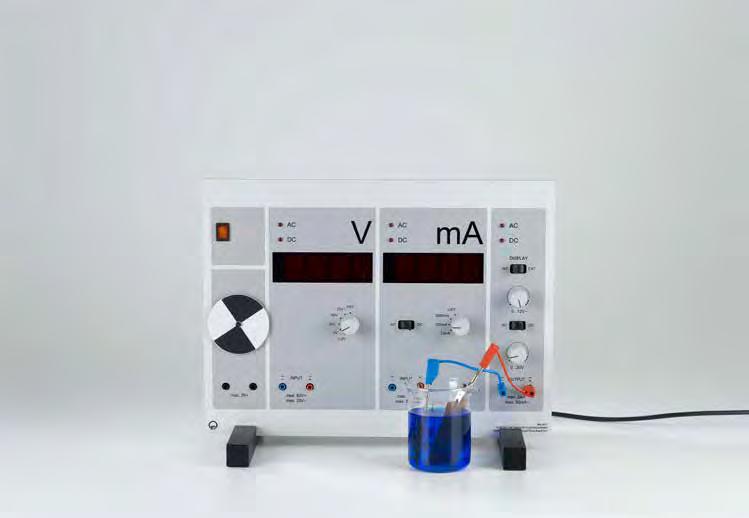
Galvanisation of a metal (C4.4.6.1)
C4.4.6
GALVANIC PROCESSES IN ENGINEERING
C4.4.6.1
Galvanisation of a metal
Galvanisation is a process in which objects are coated with a thin layer of metal by electrolytic means. Objects can be copperplated, chrome-plated or silver-plated in this way.
In experiment C4.4.6.1, a thin layer of copper is applied to a metal object (e.g. a key or a nail) by means of galvanisation. In so doing, the object is wired as a cathode and immersed in a copper sulfate solution. A copper plate serves as the anode, which is also immersed in the copper sulfate solution. The process is started by applying a direct current source (3V).
The Eloxal process (C4.4.6.2)
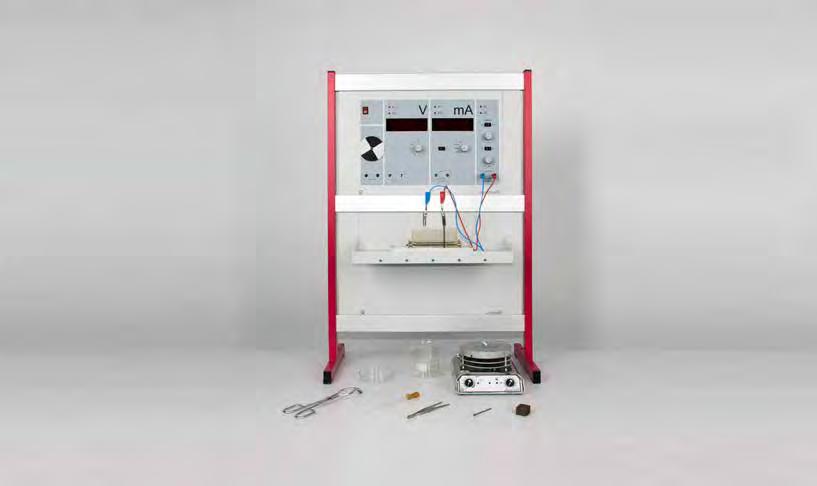
C4.4.6
GALVANIC PROCESSES IN ENGINEERING
C4.4.6.2 The Eloxal process
664
Anodic oxidation of aluminium treats the surface of aluminium in a way that it is a robust and attractive material. Using electolysis, the surface of aluminium is oxidised. The resulting oxide layer is very hard and can even be dyed.
In this experiment, aluminium is oxidised. The different properties of the non-oxidised and oxidised aluminium are compared.
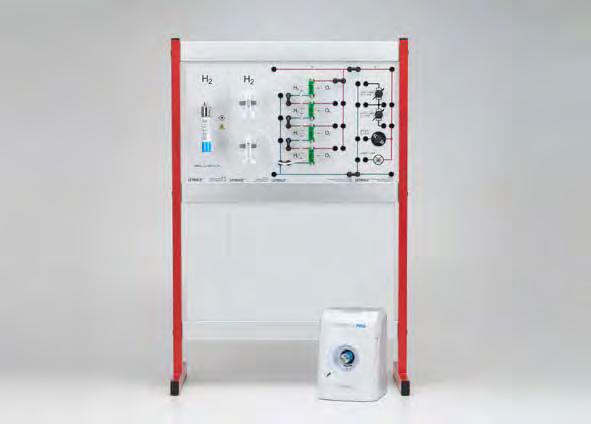

C4.4.7
C4.4.7.1
Investigation of a PEM fuel cell stack
C4.4.7.2
Recording the characteristic curves of a PEM fuel cell stack
Fuel cells produce extremely efficient electric current in a „silent combustion“. Fuels are easily oxidised compounds such as hydrogen, hydrazine or methanol. The oxidation reaction takes place on a catalyst, usually platinum, over which the current generated is also carried. Because the fuels can be supplied continuously, it is possible - unlike with batteries - to generate electric power continuously.
Fuel cells are considered to be a technology of the future, because they are an extremely efficient means of converting the energy stored in a chemical compound into electric power. Unfortunately, however, it is not always easy to implement fuel cells in practical applications or to handle the fuels, which are usually gases.
PEM fuel cells contain a proton-conducting membrane which separates two half-cells. They require no other electrolytes, and that means that they can function with almost no liquid. Due to the low voltage that an individual fuel cell supplies, many fuel cells are wired together to form a „stack“. In experiment C4.4.7.1, the function of such a fuel cell stack is studied and various circuits are compared with one another.
* additionally recommended
The performance of fuel cells is analyzed by recording so-called characteristic curves. In experiment C4.4.7.2, the characteristic curves of voltage and output are recorded for the PEM fuel cell stack. The individual cells are wired in series in part a of the experiment and they are wired in parallel in part b of the experiment.
The alkaline fuel cell/The detonating gas cell (C4.4.7.3)
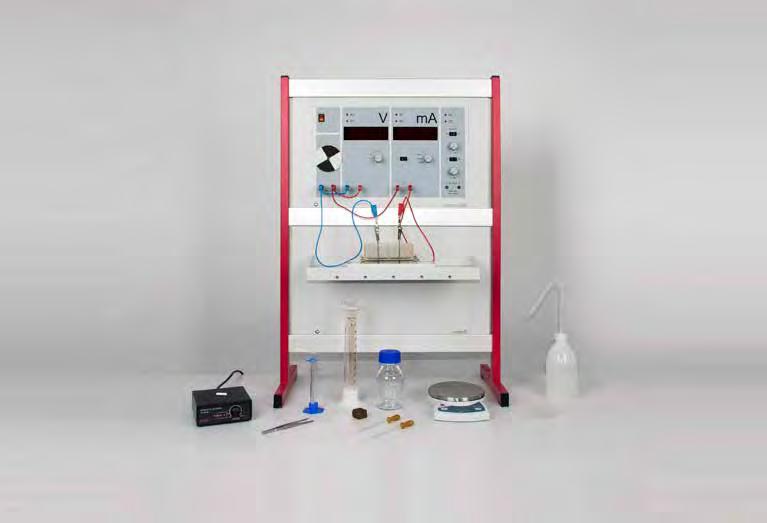
664
C4.4.7.3
The alkaline fuel cell/The detonating gas cell C4.4.7
A very simple fuel cell is the alkaline fuel cell. In this fuel cell, potassium hydroxide solution is used as the electrolyte. Hydrogen is used as fuel. It is oxidised on palladinised Nickel electrodes. In this experiment, such a fuel cell is set up. Hydrogen and Oxygen are generated by electrolysis. Subsequently, the fuel cell is connected to a consumer and electric energy can be withdrawn.

of the osmotic pressure of a sugar solution (C4.6.2.1)
662
664
665
665
667
665
674
C4.4.8
OSMOSIS
C4.6.2.1
Determination of the osmotic pressure of a sugar solution
Osmosis is a diffusion process in one direction only which occurs when two similar solutions of different concentration are separated by a semi-permeable membrane. Only molecules of the solvent can diffuse through that membrane. Molecules or ions of a dissolved substance, which are too large, are held back. In so doing, more solvent molecules diffuse into the area of higher concentration than vice versa to create equalised concentrations on both chambers.
Experiment C4.6.2.1 uses the osmometer to demonstrate the principle of osmosis. This process plays a key role in regulating the volume and water of cells. The two chambers contain different concentrations of a solution and are separated by a semipermeable membrane. The solvent flows osmotically into the solution of higher concentration. This raises the liquid level of that solution in the open system. The higher the concentration of the solution, the greater the water ingress. It slows to a stop when the hydrostatic pressure of the water column in the capillary tube is exactly equal to the osmotic pressure.

Production of sulfuric acid by the contact method (C5.1.1.1)
C5.1.1
C5.1.1.1
Production of sulfuric acid by the contact method
665
Experiment C5.1.1.1 demonstrates the technical production of sulfuric acid by the contact method. The sulfur dioxide produced from the combustion of sulfur is oxidised by a catalyst to sulfur trioxide in the reaction tube. That is then led to water or sulfuric acid.
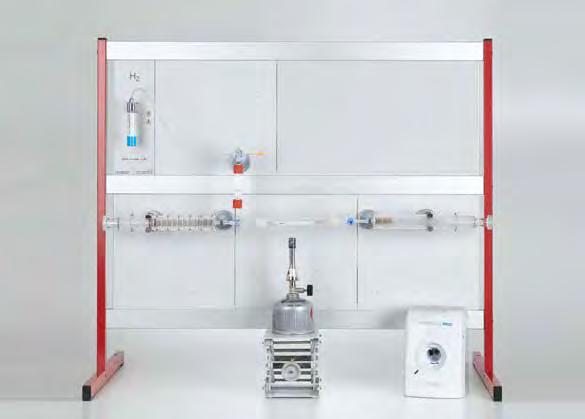
Synthesis of ammonia by the Haber-Bosch process (C5.1.1.2)
664
C5.1.1
C5.1.1.2
Synthesis of ammonia by the Haber-Bosch process
Experiment C5.1.1.2 uses the catalyst developed by Mittasch (iron
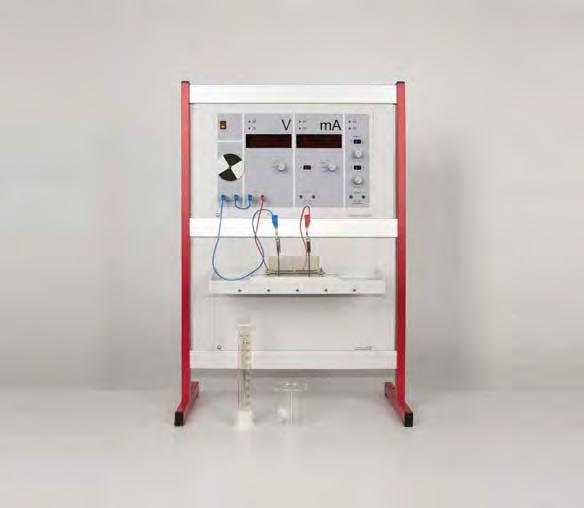
Chlorine-alkali electrolysis (C5.1.1.3)
C5.1.1
C5.1.1.3
Chlorine-alkali electrolysis
Base chemicals serve as starting materials for many industrial products. In most cases they are produced in large quantities (more than 1 million tonnes per year) in optimised industrial plants.
The chlorine-alkali electrolysis is used to produce chlorine gas, hydrogen, and sodium hydroxide from a salt solution. Today, it is still the best way to produce these chemicals from a sodium chloride solution.
In the experiment, the chlorine-alkali electrolysis is conducted. Therefore, a sodium chloride solution is electrolysed. The formed chlorine gas and sodium hydroxide solution can be detected easily.

Extraction of iron by the blast furnace process (C5.1.2.1)
661
656
C5.1.2
EXTRACTION
C5.1.2.1
Extraction of iron by the blast furnace process
Metal is certainly the most commonly used material in the manufacture of tools, weapons and jewellery. Hardly any other material has so profoundly marked human development.
Iron does not exist on the Earth as an element, but rather in the form of its oxides and sulphides in iron ore. They are the starting materials for the technical extraction of pig iron in the blast furnace.
The blast furnace operates at 1900 °C in order to smelt iron from iron ore. To attain that temperature, coke (and not coal) is used as fuel, and the fire inside the furnace is fanned with hot air at 1200 °C to 1300 °C degrees. Lime is added as an additional component; it binds contaminants. The blast furnace is fed from the top, so that alternating layers of coke and iron ore are formed.
The highest temperature occurs in the lower part of the furnace. The liquid iron, on which the slag floats, collects at the base. About once every two or three hours, the furnace is „tapped“. First the slag is allowed to flow out, and then the glowing yellow pig iron at about 1450 °C. The toxic waste gases (blast furnace gases) rise, are fed into a gas purification system, and heat the supply air for the furnace.
Experiment C5.1.2.1 uses the blast furnace model to demonstrate the reduction of iron ore in a way that is similar to the industrial scale process. Depending on the ore used and the reaction conditions (temperature, air supply, additives), the resulting reaction product is a mixture of different proportions of slag, partially reduced iron ore (Fe3O4) and metallic iron.
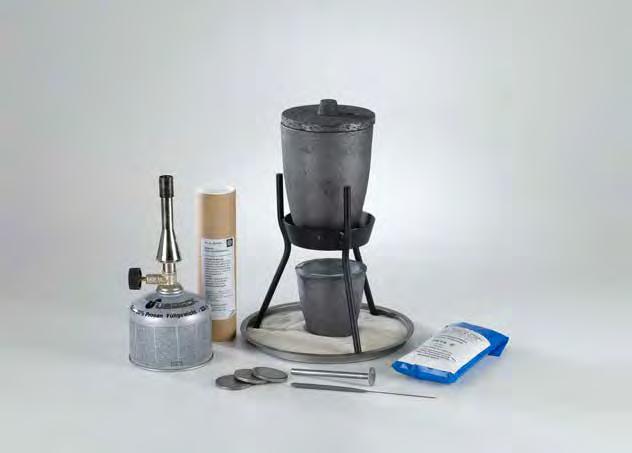
C5.1.2
C5.1.2.2
The thermite process
Experiment C5.1.2.2 demonstrates the principle of the thermite process. In engineering, the thermite process is used to weld railway tracks together. A mixture of aluminium grit and iron(II, III) oxide is added to the apparatus and lit with an ignition rod. Liquid iron and aluminium oxide form in a very exothermic reaction. The iron has a higher density than aluminium oxide and so it sinks down in the melt.
FeO+2Al2Fe+A23lO23 →
Because aluminium releases immense quantities of energy in the reaction with oxygen, the reaction needs only to be started with an igniter. The energy released drives the rest of the process, and along with that it also liquefies the resulting iron.

EXTRACTION
Copper refining INDUSTRIAL-SCALE
C5.1.2.3
Raw copper contains traces of other elements. These can be removed via electrolysis. To do so, raw copper is electrolysed in a copper sulfate solution. The raw copper is used as the anode. Here, the ignoble elements and copper will dissolve. At the cathode (also made from copper), pure copper is deposited. In this experiment, the copper refinement is conducted using a brass electrode (copper, „contaminated“ by sinc).

C5.2.4
PIGMENTS AND DYESTUFFS
C5.2.4.1
Production and use of indigo
Synthetic dyes have been known since the middle of the 19th century. Many major chemical companies started out as dye producers. The first dyes were extracted from tar. Today most dyes are based on crude oil.
Chemical compounds are coloured when they absorb wavelengths from the visible range of the spectrum. The compound then appears in the complementary colour of the absorbed wavelength. Along with their colour, the ability to colour materials more or less colourfast is a decisive feature of dyes. That colouring is done by binding the dyes to the carrier materials or having the dyes penetrate into them. This, too, can be influenced by chemical means.
Experiment C5.2.4.1 synthesizes indigo, the dye used to colour jeans. Developed by Adolf von Baeyer in 1870, this synthesis was one of the first dye syntheses to be applied on an industrial scale. The educt used is nitrobenzaldehyde, which condenses with acetone under base conditions. The reduced, soluble leuco form of the dye is insolubly anchored in the tissue through oxidation by air.
CHEMISTRY AND

Catalytic purification
665
C5.3.1
WASTE GAS PURIFICATION
C5.3.1.1
Analysis of waste gases
C5.3.1.2
Catalytic purification of automobile exhaust gases
The fossil energy carriers coal, oil and natural gas are primarily used as fuels. The combustion processes generate waste gases which enter the atmosphere and are harmful to the environment and to human health. Carbon dioxide (CO2) intensifies the greenhouse effect, for example, and sulfur dioxide (SO2) and nitrogen oxides (NOx) cause acid rain. Today pollution emissions are strictly controlled. Plant operators must reduce their emissions. Catalytic converters are a mandatory feature of automotive exhaust systems.
Under ideal conditions, the combustion of hydrocarbons would generate only water and carbon dioxide. When it involves a mixture of different fuels, e.g. petrol, then combustion can also produce nitrogen oxides or sulphur oxides. Experiment C5.3.1.1 uses detection tubes to test for the presence of such byproducts in different waste gases.
The so-called ‚three-way catalyst‘ removes the three most important toxic substances from automotive exhaust simultaneously: unburned hydrocarbons, carbon monoxide and nitrogen oxides. It consists of a ceramic carrier to which noble metals such as platinum and palladium are applied. The reactions which take place include the following:
In experiment V5.3.1.2, waste gases are purified with a three-way catalyst. The waste gas used in the investigation can be either automotive exhaust or a self-made mixture of waste gases.
CHEMISTRY AND THE ENVIRONMENT

Greenhouse effect (C5.3.2.1)
C5.3.2
C5.3.2.1
Greenhouse effect
The Earth‘s climate is determined by a complex interaction of numerous factors. Many of those factors mutually affect and strengthen one another. As a result, the climate is subject to constant fluctuations on all time scales, from decades to millions of years. Today humans are intervening in this self-regulating system to a massive extent.
In experiment C5.3.2.1, the IR-CO2 experimentation kit is used to demonstrate the absorption of infrared (IR) radiation by CO2 in the wavelength range from 4100 to 4300 nm. The short-wave radiation of the Sun penetrates water vapour, carbon dioxide, ozone, nitrous oxide and methane in the Earth‘s atmosphere and reaches the surface of the Earth unimpeded. The long-wave heat radiation is absorbed. Acting like the glass of a greenhouse, the greenhouse gases impede the release of energy from the Earth and cause heat to build up. Only a small part of the heat radiation is emitted directly into space - the far greater share is reflected back toward the surface of the Earth. This is referred to as the natural greenhouse effect. The proportion of greenhouse gases is changing as a result of human activity. The associated temperature increase is referred to as the anthropogenic greenhouse effect.
CHEMISTRY AND THE ENVIRONMENT
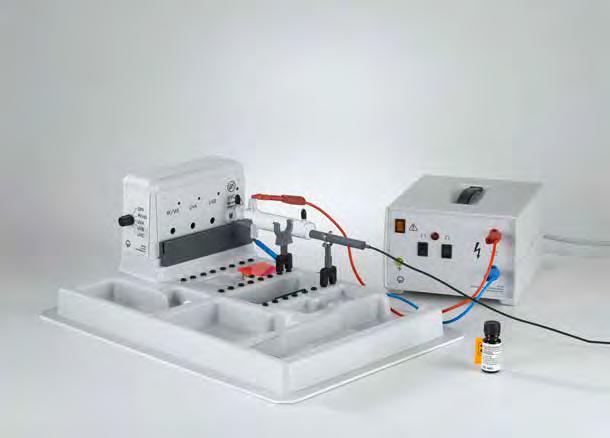
Ozone hole problem (C5.3.2.2)

C5.3.2
C5.3.2.2
Ozone hole problem
In experiment C5.3.2.2, the UV-IR-VIS experimentation kit is used to demonstrate the absorption of UV-C radiation by ozone and the formation and decomposition of ozone. The ozone layer in the stratosphere (at a height of 15 to 50 km) is vitally important to life on Earth. Without its protective effect, strong shortwave UV radiation would make life outside of water impossible. The ozone layer acts as a filter for radiation from 220 to 310 nm. As a result it completely absorbs UV-C radiation (220 nm to 280 nm) and absorbs most of the UV-B radiation (280 nm to 320 nm). For that reason, a reduction in the ozone concentration (ozone depletion, „ozone hole“ ) is increasing the intensity of biologically effective UV-B radiation. This can damage plants, thereby reducing harvest yields. Phytoplankton (types of algae at shallow ocean depths) are also affected - an important link in the food chain of the sea. Because it also absorbs a considerable quantity of carbon dioxide, it represents an integral part of the carbon cycle and plays a role in the greenhouse effect. Ozone forms in the stratosphere by the effect of hard UV radiation on oxygen.

Recording a breakthrough curve of activated carbon filters (C5.3.3.1)
C5.3.3.1
Recording a breakthrough curve of activated carbon filters
Water can be purified with the help of activated carbon. Impurities, e.g. organic substances, adsorb on activated carbon and are thus filtered out of the water. A filter loses its filtering properties when it can no longer adsorb a substance. Then a so-called breakthrough occurs and the filter no longer has any filtering properties for this impurity.
In this experiment the breakthrough curve of the dye indigocarmine on activated carbon is determined. For this purpose, the dye is placed on activated carbon and the colour of the filtrate is measured until it returns to the initial value of the unfiltered solution.
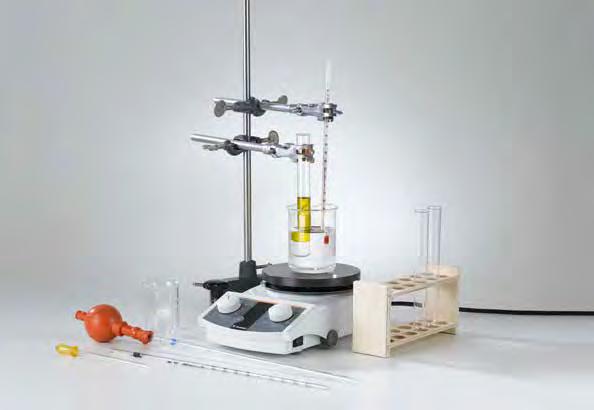
Production of fuel from rapeseed oil (C5.4.1.1)
666 8471 Magnetic stirrer with hotplate
666 851 Stirring magnet 25 mm x 6 mm Ø, circular
666 850 Stirring magnet, 15 mm x 5 mm diam.
602 004Test tubes, DURAN, 20 x 180 mm, set of 100 1
667 053Test tube rack, for 10 tubes, 22 mm diam.
664 103 Beaker, DURAN, 250 ml, squat
602 022 Beaker Boro 3.3, 100 ml, squat
300 02Stand base, V-shaped, small
301 27 Stand rod 50 cm, 10 mm
665
C5.4.1
C5.4.1.1
Production of fuel from rapeseed oil
C5.4.1.2
Analysis of fuel from rapeseed oil
300 41 Stand rod, 25 cm, 12 mm Ø
608 310 Evaporating dish 24 ml, 60 mm dia. 3 672 2520 Wooden turnings
665 994 Graduated pipette 1 ml
00001 Stopwatch, digital
672 1740 Heating oil, 250 ml
additionally required: rapeseed oil, cardboard1 additionally required: biodiesel from rapeseed oil produced in experiment C5.4.1.1 rapeseed oil lighter
Rising energy demand ushered in by the industrial age in combination with the continuously increasing world population have caused worldwide consumption of fossil fuels such as oil, natural gas and coal to increase by more than twenty-fold over the past 100 years. The resulting shortage of fossil fuels demands, along with more frugal use of energy, the search for equivalent renewable sources of energy, including the suitable eco-friendly fuels.
In experiment C5.4.1.1, sodium methoxide is used to produce biodiesel from rapeseed oil. In this reaction, the rapeseed oil is first split into glycerine and fatty acids, and then esterified with methanol (transesterification) in a second step. The rapeseed acidmethylesters produced in this way represent the actual biodiesel. In experiment C5.4.1.2 rapeseed oil is analysed. For this purpose, the viscosity and inflammability of rapeseed oil, diesel fuel, and rapeseed oil are compared.

C6.2.2.3
Production of yoghurt
For more information on this experience, see page 168.

Test for reducing sugar - Fehling’s reaction (C6.1.1.1)
C6.1.1
C6.1.1.1
Test for reducing sugarFehling’s reaction
Carbohydrate is the collective name for a broad-ranging group of natural substances to which all types of sugar, starch and cellulose belong. They have the general molecular formula Cn(H2O)m (n and m either equal or only slightly different), which is why they were previously erroneously regarded as „hydrates of carbon“. Carbohydrates are polyalcohols, in which a primary or a secondary hydroxyl group is oxidised to the aldehyde group or the ketone group (carbonyl group).
Fehling‘s solution was developed by Herrmann Fehling in 1848. It is a reaction for the detection of reducing groups, such as aldehyde functions, for example. It makes it possible to differentiate between reducing and non-reducing sugars. Originally it was also used to determine blood sugar content in diabetics by means of titration. Experiment C6.1.1.1 uses the Fehling reagent to analyse glucose, fructose and sucrose.
665
661
Enzymatics: Splitting urea with urease (C6.1.2.1)
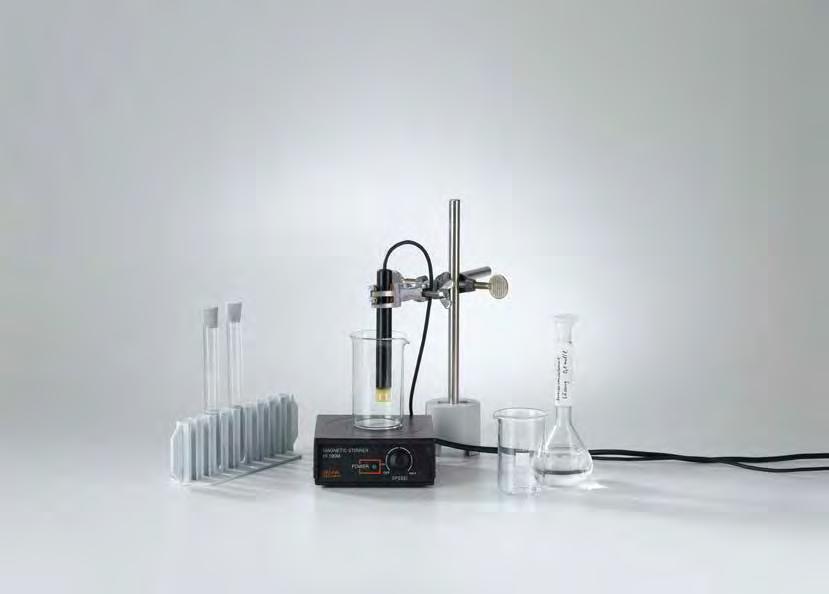
C6.1.2
AMINO
C6.1.2.1
Enzymatics: Splitting urea with urease
C6.1.2.2
Michealis-Menten kinetics using the enzyme urease
602
664 043Test tubes, Fiolax,
667
667
667
sulfate-5-hydrate, 100 g 1
675 3400 Water, pure, 1 l 11
Cat. No. Description
666 543 Double, crossed boss head, 0...16 mm 1
666 851 Stirring magnet 25 mm x 6 mm Ø, circular 5
661 243 Wash bottle PE 500 ml 1 additionally required: PC with Windows 7 or higher with WIFI or USB connection 11
Proteins are the building blocks of the cell. A distinction is drawn between scaffold proteins, which provide stability, and globular, soluble proteins. The subgroup of globular proteins includes enzymes, which catalyse reactions. They play an important role in the digestion of food, for example.
Experiment C6.1.2.1 takes a closer look at the enzyme urease. Urease splits urea into ammonia and carbonate ions. Since the urea solution does not conduct electricity, but a solution with ammonia and carbonate does, the course of the reaction can be recorded with conductivity measurements. The maximum rate of reaction and the reaction order are determined. Also an inhibitor is tested.
In experiment C6.1.2.2 the kinetics of the enzyme urease are examined. The rate of the reaction with different starting concentration is measured. Applying Michaelis-Menten kinetics, the maximal reaction rate v max and the michaelis constant K m can be determined.

Determination of the calorific value of olive oil with a demonstration calorimeter (C6.1.4.1)
C6.1.4
C6.1.4.1
Determination of the calorific value of olive oil with a demonstration calorimeter
In experiment C6.1.4.1, the calorific value of olive oil is determined. For this purpose, olive oil is burned in an O2 atmosphere and the temperature rise is measured in the calorimeter. A filament is used to ignite the oil. The energy released is calculated using either a previously determined heat capacity of the filled calorimeter or the individual theoretical values of the heat capacities of the glass jacket and calorimeter liquid. The quantity of heat Q is calculated according to the following formula:
Here DT represents the temperature difference, m k and m (H2O) are the mass of the calorimeter and of the water, and C k and C (H2O) are the heat capacities of the glass apparatus and the water. In order to calculate the heat of combustion DH , the ignition energy, which also contributed to the heating of the apparatus, must be subtracted. The quantity of heat is then expressed relative to one mol of substance.
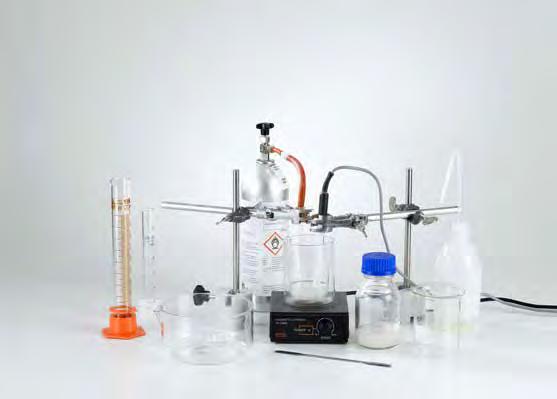

C6.2.1.1
Yeast fermentation - Test of oxygen consumption
In biotechnology, products are produced with the aid of microorganisms. This occurs in large vessels known as bioreactors. Bioreactors can be operated in batches (batch processing) or continuously. In any case, successful culture relies on understanding the growth conditions of microorganisms.
Experiment C6.2.1.1 verifies the respiration in a yeast fermentation by measuring the oxygen consumption. For this purpose, a yeast suspension is saturated with oxygen. Then the oxygen supply is shut off and the oxygen saturation is tracked.
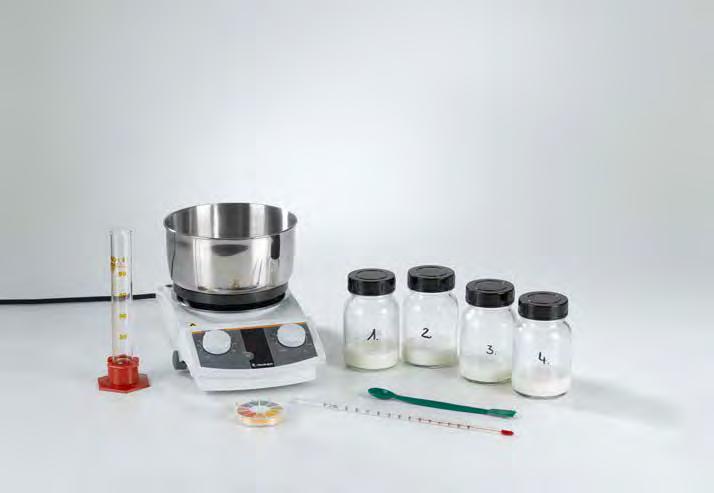
Production of yoghurt (C6.2.2.3)
C6.2.2.3 Production of yoghurt
For thousands of years now, humans have been using biotechnology to produce food, textiles and other commodities. A whole series of perfectly ordinary, everyday things – including leavened bread, yoghurt, cheese, wine, beer and vinegar – are produced with the help of cultivated microorganisms. Biotechnology is a technology which uses the living organism or parts of it to manufacture or modify products.
In experiment C6.2.2.3, yoghurt is produced from milk. If some yoghurt or isolated cultures of Lactobacillus bulgaricus (lactic acid bacteria) and possibly Streptococcus themophilus are added to milk, then the milk will become yoghurt. Yoghurt is the end product of an anaerobic bacteria metabolism. Lactic acid bacteria ferment in the lactose contained in the milk. The latter is first split into glucose and galactose by the enzyme lactase. Those cleavage products are then transformed into lactic acid by glycolysis and lactic acid fermentation.
Acetic
Acetone
Acid-base
Acidity
Adhesive
40-41, 45, 61, 63-64,
Chemistry and the environment 127-130
Chemistry plate system
30, 40, 45, 59, 61, 63-64, 68-69, 102, 105-107, 109, 111-113, 122-123, 127
Chemistry product 65, 122-126, 130
Chromatography 70, 78-79
Chrome-nickel steel 94
Cigarette lighter gas .........78
Cigarette smoke 92
Claisen, distillation bridge after ... 63-64, 68, 69 Class room
Cola drink
Column chromatography
Combustion analysis
Combustion chamber
Compact spectrometer 38, 80-81, 100
Components of air 45-46
Composition of organic compounds 58
Computer-assisted 32, 37-38, 52-55, 61-62, 64, 68-69, 78-82, 85, 87- 91, 93-94, 96-98, 100-101, 103-104, 108, 128-129, 133-135
Concentration potentials
specific
titration of a hydrochloric acid solution
titration of a hydrochloric acid solution with
Bacteria
CASSY
Catalysis
Catalytic
Catalytic
Catalytic
37, 44, 52-56, 61-62, 64, 68-69, 78-79, 82, 85, 87-91, 93-94, 96-98, 101-104, 108, 128-129, 133-135
96, 122-123,
of the acidity
of bromothymol blue
of the calorific value of olive oil with a demonstration calorimeter
of the content of phosphoric acid in a cola drink
of the density of air
of the density of gases
of the density of

GERMANY:
LD DIDACTIC GmbH
Leyboldstr. 1 50354 Huerth Germany
Tel.: +49 2233 604 0
Fax: +49 2233 604 222
E‐Mail: info@ld‐didactic.de www.ld‐didactic.com
