


October 31, 2024


Jim Duncan, AICP, Director
Kimberlyn Caywood*
Sylvia Schmonsky
Chris Taylor, Deputy Director
LONG RANGE PLANNING
Hal Baillie, AICP, Acting Manager
Rachael Lay
Valerie Friedmann*
Eve Miller
Quinn Mulholland
Boyd Sewe
SB Stroh
PLANNING SERVICES
Traci Wade, AICP, Manager
Dalton Belcher
Chris Chaney
Daniel Crum, AICP
Stephanie Cunningham
Cheryl Gallt
Autumn Goderwis, AICP*
James Mills
Meghan Jennings*
Donna Lewis
Tom Martin, AICP*
Paula Schumacher
Bill Sheehy
TRANSPORTATION PLANNING
Chris Evilia, AICP, Manager
Hannah Crepps
Joseph David
Kenzie Gleason
Sam Hu
Stuart Kearns
Scott Thompson
Debbie Woods
Ivy Barksdale
Jonathan Davis
Zach Davis
Larry Forester, Chair
Janice Meyer*
Robin Michler
Bruce Nicol
Mike Owens
Frank Penn
Graham Pohl
William Wilson
Judy Worth
URBAN GROWTH MANAGEMENT
MASTER PLAN ADVISORY COMMITTEE
James Brown, Council-at-Large
Todd Clark, Fayette County Extension
Office
Alison Davis, University of Kentucky
Chuck Ellinger, Council-at-Large
Larry Forester, Planning Commission, Chair
Andi Johnson, Commerce Lexington
Todd Johnson, Building Industry Association
PG Peeples, Urban League
John Phillips, Darby Dan Farm
Kathy Plomin, 12th District Councilmember
William Wilson, Planning Commission
Zach Worsham, Winterwood Inc.
Judy Worth, Planning Commission
Dan Wu, Vice Mayor
COMMISSIONERS OFFICE
Keith Horn, Commissioner of Planning, Preservation & PDR
Joe Black
Shaun Denney
Albulena Gjoshi
LAW DEPARTMENT
Tracy Jones
Brittany Smith
*Denotes former staff/ Planning Commission/ Urban County Council members PHOTO CREDITS All photos courtesy of LFUCG except where noted.
Special thanks to the following departments and agencies for their expertise and input in the master plan process:
AGING AND DISABILITY SERVICES
Kristy Stambaugh, Director of Aging and Disability Services
ECONOMIC DEVELOPMENT
Kevin Adkins, Chief Development Office
Craig Bencz
ENVIRONMENTAL QUALITY AND PUBLIC WORKS
Nancy Albright, Commissioner of Environmental Quality and Public Works
Brandi Peacher, Complete Streets Coordinator
Doug Burton, Director of Engineering
Jennifer Carey, Director of Environmental Services
Jada Griggs
Demetria Kimball Mehlhorn
Jeff Neil, Director of Traffic Engineering
David Filiatreau
Charles Martin, Director of Water Quality
Chris Dent
Erin Hensley, Commissioner of Finance
Ashley Simpson, Deputy Chief Finance
Melissa Lueker, Director of Budget
GENERAL SERVICES
Chris Ford, Commissioner of General Services
Monica Conrad, Director of Parks
Tim Joice
Michelle Kosieniak
HOUSING ADVOCACY AND COMMUNITY DEVELOPMENT
Charlie Lanter, Commission of Housing Advocacy and Community Development
PLANNING AND PRESERVATION
Beth Overman, Director of PDR
PUBLIC SAFETY
Ken Armstrong, Commissioner
Lawrence Weathers, Police Chief
Jason Wells, Fire Chief
Marilyn Clark, FCPS Board of Education
Amy Green, FCPS Board of Education
Melinda Joseph-Dezarn, FCPS
Myron Thompson, FCPS
ACCESS LEXINGTON COMMISSION
BLUEGRASS GREENSOURCE
LEXTRAN
Fred Combs, General Manager
Emily Elliott, Director of Planning and Community Development
YMCA OF CENTRAL KENTUCKY
Keith Gallagher, COO
TSW | TUNNELL SPANGLER WALSH & ASSOCIATES
Samantha Castro, AICP, LEED-ND
Caleb Racicot, AICP
Thomas Walsh, PLA
Allison Stewart-Harris, AICP
Jia Li, AICP
Nick Johnson, AICP
Saloni Shah
Christopher Myers
GRESHAM SMITH
Louis R. Johnson, PLA, ASLA
Erin Masterson, PLA, ASLA
Katie Rowe, P.E., AICP
Andrea Cull, P.E.
Matt Maclaren, P.E.
Amanda C. Deatherage, AICP
Morgan Dunay
PARTNERS FOR ECONOMIC SOLUTIONS
Anita Morrison
Abigail Ferretti CIVICLEX
Richard Young
Kit Anderson
Megan Gulla
Noel Osborn
Stephanie Mobley
Adrian Paul Bryant
Haley Wartell
Lilly Bramley
SOUTHFACE INSTITUTE
Robert E. Reed, III
Executive summary

Market
Guiding principles and benchmarks
Public and stakeholder engagement Sustainability
Existing conditions inventory and analysis Regulatory framework for implementation
Land use and transportation regulating plans Infrastructure costs and fiscal impact
Appendices
A: Imagine: Lexington
B: Community voices
C: Concept plans
D: Market analysis data
E: Funding mechanisms
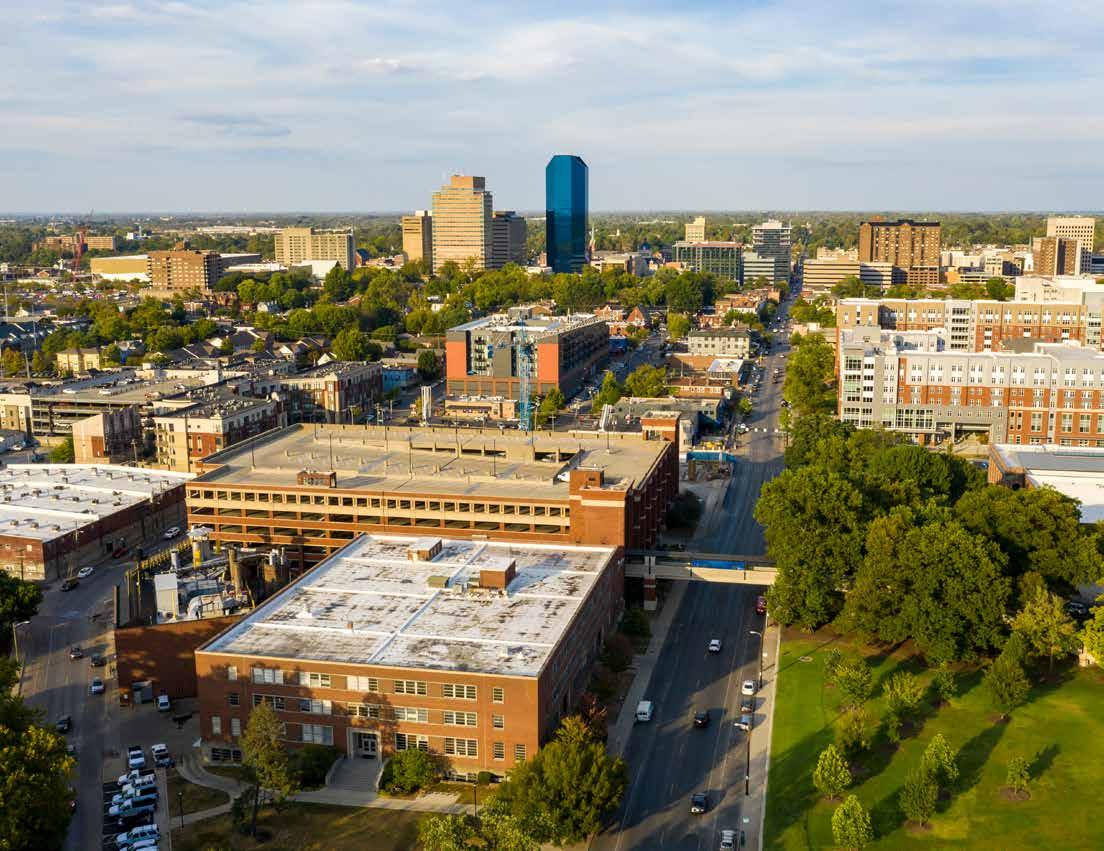
The following is a synopsis of the major elements and key aspects found throughout the Lexington Urban Growth Master Plan (UGMP).
In 2023, Lexington’s Planning Commission recommended a 2,800 acre expansion of its Urban Service Boundary in five locations across Fayette County.
In a year’s time this Master Plan was created through intense research, analysis, and community and stakeholder engagement to create a plan for urban development, transportation, parks, infrastructure, and more in the identified expansion areas.
■ Identified by the Planning Commission on October 26, 2023
■ Total acreage of 2,833 acres
■ Spread across 5 Approved Areas, in three geographic edges of the Urban Service Area

■ Along major corridors
■ Potential as ‘gateway’ moments into the city

Area 1 is the smallest of the five areas. The land is currently being used for cattle and horse pastures with paddocks for horses and areas for grazing animals. There are several associated barns, outbuildings, and the original farmhouse on site.
The vegetated entry to Pine Needles Lane is included in Area 1. This parcel is owned and maintained by the Heritage Place HOA, which is the adjoining active adult community.


Area 2 is the largest of the five areas. It includes a cluster of single-family homes along Hume Road and Ami Lane. Several large lot rural residential homes are scattered throughout the site.
There are several actively managed farms, which include a residence and multiple barns or outbuildings. Non-residential uses include WKYT News station, and part of a power sub-station.
Area 3 is sparsely developed, other than a single operational farm west of Brenda Cowan Elementary. The remainder of the land is unoccupied and used for crop rotations. The northernmost portion of the site is bound by I-75 to the east. Additionally, due to the required agricultural buffer from the 1996 Expansion, there is no vehicular access to the adjacent neighborhood and limited bicycle and pedestrian access through a temporary easement. Access to these parcels would need to be reevaluated depending on any future development.
Non-residential uses include: two public schools, Brenda Cowan Elementary School and the back portion of Edythe J. Hayes Middle School.

Area 4 consists of a few large agricultural tracts along Todds Road. The farmland has a mix of row crops and pasture.
There are a series of 10-acre lots along Canebrake, which were subdivided in 1987, a few of which have dwellings on them.


Area 5 is the most developed of the 5 sites. The Blue Sky Rural Activity Center, centered around the Blue Sky Parkway, hosts a wide variety of industrial sites, including freight, light manufacturing, and construction services.
The Blue Sky Rural Activity Center also contains several hotels clustered at the I-75 interchange with Athens Boonesboro Road. The remainder of the areas at the corners of Athens Boonesboro Road and I-75 are highway-serving businesses such as fast food restaurants, gas stations, convenience stores, and adult entertainment.
The southwest portion of the Blue Sky Rural Activity Center has experienced significant changes between 2023 and 2024. These changes have been spurred by the construction of the Lexington Sporting Club soccer fields and stadium. The owner of the property has indicated that future construction of the undeveloped parcels will complement the sports complex to create an entertainment district within Lexington.
This section reviews local demographics, housing needs, and market conditions to be used as a foundation for a master plan to incorporate land in the Urban Growth Management area. The analysis focuses on Lexington-Fayette Urban County in comparison with the Lexington-Fayette Metropolitan Statistical Area (MSA).
The market analysis reviews trends and potentials for residential, office, industrial, flex space, retail, and hotel development through 2045. As the economy in the Lexington-Fayette MSA steadily expands, population growth continues but at a slower pace than in recent years. The City of Lexington’s population is projected
to grow by 14.8 percent from 327,388 in 2023 to 375,774 by 2045 according to the University of Louisville. Additionally, the number of households in Lexington will grow somewhat more quickly, by 18.2 percent, to a total 161,776 by 2045. That represents an increase of roughly 48,400 residents and 24,900 households.
26,500
projected new housing units based on growth trends
Historically, Lexington’s housing development has focused on singlefamily houses – 50 percent of which were built from 2013 to 2022. The focus on larger, single-family detached homes has left a gap in the market for options that meet the needs of smaller households at prices they can afford. With increased costs, homeownership has become less attainable, fueling an increase in the development of townhouses and rental housing. The demand for attainable housing for households across the income spectrum continues to climb as housing costs increase at a greater pace than income.
Lexington needs a greater variety of housing types to address the diverse housing needs of households at different sizes, incomes, and life stages. Mixeduse development that blends large and small units in a variety of styles along with both ownership and rental units could create opportunities for balanced and sustainable communities. It would also provide a faster development cycle by appealing to multiple markets at the same time.
Based on the population growth
50%
housing units built between 2013-2022 that were single-family residential
projections and historic trends, Lexington could support the development of roughly 25,600 new housing units by 2045.
New development needs to achieve higher densities to support a mix of uses, create active and vibrant places, make better use of land, and preserve agricultural and other rural lands. A mix of offerings that range from an average of 8 to 20 units per acre would offer more options than self-contained subdivisions at 3 to 4 units per acre dominated by a single housing type.
Housing data from 2016-2020 indicate that housing affordability problems impacted 59 percent, or 23,115, of Lexington’s renter households with incomes up to 80 percent of Area Median Income (AMI). These households exceeded the U.S. Department of
59%
Lexington renters who spend 30% or more of their income on housing
8-20 units/acre
recommended approximate density for new construction to meet city affordability and quality of life goals
Housing and Urban Development’s standard that a household should not spend more than 30 percent of its income for gross housing costs to preserve enough money for food, transportation, health care and other basic needs. Fiftythree percent of those renter households, constituting 12,240 households, were severely cost burdened, spending more than half of their income for housing. Among owner households with incomes up to 80 percent of AMI, 3,725 households spent more than half of their income for housing.
Housing problems were even more significant for seniors. Thirty-one percent of renter householders age 65 or older spent more than half their incomes on rent. Among owner householders age 65 or older, severe cost burdens impacted 19 percent.
22.7 million
total retail square footage in Lexington
A precept in the retail industry is that new retail follows rooftops or increases in population. Lexington continues to add new residents, driving retail demand. Over the next two decades, many existing retail spaces will likely be demolished or converted to new uses as new shopping corridors and clusters or nodes of activity create opportunities to better meet modern retailers’ needs. Many of today’s modern retailers rely on placemaking to create walkable environments that draw customers for the experience as well as the retail offerings. Mixed-use developments offer daytime, evening, and weekend support from both nearby workers and residents.
Prior to the planning workshop recommendations for Expansion Area development scale, it is too early to estimate the scale of supportable commercial development. Currently, none of the Expansion Areas are well located to serve as regional activity centers, hindering the ability to attract significant numbers of existing residents. As none of the areas are strategically located to serve as regional activity centers, attracting significant numbers of existing residents.
3.7%
retail vacancy rate as of January 2024
67.8%
share of the Lexington-Fayette Metro Area (Bourbon, Clark, Fayette, Jessamine, Scott and Woodford Counties) retail that is located in Lexington
44,300 sq ft
average annual delivery of new retail between 2018 - 2023
75,000 -
95,000 sq ft
potential new retail that growth within proposed expansion areas could support
In the mid- to long-term, Expansion Area 3 and Area 5 provide the most competitive opportunity for new retail development that serves primarily the new community. The new retail development in Expansion Area 3 will depend on the future scale of residential development as well as designating a visible and accessible site that allows retailers to attract customers from the larger southeast Lexington area and not just the adjacent residential development. Expansion Area 5’s retail growth depends on the plans for the new
Lexington Sporting Club soccer stadium and the visibility offered by sites at the I-75 interchange. It is likely that growth west of I-75 will support between 40,000 to 50,000 square feet and east of I-75 in Expansion Area 5 will support 25,000 to 30,000 square feet.
Finally, Expansion Area 4 could support development of a few new food outlets or ancillary retail of 10,000 to 15,000 square feet of new retail demand by 2045.
Historically, the major drivers of office demand for Lexington have been byproducts from University of Kentucky research initiatives, medical office space related to the region’s major medical centers, and the sporadic attraction of new corporate facilities. Demand and development have been focused on downtown Lexington, Coldstream Research Campus and other business parks. Separate neighborhood-serving offices have developed on independent parcels along major thoroughfares.
Office occupancies in both Lexington and the region remain relatively healthy with occupancies around 92 percent. With the minimal amount of new office space developed during the last four years, the region has avoided the doubledigit vacancy rates that have plagued many major office markets. Office space construction has averaged 137,900 square feet annually over the last decade and 67,800 square feet per year over the last four years during the pandemic in the region. However, it is likely that future demand will slow as larger tenants shrink footprints due to work-from-home and space efficiency trends result in less space per employee. In this transitional
67,800 sq ft
average annual delivery of new office space between 2018 - 2023
50,00080,000 sq ft
potential annual growth of new office space through 2045
period for the office market, as it strives to adjust to the new normal following the Covid-19 pandemic, it is not yet clear whether greater working from home will translate into a reduced demand for space, but it looks as though space per employee may decline 10 to 20 percent.
Based on historic trends and continued employment growth among Lexington’s office-using industries, demand for additional facilities will support development of 50,000 to 80,000 square feet annually by 2045, or a total of 1.0 to 1.7 million square feet of new office space. That demand is anticipated to continue to be concentrated in Lexington's downtown, business parks and neighborhood office clusters.
Office tenants typically make their location decisions based on a mix of
criteria, including accessibility, proximity to institutions and other clients, proximity to similar businesses, building quality, visibility, and availability of support services and retail. Increasingly, in today’s tight labor market, businesses are using their office locations as a recruiting tool. That has meant placing a high premium on walkable, mixed-use districts that provide a mix of restaurants, cafes, service businesses, and housing in close proximity. This is particularly true as companies work to offer their workers a reason to come to the office.
Among the five expansion areas, only the sports complex site in Expansion Area 5 could possibly offer the type of business setting and clustering that could compete for major businesses not focused on serving the local population. Demand in that area will depend on recruitment. The opening of the new Baptist Health medical campus south of Winchester Road will likely generate demand for new medical office buildings and space for related businesses; however, that demand is likely to focus primarily in the area surrounding the medical center rather than in Expansion Area 2. Expansion Area 3 could potentially support a small increment of office space for neighborhood-serving businesses attracted by the new residential base, as much as 10,000 to 20,000 square feet if developed in a retail cluster with visibility and access from Athens Boonesboro Road.
Development of industrial and flex space in Lexington and the nation over the last decade has reflected major shifts in the logistics industry with the majority of new space developed for distribution facilities. As the industry has recovered from major supply chain problems during the Covid-19 pandemic, growth has slowed significantly. Beyond distribution, the Lexington-Fayette MSA has benefited from Toyota’s growing manufacturing base in Scott County and related suppliers and manufacturers.
The Lexington-Fayette MSA has 60.5 million square feet of industrial and flex space, which is up by 2.7 million square feet since 2014. Of the regional total, Lexington accounts for 32.8 million square feet or 54 percent, and 1.7 million square feet or 52 percent of the growth over the last decade. The higher cost of land in Lexington has reduced its competitive position for warehouse space relative to other MSA counties. Lexington is now most competitive for higher-end research and development labs and other businesses that benefit from Lexington’s
2.7 million industrial/flex square feet added throughout Lexington-Fayette MSA between 2014 - 2023
200,000275,000 sq ft
potential annual addition of new industrial/flex through 2045
educated workforce and the potential for collaborations with the University of Kentucky.
Projected employment growth in industries that rely on industrial and flex space coupled with historic trends data suggest that the region will develop an average of 200,000 to 275,000 square feet of space annually to 2045 for a total of 4.2 to 5.8 million square feet. Lexington is projected to capture 35 to 40 percent of the region’s future industrial and flex space construction for a total of 1.5 to 2.3 million square feet of new space.
Land costs will hinder industrial and flex space development in the Expansion
Areas. The largest potential for future industrial development remains in Expansion Area 5 which has the only sites suitable and competitive for such uses. New industrial and flex space development in Expansion Area 5 could reach 65,000 to 130,000 square feet by 2045.
Lexington’s hotel inventory provides 9,018 rooms across 82 hotels, clustered along major thoroughfares, near area attractions, and in close proximity to University of Kentucky and downtown Lexington. The existing inventory of hotel rooms consists of a wide variety of options encompassing independent operators (8 percent of room supply) economy (12 percent), mid-level hotels without food and beverage service, upper mid-scale with limited food service and high-end alternatives in upper upscale or luxury segments. Occupancy has largely recovered from the impact of the Covid-19 pandemic on the travel industry,
9,018 hotel rooms throughout Lexington 9.4%
increase in room-night demand from 2019 - 2023
12%
increase in number of hotels from 2018 - 2023
averaging 61 percent in 2023. Annual room-night demand in 2023 was up 9.4 percent above the 2019 total. Over the last five years, Lexington’s market has increased with 9 new hotels with a total of 964 rooms (a 12-percent increase).
Construction of new hotels will continue with the region’s population growth, the addition of new attractions such as the new soccer stadium, and replacement of older, obsolete hotels.
Expansion Area 5 offers competitive highway locations on either side of I-75 for two to three new hotels by 2045. If a mixed-use retail/restaurant cluster is developed in Expansion Area 3, it could attract a hotel. However, the viability of these sites will depend on the extent of new hotels being developed as part of the new sports complex.
New development in the Expansion Areas will be primarily comprised of residential development. Commercial development has not generally occurred in southeast Lexington, and none of the Expansion Areas have the potential to develop into major activity centers that will attract visitors from around the region. Only the new sports complex offers near-term potential for significant commercial development. Because commercial development in the other Expansion Areas will serve primarily the new Expansion Area households, supportable retail, restaurant, service and office development will likely be delayed by at least a decade while waiting for the household base to reach a level sufficient to support these new businesses.
The value of the properties to their owners and the larger community would be maximized by the development of diverse neighborhoods offering a variety of housing units of different types, sizes, and price/rent ranges. This would allow the development to address multiple market segments at one time and to address gaps in the current housing supply – smaller units at greater densities to meet the housing needs of current and future Lexington households. Higher densities would allow greater potential to support local businesses and create walkable places to gather and interact with neighbors. A greater number of new units also will reduce the costs of needed infrastructure development per unit by spreading the costs.

Following the project’s Guiding Principles, a Regulating Plan was created for each Expansion Area.
The process for each plan was as follows:
1. Non-buildable areas, such streams and ponds, floodplains, steep slopes of 15 percent or greater, or sinkhole risks were identified and set aside for protection based on Existing Conditions analysis.
2. Town and Village Centers were designated along the limited frontage of major arterial roads to serve as gateways.
3. A network of boulevards and avenues was laid out from these hubs, aligning with the terrain.
4. Additional hubs were placed to ensure residents were within 1/2-mile, ideally 1/4-mile, of these focal points.
5. A modified grid of local streets was designed for walkability and long-term development flexibility.
6. Off-road bicycle and pedestrian routes were added for connectivity.
7. Potential transit routes for future Lextran
were identified.
Enable a mix of housing options that can serve multiple needs and market sectors
Encourage a variety of uses to meet people’s needs and preferences within their own neighborhoods
Allow modest density increases to drive community improvements and support greater amenities, like retail and public spaces
Provide multiple routes to reduce: congestion, travel distance, travel time, emergency response time, social isolation, and reduce social isolation
Encourage safe alternatives to driving, offering more choices for travel
Respect the natural world and incorporate water, trees, and open space throughout designs
As outlined in the Chapter 4 - Public & Stakeholder Engagement, the Regulating Plans were available for review and feedback by the public and developers at several points throughout the process.
The Regulating Plans outline the development of streets, land use, open spaces, and additional regulations to ensure integrity in land planning. It prioritizes protecting natural features, establishing town and village centers, and creating transportation networks that are walkable and adaptable to future growth.
Each typology is designed to accommodate various needs, ranging from residential communities to mixed-use urban hubs
Primarily single-family dwellings, some multifamily units (up to 8 units), and corner stores.
Density: 7-13 net dwelling units/acre.
A mix of retail, restaurant, office, and residential uses, with primarily townhouses and multiple-family dwellings.
Density: 20+ net dwelling units/acre.
A mix of single-family homes, townhouses, and multiple-family dwellings (up to 10 units), with corner stores as secondary uses.
Density: 11-25 net dwelling units/acre.
A mix of retail, restaurant, office, and residential uses within attached buildings, serving both adjacent and wider neighborhoods.
Density: 30+ net dwelling units/acre.
Primarily multiple-family dwellings, with some commercial use.
Density: 23+ net dwelling units/acre.
Primarily retail, restaurant, office, entertainment, industry, or recreation, with secondary residential uses.
Density: Varies based on use.
As noted in Theme E - Goal 3 of the 2045 Comprehensive Plan, Lexington continues to support new and robust economic development through the inclusion of land for new jobs. The UGMP has not identified specific acreage for a Regional or Local Business or Industrial Park. However, nothing in this plan is intended to prevent a property owner from bringing forward a proposed Regional or Local Business or Industrial Park. While the UGMP did not identify a specific location for such a use, economic growth remains a priority for the community. Should a Regional or local Business or Industrial user identify land that is within the UGMP area, appropriate flexibility is important to allow for significant job opportunities within Lexington’s Urban Service Area.

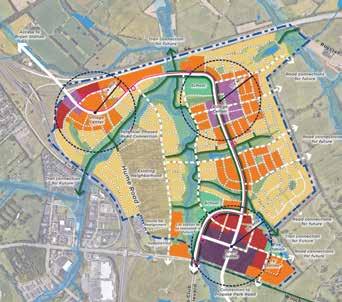
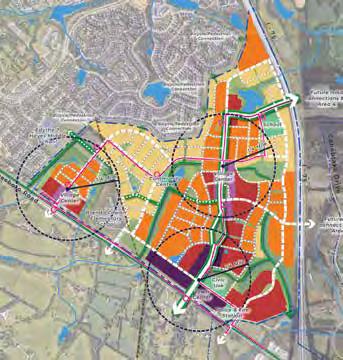
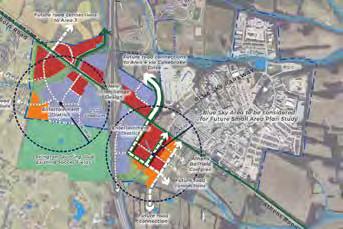
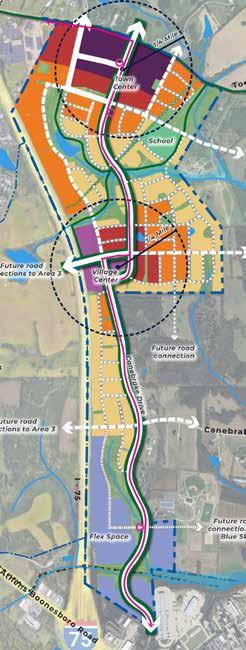
The UGMP emphasizes a modified street grid to enhance walkability, flexibility, and connectivity. The grid adapts to the terrain while maintaining small, walkable blocks that balance the needs of local and through traffic. Key street typologies include:
• Alley Shared space for vehicles, bicycles, and pedestrians ,usually serving garages and loading zones.
• Neighborhood Street Low-traffic street with shared lanes for bicycles and vehicles. Designed for slower speeds (20 mph) and appropriate for residential areas.
• Avenue Minor collector street, usually with bike lanes, providing more connectivity between neighborhoods and destinations.
• Boulevard Major collector street with more traffic capacity, separated bike lanes, and pedestrian-friendly designs.
• Single-Loaded Street Street with development on only one side, providing open space views and connections to parks or public spaces.

Modified Grid. The Curvilinear Loop Design should be prioritized when designing the Areas in order to add redundancy in the network and create a human-scale street network. Source: Congress for New Urbanism Street Networks 101 | CNU
• Traffic volumes vary based on street types, with higher volumes on boulevards and avenues, and lower volumes on neighborhood streets.
• Speeds are intentionally limited, with boulevards and avenues targeting 25 mph, neighborhood streets at 20 mph, and alleys at 10 mph, ensuring safety for pedestrians and cyclists.
Traditional signalized intersections are minimized in favor of alternative intersections that improve safety and traffic flow:
• Roundabouts and mini-roundabouts are used to reduce delays, congestion, and maintenance costs while accommodating large vehicles like buses and delivery trucks.
• Reduced Conflict U-turns (RCUTs) improve safety by reducing conflict points at busy intersections, especially along divided highways.
• Continuous Flow Intersections (CFIs) allow for more efficient left turns at high-traffic areas, although special attention is needed to ensure pedestrian safety.

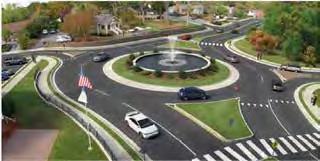
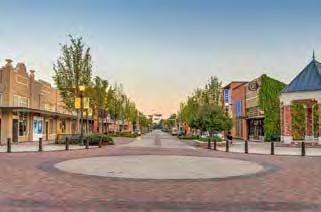
• The plan prioritizes creating a safe, connected bicycle and pedestrian facilities. It includes shared-use paths or protected bike lanes that are separated from vehicle traffic along major roads like boulevards, and bike lanes on minor collectors.
• Greenway trails are incorporated for recreational use, designed to follow natural features like water bodies, while bike lanes are intended for more direct commuting and travel.
• The plan anticipates the expansion of Lextran bus routes into new development areas, prioritizing stops at Town Centers and Village Centers to serve dense mixed-use areas.
• Transit stops are designed with accessibility in mind, connecting pedestrians and cyclists via quality bicycle and pedestrian facilities. Stops will include shelters and amenities like benches and trash receptacles.
• Transit routes will focus on boulevards and avenues integrating with planned roundabouts and alternative intersections to ensure smooth operation for buses.
The transportation framework is underpinned by Complete Streets principles, ensuring that all streets are designed for safe use by people of all ages and abilities. This includes prioritizing sidewalks on both sides of the street, bike lanes, and traffic-calming features like curb extensions and narrower lane widths to slow down traffic and enhance pedestrian safety.
This framework is built to create a multimodal, connected, and sustainable urban environment in Lexington.
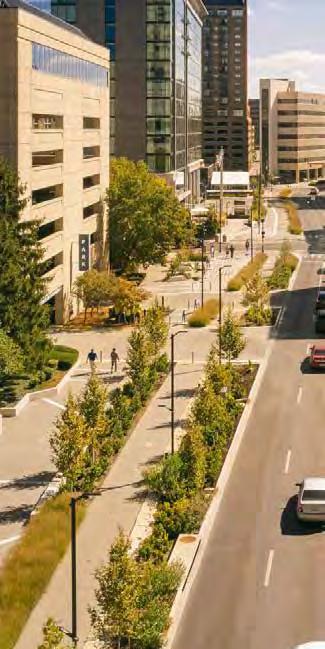
Hand-in-hand with the Regulating Plans are the supportive policy work to ensure that the long-term vision established in this Master Plan is realized. The key aspects are divided into development criteria and proposed regulations, which focus on zoning updates, infrastructure needs, land use guidelines, and development criteria for the City of Lexington.
Rezone sites to align with UGMP land uses, such as village and town centers. It emphasizes low, medium, and high-density land use configurations, promoting flexibility while maintaining UGMP goals.
Establish a concurrency requirement where residential developments must match commercial occupancy, ensuring balanced growth in mixed-use areas.
Propose strict street design standards in alignment with the Lexington Complete Streets Policy, encouraging walkability
and multimodal transportation, along with block sizing to foster connectivity.
Recommend including buffer zones between developments and rural areas, parking and garage placement, to ensure that retail-ready spaces meet specified design standards (e.g., active depths and transparency for pedestrian engagement).
Support sustainable design by offering bonuses for LEED-certified buildings and encourages innovation by supporting low-impact manufacturing and microdistribution hubs, subject to specific active depth requirements.
Coordinate efforts to ensure public infrastructure like roads and sanitary sewers and public services such as waste collection, emergency response, and transit can support new development. It advocates for the creation of an Infrastructure Funding Plan and Parkland Dedication Ordinance by 2025.
Identify the need for additional studies on intersection design, transit service feasibility, and roadway connectivity,
particularly in areas like Athens Boonesboro Road.
This regulatory framework is integral to ensuring that development aligns with the broader goals of sustainable, walkable, and mixed-use urban growth.
The key aspects to the fiscal impacts of infrastructure improvements and costs required for the Lexington UGMP include the following, all of which are in 2024 dollars:
• Capital Costs: A total of $569.5 million is estimated, including public and developer-funded infrastructure such as roads, trails, intersections, sewers, parks, police, and fire stations.
• Roadways, Trails, and Intersections: The bulk of the infrastructure costs ($510 million) are related to roadways, trails, intersections, and stream crossings. Maintenance is estimated at $525,500 annually.
• Sewer, Police, and Fire Services: Significant sewer upgrades are required, particularly in Expansion Area 2, costing $54.3 million. New police roll call centers and fire stations will be built to meet growing demands, costing $7.5 million and $22.5 million respectively.
• Parks and Libraries: 16 new neighborhood parks and library expansions are planned, with an estimated cost of $22.5 million and $17.0 million, respectively.
• Operating and Maintenance Costs: At build-out, operating and maintenance costs will reach $8.5 million annually.
• Funding Strategies: The plan includes a fiscal impact model to measure the effects of development on Lexington’s General Fund and explores innovative funding strategies to ensure infrastructure funding aligns with future growth.
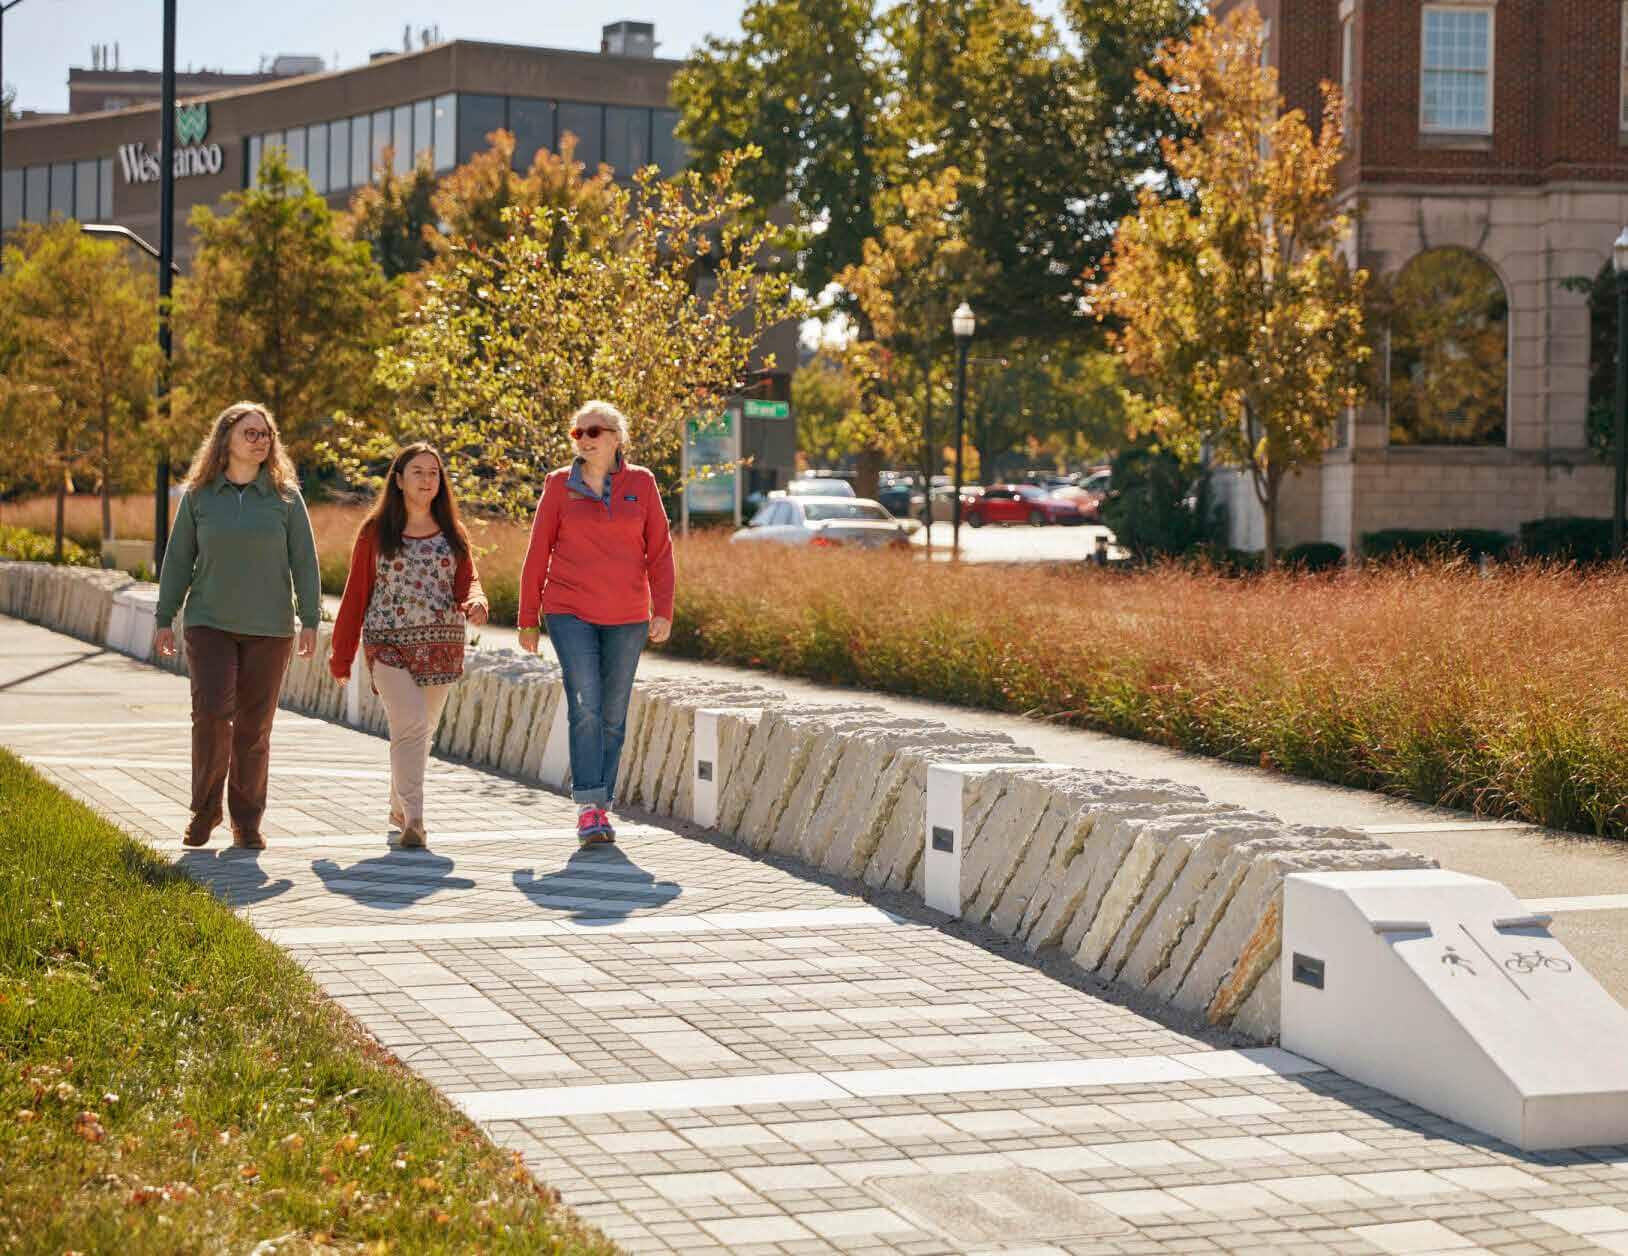
While a more traditional inventory and analysis is contained in Chapter 2, this Chapter focuses on setting the stage for this project. The UGMP emerged as a priority project coming out of the adoption of the Goals and Objectives of Imagine Lexington 2045. Therefore, the process and the stated community values that led up to Imagine Lexington 2045 should be considered as part of the UGMP.
Chapter 01 covers the following:
■ Origins in Imagine Lexington 2045
■ On The Table Principles
The Lexington UGMP draws directly from the policies and pillars of the Imagine Lexington 2045 Comprehensive Plan. Appendix A – Imagine Lexington 2045 Survey designates each policy that applies to the Master Plan, and whether it manifests through design in the Regulating Plans, or through regulation and policy implications.
The following is a summary of how each Comprehensive Plan pillar has been applied within the Master Plan.
Design 1 Utilize a people-first design, ensuring that roadways are moving people efficiently & providing equitable pedestrian infrastructure.
Design 2 Ensure proper road connections are in place to enhance service times & access to public safety, waste management and delivery services for all residents.
Design 3 Design policy #3: Multi-Family residential developments should comply with the Multi-Family Design Standards
Design 4 Provide development that is sensitive to the surrounding context.
Design 5 Provide pedestrian-friendly street patterns & walkable blocks to create inviting streetscapes.
Design 6 Adhere to the recommendations of the 2018 Lexington Area Bicycle & Pedestrian Master Plan.
Design 7 Design car parking lots and vehicular use areas to enhance walkability and bikability.
Design 8 Provide varied housing choice.
Design 9 Design policy #9: Provide neighborhood-focused open spaces or parks within walking distance of residential uses.
Design 10 Design policy #10: Reinvest in neighborhoods to positively impact Lexingtonians through the establishment of community anchors.
Design 11 Design policy #11: Street layouts should establish clear public access to neighborhood open space and greenspace.
Design 12 Support neighborhood-level commercial areas.
Design 13 Development should connect to adjacent stub streets & maximize the street network.
PILLAR
Density 1 Locate high density areas of development along higher capacity roadways (minor arterial, collector), major corridors & downtown to facilitate future transit enhancements.
Density 2 Infill residential can & should aim to increase density while enhancing existing neighborhoods through context sensitive design.
Density 3 Provide opportunities to retrofit incomplete suburban developments with services and amenities to improve quality of life and meet climate goals.
Density 4 Allow & encourage new compact single family housing types.
Pillar 1: Design
The application of the policies within the Design pillar of the Master Plan focuses on the layout of the circulation network, ensuring multi-modal transportation options are at the forefront while highlighting and framing community anchors and neighborhoodfocused commercial uses/developments, open space, and parks. The Master Plan utilizes a modified street grid system to the extent possible, while being sensitive to topography and natural features. Connectivity beyond the Growth Areas is stressed where those connections are possible into the existing Urban Service Area (USA), including streets stubbed out along the edges of development at regular intervals to ensure potential future growth has more opportunity for connectivity.
While the Master Plan outlines a preferred mix of housing types or uses, the eventual design of those structures is up to the developer and subject to current regulations.
Pillar 2: Density
Each of the Growth Areas is located along one of the city’s major corridors, and the Master Plan leverages that fact to focus the most intense portions of development close to the major roadways to encourage future transit access points and to make any potential commercial uses as viable as possible. Density will then decrease from the major corridors towards established neighborhoods or areas remaining as agricultural land.
To ensure the Master Plan is using all the ‘tools’ available to provide a wide range of housing types, new compact styles of housing will be shown in the plan and supported in regulations.
Pillar 3: Equity
While the ‘ensuring equitable development' policy focuses on existing neighborhoods, it is important to note that the creation of this Master Plan is being done through the lens of providing and planning for all members of the community. In that vein, attainable housing and the provision of affordable housing are part of the regulatory approach. These housing options show up in the Master Plan at all scales of residential.
Community facilities, such as schools, libraries, and parks, are an integral part of the civic infrastructure, which the master plan prioritizes as a key building block from which the rest of any development should radiate.
The Master Plan looks at accessibility at a site level, but the merits of universal design and standards of accessibility to and within buildings should become a major topic of discussion and approval when developers bring projects for approval.
While the Regulating Plans establish what land is buildable, the Master Plan works to protect existing areas of environmental sensitivity and rich biodiversity. These areas may be near streams or ponds, but they may also coincide with existing stands of trees.
The sustainable/net zero guidelines created for this project help ensure that the Growth Areas are in line with the goal of the City to reach net zero greenhouse gas emissions by 2050. Both the master plan and the regulatory approach establish compact development patterns and a complete streets approach to encourage multimodal transportation and avoid reliance on single occupancy vehicles. The concept plans reinforce through design the reduction of impervious surface relative to a traditional development, the use of green stormwater infrastructure and low impact design, and the use of native plants, and regulations of these sustainability measures would be included in future studies.
The master plan and related implementation plan for the Growth Areas sets aside space for performative landscapes, while leveraging greenways and natural areas for passive recreation and trails. Waterway quality and watershed management can be improved when tied to development and investment in greenway infrastructure and maintenance.
While the master plans does not get down to the level of detail of showing parking for electric vehicles, the sustainable/net zero guidelines will discuss options for greenhouse gas emissions reduction.
Each of the Growth Areas are located along, and will have its primary access on, a major corridor heading into town. The master plan weighs the need for visibility of future development with the desire to create gateway moments between urban areas and the bluegrass landscape.
Planning for entertainment districts is a key consideration for the Growth Areas, whether it be enhancing existing sports facilities or shaping and providing supportive uses for future venues.
The entire concept of the Growth Areas hinges upon the idea of creating more opportunities for attainable housing, varying in type and price point. These residential areas need to be supported by civic infrastructure and a mix of uses that help to retain and attract a vibrant workforce. These areas will be further bolstered and be attractive to a wider range of residents by being well-served by transit.
The Blue Sky Activity Center will continue to be a highlyfunctional industrial center, but the ability to take advantage of new town centers nearby with workforce housing will open up opportunities for the job force. The Blue Sky area will be fully analyzed through a future small area plan.
Several of the Growth Areas include ‘Flex Space’ and even more have the opportunity for mixed-use development. Flex Space provides a wide array of spaces, including small-scale brick and mortar and incubator spaces, for businesses to locate. This allows for a more diverse economic base, which could include smallscale brick and mortar and incubator space.
The viability of creating walkable neighborhoods in the expansion area is greatly improved by the minimization of the amount of surface parking. Through design and regulations, developers are encouraged to get creative with how they think about parking, including through flexible and shared parking arrangements.
While forcing grocery chains to build in certain areas is impossible, the plans allow for opportunity to include everything from grocery chains down to small farmers markets.
The basic principles of a highly functioning and well-connected multi-modal transportation network are the backbone of each of the Growth Areas. The City’s adopted Complete Streets Policy is demonstrated in the Regulating Plans and reinforced in the regulations. Knowing that the Complete Streets Design Manual follows on the heels of this project, many of the details of the transportation network are roughly sketched out during this project, with the opportunity for refinement once the Complete Streets Design Manual is finished. While the Growth Areas are all relatively far away from the existing transit network, the designs for each will start with a strong bicycle/pedestrian network. This ensures people who cannot, or choose not to, take personal vehicles have an option that gets them around their community. The idea being that eventually this already strong system can connect to Lextran. The design of streets and roads will focus on safety and accessibility for all modes. This includes designing for desired speeds, using traffic control measures, and utilizing alternative, safer intersections throughout.
Street trees as essential infrastructure are at the forefront of the design of a walkable community and the Complete Streets effort and will be included in the design and regulations. Pillar
Each of the Growth Areas builds off the protection of each site’s unique natural resources and key features, such as streams, water bodies, and groupings of trees, to help develop a sense of place. These natural areas become the location of numerous off-road trails and greenways, making them an amenity for use by the community. The regulatory elements being created as part of this project will help the city establish better standards and guidelines for creating walkable communities.
As part of key civic infrastructure, and as a built-in way to ensure vibrancy of place, potential school sites will be shown in several of the Growth Areas where the number of households will be able to support them.
The ability to age in place in a vibrant community is an evergrowing need. By requiring a specific minimum density and allowing for a diversity of housing options, including cohousing, the Master Plan increases Lexington's ability to serve an aging population.
THEME E: URBAN AND RURAL BALANCE
Pillar 1: Accountability
The Lexington UGMP project is a large step towards achieving several of the accountability policies listed, including expanding the Urban Service Area.
Pillar 2: Stewardship
Pillar 3: Growth
One of the main goals of this project is to plan the Growth Areas in such a way that maximizes this opportunity and accommodates the need for development and housing in a significant way.
By showcasing portions within and surrounding the Blue Sky Activity Center for use as an Entertainment District with a regional draw by the Lexington Sporting Club and others, tourism and development remains prioritized.
This pillar covers the adoption of this project, which works to create more dense residential developments, missing middle and attainable housing, walkability, and transitoriented development. Incorporating thoughtful design and placement of infrastructure, including roads, stormwater, and sewer, keeps the cost of development down.
The On The Table database CivicLex and the Division of Planning created provides the Project Team with a better picture of what the public wants to see as the City grows. It effectively ties those desires to specific geographical locations within the City based on the respondents’ identified neighborhood. This creates a unique baseline for our understanding of the community’s needs and wants prior to any outreach being done.
On the Table 2022 was an unprecedented opportunity for everyday Lexington residents to get engaged on land use and the Comprehensive Planning process. Across a week of conversations, 2,412 participants filled out the On the Table Survey, a combination of qualitative and quantitative questions about how they want to see Lexington grow and change. This survey resulted in a database of over 15,000 open-ended responses about land use in Lexington-Fayette County, which was coded by CivicLex and the Division of Planning to use in the development of Imagine Lexington 2045 and other land use decisions.
The initial coding process, developed in partnership with the University of Kentucky’s Martin School of Public
The most popular code was “Walkability, Bikeability, and Accessibility,” with 1,731 comments tagged with this code (8% of the total 15,000 comments). A total of 1,134 survey respondents spoke to this issue (some brought up the issue multiple times in response to the different open-ended survey questions). Walkability, Bikeability, and Accessibility refers to comments that mentioned walking or biking trails, sidewalks, bike lanes, or physical accessibility to walking or biking for people with disabilities (i.e., sidewalk conditions, ramps, and curb heights).
The second most popular code in the On the Table dataset was Public Transportation, with 1,744 comments (11% of all OTT responses). A total of 1,163 unique respondents mentioned Public Transportation, 48% of all survey takers. The neighborhoods that mentioned public transportation most frequently were Picadome, Kenwick, Woodland, and Cardinal Valley.
Amenities and Quality of Life (AQL) was the third most popular code. Within AQL, which was mentioned in 1,567 of the gathered respondents' comments, More Things to Do, Commerce/Retail/Restaurant, and Quality of Life were the top three priorities highlighted by participants.
Environmental Sustainability and Resiliency (ESR) is the fourth most popular code. Within ESR, which was mentioned in 1,000 of the gathered comments, Waste Management, General Environmental Protection, and Renewable Energy are the top three priorities highlighted by participants.
The fifth most popular code was “Style of Development,” with 1,137 comments tagged with this code (7.5% of the total 15,000 comments). Style of Development refers to comments that mentioned any of the following: density/intensity, aesthetics, context, housing options/ types, sprawl, missing middle housing, mixed use, or low-density or single-family development.
The sixth most popular code was “Urban Greenspaces,” with 962 comments tagged with this code (4% of the total 15,000 comments). More Parks/Greenspaces, Protecting Existing Parks/Greenspaces, Better Parks/Greenspaces were the top three priorities among those who mentioned UG concerns. Even though most people wanted more parks, there were many mentions of keeping existing parks better maintained and accessible. Additionally, many respondents commented on increasing the usefulness of parks and greenspaces through increased activities and events at parks to bring people and communities together.
The seventh most popular code was “Housing Affordability,” with 646 respondents mentioning the topic in their open-ended responses. This category refers to responses that mention the need for safe, affordable housing, with many indicating how improved housing affordability would impact their quality of life. Responses in this category also included those related to the quality of available affordable housing, commentary about the contributing factors or justifications for why housing affordability is so difficult for Lexingtonians, and specific ideas, policies, or solutions that might increase housing affordability in Lexington.
It is important to note that this emerged as a common topic even though there were no specific questions within the OTT survey that asked directly about housing. While many codes correspond directly to specific survey questions, this theme bubbled up from the data as a significant number of respondents brought up the issue in their openended responses, most often in relation to questions asking about jobs or prosperity.
Policy, involved reading every open response question for mention of 32 key themes, or “codes.” These include topics like public transportation, housing affordability, traffic congestion, water infrastructure, and safety. This coding process was essential to organizing the overwhelming amount of qualitative and quantitative data. The On the Table database can be filtered by any of the 32 codes, leading to insight about the most popular codes by Comprehensive Plan theme, demographic, neighborhood, and sentiment. However, there were two key drawbacks of the initial coding process.
First, the coding did not capture the sentiment of the responseswhether a participant wrote “I love my neighborhood because of all the trees along the sidewalks” or “The trees in my neighborhood make it difficult to see around corners while driving and have caused accidents”, the response was simply tagged with the “trees” code.
Second, the coding did not capture a high level of detail within the responses. A code like “style of development” includes a variety of subjects, including the density, aesthetics, and types of housing, commercial development, and industry.
Both of these drawbacks were necessary choices within the timeframe of On
the Table and the creation of Imagine Lexington 2045. The UGMP presented an exciting opportunity to revisit the On the Table data and dive deeper into resident sentiment and responses, gaining an even clearer picture of how Lexington’s residents want to see our city grow.
As part of the public engagement work for the UGMP, CivicLex staff and the University of Kentucky’s Department of Community Leadership and Development re-investigated the On the Table data and subcoded the most popular concepts. CLD 670: Community Engagement led by CivicLex Staff, Professor Nicole Breazeale, and Professor Karen Rignall, with graduate students Jason Schubert, Jamari Turner, Himika Akram, Tanya Whitehouse, Lindsey Windland, Reba Prather, Ruth Toole, and Brock Vandagriff executed an in depth research and sub coding process for the top six codes in the On the Table dataset.
In teams of two or three, students (with a staff/faculty leader), selected a code, read all open responses tagged with that code, and followed the initial OTT process for developing a code book as described in the Imagine Lexington Public Input Report. With the narrower focus of a single subject (for example,
walkability/bikeability), students were able to create subcodes that captured sentiment and increased detail - e.g., residents asking for more biking infrastructure versus residents frustrated with bike paths being developed instead of additional driving lanes. The results of this subcoding process are included in Appendix B Community Voices.
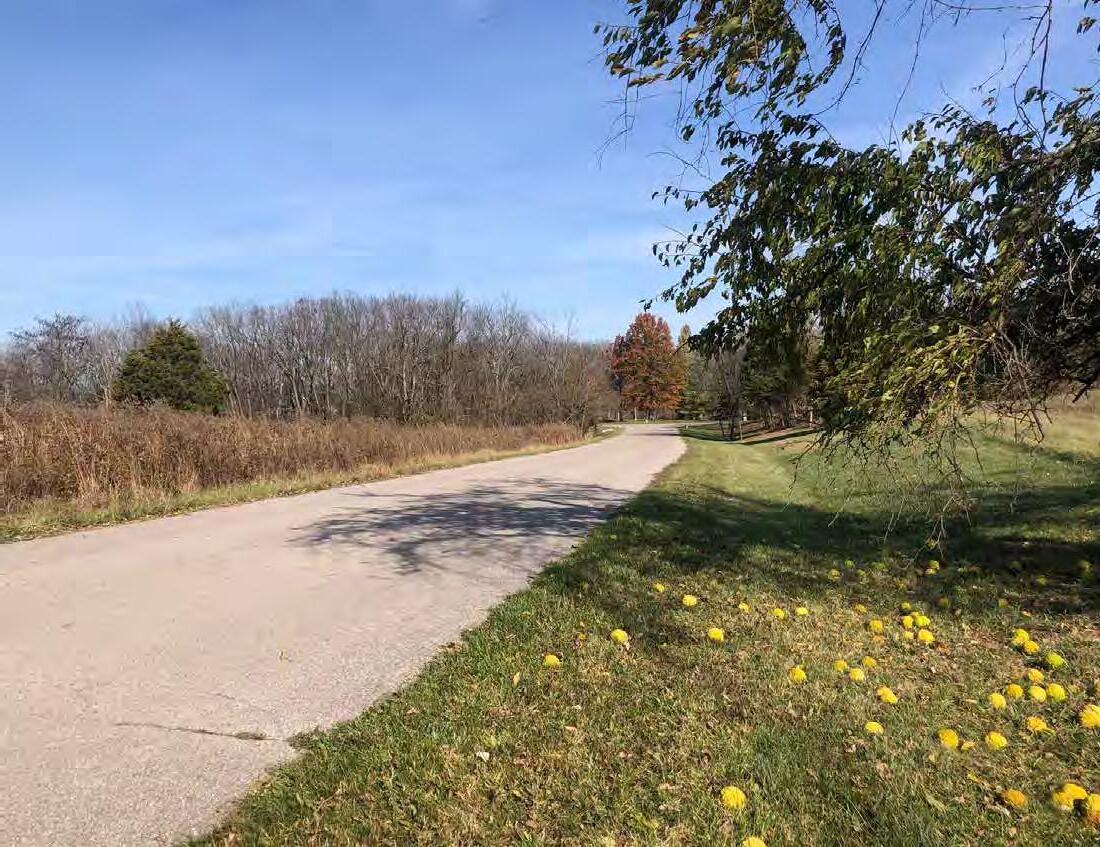
This UGMP for Lexington's future is grounded in an inventory and analysis of the conditions that shape the county today, including:
■ Existing land uses and densities
■ Zoning and permitted land uses
■ Agricultural land
■ Purchase of Development Rights (PDR) land
■ Environmental features (i.e., soils, topography and steep slopes, waterways)
■ Vehicular infrastructure
■ Multimodal infrastructure (i.e., pedestrian, bicycle, transit)
■ Utilities (i.e., electric, water, gas, telecommunications, sanitary sewer)
The current planning study uses the areas recommended for potential growth as identified by the Planning Commission on October 26, 2023.
The following pages introduce each planning area, its context, and the issues and opportunities identified that it currently faces or may face in coming decades.
Between differences in size, existing land use and current management, zoning, topography, drainage patterns, and more, each area presents unique opportunities and constraints for development.
Area 1 is located along the western edge of the Urban Service Area. The smallest of the five sites included in this study, it is bounded by Parkers Mill Road to the north and Man O' War Boulevard to the southwest. Its southeastern edges border Heritage Place, a subdivision of two-family dwellings, and The Reserve, a large single family detached subdivision that spans approximately 132 acres, not including the 78.5-acre Beaumont Preserve.
Area 2 is located to the northeast of Lexington’s Urban Service Area and forms the largest of this study’s five sites. The site is situated between two Interstate Highways—I-64 to the north and I-75 to the west—and Winchester Road to the south. The site’s eastern boundary is agricultural land.
Areas 3, 4, and 5 are often shown together for the purposes of this Chapter since they are all adjacent to one another and share many of the same characteristics.
Area 3 is located adjacent to the Urban Service Area’s southeastern corner. It is bounded by Athens Boonesboro Road to the south and I-75 to the east. Area 4 is immediately adjacent to the east, but I-75 acts as a major barrier, while Area 5 is also nearby to the southeast. Several subdivisions form this site’s northern and western boundaries, including Walnut Creek and Chilesburg, two dense single-family subdivisions. Area 3 also includes Brenda Cowan Elementary School and the undeveloped portion of land attached to Edythe Jones Hayes Middle School.
Located immediately to the east of Area 3, Area 4 is bounded by Todds Road to the north, I-75 to the west, and portions of Canebrake Drive to the east. The cluster of hotels and highwayservice businesses located where Athens Boonesboro Road crosses I-75 forms the site’s southern boundary.
Athens Boonesboro Road forms the spine of Area 5. The boundary extends between 1/8-mile and 1/3-mile on either side of Athens Boonesboro Road site and mostly includes this area’s non-residential uses: the hotel and highway-service businesses adjacent to I-75 and the industrial uses along Blue Sky Parkway.
■ Identified by the
Commission on October 26, 2023
■ Total acreage of 2,833 acres
■ Spread across 5 approved areas, in three geographic edges of the

■ Along major corridors
■ Potential as ‘gateway’ moments into the

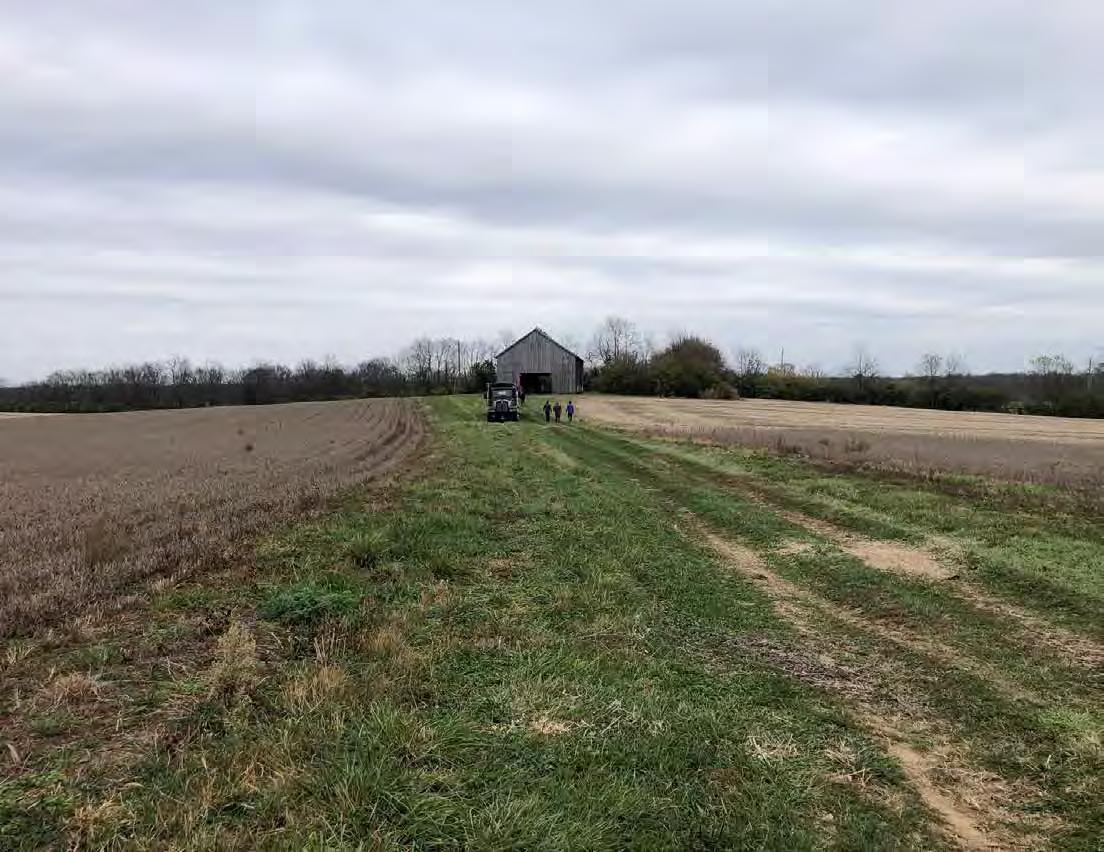
Given that all of the proposed areas of future growth are outside of the existing Urban Service Area, the majority of the sites are low density and used mostly for agricultural purposes.
Area 1 is the smallest of the five areas. The land is currently being used for cattle and horse pastures with seven paddocks for horses and areas for grazing animals. There are several associated barns, outbuildings, and the original farmhouse on site.
The vegetated entry to Pine Needles Lane is included in Area 1. This parcel is owned and maintained by the Heritage Place HOA, which is the adjoining community.
Area 2 is the largest of the five areas. It includes a cluster of single-family homes along Hume Road and Ami Lane. Several large lot rural residential homes are scattered throughout the site.
There are several actively managed farms, which include a residence and multiple barns or outbuildings. Non-residential uses include WKYT News
station, and part of a power sub-station.
Area 3 is sparsely developed, other than a single operational farm west of Brenda Cowan Elementary. The remainder of the land is unoccupied and used for crop rotations. The northernmost portion of the site is landlocked and has access through a temporary easement into the adjacent neighborhood to the west. Access to these parcels would need to be reevaluated depending on any future development.
Non-residential uses include: two public schools, Brenda Cowan Elementary School and the back portion of Edythe J. Hayes Middle School.
Area 4 consists of several large agricultural tracts along Todds Road. The farmland has a mix of row crops and pasture.
There are a series of 10-acre lots along Canebrake which were subdivided in 1987, a few of which have dwellings on them.
Area 5 is the most developed of the 5 sites. The Blue Sky Rural Activity Center, centered around the Blue Sky Parkway, hosts a wide variety of industrial sites, including freight, light manufacturing, and construction services.
The Blue Sky Rural Activity Center also contains several hotels clustered at the I-75 interchange with Athens Boonesboro Road. The remainder of the areas at the corners of Athens Boonesboro Road and I-75 are highway-serving businesses such as fast food restaurants, gas stations, convenience stores, and an adult entertainment venue.
The land surrounding the recently constructed Lexington Sporting Club soccer fields and future stadium has seen huge changes since 2023, transitioning from being a hilly forested piece of unused land to major earth movement to make way for new fields, parking, and infrastructure. The stated goal is to create an entertainment district based on the new sports complex, but not all of the components have been decided yet.
Source: Lexington-Fayette Urban County Government GIS (LFUCG), 2023
The zoning that regulates development on each site does not immediately offer insight into what types of development and uses are appropriate for future development outside of the existing Urban Service Area. This section describes the current zoning for each area—but perhaps more importantly, the zoning around each site—to reveal what built form and character might fit within each one.
Zoning within Areas
Areas 1, 3, and 4 are exclusively comprised of land zoned Agricultural - Rural (A-R). This category is reserved for agricultural
operations, including crop production, pastureland, and equine-related facilities. Single-family detached residential is also permitted within the zone. Agricultural tracts within Areas 1 and 3 are quite large. Area 4 also features large tracts, along with a series of smaller agricultural lots (a minimum of 10 acres each) along Canebrake Drive that have been subdivided into lots for single-family homes.
Area 2 mostly consists of land zoned A-R, similarly organized into large agricultural holdings. A small, single-family neighborhood (zoned R-1A) extends along
Hume Road and Ami Lane.
Area 5’s zoning is the most distinct of the five sites. While some small pockets of A-R remain, the majority of Area 5 is zoned Light Industrial (I-1). Land immediately adjacent to I-75 is zoned commercial (B-3 and B-5P), which permits auto-centric businesses including hotels, quick service restaurants, gas stations, and other such uses.
5 4 3 2 1
When considering adjacent zoning, much of the five areas are surrounded by land outside of the Urban Service Area, zoned A-R. Areas 1, 2, and 3 also share significant edges bordering areas of Lexington within the Urban Service Area, which fall under a variety of the City’s standard urbanized zones.
To the southeast of Area 1 are multiple single-family subdivisions, mostly zoned R-1C. Conforming lots in R-1C are a minimum of 8,000 square feet, and with 1 dwelling unit per acre, R-1C zones reach a maximum density between 5-6 units per acre. Also, immediately adjacent to Area 1’s boundary is a small multifamily development zoned R-3. Immediately north of Area 1 is an A-R tract and a park that is zoned R-1A (Cardinal Run North). There are two Agricultural - Urban (AU) districts adjacent to Area 1, which are available for an urbanized use. A small sliver is situated between Area 1 and R-3, while the larger A-U district is currently used as a park (Cardinal Run South).
I-75 forms the western boundary of Area 2, as well as the eastern boundary of the Urban Service Area. Across I-75 from the site are several districts zoned B-3, B-5P, and B-6P, all permissive of auto-oriented businesses. These non-residential districts back up to single-family (R-1C,
R-1D, R-1E) and multifamily districts (R3). Between I-75 and Area 2’s boundary are two “expansion area zones” - EAR-1 and ED. EAR-1 is reserved for low-density residential, while the ED zone is reserved for job production
To the north of Area 3 are several new subdivisions that fall under Expansion Area Zones (EAR-2 and CC). These zones are intended to provide a well-managed transition in density between the urban area of the city to its agricultural surroundings.
A-R Agricultural - Rural Agricultural land (crops, pasture) and limited single family dwellings
A-U Agricultural - Urban Undeveloped land within urban growth boundary, with restrictions on development until infrastructure and services are provided
R-1A Single-Family Residential (SFR)
R-1B SFR
R-1C SFR
R-1D SFR
R-1E SFR
Detached homes on 25,000 sf lots
Detached homes on 15,000 sf lots
Detached homes on 8,000 sf lots
Detached homes on 6,000 sf lots
Detached homes on 4,000 sf lots
R-1T Townhome Residential Attached homes, minimum lot size 1500 (maximum 12 attached)
R-3 Planned Neighborhood Residential Mixed residential district (multifamily, townhomes, and single-family detached)
B-1 Neighborhood Business Commercial district catering to businesses that serve residential neighborhoods
B-3 Highway Service Business Commercial district catering to auto-oriented businesses appropriate for highways
B-5P Interchange Service Business Commercial district catering to businesses appropriate for interstate interchanges
B-6P Commercial Center District intended to create walkable retail and business developments
I-1 Light Industrial Manufacturing, logistics, and other industrial without nuisances
P-1 Professional Office Offices and professional uses
Expansion Area Zones
EAR-1 Expansion Area Residential Low density residential, mixed type (3 units/acre maximum)
EAR-2 Expansion Area Residential Low density residential, mixed types (9 units/acre maximum with density transfer rights)
CC Community Center Mixed use district that permits residential, retail, and office
ED Economic Development Non-residential district that permits office and industrial uses
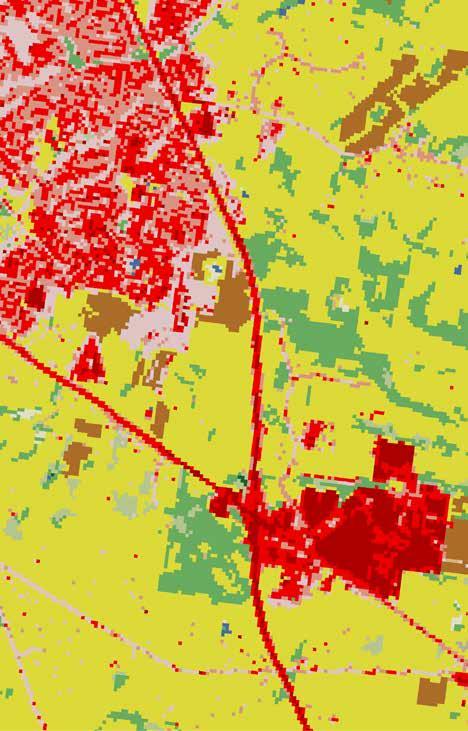
In early 2024 when the Project Team reviewed each area of study in person and from aerial imagery, each area of study, with the exception of Area 5, contains significant portions of agricultural land. The use of the agricultural land differs across the landscape and use is challenging to discern from aerial imagery alone. Data from the National Land Cover Database (NLCD), shown in the following maps, provides an additional layer of detail but still contains a margin of error. For instance, there is a portion of land in Area 3 which is existing agriculture being shown as ‘Developed Open Space’, most likely as a result of being heavily disturbed. The NLCD data is taken at a zoomed out scale, providing a good, but not very specific, idea of what may be happening on th ground.
Almost all of Area 1 is occupied by grazing land, labeled “hay/pasture” by the NLCD. From aerial and street-view imagery, there appear to be seven pastures or paddocks total within this area, used primarily for cattle grazing and equine turnout. The NLCD data shows how suburban development has altered land cover up to the boundary of Area 1.
There is also a small parcel of land included within Area 1, which acts as the
landscaped entry of Pine Needles Lane into the neighborhood.
Similar to Area 1, the majority of Area 2 contains grazing land, with some agricultural land devoted to cultivated crops in the eastern portion of the study area. These grazing tracts are divided by riparian zones lining North Elkhorn Creek and its smaller tributaries. The limited amount of developed land in Area 2 can be found in the single-family neighborhood extending along Hume Road and Ami Lane.
Area 3 features large agricultural holdings of hay/pasture, especially toward I-75 to the east and Athens Boonesboro Road to the south. Some plots of cultivated crops are also captured in the land cover data. This area features significantly more developed land cover than Areas 1 and 2. The “medium intensity” and “high intensity” land cover represents Brenda Cowan Elementary School. The large swath of land identified as “developed, open space” adjacent to the recent subdivision development to the north could indicate a few things. Aerial imagery shows this area as grazing land, although the area is dotted with clear,
circular patches of green which could indicate a different land use. Still, most of the land identified as “developed, open space” appears to be for agricultural use.
Area 4 includes several large agricultural holdings, as well as a handful of smaller agricultural tracts along Canebrake Drive. Most of these holdings are being used for grazing land or crop rotations. However, a sizable portion of them are forested, especially those farther north along Canebrake Drive, and many do not have an active agricultural use.
Area 5 is the most distinct from the other four study areas. While the far western portion of the study area was characterized by forested land cover, the current development of the soccer complex has since removed the majority of the treed portions of the site. The remaining bulk of Area 5 has been developed to a relatively high intensity. Land cover data shows how this development had been limited to Blue Sky Parkway and the four corners of the I-75 on-ramps.
Hay/Pasture
Cultivated Crops
Deciduous Forest
Mixed Forest
Developed, Open Space
Developed, Low Intensity
Developed, Medium Intensity
Developed, High Intensity
Open Water
Site Boundaries
Parcels
Parks Interstates Main Arterials Other Streets
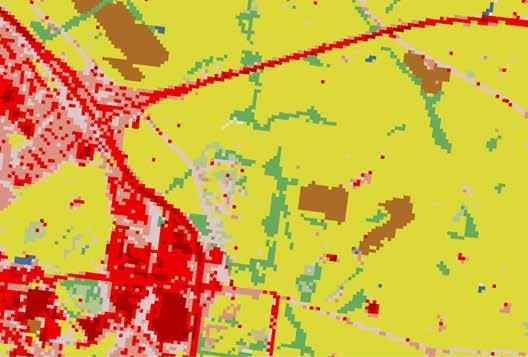
Source: National Land Cover Database (NLCD), 2021 NLCD data is provided at 30-meter resolution, meaning that each pixel has a width of
Land preserved under Lexington-Fayette County’s Purchase of Development Rights (PDR) program can be found near the five areas of study. Because these lands cannot be developed due to legally binding conservation easements. Any development projects occurring within these five areas must consider how to buffer or transition between developed neighborhoods or districts and conservation areas.
The tracts closest to Area 1 that are protected under PDR are located about one mile to the south, along Bowman Mill Road where it meets South Elkhorn Creek (not shown in map extents).
Two PDR tracts are located close to Area 2’s boundary, one immediately adjacent to the area’s northeastern corner across Royster Road (approximately 40 feet) and another to the north across I-64 (approximately 250 feet). Both of these tracts appear to be utilized for agricultural operations, mostly pasture.
PDR land is clustered to the south and east of Areas 3, 4, and 5. The southern tracts consist of smaller agricultural holdings, mostly used for pasture, while the eastern tracts are larger and appear to be used for a variety of agricultural production, including both pasture and cultivated crops.

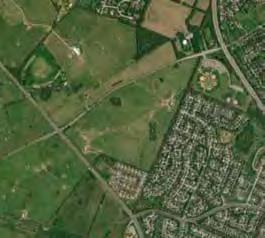
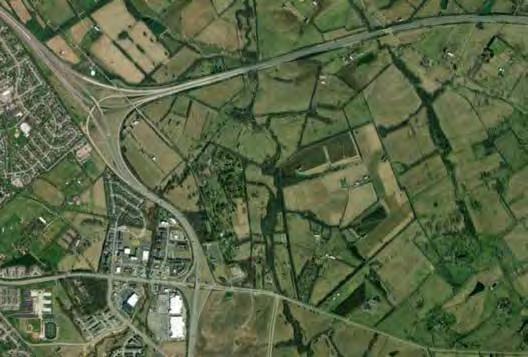
Example of Agrucltural Uses - Equine and Hay
Source: Lexington-Fayette Urban County Government (LFUCG) GIS, 2023
While Fayette County is known for its karst* landscape, it is important to note that specific karst features have been identified as either existing sinkholes, or areas of potential future karst features, including sinkholes, caves, springs, etc. It may be advisable to avoid high density development in areas known to have problems.
Area 1 is characterized by rolling terrain of 10% or less slope. The site falls from east to west with two drainage features leaving the site, one under Parkers Mill Rd and the other under Man O' War Boulevard.
While not impeded by existing drainage channels, floodplain, or steep slopes, the identified existing and potential karst features will present challenges to the overall development due to issues with building foundations and other structural concerns.
Area 2 has two distinct regions, the neighborhood development along Hume Road with slopes in the 10% - 20% range and the undeveloped portions which area predominately 10% or less with pockets of steeper slopes.
Areas 3, 4, and 5 have more topographic relief than the other Areas, with substantial portions of land that is undesirable or unsuitable for development (slopes over 20% and some in the 10% - 20% range). The northern region of Area 4 has significant portions of gentle slopes of 10%.
Area 3 has pockets of mapped karst / sinkholes, but additional areas may be present beyond those mapped given the expected site geology and topography.
In general, much of the undeveloped portions of Area 3, 4, and 5 would require minimal earth movement and would
lend themselves to development given that design respects the topography. Care should be taken to avoid the areas with steep slopes and known karst areas, and developers should be cognizant that additional unmapped areas may be present.
*
Karst – a type of landscape formed when the earth's bedrock dissolves, leading to features like sinkholes, caves, and springs. It usually occurs in areas with soluble rocks like limestone, marble, and gypsum. In a typical karst landscape, rainwater seeps into the ground through cracks and holes in the rock. This water can travel underground for long distances before it comes back to the surface through springs, often found at cave entrances.


<3% Slope- Suitable for Building
3-10% Slope- Suitable for Building
10-15% Slope- Suitable for Building with Restrictions
>15% Slope- Not Desirable for Building
Sinkhole / Karst


Source: Lexington-Fayette Urban County Government (LFUCG) GIS, 2023
When imagining how these areas could accommodate thoughtful development, it is important to note environmental and geological features that should be protected from negative impacts.
Areas 2 and 4 both feature prominent waterways that would affect the shape and orientation of development plans. The tributaries shown on the maps without floodways or FEMA floodplains are classified by the U.S. Geological Survey (USGS) as intermittent streams, which may not have flowing surface water and which flow during certain times of the year when smaller upstream waters are flowing and when groundwater provides enough water for stream flow.
While two small streams begin within Area 1, ultimately draining to Cave Creek southwest of Man O' War Boulevard, Area 1 otherwise does not experience many challenges with existing waterways. The features drain into Manchester Branch, Wolf Run, and Cave Creek, and none have mapped FEMA floodplains within Area 1. A jurisdictional determination has not been made on these features. Based on the Kentucky Water LiDAR Analysis, numerous sinkholes / karst features are present on the site.
Area 2 has multiple drainage features (streams and ponds), some of which are jurisdictional, and some have not been classified. All water flows south to north and discharges under I-64. North Elkhorn Creek bisects Area 2 from I-64 to the north to Winchester Road to the south. There are approximately 18 acres of floodplains within Area 2, comprising just under 2 percent of the study area. The mainstream sections through the center of the site have both FEMA mapped floodplain and floodways which will create challenges with roadway connections within the site.
While no karst features are presently mapped, they could be present given the geology of central Kentucky. Given the existing FEMA floodplains and floodway dividing the site, multiple road crossings will be challenging. Larger than typical drainage structures or lengthy permitting associated with the FEMA process to allow flood impacts may be required. Additionally, if structures are selected that impact the stream channels, an individual permit through the U.S. Army Corps of Engineers (USACE) may be triggered depending on the number of crossings that would exceed the Nationwide Permitting thresholds.
Areas 3 and 5 are less affected by streams and floodplains, though several waterways still appear within their boundaries. Area 3 features no floodplains, though several streams drain to the south.
Area 3 drains into three separate drainage basins with a high point in the center of the site. Additionally, there are existing ponds on site. To the northeast, the site drains under I-75 and to the southwest, it drains under Athens Boonesboro Road. To the southeast, flows drain into Area 5 and then under I-75.
Area 4 is broken into two distinct drainage basins, one to the north and one to the south. In Area 4, the Baughman Fork of Boone Creek begins in the northern portion of the study area, draining away from I-75 toward Boone Creek to the East. Neither of the drainage features have mapped floodplains. Ponds are also present on site in the northern region.
In Area 5, a sizable floodplain is situated on the northern edge of the industrial area along Blue Sky Parkway, ultimately draining to Boone Creek as well. Area 5 drainage connects with both Area 3 and Area 4 features but does not have mapped floodplains; however, just off-site to the east of the Area 5 limit, floodplains are present.
Although a formal assessment has not yet been completed by the state government, it's likely that many of these areas will be identified as intermittent or perennial streams, and their surface waters will be considered state waters.
As roadway networks are developed, staying below the Nationwide Permit thresholds with the USACE for stream and open water impacts should be considered to avoid the Individual Permitting process. While steep slopes are present in Area 4, avoiding impacts to the channels should limit development in those areas. Alternatively, if the channels are either unregulated or permitted to be filled, large scale earth moving will alleviate the limitations with the slopes.
Currently, there is a delay at the traffic light on Lane Allen Road and Parkers Mill Road, where drivers often wait for more than one signal cycle to get through the intersection in the morning. Queues in the morning can reach up to 25 vehicles on Lane Allen Road. When this happens, only a third of the vehicles can clear the intersection during the green phase of the cycle. The intersection does not experience the same level of queuing outside of the AM or PM peak periods. At the Parkers Mill Road at Man O' War Boulevard intersection, the traffic signal
appears to be sufficiently managing traffic flow. Despite the maximum queue length of 15 vehicles in the evening, queues are flushed each cycle. Operations are consistent and under capacity, given the current demand.
Finally, the Man O' War Boulevard at Beaumont Centre Lane intersection is busy during peak hours, with Beaumont Centre Lane having a typical queue of 15-20 vehicles. However, queues are successfully cleared each cycle and the intersection appears to efficiently manage the demand. Nearby Dunbar
High School does generate additional traffic during the school year. The additional traffic results in an increase in delay experienced at the intersection; however, the overall impact is restricted to school arrival and release.
Average Daily Traffic (ADT) –the average number of vehicles passing a specific point on a roadway on an average day.
K factor – the proportion of annual average daily traffic occurring in an hour.
D factor – the proportion of traffic traveling in the peak direction during a selected hour.
The site is strategically located with potential vehicular and multimodal connections to the adjacent neighborhoods and parks. Between stubbed roadways ending at the site and connections to the Beaumont Walking Trail, this site is surrounded by transportation facilities for efficient mobility, as well as recreation. The site benefits from the presence of sidewalks along the entire extent of Man O' War Boulevard, which is located on the southwest edge of the site. Conversely, Parkers Mill Road, another road adjacent to the site, does not have any pedestrian facilities.
The Lexington Area Bicycle & Pedestrian Master Plan (page E-8) indicates that walking and biking in Fayette county is “difficult and dangerous due to driver behavior” yet, “important for transportation and recreation.” The plan indicates high to moderate support for bike and pedestrian improvements adjacent to the corridor, such as along Parkers Mill Road inside Man O' War Boulevard. The plan proposes a minor bikeway along Parkers Mill Road from Lane Allen Road to Man O' War Boulevard, another minor bikeway along the eastern edge of the site, and a major
bikeway along the extent of Man O' War Boulevard. The plan identifies these facilities as mid-term priorities.
The site is not currently accessible by public transportation with the closest Lextran access point being approximately 1.5 miles to the northwest.
Primary safety concerns adjacent to the site are most notable along Parkers Mill Road and at the intersection of Man O' War Boulevard and Parkers Mill Road. In recent years, there have not been any crashes involving vulnerable road users such as pedestrians or bicyclists. However, vehicular crash patterns are evident at both the mentioned intersection and in clusters along Parkers Mill Road.
Urban Cycle TrackMontreal, Canada
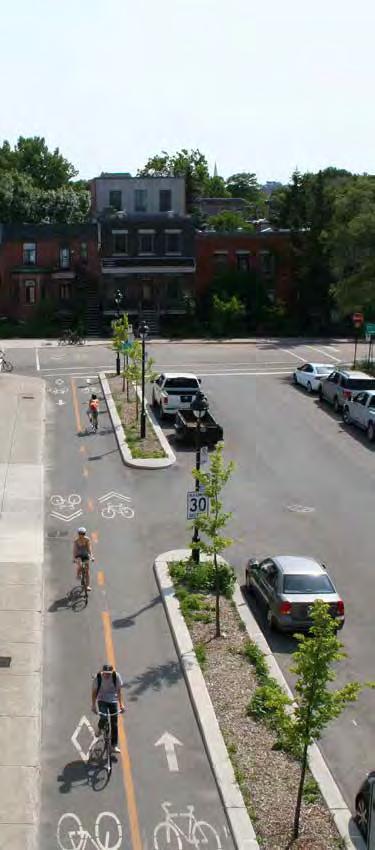
Hume Road at Winchester Road is an unsignalized intersection experiencing typical morning queues of 4-5 vehicles and evening queues of 6-8 vehicles. However, traffic backing up on westbound Winchester Road near I-75 often impedes Hume Road’s traffic flow, making it difficult and potentially unsafe to turn onto Winchester Road from Hume Road. Left turns from Hume onto Winchester Road and from Winchester Road onto Hume are problematic turning movements. The intersection’s operational efficiency is highly dependent on the I-75 interchange, given the proximity. There are plans to realign Hume Road to align with an access point to development across Winchester Road,
moving the access point further east.
Winchester Road at Polo Club Boulevard recently became a signalized intersection. Despite some queuing, the intersection operates smoothly and delays in the area have decreased.
The intersection of Man O' War Boulevard at Winchester Road also displays significant differences in demand and operations during peak morning and evening hours. In the morning, both directions of Winchester Road experience efficient operations and manageable traffic volumes, with typical queues of 5-7 vehicles. However, the evening period sees increased traffic, leading to longer queues and cycle lengths. Eastbound Winchester Road is particularly
congested, with a roughly one mile-long backup due to the Man O' War Boulevard signal capacity not meeting the current demand. This intersection could experience even greater deficiencies with additional demand if not modified.
Planned improvements within the MTP and TIP for the area include a KYTC District 7 project to widen and redesign Winchester Road from Polo Club Boulevard to Haley Road for vehicular and multimodal improvements.
While adjacent to a handful of vehicular connections, there are currently no pedestrian facilities adjacent to this site along Winchester Road, Hume Road, or Royster Road. A potential access point to the site could line up with Polo Club Boulevard. This would allow for a connection to the existing pedestrian facility along Polo Club Boulevard, but the nearest bus stop is still approximately 1.25 miles to the south, which is beyond the point the average person will walk for transit.
The Lexington Area Bicycle & Pedestrian Master Plan proposes a minor bikeway through the property that would connect to an already funded facility along Polo Club Boulevard to the south and to a proposed bikeway on the other side of the interstate to the west. The plan identifies all of these facilities as longterm priorities.
There are currently two routes that come near the site area. Route 7 North Limestone and Route 10 Hamburg
Pavilion both have stops that are accessible via Winchester Road. As stated previously, the existing bus stop on Polo Club Boulevard is beyond a usable distance for the site, but plans for a closer stop would greatly increase the likelihood of ridership. Another bus stop is located on Buena Vista Road, about 0.5 mile to the west. However, this stop is on the other side of an interchange and lacks any existing pedestrian facility connections.
Primary safety concerns are centered around the on and off ramp at Winchester Road and I-75. While no pedestrian incidents were noted, there is concern for pedestrian- and cyclist-related safety due to the lack of infrastructure present surrounding the site.
Hume Road, even with its existing residential neighborhood, has a narrow street section and lack of pedestrian infrastructure.
Indianapolis Cultural TrailIndianapolis, IN
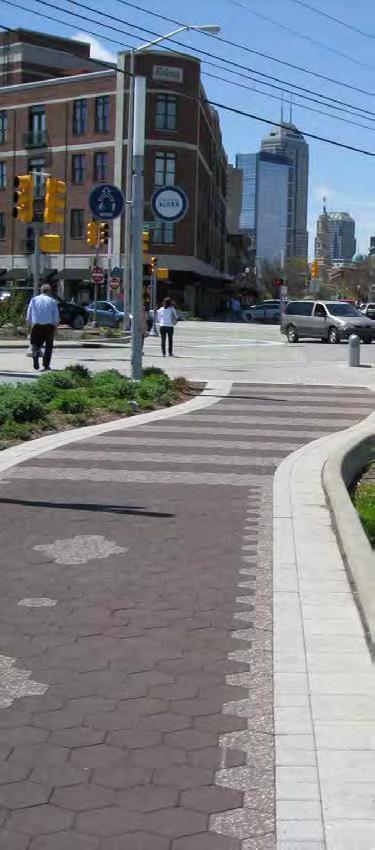
Athens Boonesboro Road, adjacent to the three project areas, experiences elevated levels of congestion in both the morning and evening peak hour periods. At the Hays Boulevard signalized intersection, inbound and outbound traffic on Athens Boonesboro Road queues can exceed 1/2 mile during the peak periods. Hays Boulevard has a higher volume in the morning peak period, with a typical queue length of 10-12 vehicles. However, vehicles in the right turn lane of Hays Boulevard often must wait through multiple cycles to make their turn.
The Kentucky Transportation Cabinet’s plans for ‘R-cut improvements’ currently stretch from Richmond Road out to Hays Boulevard, with future phases to extend those improvements all the way out to the area around the I-75 interchange. The R-Cuts are primarily proposed to reduce high angle / very severe collisions being observed at signalized intersections and to provide a safe crossing point for bicyclists and pedestrians. The traffic flow benefit, while not insignificant, is secondary.
Area 3 is bordered by I-75 to the east and a neighborhood to the west, creating the only vehicular access along Athens Boonesboro Road.
The creation of a signalized intersection as part of the new development around the sports complex in Area 5 is helping to move visitors to the new venue in a safer way, particularly at peak times around set practice or games times. Eventually, this intersection will be improved further during the expansion of the R-cut project.
Intersections along Athens Boonesboro Road close to and south of the interstate, on the other hand, experience much lower volumes. In both peak hours, vehicles are rarely required to queue along the unsignalized Canebrake Drive or the unsignalized Blue Sky Parkway intersections. While the Blue Sky Parkway intersections experience a steady flow
of vehicles from the side road, the low volumes along the main road prevent a queue from forming.
The demand-to-capacity ratio along Todds Road is lower than that described for Athens Boonesboro Road. Operations at the intersection of Polo Club Boulevard and Todds Road are similar in both morning and evening peak periods. This unsignalized intersection experiences low volume and low queues on Polo Club Boulevard. Vehicles are able to make turns onto Todds Road easily and frequently. Another nearby intersection along Todds Road at Hays Boulevard experiences much higher volumes, especially in the morning peak period.
Due to drop off at the adjacent AthensChilesburg Elementary School, the queue is about 15-20 vehicles on average. However, with it being a signalized intersection, this queue clears each cycle.
While surrounded by a network of varied roadway classifications to aid in vehicular mobility, there are no bicycle or pedestrian facilities available within the vicinity of these sites except for sidewalks spread throughout the Walnut Creek and Chilesburg neighborhoods to the northwest of Area 3.
The Lexington Bike and Pedestrian Master Plan proposes a minor bikeway through the existing previously mentioned neighborhood adjacent to Area 3 and a major bikeway along Athens Boonesboro, from Man O' War Boulevard to the I-75 interchange. However, it does not propose any additional pedestrian facilities in the area and identifies all these facilities as mid-term or long-term priority.
The nearest access to public transportation is situated nearly 3 miles away on Athens Boonesboro Road at the St. Joseph East Hospital, which is well beyond a walkable distance to access transit.
There are existing safety concerns surrounding these sites. The lack of multimodal facilities, and the location of Brenda Cowan Elementary School, are a worrying combination for the safety of all users. Additionally, there are high crash rates at intersections near the site and at the interchange of Athens Boonesboro Road and I-75.
An increased desire for more multi-modal access to the area around the soccer complex from locations in the heart of Lexington and in any future development in other portions of Areas 3, 4, and 5, will need to be considered.

Source: Lexington-Fayette Urban County Government (LFUCG) GIS, 2023
Electric service is provided by Kentucky Utilities (KU).
Based on provided mapping by KU there is a substation just north of the Area 1. Three phase distribution lines that would be able to serve Area 1 run along the eastern portion of Parkers Mill Road and along Man O' War Boulevard. While without exact development patterns defined, capacity cannot be confirmed, there were not specific concerns for this area especially with a nearby substation.
There is a substation located north of Winchester Road at Hume Rd. As with Area 1, capacity was not a specific concern given the location of the substation. The existing infrastructure running through the Area would not be sufficient to provide distribution to new development.
There are existing three phase distribution lines along Athens Boonesboro Road and at the intersection of Todds Road and I-64/I-75.
Overall areawide capacity could be a concern as well as the existing distribution lines at the perimeter. Larger scale upgrades may be necessary depending on the anticipated development pattern.
Water service is provided by Kentucky American Water (KAW).
Based on mapping provided by KAW, a 24” main runs along Parkers Mill Road and a 12” main along Man O' War Boulevard.
An 8” main runs along Royster Road and a 12” main along Winchester Road. Dead end mains extend into the development area along Hume Road and Ami Lane.
A 12” main runs along Athens Boonesboro Road with another main extending into the area serving Brenda Cowan Elementary which is fed from the existing subdivision to the northwest.
A 12” main runs along Todds Road for a portion of the area and then reduces to a 6” main. Additionally, an existing 8” main along Canebrake Drive feeds from an existing 12” along Athens Boonesboro Road that feeds interior to the area.
A 12” main runs along Athens Boonesboro Road and Blue Sky Parkway.

Gas service is provided by Columbia Gas.
Based on mapping provided by Columbia Gas, there are no mains along the Man O' War Boulevard or Parkers Mill frontages, but 2” – 4” medium pressure mains exist to connect to within the adjacent subdivision as well as at the northeast edge along Parkers Mill Road.
A 6” – 8” medium pressure mains exist along Winchester Road and Hume Road. Ami Lane has existing service but through a smaller main than needed to support the full development.
No existing mains currently exist along the Athens Boonesboro Road frontage. There is a transmission main running through the study area in the area of Brenda Cowan Elementary School but is not available to be used for service as it is owned and operated by TC Energy rather than Columbia Gas. There are 2” –4” medium pressure mains existing in the subdivision to the northwest to connect to.
Existing 2” – 4” medium pressure mains are present in Canebrake Drive and Canebrake Court.
Existing medium pressure mains are located within Blue Sky Parkway as well as Athens Boonesboro Road to the east of I-75. No mains are present west of I-75.
Once a development pattern is determined, new infrastructure would be needed. Capacity or pressure concerns were unable to be evaluated by utilities at this time due to the significant variability in demands of different development patterns.
Telecommunication
Telecommunications is provided by Windstream, and others (e.g. AT&T, Spectrum, Metronet,etc.) who did not provide information on their service lines.
Windstream has existing fiber and electronic networks near the intersection of Parkers Mill Road & Man O' War Boulevard that will support future growth in the area.
Windstream has existing fiber along Winchester Road. The existing fiber is not adequate to meet the needs of a development of the magnitude described and would need to add additional electronics and fiber to support the expected development at an estimated cost of $50,000.
From information provided by Windstream, they have existing fiber along Athens Boonesboro Road but it is not adequate to meet the needs of a development of the magnitude described. It would require additional electronics and fiber to support the expected development at an estimated cost of $50,000.
Sanitary sewer service is provided by LFUCG, when available. The images on the following pages show the sanitary sewer mapping provided in the Sanitary Sewer Capacity Master Plan.
Ultimate treatment of sanitary sewer flows is handled by LFUCG. Sewer infrastructure is expected to be owned and maintained by LFUCG but may take further discussion in unique cases. Construction of the proposed improvements required to serve the areas are outlined in this document and the Sanitary Sewer Capacity Master Plan report by Stantec and published April 22, 2024 are expected to be the responsibility of the developer. Refer to the Sanitary Sewer Capacity Master Plan report for additional information and detail.
To provide wastewater services within Area 1, the development will have to build infrastructure to tie into the LFUCG wastewater system. Area 1 drains away from the two adjacent sewersheds, South Elkhorn and Wolf Run, therefore a pump station and force main will be necessary. Based on the preliminary existing conditions data, the most likely location for a pump station would be in the Southwest corner of Area 1. Possible
connection points are shown on the Area 1 Utilities Map. Today's sewer capacity for the two sewershed banks South Eklhorn and Wolf Run would be enough to offset the connection of 1,183 single family homes. Based on projected densities, downstream improvements may be necessary to accommodate the proposed units.
To provide wastewater services within Area 2, LFUCG would have to build a new pump station and force main as Area 2 generally drains away from the Urban Services Area and toward Georgetown. This new pump station would consolidate and replace existing pump stations North Elkhorn and North Elkhorn 2, reducing operations and maintenance costs for the City. The pump station would be located along the north edge of the area near I64. An adjacent wet weather storage tank would be required. The majority of Area 2 will be able to gravity feed to the new pump station with only a small area near Royster Road. A summary of the proposed infrastructure and sizes to accommodate the capacity for the proposed densities within Area 2 is found in the Sanitary Sewer Capacity Master Plan.
To provide wastewater services within Area 3, the development will be responsible for connecting to the city wastewater infrastructure. Area 3 is generally made up of three areas based on topography. Two of these areas will have to build a pump station and force main to connect to the existing wastewater system. The third may be gravity fed towards the existing Boonesboro Manor Pump Station but would require the station be upsized to handle the additional capacity. Area 3 will be serviced by the East Hickman PS along with Areas 4 and 5, which currently has enough capacity to handle the anticipated proposed units.
To provide wastewater services within Area 4, the development will be responsible for connecting to the city wastewater infrastructure. Area 4 is generally made up of three areas based on topography. The large area closest to Todds Road flows east towards Baughman Fork, as does a portion of Area 3. A pump station and force main will be necessary to connect these two areas, part of Area 4 and part of Area 3 to the city wastewater system. A small pump station and force main will be needed to connect to the city wastewater system in the central area of Area 4. The southern
portion of Area 4 naturally drains towards Blue Sky. Area 4 will be serviced by the East Hickman PS along with Areas 3 and 5, which currently has enough capacity to handle the anticipated proposed units.
To provide wastewater services within Area 5, the development will be responsible for connecting to the city wastewater infrastructure. Areas west of I75 naturally drains to Boonesboro Manor Pump Station. Areas east of I75 and south of Athens Boonesboro drains to the south and currently the hotel owns a private pump station that discharges to the city wastewater system. A new pump station located closer to the southern boundary will likely need to be installed to service the undeveloped properties. The areas within Blue Sky are mostly already sewered and any additional would be served by gravity to existing city infrastructure. Area 5 will be serviced by the East Hickman PS along with Areas 3 and 4, which currently has enough capacity to handle the anticipated proposed units.
Created by Stantec for LFUCG
Possible Connection Point #3 (WR2_710_WR2_375)
Possible Connection Point #1 (EH6_982A_EH6_982)
Possible Connection Point #2 (EH6_801_EH6_800) 3A 3B 3C
Possible Connection Point #1 (Boonesboro Manor PS) 5A
Possible Connection Point #2 (Blue Sky PS)
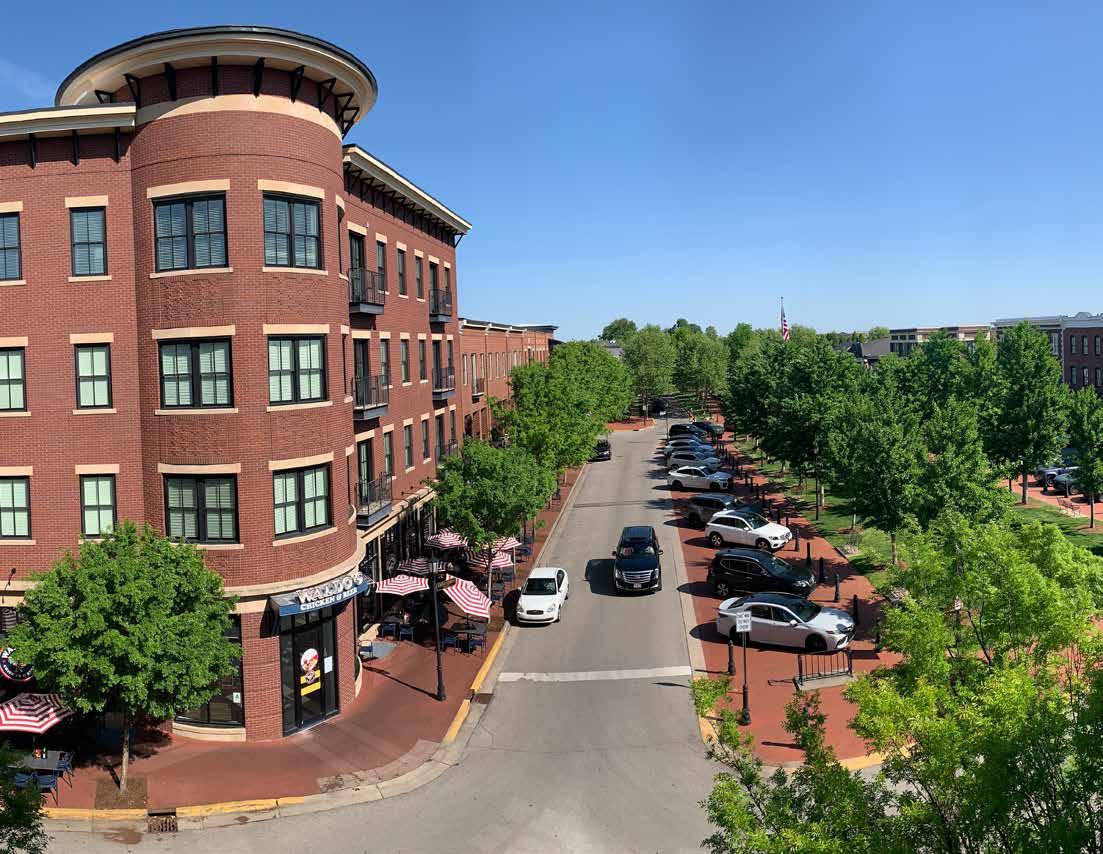
This chapter contains the complete Market Scan as submitted and presented to the Planning Commission in April 2024. The Market Scan reviews local demographics, housing needs, and market conditions to be used as a foundation for a master plan to incorporate land in the Urban Growth Management area. The analysis focuses on Lexington-Fayette Urban County in comparison with the Lexington-Fayette Metropolitan Statistical Area (MSA).
The market analysis reviews trends and potentials for residential, office, industrial, flex space, retail and hotel development to 2045. As the economy in the Lexington-Fayette Metro Area steadily expands, population growth continues but at a slower pace than in recent years. The City of Lexington’s population is projected by the University of Louisville to grow 14.8 percent from 327,388 in 2023 to 375,774 by 2045. Additionally, the number of households in Lexington will grow somewhat more quickly, by 18.2 percent, for a 2045 population of 161,776. That represents an increase of roughly 48,400 residents and 24,900 households.
Five expansion areas to the Urban Service Area have been identified by the Planning Commission in response to an Urban County Council directive. A new master planning effort is now underway for the proposed expansion areas. As a foundation for that plan, Partners for Economic Solutions was commissioned to prepare a market analysis. This market analysis includes:
• a profile of the Lexington economy and its position in the regional economy;
• an assessment of Lexington’s strengths, weaknesses and opportunities;
• current residential market position and future potential;
• commercial and industrial market positions;
• trends in commercial and industrial development and land use; and
• future employment and land demand for different uses.
The entire Master Plan will incorporate the market findings into the development concepts considered for each expansion area and in developing zoning and land use regulations.
The City of Lexington is an integral part of the Lexington-Fayette Metropolitan

Statistical Area (MSA).* This analysis of economic and development potentials begins with an analysis of the region’s and Lexington’s economies.
To understand the economic context, the analysis begins with a detailed review of the job market and the total number of wage and salary jobs. The Lexington-Fayette MSA has enjoyed rising employment levels over the last 50 years. In Lexington, the number of jobs more than doubled from 99,900 in 1970 to 241,900 in 2020. As expected, its share of the regional economy remained relatively stable, shifting down slightly from the 73.2 percent of all MSA jobs in 1990 to 69.7 percent in 2020. (See Appendix Market Analysis Data Table A-1.)
Lexington added 21,556 net new jobs from 2010 to 2020, a 9.8-percent increase equivalent to a 0.9-percent average
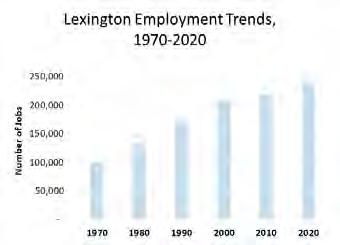
annual growth. (See Appendix Market Analysis Data Table A-1.) This compares with 11,900 net new jobs – an 0.5-percent annual increase – from 2000 to 2010.
Employment in Lexington grew faster than in the State of Kentucky from 2002 to 2021 (latest year for work data available
from the Census Bureau). Data from the Longitudinal Employer-Household Dynamics (LEHD) highlight a 13.4-percent growth in jobs for Lexington compared to 9.2 percent for the State of Kentucky.
Labor force participation represents individuals currently employed and those searching for jobs. Comparing labor force participation in conjunction with an area’s unemployment rate offers a baseline of a geography’s economic health. For Lexington, the higher labor force participation rate of 67.9 percent in 2022 reflects a stronger economy, faring better than the Lexington-Fayette Metro Area (66.4 percent) and the State of Kentucky (59.5 percent). Lexington and the region experienced a 3.1-percent unemployment rate in 2022.
*The Lexington-Fayette Metropolitan Statistical Area (Lexington-Fayette Metro Area) includes the following counties: Bourbon; Clark; Fayette; Jessamine; Scott; and Woodford.
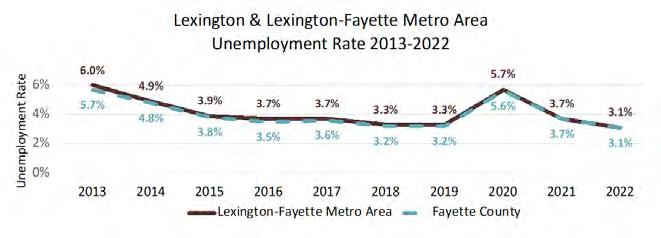
LEHD provides a review of employment by industry sectors. Table 1 shows these data and the large increases in jobs for those in health care, education, and professional and business services industries. Additionally, Table 1 identifies the industries losing the largest number of jobs from 2016 to 2021 – manufacturing; trade, transportation and utilities; and leisure and hospitality.. The leisure and hospitality job loss was directly related to the Covid-19 pandemic and the industry continues to recover. These trends by industry are similar to those experienced across the region.
It should be noted that the Covid-19 pandemic reduced overall employment throughout the nation, but in Lexington and the Lexington-Fayette Metro Area jobs began declining in 2018 prior to the Covid-19 pandemic. Lexington’s peak employment of 204,242 in 2018 dropped by 12,629 jobs at the end of 2020 to 191,613, reducing only another 400 jobs by the end of 2021. Cutbacks in tourism-related and service industries – accommodations and food service, other services and retail trade – were relatively limited. Lexington’s tourism reliance on outdoor horse-related activities may have moderated job losses relative to other areas with restrictions on indoor gatherings. Overall, Lexington lost about 13,000 jobs or 6.4 percent of its total jobs from 2018 to 2021.
Economists use a measure called a Location Quotient to identify industries for which a geography has a particular concentration. Calculated as the industry’s percent of local employment divided by its percent of national employment, a Location Quotient of more than 1.0 indicates that the area may have some particular advantages that allow it to attract a higher number of jobs than national statistics would suggest. Considering 2023 estimated employment data from Woods & Poole (see pg. 194), Lexington has several industries with Location Quotients (LQ) over 1.0, including:
• arts, entertainment and recreation (LQ 1.41);
• forestry, fishing and related activities and other (LQ 1.55);
• transportation and warehousing (LQ 1.33);
• state and local government (LQ 1.26);
• professional and technical services (LQ 1.19);
• administrative and waste management services (LQ 1.05); and
• construction (LQ 1.07).
Employment for service-providing industries in Lexington increased by 2.3
percent, or 3,081 jobs, in the 3rd quarter of 2023. During that time period, the same segment of industries in Nashville, Tennessee saw a loss of 0.4 percent, or 1,642 jobs.
Lexington’s largest employers, as reported by Commerce Lexington, are primarily focused on education, government, and health care, including:
1. University of Kentucky
2. Fayette County Public Schools
3. Amazon
4. Lexington-Fayette Urban County Government
5. Conduent
6. CHI St. Joseph’s Health
7. Veterans Medical Center
8. Lockheed Martin
9. Lexmark International, Inc
10. Lexington Clinic
Total employment at the University of Kentucky (full-time faculty, professional staff and graduate assistants) declined seven percent due to Covid-19 pandemic impacts in 2021-2022, but then recovered three percent in 2022-2023. The increase in faculty resulted in an additional 114 faculty members from 2018 to 2023, but overall university employment declined by 166 employees.
Projections of future employment provide an important basis for analyzing development potentials. Detailed in Appendix Market Analysis Data Table A-2 and illustrated in the chart on the following page, Woods and Poole Economics projections project an 18.5 percent increase in jobs in total Lexington-Fayette Metro Area
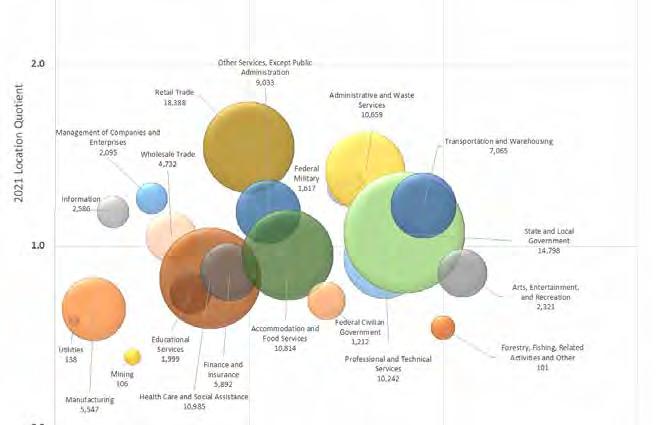
Source: Woods & Poole Economics Inc., 2023 Regional Projections, December 2023; Partners for Economic Solutions, 2024.
employment from 2025 to 2045 with the addition of 70,648 new jobs. These same projections suggest that Lexington will grow more rapidly with a jobs increase of 18.8 percent resulting in an additional 50,893 new jobs.
The projection from 2025 to 2035 shows a 9.8-percent increase with the addition of 37,674 jobs in the Lexington-Fayette Metro Area compared to 10.1-percent growth in Lexington adding 27,460 new jobs. This pace is nearly identical to the 2015 to 2025 period which was expected to add 36,861 jobs in the MSA and 26,682 jobs in Lexington. Minimal growth is projected for finance and insurance, retail trade, transportation and warehouse, and federal government employment, while Lexington is expected to continue to lose manufacturing and information
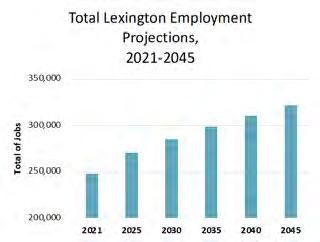
jobs. The largest Lexington job increases from 2021 to 2045 are projected for accommodations and food services (15,000 jobs), health care and social assistance (11,700 jobs), state and local government (8,900 jobs), administrative and waste services (8,700 jobs) and real estate and rental and lease services (7,300 jobs).
Lexington’s share of regional employment is projected to remain stable at approximately 71 percent of regional employment. (See Appendix Market Analysis Data Table A-2.) Over the 25-year projection period, the health care and social assistance industry is expected to expand from 11.2 percent of total Lexington employment to 12.3 percent with a 42-percent growth. Accommodations and food service employment will increase to 10.7 percent of all jobs by 2045, up 77 percent from the 2021 level.
Economic regions are defined largely by the inter-connections between workers and employers. Geographers and economists consider jurisdictions with residents who work in other nearby counties as part of the same economic region. In particular, Lexington benefits
from both the workers who commute into Lexington to work for local employers and from the jobs in other jurisdictions held by its residents.
In 2021, 47 percent of Lexington workers also lived in Lexington, down from 51 percent in 2011 and 2002. Fifty-three percent of Lexington workers lived
outside Lexington with 21.1 percent in surrounding Kentucky counties – Madison, Jessamine, Scott, Clark, Woodford and Bourbon counties as per data from LEHD.
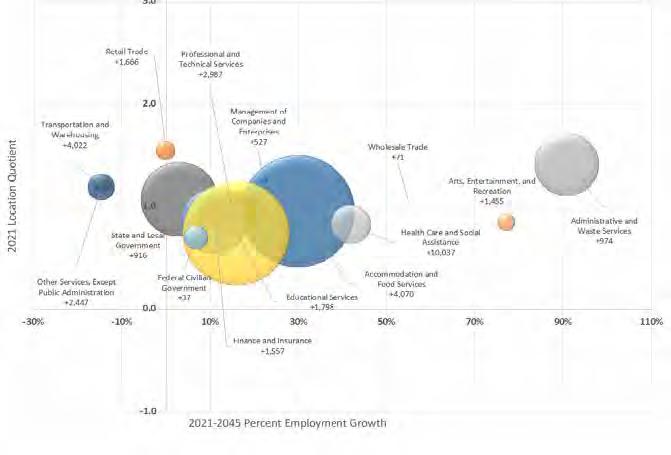
Source: Woods & Poole Economics Inc., 2023 Regional Projections, December 2023; Partners for Economic Solutions, 2024.
It should be noted there is a difference between LEHD’s data, which indicate that more than half of workers commute into Lexington, and American Community Survey data that indicate 30 percent of Lexington workers live outside Lexington. Part of the difference between the two data sources may be individual workers employed in multiple jobs that are double-counted in the LEHD dataset.
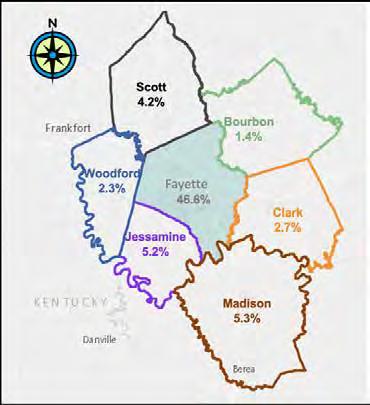
In 2021, LEHD data showed 191,235 workers employed in Lexington businesses and organizations. As summarized in Appendix Market Analysis Data Table A-3, 53.4 percent of these workers were aged 30 to 54. Older workers (aged 55+) represented 12.6 percent of the Lexington workforce in 2002; by 2021, that share had reached 21.5 percent.
More than half of jobs in Lexington paid more than $3,333 per month ($40,000 per year) in 2021, while 18 percent of the jobs paid $1,250 per month ($15,000 per year) or less.
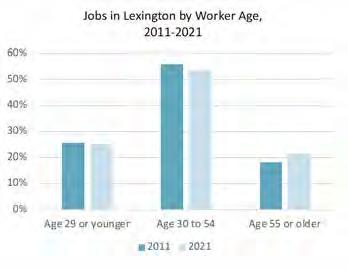
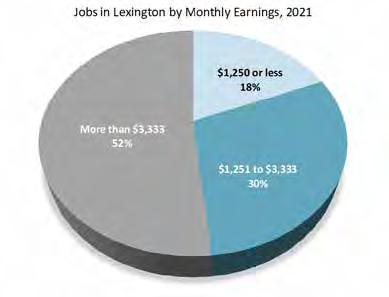
This profile explores population and household characteristics and trends for Lexington and the larger metropolitan area to provide the regional context. These demographics merge data from multiple sources to provide an accurate measure of conditions and activity.
Lexington's population has steadily climbed, from 175,244 in 1970 to 204,616 in 1980 to 226,641 in 1990 to 261,408 in 2000, according to data from Woods & Poole. According to the U.S. Census population estimates, the largest addition of an estimated 35,300 new residents occurred from 2000 to 2010 – a 14 percent growth. Since 2010, growth has slowed with the addition of only 26,767 new residents by 2020— 9 percent growth for the decade. Lexington-Fayette MSA’s growth added roughly 44,712 new residents during the same 2010-2020 time period with a similar growth rate of 9.5 percent.
Notably, Lexington-Fayette Urban County accounts for 62 percent of the LexingtonFayette MSA population growth from 2010-2020. This mirrors the share for Lexington in 1980, showing that growth in Lexington makes up the largest portion of the overall growth. However, it should be noted that the share of the
overall MSA population represented by Lexington declined from 65 percent in 1970 to 62 percent in 2020..
Review of population estimates from Esri show similar increases in population with a gain of 31,585 new residents or a 10.7-percent increase in residents for Lexington from 2010 to 2023. The Lexington-Fayette MSA experienced similar growth, gaining 11.7 percent or 23,579 new residents since 2010.
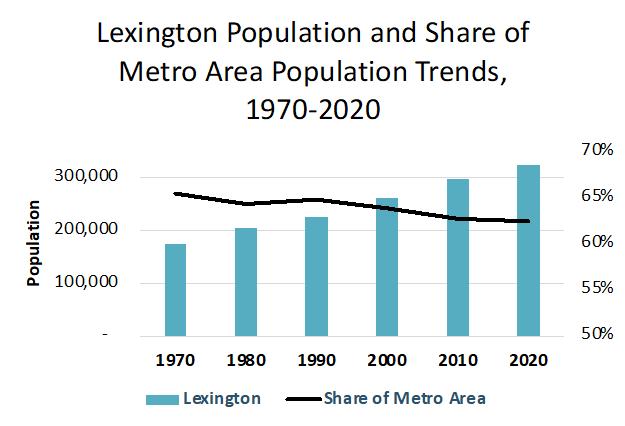
Lexington’s estimated population of 327,388 residents live in 136,857 households. Two-thirds of households have only one or two people. The Lexington-Fayette Metro Area represents a slightly older population base with a median age of 37.4 years compared to 36.1 in Lexington.
With the population growth, Lexington has become more diverse with a racial/ ethnic mix that reflects the region as a whole. Black residents increased with the addition of 6,830 new residents to become 16.5 percent of Lexington‘s population; Asian Americans make up 4.8 percent. Hispanic residents now represent 10.9 percent of the overall Lexington population, higher than their 9.1 percent share of the Lexington-Fayette Metro Area population.
Lexington's age distribution among householders skews younger as households headed by individuals age 15 to 24 make up 11 percent of total households. Residents aged 65 and over increased from 10.5 percent of the Lexington’s population in 2010 to 14.8 percent by 2023, a trend which will continue over the next 5 to 10 years. Lexington’s senior population increased by more than 17,400 people in the 13-year period, a fact with direct consequences for the housing market and demand for public services.
Average household size for Lexington and the Metro Area shifted from 2010 to 2023. Renter households grew to an average household size of 2.31 people in Lexington and 2.10 people in the Lexington-Fayette Metro Area by 2022. Owner household size grew in the Lexington-Fayette Metro Area from 2.39 in 2010 to 2.46 in 2022, while it fell slightly in the Lexington from 2.53 to 2.50 persons per household.
to 84 years 65 to 74 years
to 64 years
45 to 54 years
35 to 44 years
25 to 34 years
15 to 24 years
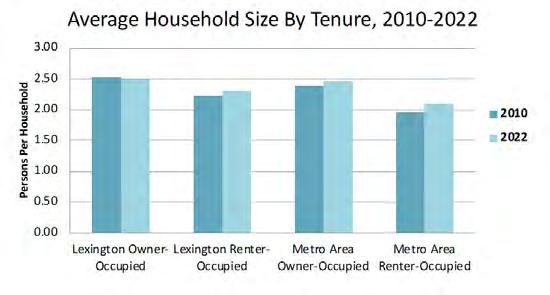
Lexington’s median household income of $62,467 in 2023 was slightly less than the Lexington-Fayette Metro Area’s median of $64,274. Roughly 29 percent of Lexington households earned more than $100,000, and one in five households had incomes below $25,000.
These median incomes reflect both the student population with artificially
lower incomes and the fact that nearly 46 percent of Lexington residents had a Bachelor’s or graduate/professional degree compared with 39 percent of MSA residents. Roughly 27 percent of Lexington residents aged over 25 had a high school degree, a GED, or less schooling in 2021, as compared to nearly one-third in the Lexington-Fayette Metro Area as shown in Table 5.
Breakdowns of key data show great
variability across the Lexington-Fayette MSA’s counties, reflecting in part the impacts of zoning, agricultural, and land use policies through the decades. These outlying counties show significant differences in incomes, racial mix, and homeownership.
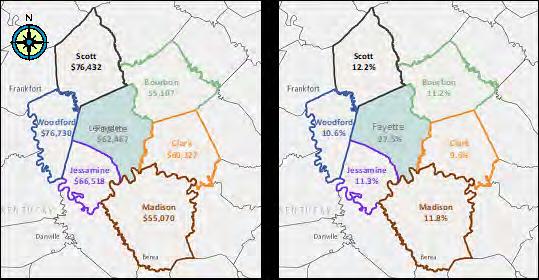

Lexington’s market depends heavily on the number of University of Kentucky and other students on campus. University of Kentucky student enrollment increased by eight percent from Fall 2018 to Spring 2023. This review of enrollment indicated that graduate enrollment increased by 1,766 students or 25 percent since 2018 and undergraduates remained nearly stable with a smaller
increase of 599 students during the same period. According to the National Student Clearinghouse Research Center, undergraduate enrollment increased in Fall 2023 by 1.2 percent – the first increase since the pandemic. Nationwide, college enrollment struggled prior to the pandemic with a decline of 11 percent from 2012 to 2019.
Undergraduates Graduate
The homeownership rate for Lexington households was 54 percent according to American Community Survey (2022) five-year estimates, trending down from 57 percent in 2010. At the same time, the homeownership rate increased from 58 to 61 percent in the MSA. Detailed
breakdowns of income and tenure are shown in Appendix Market Analysis Data Table A-4.
Homeownership rates increased with incomes, ranging from one in five households with incomes below $25,000 to 88 percent for households with incomes of $150,000 or more. For each income group, the LexingtonFayette MSA had higher overall rates of
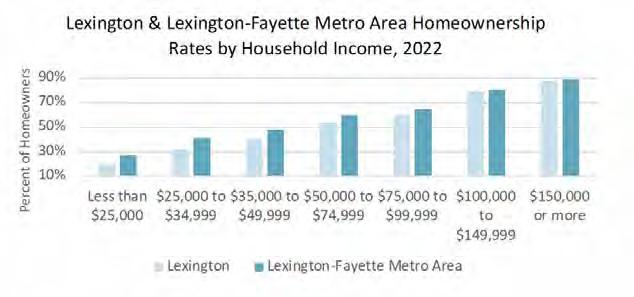
homeownership than Lexington proper indicating more affordable housing options in outlying areas.
With a concentration of students, Lexington’s renter householders are younger, with 24 percent under the age of 25 compared to less than one percent of the Lexington’s owner households. Just over half of renter householders are under the age of 35. The rate of homeownership generally increases with age, peaking at 21.6 percent in the 45- to 54-year group before declining to 19 percent for the 75to 84-year group.
Focusing on Lexington residents, the greatest share held jobs in health care and social assistance (with 17.7 percent of all jobs), accommodations/food services (15 percent), and retail trade (14.4 percent). These trends for employed residents match the region with slightly more jobs in manufacturing regionally at 13.2 percent compared to 10.6 percent in Lexington (See Table 6).
A significant share of Lexington’s resident workforce commutes short distances to work as compared to larger communities. Information from the American Community Survey, 2017-2021 shows that 52.7 percent of Lexington’s employed residents had a commute of less than 20 minutes. Only 7 percent of residents spent 45 minutes or more traveling to work. The median travel time for Lexington employed residents (20.8 minutes) is very close to the 21.8 minutes for Lexington-Fayette Metro Area residents.
Lexington and Lexington-Fayette Metro Area residents have relatively few transit options for commuting. Reliance on private vehicles trends continues – 75.8 percent of employed residents drove alone to work while 8.3 percent carpooled and 9.6 percent worked from home in 2022. Reliance on private vehicle ownership across the region results in many households owning more than one vehicle – 72 percent in Lexington and 75.9 percent in the Lexington-Fayette Metro Area. Only three percent of households in the Lexington had no access to a private vehicle.
The potential for new residential development construction in Lexington depends on the characteristics of area households as well as the competition offered by existing housing and new housing development in nearby counties.
Projections of Lexington population and households from 2023 to 2045 are based on economic modeling developed by the Kentucky State Data Center at the
University of Louisville. Based on historic trends, the model projects a total MSA population of 375,774 residents in 2045 – a 14.8 percent increase over the 2023 level. Lexington is expected to grow more quickly with an 18.2 percent increase by 2045, adding roughly 24,000 residents and 12,800 households by 2035 and another 24,400 residents and 12,100 households from 2035 to 2045.
Supply conditions in the housing market help understand existing conditions and the potential for future residential development in Lexington.
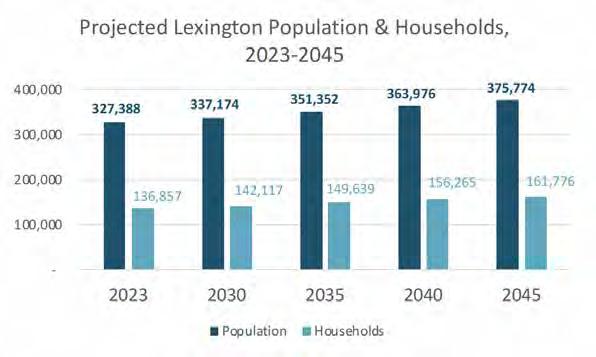
Lexington’s housing supply is dominated by single-family detached houses. Detached units represent 59 percent of the total stock with townhouses accounting for another 6.7 percent. Multi-family housing in buildings of five or more units account for one-quarter of units, as shown on the following pie chart. Only one percent of the housing stock consists of mobile homes or manufactured housing options.
LEXINGTON HOUSING UNITS BY STRUCTURE, 2021
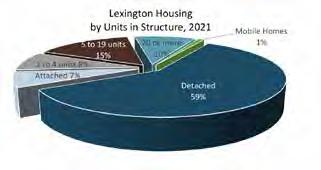
More than two-thirds of Lexington’s housing stock has been built since 1970 with the largest addition to the housing supply occurring in the 1990s with the addition of 23,900 new units. (See Appendix Market Analysis Data Table A-9.). Lexington’s median year built is 1982 as compared to 1984 for the LexingtonFayette Metro Area.
Esri estimates that 7.5 percent of Lexington housing units were vacant in 2021 – roughly 10,863 units not occupied by year-round residents (defined as more than half of each year). (See Table 7). Among the vacant units, ACS data from 2017 to 2021 suggests that 35
percent of the units termed “vacant” by the Census were held for rent with another 42 percent vacant for other reasons such as renovation, settling an estate or conditions rendering the units
unavailable and 13 percent for seasonal or occasional use. With the advent of Airbnb and other short-term rental services, the share of vacant units held for occasional use is likely higher now than in 2021.
CoStar tracks multi-family housing development and leasing, reporting a total of 40,286 apartments. Of that total, roughly 11 percent (4,528 units) are affordable units. Shown in Appendix Market Analysis Data Table A-10, the inventory has grown from 34,442 units in 2010. Occupancy is estimated at 92 percent, slightly below the 95-percent level consistent with a healthy market balance of supply and demand. Reported rents average $1,091 per month; however, the sample includes several buildings developed with public financial assistance.
Seventy-nine percent of Lexington’s multi-family rental housing units have one or two bedrooms. Larger threebedroom units suitable for families account for only 8 percent of these apartments, and four-bedroom units are only 1 percent of the housing stock. Families seeking larger units are more often accommodated in rental houses.
Net deliveries of new units averaged 585 annually over the last decade. New apartment deliveries peaked in 2023 with the opening of 1,292 new units. During the Covid-19 pandemic, occupancy rose in rental units with a drop in the vacancy

rate to 4.6 percent after net absorption of 1,363 units in 2020 during the height of the Covid-19 pandemic. Roughly 763 units are currently under construction. The Class A rental stock in Lexington consisted of more than 5,323 units with a vacancy rate of 7.7 percent and average rents of $1,431 per month. This compares with 34,875 Class B rental units with a vacancy rate of 6.5 percent and average rent of $1,139 representing 61 percent of all the units. Class C rental units account for roughly one-third of Lexington’s multifamily units with an average effective rent of $875 for 17,254 units and a vacancy rate of 7.5 percent.
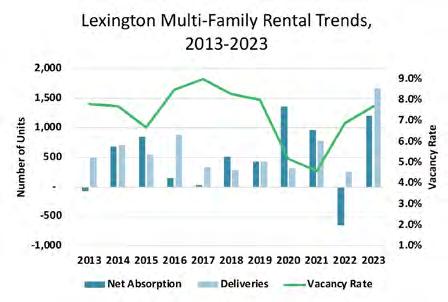
The following select apartments recently completed within the Lexington-Fayette Metro Area rental market area serve to highlight key characteristics of the competitive rental environment.
In Southeast Lexington, Ball Homes developed several residential products at Squires Circle including 308 apartments in 2021. The lakefront property represents a density of 52 dwelling units per acre with a low vacancy rate of 3.4 percent. The three-story multi-family building offers a unit mix with a majority of 176 two-bedroom units (with roughly 1,193 square feet), 112 one-bedroom units and 20 three-bedroom units. Rents for one bedroom begin at $1,237 per month for 875 square feet, two- bedrooms for $1,597, and three-bedroom units for $2,086 for 1,661 square feet. The property offers many modern amenities including clubhouse, business center, fitness facility, pool, pet washing station, door-todoor trash pickup, social activities and a car wash area.
In 2023, the owners of the Velo Studios development along Waller Avenue completely rehabbed the property offering a one-story 100-unit apartment building. The property, which opened in the fall of 2023, offers on-site laundry facilities, key-less unit entry, kitchenette with mini-fridge or refrigerator, microwave, sink, assigned parking, bike storage and repair area, game room and fitness area, as well as furnished apartments. These small efficiency units range from 238 to 336 square feet with rents starting at $745 to $1,400 for fullyfurnished options. This project located within close proximity to University of Kentucky, St. Joseph and UK Hospital and Baptist Health represents a bicyclefriendly option for students and hospital staff in West Lexington.
Developed by Beargrass Development as an affordable apartment community with an acre of commercial development, the Oakdale Apartments on Mulundy Way offers 144 new apartments built in 2023. The project has a density of roughly 15 dwelling units per acre. The 9.4-acre site in the northeastern section of Lexington offers units with one, two, and three bedrooms. The 18 one-bedroom units rent for $871 per month for the smaller 680 square-foot apartments. The 72 two-bedroom units include 895 square feet (smaller than most two-bedroom units in other sections of Lexington) and rent for $1,047 per month. Finally, the 54 three-bedroom units rent for $1,211 for 1,103 square feet. The featured amenities include a community center, business center, fitness facility, laundry, and playground. Income restrictions for the property range from $37,560 for a single person to $53,580 for a four-person household.
A review of rental housing trends for developments built since 2019 shows a total of 22 apartment buildings with 3,083 units and another 763 units under construction. This recently built rental housing stock consists of 44 percent onebedroom units, 34 percent two-bedroom units, 15 percent three- or more bedroom units and 7 percent studios. One-third of these newly built projects include at least some affordable units with rent subsidies or committed affordable rents. Rents reached $1,567 for two-bedroom units during the fourth quarter of 2023, reflecting the premium achieved by newly built apartments in Lexington. The following map shows the geographic dispersion of newly built units with dot sizes based on number of units.
The dominance of higher education institutions in the Lexington economy inevitably influences the local housing market. While no students are required to live on campus, university officials estimate that 85 to 90 percent of firstyear students seek campus housing. Over the course of the last decade, the University of Kentucky constructed 14 new dormitories with 6,800 beds but remains unable to meet demand for oncampus housing generated by record
enrollment levels. In total, CoStar reported 54 student housing buildings with more than 15,260 beds with an estimated 8,100 beds located on the University of
Kentucky’s campus. The University is in the process of negotiating for Phase IV student housing project with Greystar, private student housing developer.
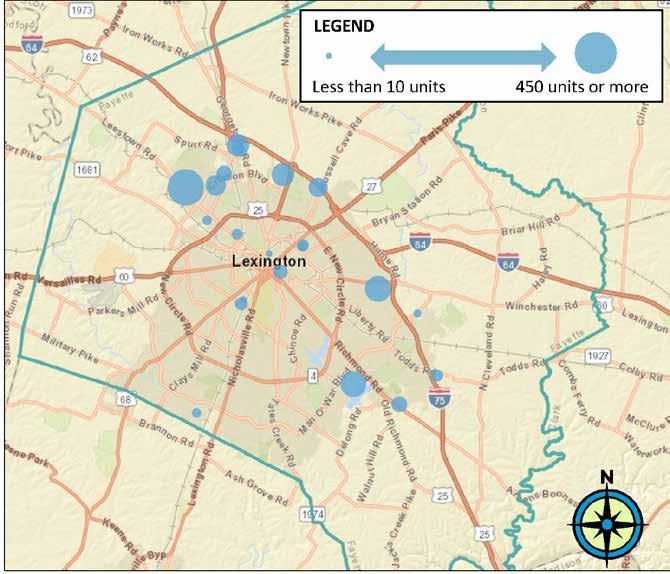
Other students seek housing in private apartments and houses, typically within walking distance of the campus or on the University’s bus line. Nearby neighborhoods have experienced conversions of single-family homes into student housing. Responding to this market, the multi-family development industry has developed prototypes for student housing that cluster four roommates in a four-bedroom, fourbathroom apartment. Each student is allowed to rent his or her own bedroom and bathroom independently without liability for roommates’ rents.
Prospective homebuyers will consider a large range of choices when selecting the appropriate housing unit for their needs. Lexington’s new for-sale residential market consists of the traditional subdivision offerings outside Downtown Lexington. As prices for land and housing have risen steadily over the recent decades throughout most of the country, many prospective house purchasers have gravitated to exurban or metropolitan fringe areas in search of affordably priced housing.
For 2023 sales, data for the first two to three quarters show significant increases in median prices. During the first sales quarter of 2023, the median sale price of a home was $285,000 for roughly 240 homes. As expected, sales of single-family home reached a higher median sales price in the second quarter of $327,000, an increase of $200,000 from January 2019 to July 2023. Townhouses sold for a median sales price of $217,500 with 22 sales reported in six months. Median sales prices for townhomes by month increased from $130,000 in January 2019 to a peak of $401,500 in November 2023. Condominiums sold for a median sales price of $220,000, slightly higher than townhomes, with 18 units sold. Lexington’s condos sold from roughly $190,000 in January 2019 and reached as high as $290,000 in July 2023.
The select new housing described below represents recently completed products in the competitive for-sale environment.
This 36-unit condominium project located in a rehabbed commercial building at 106 W. Vine Street in Downtown Lexington anticipates completion in 2024. The condominium project offers one- and two-bedroom units with an array of luxury amenities (including a private club with reservation access to the on-site pool and restaurant) and allows owners to rent out units. The one-bedroom units have 727 square feet of space, and the largest two-bedroom units consist of 1,417 square feet. Prices range from $495,00 to $795,000 at an average price of $505 per square foot.
Located in southeast Lexington at Squires Circle, Peninsula Townhomes offers 31 three-bedroom units for $329,950 to $334,950. These newly built homes sit on 2,014 square-foot lots with 1,628 squarefoot houses. Ball Homes, the residential developer / builder on the Peninsula project (which included single-family detached as well as apartments), sought out this location off Man o’ War Boulevard in a lakeside setting to accompany other residential products.
In the Palomar community off U.S. 68 at Madrone Way, these newly constructed single-family detached homes offer suburban style living with close proximity to commercial options. These nearly 6,000 square-foot lots offer three- and four-bedroom houses with two-car garages, partially finished basements and more than 4,000 square feet. Home listing prices vary based on special features and amenities but range between $750,000 and $900,000.
Located along Sandersville Road and Citation Boulevard, Ball Homes completed the Sanders Garden and Spring Garden subdivisions with offerings in 2020 during the Covid-19 pandemic. The homes include single-story and twostory structures with three- and fourbedroom single-family homes between 1,700 to 3,500 square feet each with two-car garage on 7,000 square foot lots. Recent sales of 2022 single-family homes in the Sanders Garden had prices ranging from $420,000 to $550,000 per house.
HUD’s key measures of housing affordability relate to the share of household income spent on housing costs and indicators of housing adequacy, such as overcrowding and the availability of complete kitchen or plumbing fixtures.
Housing analysts often frame housing problems in terms of household groups based on their share of the average median family income (AMI). For Fiscal Year 2023, the Lexington-Fayette Metro Area median family income is estimated by the U.S. Department of Housing and
Urban Development (HUD) at $93,400 for a family of four. Adjustments are made for household size to reflect the costs associated with additional family members. Shown in the following table, Extremely Low Income is defined as not more than 30 of AMI – $24,860 for a family of three or $18,800 for a single person (Table 9). Very Low Income includes households with incomes up to 50 percent of income – $40,200 for a family of three or $31,300 for a single person. Low-Income households have incomes up to 80 percent of income – $64,350 for a family of three and $50,050 for a single person.
HUD and the U.S. Census Bureau report on four key housing problems:
• units that lack complete kitchen facilities;
• units that lack complete plumbing facilities;
• overcrowding with more than one person per room; and
• cost burdens.
Comprehensive Housing Affordability Strategy (CHAS) data, a special tabulation using American Community Survey data from 2016 through 2020 from
HUD, estimated the extent of housing problems among Lexington residents by income level.
Among Extremely-Low-Income households (0 to 30 percent of AMI), 83 percent of renters and 74 percent of owners reported at least one of the four primary housing problems. For Very-LowIncome households (30 to 50 percent of AMI), the incidence of problems was 74 percent of renters and 56 percent of owners. Low-Income households (50 to 80 percent of AMI) reported housing problems for 39 percent of renters and 32 percent of owners.
While development in more rural areas often presents more housing units without sufficient plumbing and kitchen facilities, nearly 180 owned units and 860 rented units in Lexington lacked complete plumbing or kitchen facilities. As would be expected, lower income household earning 30 percent or less of AMI tend to have the largest number of substandard housing units. (See Appendix Market Analysis Data Table A-13.)
Fayette County Households with One or More Housing Problems by Tenure and Income, 2016-2020
As of 2020, Lexington had 134 ownership units and 1,225 rental units overcrowded with 1.0 to 1.5 persons per room occupied by low-income households with incomes up to 80 percent of AMI. Severe overcrowding – defined as more than 1.5 persons per room – affected 39 units owned by low-income households and 560 low-income renter households.
The key housing issue facing Lexington and much of America is the cost of housing. HUD has set an affordability standard of total housing costs at no more than 30 percent of household income so as to assure that there is money available to cover other necessities such as transportation and health care.
In the 2016-2020 time period, 8,550 lower-income owner households (0 to 80 percent of AMI) in Lexington were spending more than 30 percent of their income on housing (“cost-burdened”) – 45 percent of all owner households in those income groups. The 30-percent of income affordability standard has less relevance for owner households given that lenders will make loans to households spending more than 30 percent. Of more concern are the 3,725 households that were spending more
than half of their income (“severely cost-burdened”). (See Appendix Market Analysis Data Table A-13.)
The burdens were much worse among low-income renters (up to 80 percent of AMI) – 23,115 households (59 percent) were cost-burdened. More than half (53 percent) of those households were spending more than half of their income for housing – 12,240 households of all lowincome renters. Burdens are much more prevalent among the lowest-income renters. Sixty-five percent of extremely-
low-income households were severely cost-burdened, as were 20 percent of very-low-income households.
The incidence of cost burdens is higher among Black or African American households but not substantially higher than for White households. Half of Black renter households and 43 percent of Lexington’s Hispanic households had cost burdens as compared with 40 percent of Lexington’s White households. Among owner households, severe cost burdens
2016 - 2020
afflicted 6 percent of White households and eight percent of Asian households. More than one in five Asian households were cost burdened. The extent of cost burdens among Other Non-Hispanic households was higher than for White households in both owner and renter households.
A disproportionate number of “elderly households” with one or more persons age 62+ suffer from cost burdens. For households with incomes up to 80
percent of AMI that included at least one member age 62+, 41 percent of homeowners had at least one housing problem along with 65 percent of renters. (See Appendix Market Analysis Data Table A-15 and A-16.)
In the 2016-2020 period, Lexington owner households headed by an individual age 65+ with low incomes (below 80 percent of AMI), 3,540 or 40 percent had cost burdens, including 1,670 (31 percent) with severe cost burdens. Of those, 19 percent had severe cost burdens (Appendix
Market Analysis Data Table A-17).
Among Lexington’s 6,230 elderly renter households with incomes up to 80 percent of AMI, 63 percent spent more than 30 percent of their income for housing, including 31 percent who spent more than half of their income (Appendix Market Analysis Data Table A-18). Most of those with severe cost burdens had extremely low incomes up to 30 percent of AMI.
Households that have one or more members with a disability often face housing problems. (See Appendix Market Analysis Data Table A-19.) For those with an ambulatory limitation, 39 percent had one or more housing problems as did 41 percent of households where a household member had a limitation on self-care or on their ability to live independently. Forty-two percent of households with a member that had a cognitive limitation experienced one or more housing problems.
Reflecting the high share of rental units in single-family houses (35 percent), the supply of rental housing includes a high share of larger units – 38 percent with two bedrooms and 33 percent with three or more bedrooms (Appendix Market Analysis Data Table A-20).
The affordable rental housing stock is divided with:
• 11 percent affordable to households below 30 percent of AMI,
• 35 percent affordable at 30 to 50 percent of AMI,
• 47 percent affordable at 50 to 80 percent of AMI, and
• 7 percent affordable at 80 to 100 percent of AMI.
Contributing to the shortage of rental units affordable to households at lower incomes up to 80 percent of AMI is the fact that many of the lower-rent units are occupied by households that could afford higher rents. Among the 27,150
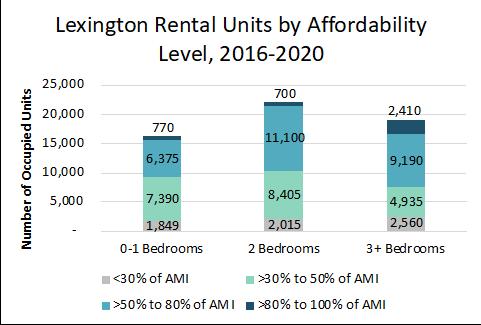
units with rents affordable for households with incomes up to 50 percent of AMI, 56 percent are occupied by households with incomes up to 50 percent of AMI, but 21 percent are occupied by households with incomes of 50 to 80 percent of AMI, and 22 percent are occupied by households at or above 80 percent of AMI. (See Appendix Market Analysis Data Table A-21.). Households are under no compulsion to spend 30 percent of their income for rent, and many choose to rent less expensive units and save or use their
money in other ways. This constrains the availability of affordable units for those who really need them. As those lowerincome households are forced to rent more expensive units, their cost burdens escalate.
The mismatch is even more true for ownership units due to the long time that some homeowners have lived in their homes. Just less than one-quarter of the households living in the 18,090 owner-occupied units with values
affordable to households with incomes up to 50 percent of AMI had incomes that low (Appendix Market Analysis Data Table A-22). Thirty-eight percent of households in these units had incomes up to 80 percent of AMI, and 38 percent are occupied by households with higher incomes.
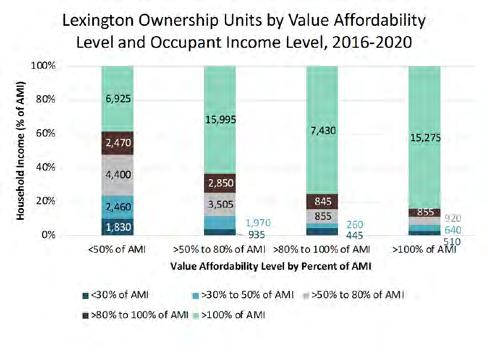
Office market dynamics respond to the general economic conditions in a region. The breakdown of those conditions to counties, cities and smaller submarkets within these jurisdictions reflects their locational advantages for commercial development. The realities of future employment projections and the market’s ability to support the existing office demand require careful examination of the existing office supply at varying submarket levels within Lexington-Fayette Metro Area.
Developed over decades, much of Lexington-Fayette’s office development follows large employers with ties to the medical and education communities for general office space. In Lexington, multiple businesses and service providers developed primarily on independent parcels along major thoroughfares that can be broken among three geographic submarkets – Downtown Lexington, East Lexington/Fayette, West Lexington/ Fayette. Office development includes former residential/industrial buildings, small-scale buildings and mid-rise commercial buildings, with a few high-rise buildings in the downtown. Otherwise, other counties within the Lexington-Fayette Metro Area – Bourbon, Clark, Jessamine, Scott and Woodford counties – represent pockets of office clusters. The majority of the office
space outside of Lexington is located in Jessamine, Scott and Woodford counties.
Nationally, office markets are undergoing substantial changes as the Covid-19 pandemic practices of working from home have continued through the recovery. Companies are struggling to find the appropriate balance between time in the office and time working at home while not losing key workers. Many companies have now shifted to a requirement of two to three days in the office, which can affect the total amount of space they require. These cutbacks will continue to impact demand for office space over the next few years with variations depending on the type of businesses.
Lexington’s office space inventory includes buildings in Downtown and traditional business parks as well as clusters of general office space and neighborhood-serving offices for local doctors, accountants, insurance agents and attorneys. These local communityserving types of office tenants depend on good access to the area’s residential customers and are considered neighborhood-office users. Lexington has also attracted corporate and regional headquarters operations.
Lexington’s office development conditions and trends provide the best indicator of potential private market demand. Lexington has a total of 19.4 million square feet of office space of which 5.3 million square feet or 27 percent is located in Downtown Lexington. The current Lexington occupancy rate of 92 percent. Up from only 89.9 percent in 2012, this represents a market in relatively good balance between supply and demand. From 2019 to 2023, Lexington averaged three new office buildings each year. Mostly this new space is in smaller office buildings under 30,000 square feet with the notable exception of The Offices at City Center (built in 2019), which totaled 154,984 square feet in a mixeduse 13-story building. During the same period, net absorption averaged 84,200 square feet annually as large amounts of vacant office space were filled. As the gap between total and occupied space has declined, the market is approaching a supply/demand equilibrium, which could allow future office development. Appendix Market Analysis Data Table A-23 shows Lexington office trends.
Despite the economic recovery of recent years, annual absorption (i.e., the increase in the amount of occupied space) has slowed due to a number of factors, including:
• dramatic increases in office efficiency with reductions in space utilization from 200 to 250 square feet per employee in previous decades to levels of 175 to 200 square feet per employee in new buildings;
• technological advances that allow employees to work remotely; and
• digital storage and information retrieval that reduces the need for major file storage space.
Even pre-Covid-19 pandemic, national trends showed major tenants consolidating their space needs and reducing their space usage by 20 to 30 percent in modern open-format office space.
The Lexington-Fayette Metro Area regional office inventory reached 21.9 million square feet at the end of 2023. (See Table 10). Lexington’s office space represents 89 percent of this regional total. The Lexington-Fayette Metro Area and Lexington’s office markets have remained relatively stable in terms of occupancy rates over the past five years averaging at 92 percent, respectively, despite adding 329,000 square feet of office space from 2019 to 2023.
Lexington-Fayette Metro Area Office Trends, 2013-2023
Over the past five years, net office space absorption in the Lexington-Fayette Metro Area averaged 74,400 square feet annually. This compares to an annual net absorption of 84,200 square feet in Lexington.
Classing of commercial space helps to properly evaluate existing supply by differentiating buildings by physical condition and operating performance. Class A represents the newest buildings with the best amenities that command the highest rents, and Class C represents older properties in fair to average condition receiving lower than average rents. The majority of the office space in the Lexington-Fayette Metro Area (53 percent) is classified as Class B, 25 percent consists of Class A space, and the remaining 23 percent includes Class C space. Nearly all of the 5.4 million square feet of the region’s Class A office space is located in Lexington, which has 5.1 million square feet of Class A space.
The East Lexington/Fayette submarket represents the largest inventory of office space with an estimated 7.6 million square feet in 413 buildings with West Lexington/ Fayette submarket’s 425 buildings totaling roughly 6.4 million
square feet. Downtown Lexington’s office asking rent ranks second highest in the region at $19.05 per square foot for the submarket’s 282 office buildings which offer 5.3 million square feet. Only Scott County reports a higher asking market rent at $21.07 per square foot. Downtown Lexington’s office vacancy rate of 8.1 percent is higher than West Lexington/ Fayette at 3.8 percent but lower than East Lexington/Fayette’s 11.1-percent vacancy rate. An industry rule of thumb for a healthy areawide office vacancy rate (in which supply and demand may be in balance) ranges from 8 to 10 percent.
Over the past decade, newly built office space in the Lexington-Fayette Metro Area centered on West Lexington, which added an estimated 577,400 square feet – 42 percent of new space built from 2014
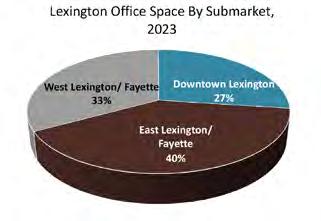
through 2023. (See Appendix Market Analysis Data Table A-25.) During the same period of time, East Lexington/ Fayette submarket added 380,000 square feet of new office space or 28 percent of new office development in the region.
Outside Lexington’s office market, the region’s competitive landscape includes those office tenants that do not need close proximity to Lexington’s Eds / Meds industry anchors and choose locations based on accessibility, educated labor force availability, price and other factors.
In the Lexington-Fayette Metro Area outside of Lexington, Jessamine County represents 3.8 percent of all regional office space with 839,670 square feet of space as compared to 574,386 square feet in Scott County and 479,315 in Woodford County. Much of this existing space represents office users interested in space close to local customers such as dentists or branch banks.
Within the competitive counties, Scott County pre-leased 45,000 square feet of space at the end of 2023. This reflects the growth in Georgetown fueled by the 2023 announcement of the battery electric vehicle addition to Toyota’s manufacturing facilities in the county.
Scott County competes most directly with Lexington for office tenants.
In Jessamine, Alltech built a new headquarters operation center in Nicholasville in 2018 – the county’s only significant addition of office space over the last 10 years. The following map shows newly built office space since 2014 throughout the metro region.
CoStar data shows only one office project currently under construction in the Lexington-Fayette Metro Area, a medical office building in Georgetown.
This is a transitional period for the office market as it strives to adjust to the “new normal” following the Covid-19 pandemic. Worker preferences for working from home at least part-time coupled with the development of tools that make that possible have led many employers,
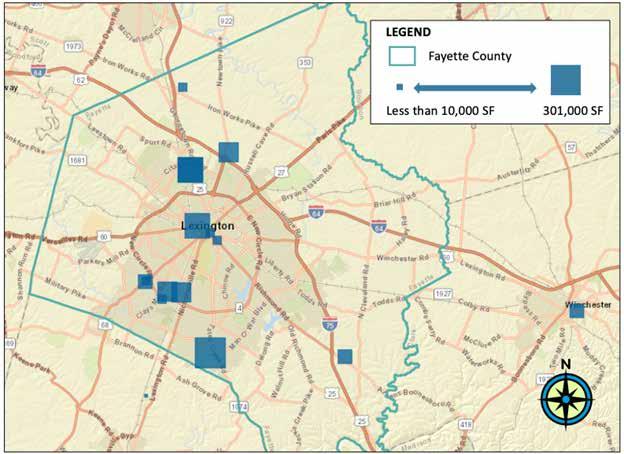
but not all, to agree to hybrid schedules with fewer workers coming to the office each day. While this results in a reduced demand for office space, the LexingtonFayette Metro Area office demand, insulated by the needs of the Eds and Meds community, continues to support current office space usage.
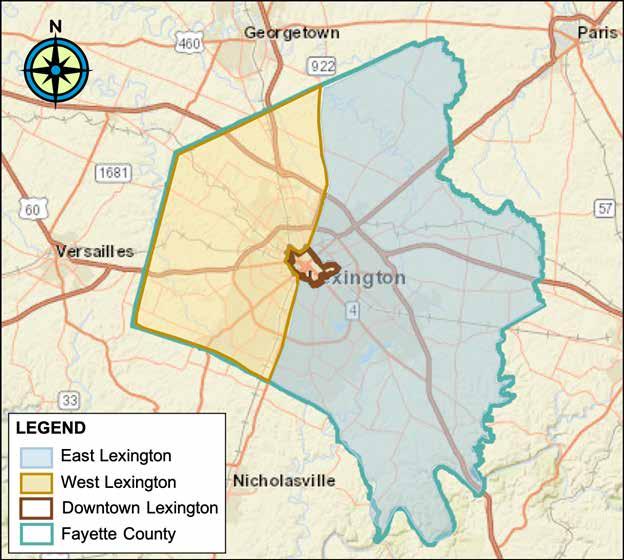
Office tenants typically make their location decisions based on a mix of criteria, including accessibility, proximity to institutions and other clients, proximity to similar businesses, building quality, visibility and availability of support services and retail. Increasingly, in today’s tight labor market, businesses are using their office locations as a recruiting tool. That has meant placing a high premium on walkable, mixed-use districts that provide a mix of restaurants, cafes, service businesses and housing to support
live, work, play opportunities in close proximity. This is particularly true as companies need to offer their workers a reason to come to the office.
Among the five expansion areas, only the sports complex site in Expansion Area 5 could possibly offer the type of business setting and clustering that could compete for major businesses not focused on serving the local population. Demand in that area will depend on recruitment. The opening of the new medical campus south of Todds Road will
likely generate demand for new medical office buildings and space for related businesses; however, that demand is unlikely to benefit Expansion Area 2 significantly as most of the new space will be developed adjacent to the medical center. Expansion Area 3 could potentially support a small increment of office space for neighborhood-serving businesses attracted by the new residential base, perhaps as much as 10,000 to 20,000 square feet if developed in a retail cluster with visibility and access from Athens Boonesboro Road.
Economic conditions, specifically job gains or losses, in industry sectors that use both industrial and flex space (construction, manufacturing, transportation/utilities/wholesale trade) greatly impact real estate conditions for both industrial and flex markets. Modern industrial space, no longer defined as single tenant buildings or smoke stacks, offers easily convertible space with ceilings in excess of 30 feet, truck docks and open floors with few columns. Flex space is a single-story structure with a combination of office, warehouse and/ or showroom space also designed for flexibility to meet the tenants’ needs. It is typically equipped with truck docks to facilitate loading but can incorporate more standard office components as well as warehouse or showroom space. In general, flex space, while less expensive than traditional office, has higher rents than industrial space.
Industrial and flex space users choose business sites based on accessibility (both truck and rail access), adequate utilities, neighborhood acceptance of industrial operating conditions (impact of noise, odor and frequently outdoor storage) and the ability to get workers and customers to their business. These types of businesses consider the trucking efficiencies and costs as well as potential
building costs associated with a particular location – the land, building, taxes and other costs.
In the Lexington-Fayette Metro Area, industrial development tends to cluster around infrastructure-supported corridors with excellent access to rail and/or major truck routes based on user needs. As expected, the LexingtonFayette Metro Area’s demand is driven by excellent highway access, a growing base of amenities, affordable space and the ease of movement within both Lexington and the neighboring counties. Lexington’s market for industrial space relies on the distribution of goods within Lexington and, to a lesser degree, light to heavy manufacturing.
The Covid-19 pandemic dramatically shifted industrial space use with demand from e-commerce creating pressure for greater productivity and efficiency. Within two years of the initial onset of the Covid-19 pandemic, activity exceeded pre-pandemic levels. These demand pressures coupled with equipment and workforce shortages strained industrial real estate markets. Amazon and other major distribution center operators scrambled to acquire and develop warehouse/ distribution spaces.
Roughly 60.5 million square feet of industrial/flex space exists in the Lexington-Fayette Metro Area with Lexington representing 54 percent of the supply. Lexington-Fayette Metro Area’s industrial/flex inventory grew by 2.7 million square feet or 4.7 percent from 2014 to 2023 (See Appendix Market Analysis Data Table A-26). Roughly 49 percent of this industrial/flex space growth occurred in Lexington. LexingtonFayette Metro Area’s industrial market remains tight with a vacancy rate of 3.6 percent in January 2024 – a 95-percent occupancy rate is an indication of a healthy supply and demand balance. Industrial rent growth increased from an average of $5.21 per square foot fullservice in 2014 to $7.70 per square foot full-service in January 2024. Roughly four buildings in the total supply received the research and development categorization, representing an estimated 162,000 square feet of space. A review of the tenant history in these buildings shows that a few attract specific manufacturing, professional, scientific and technical service firms. Only the University of Kentucky’s veterinarian lab uses a full building as lab space; other buildings include multiple tenants.
Lexington’s industrial/flex base grew from 31.8 million square feet of space in
2014 to 32.8 million by 2023 (Appendix Market Analysis Data Table A-27). In 2021, occupancy rates climbed to 98.1 percent as limited new industrial or flex space was added to the inventory during the Covid-19 pandemic in 2020. Previously the industrial/flex market in Lexington added new space at an average annual of 113,500 square feet.
The majority of the industrial/flex space within the Lexington-Fayette Metro Area is based in Lexington with more than 54 percent of the occupied industrial and flex space. More than three quarters of the vacant industrial/flex space is located in Lexington. Lexington-Fayette Metro Area’s low vacancy rate of 3.6 percent in January 2024 compared to Lexington’s vacancy rate of 5.2 percent shows the tight market conditions and need for more supply. New space currently under construction is outside Lexington.
Lexington’s combined industrial and flex vacancy rate is higher than that of competitive jurisdictions – 4.2 percent in 2023 as compared with rates of 3.1 percent in the region, 3.4 percent in Woodford County, 1.6 percent in Jessamine County and less than 1 percent in Scott County.
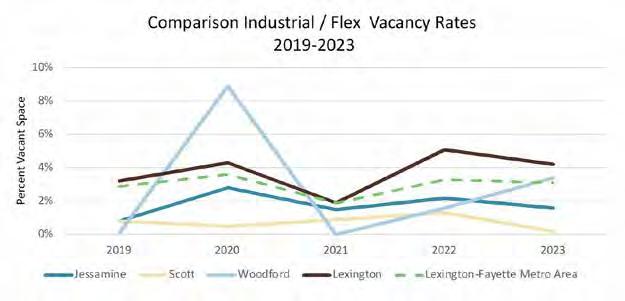
Within Lexington, the same three submarket boundaries (shown in Map 7 Office Submarkets) represent the industrial and flex submarket breakdowns. The majority (58 percent) of the industrial and flex space in Lexington sits in the West Lexington submarket with 19.2 million square feet. The East Lexington submarket consists of 12.4 million square feet of space – 38 percent of the total Lexington inventory. As expected, the West Lexington submarket added an average of 89,700 square feet annually from 2014 to 2023, which compares with 43,100 square feet added annually in the East Lexington submarket during the same period. The West Lexington submarket significantly outperformed other portions of the city, capturing 80 percent of the 2013-2023 development and one-half of the last five years’ new construction. (See Appendix Market Analysis Data Table A-28.) Much of its performance in the last five years can be attributed to the new Amazon fulfillment center.
Projected employment growth in industries that rely on industrial and flex space coupled with historic trends data suggest that the region will develop an average of 200,000 to 275,000 square feet
of space annually to 2045 for a total of 4.2 to 5.8 million square feet. Lexington should be able to capture 35 to 40 percent of the region’s future industrial and flex space construction for a total of 1.5 to 2.3 million square feet of new space.
Land costs will prevent most industrial and flex space development in the
Expansion Areas. The largest potential for future industrial development remains in Expansion Area 5 which has the only sites suitable and competitive for such uses. New industrial and flex space development in Expansion Area 5 could reach 65,000 to 130,000 square feet to 2045. Of course, actual development will depend on the availability of appropriate sites.
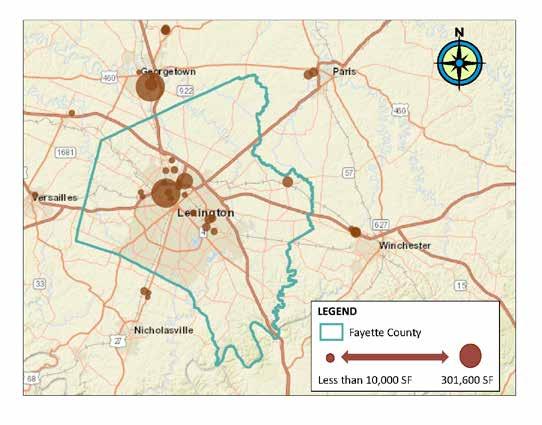
Retail, as an ever-evolving industry, is particularly susceptible to economic downturns, and the Covid-19 pandemic recently revealed vulnerabilities and shifts. The pandemic devastated many retailers as customers stayed home until adaptations such as curbside pickup and home deliveries helped offset some of the impact. As the pandemic eased and the supply chains began performing properly again, retailers’ sales grew as customers once again sought out opportunities to enjoy a meal outside the home and shop in person with other customers. Perhaps the biggest pandemic impact was on those that depended on daytime employees as a key customer base. In particular for food and beverage establishments relying on lunchtime customers, the work-from-home trend decreased sales for retailers catering to nearby office workers and bolstered sales for those that attract residents working at home.
It should be noted that the ease of shopping at open-air centers and e-commerce (estimated at 15.4 percent of total national retail sales in 2023) as well as the pricing advantages of Costco, Walmart and other major discounters have diverted many of the customers who once supported regional shopping malls. Many retailers have found
alternative locations with lower rents and common area charges.
Shoppers are placing a higher emphasis on retail as a communal activity with quality public spaces that encourage gathering and interaction. It is no longer enough to simply offer a cluster of stores.
The success of retail in any market area depends on the income levels and spending patterns of the area residents, workers and visitors. It is crucial to understand the dollars available and how area customers spend their disposable income. Such factors, coupled with the effects of competition, determine the need and support for specific types of retail and services based on consumer preferences.
Retail analysis breaks retailers into three main categories:
• Neighborhood goods and services, which includes grocery stores and drugstores;
• Shoppers goods, which includes the type of merchandise typically sold in a department store – general merchandise, apparel and accessories, furniture and furnishings, electronics,
sporting goods, books, and other miscellaneous types of retail (also known as GAFO); and
• Food and beverage, which includes the full range of fast food, carry-outs and sit-down restaurants and bars.
Customers choose retail opportunities based on convenience not only as it relates to their place of residence but also where they work. Typically, neighborhood shopping areas are anchored by grocery stores and emphasize convenience with very limited GAFO offerings. Customers are mobile and will travel to locations with multiple shopping alternatives and a cluster of stores to meet their shoppers goods needs. These are goods for which most consumers like to comparison shop, considering choices from several clothing stores, for example. This desire for convenient comparison shopping was the driving force in the creation of downtown business districts and then shopping malls. Few neighborhood business districts can support the number and variety of stores required to offer that comparison-shopping opportunity.
As new residential areas develop, new centers develop to serve the new population. Older centers may experience lower sales and higher vacancies as
shoppers seek newer retail offerings. Eventually, these older centers will be replaced by new uses, but it may take several years as owners continue to collect rents without making new investments.
Lexington’s commercial corridors offer a vast array of retailers in freestanding stores and clustered at major intersections, often anchored by large shopping centers with major tenants and acres of parking. Based on data provided by CoStar, Lexington’s total retail inventory includes 22.7 million square feet of retail space with a vacancy rate of 3.7 percent as of January of 2024, reflecting tight market conditions. Traditionally retail space carries higher vacancy rates, allowing for more frequent turnover in tenants with a healthy rate of five to seven percent. (See Appendix Market Analysis Data Table A-29.) Lexington’s retail supply represents 67.8 percent of the Lexington-Fayette Metro’s retail supply of 33.3 million square feet, which has a slightly lower vacancy rate of 3.1 percent (Appendix Market Analysis Data Table A-30).
Lexington continues to add new retail space with the average annual delivery of an estimated 107,000 square feet from
2014 to 2023. However, over the last five years deliveries resulted in an annual average of only 44,300 square feet of new retail space, indicating a slower pace of growth. The new retail buildings added over the last five years include mostly smaller buildings of less than 10,000 square feet.
Retail properties include many types of structures – freestanding stores, shopping centers, open air markets and clusters of retail stores in districts. Shopping centers include grocery storeanchored neighborhood centers, larger community centers, power centers, or
regional malls.
Throughout the nation, community and neighborhood centers dominate the retail landscape. Neighborhood centers offer daily convenience items and personal service businesses and include a grocery store or other anchor tenant, ranging from 30,000 square feet to a maximum of 100,000 square feet. Community centers range in size from 100,000 to 300,000 square feet of space and offer a wider range of apparel and other soft goods, often with more than grocery store anchors, including valueoriented big-box (Costco) or discount
department stores (T.J. Maxx).
Lexington’s stock in community and neighborhood centers totals 7.2 million square feet of space, most of which is fully leased, but with a vacancy rate of 5 percent. Power centers and super regional malls make up an estimated 2.8 million square feet of retail space nearly 24 percent of the total supply in Lexington shopping centers with a vacancy rate 6.3 percent.
Lexington’s non-mall retail supply suffers from many of the same concerns of other successful suburban commercial corridors initially built as auto-oriented shopping environments – an overabundance of surface parking, marginalized centers with limited reinvestment but a stable tenancy, dominance of retail chains allowing for limited distinctions from other shopping areas, and congestion and internal circulation delays often caused by too many curb cuts. Older buildings often are not ideally configured for modern retailing, inhibiting their ability to entice further mixed-use high-quality investment in the near- or mid-term.
Developed in a suburban pattern, Lexington’s initial retail development
followed auto-oriented commercial developed along major thoroughfares and highways, creating a diverse mix of retail environments. Those early developed retail corridors have retail clusters and older strip commercial centers at major intersections or interchanges from the highways. As you move further from downtown Lexington’s core, retail reflects a more suburban-style retail format.
Lexington has six independent commercial retail corridors and the downtown retail cluster along South Broadway. In some instances, commercial corridors function together: Bryan Station and Meadow Park; and Gardenside and Southland. These represent combined commercial corridors for purposes of profiling existing retail conditions. The following map highlights the existing corridors.
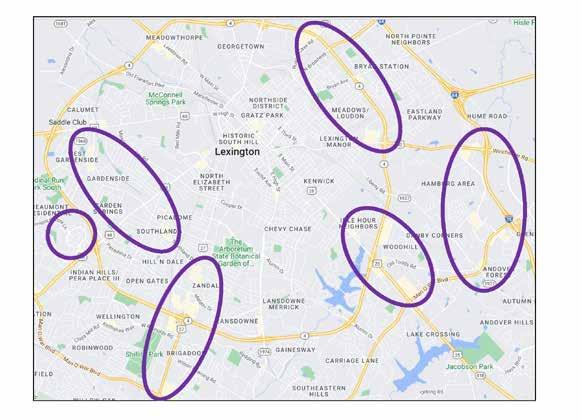
In the Lexington-Fayette Metro Area, additions to the 33.5 million square feet of retail space included the addition of roughly 1.9 million square feet constructed since 2014. This newly built retail space performs well with a 5.7-percent vacancy. This represents a shift from years of vacancy rates below 5 percent – reflecting newly constructed (built in 2021 to 2023) retail’s higher vacancy rate of 13 percent. Newly built retail space may be partially occupied as owners and landlords hold vacant space as they attempt to find the right tenant and fit out retail spaces based on retailer’s specifications, referred to as the lease-up time period. Rents for these new additions to the retail inventory average above the Metro Area rent, reaching $26 per gross square foot as of the beginning of 2024.
The majority of the retail added over the last decade (2014-2023) represents national retail owners; less than onequarter (24 percent) are local owners. This mix for the Lexington-Fayette Metro Area reflects national trends, suggesting a reliance on national retailers with local retailers clustering in higher income sections of Lexington. CoStar reports that retail, located in shopping centers
(typically excluding stand along gas stations and other freestanding retail users), consists of 74 percent national retailers.
A review of the smaller-scale retail operations within these commercial corridors revealed that a large portion of the retail space is occupied by neighborhood goods and service providers. These businesses include mainly personal services such as grocers, salons, real estate title, funeral parlors and rental car operations. These commercial corridors offer affordable space for independent restaurants and a few driveto businesses as destinations for specialty food.
The U.S. retail industry is in transition as it shifts from the decades of retail growth, which finally began to slow at the start of the Great Recession in 2007. As the national retail industry became over-extended and pressure from e-commerce grew, many retail operations began to both contract both new offerings and close existing stores. Whole categories of retailing (e.g., books, music and electronics) moved on-line almost exclusively. More and more retail space has shifted to experiential retail, such as restaurants, not easily replaced by on-
line sales. Discount stores retained their appeal to shoppers seeking bargains, and grocery stores became increasingly important as shopping center anchors.
E-commerce, while representing 15 percent of worldwide retail sales, represents a slight shift in an already existing trend of non-store retail shopping habits for the entire U.S. The Covid-19 pandemic disrupted basic retail operations and accelerated the shifts to e-commerce at least for 2020 and 2021, but recent data from the U.S. Census and the Federal Reserve show that boosts in e-commerce retail sales were only a temporary condition during the onset of the Covid-19 pandemic. As delivery networks develop and delivery options improve with autonomous vehicles, drones and other technologies, e-commerce will likely keep its market share. However, more bricks and mortar stores offer customers the ability to order online and pick up at convenient store locations as a result of the e-commerce competitive pressures.
Though the impact of online sales on traditional retail models is often cited as the reason that the U.S. retail industry is undergoing dramatic changes, the underlying forces affecting retail are more complex. Also important is the nation’s excessive supply of retail space. The U.S.
has 24.5 square feet of retail space per capita. This compares with 4.5 square feet per capita in Europe. The growth of retail space in the 1980s, 1990s and the last two decades reflected a push in new construction of retail space, even as retail vacancy rates climbed. Many retail chains were over-leveraged with high levels of debt and insufficient reserves to carry them through times of lower sales. As a result, more than 27,800 stores have closed in the U.S. over the last four years, impacting 425 million square feet of retail space, according to CoStar. While retail contraction helps retail sales and overall performance, these national retail chain closures did not shrink the excessive supply of retail space sufficiently to balance many retail markets.
The systemic changes impacting the retail market nationally and locally will play themselves out over the next two decades. The ability of Lexington’s regional shopping malls and commercial corridors to prevail in the competitive landscape will depend, in part, on their ability to reposition their use mix and attract other supportive non-retail uses to generate pedestrian activity. These asset management efforts often incorporate multiple new tenants to fill spaces formerly occupied by department stores,
including medical clinics, fitness centers, college and university programs, libraries, specialty food markets, co-working spaces, entertainment centers, hotels, uniquely local retailers, veterinarians, cooking schools, day care centers, senior living and even pickleball. Continued investment in modernizing facilities and upgrading their physical setting will be important in keeping customers shopping in Lexington.
Projected population, employment and visitor growth will provide an expanding base of customers for local retailers. The following table combines those projections with spending estimates and capture rates to estimate potential sales for Lexington retail businesses. The average Lexington household spends $24,000 per year on retail goods and services in the categories of Neighborhood Goods and Services, Food and Beverage and Shoppers Goods described above. That figure excludes spending in auto dealerships, gas stations, hardware stores and other retail businesses not typically found in shopping centers. Based on review by category type, Lexington is estimated to capture 80 percent of those sales or $19,200 annually. Over time, the share of household income devoted to retail goods and services has declined as housing and transportation costs
have risen more rapidly. This projection assumes that the share of income spent on retail goods and services will decline over the projection period.
Consumer spending suggests that Lexington households spend $2.3 billion on retail sales broken down among neighborhood goods & services (such as groceries); food & beverage (carry-out meals); and shoppers’ goods (furniture, clothing). The breakdown shows that convenience retail shopping categories as neighborhood goods and services dominate consumer spending with 56 percent or $1.3 billion annually, compared to 23 percent for food and beverage or $544 million, and another $494 million in shoppers goods.
SPENDING BY RETAIL CATEGORY, 2023
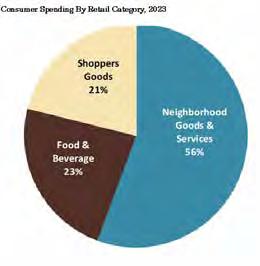
Over the next two decades, many existing retail spaces will be demolished or converted to new uses as new shopping corridors and clusters or nodes of activity create better opportunities to meet modern retailers’ needs. Many of today’s modern retailers rely on placemaking to create walkable environments that draw customers for the experience as well as the retail offerings. Mixed-use developments offer daytime, evening and weekend support from both nearby workers and residents.
Prior to the planning workshop recommendations for the Expansion Area development scale, it is too early
to estimate the scale of supportable commercial development. The retail and service potentials will depend on the number of households attracted to each Expansion Area as none of the areas are well located to serve as regional activity centers, attracting significant numbers of existing residents.
In the mid- to long-term, Expansion Areas 3 and 5 provide the most competitive opportunity for new retail development that serves primarily the new community. The new retail development in Expansion Area 3 will depend on the future scale of residential development as well as designating a visible and accessible site
that allows retailers to attract customers from the larger southeast Lexington area and not just the adjacent residential development. Expansion Area 5’s retail growth depends on the plans for the new Lexington Sporting Club soccer stadium and the visibility offered by sites at the I-75 interchange. It is likely that growth west of I-75 will support between 40,000 to 50,000 square feet and east of I-75 in Expansion Area 5 25,000 to 30,000 square feet.
Finally, Area 4 could support development of a few new food outlets or ancillary retail of 10,000 to 15,000 square feet of new retail demand by 2045.
As with all real estate, location criteria for a hotel relate to the ability to draw customers. Top site selection factors include a convenient location with visibility from the highway, area aesthetics and perceived safety. Interstate hotels, unlike resort hotel operations, cluster around the highway exits with convenient access and other nearby customer draws such as employment centers or tourist attractions. Collocation with retail, restaurants and entertainment operations enhances a hotel’s appeal to potential customers.
In Lexington, travel typically relates to visitors to the region for a variety of reasons (e.g., basketball, football, equestrian related activity, visiting family, visiting higher education facilities). More specifically, visitors break into three major categories: business travelers; meeting and group travelers; and leisure or pleasure travelers. Lodging demand reflects not only the number of visitors to an area but also the potential to capture these visitor room-nights in a competitive hotel environment.
Hotel operations segment based primarily on size and price. These distinctions by price include economy, (for lower priced lodging options), graduating to midscale, upper midscale and upscale as price and associated hotel
features increase. Hotel performance varies based on the market segment and operating style of each hotel. Often these categories reflect both the age and investment in specific properties. In addition, some hotels serve special niches, including extended stay facilities that serves business travelers or new residents still searching for a permanent home. Other specialty hotel operations, such as lifestyle hotels or boutique hotels, create subcategories.
In total, Lexington’s hotel inventory provides 9,018 rooms across 82 hotels, clustered along major thoroughfares, near area attractions, in close proximity to the University of Kentucky and in downtown Lexington. The existing inventory of hotel rooms is diverse, encompassing independent operators (8 percent of room supply) economy (12 percent), mid-level hotels without food and beverage service, upper mid-scale with limited food service and high-end alternatives in upper upscale or luxury segments. The largest share of hotel rooms at roughly 43 percent consists of upscale, upper upscale and luxury hotels.
The Lexington regional area draws tourists for equestrian tourism—as the designated Horse Capital of the World.
The area is home to thoroughbred farms and Keeneland race track. A variety of resorts and historic bed and breakfast operations cater to the equine visitors with golf, spas and restaurants on-site such as The Campbell House Lexington, Curio Collection by Hilton, Marriott’s Griffin Gate Golf Resort & Spa. This luxury market represents only one percent of the rooms in Lexington but when coupled with another 2,048 upper upscale rooms make up nearly onequarter of hotel rooms in the market. Upscale hotels alone represent 1,748 rooms in 16 hotels, including Courtyard, DoubleTree by Hilton and Staybridge Suites.
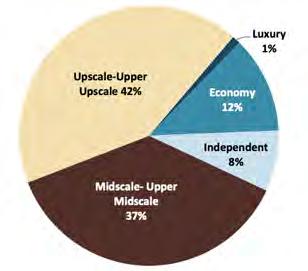
The lodging industry tracks closely with the general economy following its highs and lows. Occupancy data showed a slight decline from the 63-percent average annual occupancy in 2017 to 61 percent in 2019 as the average daily room rates climbed from $98.81 to $100.77. During the same two years, Lexington added seven new hotels with 684 rooms. During the Covid-19 pandemic, the industry suffered significant losses during the lockdown. During the early onset of the Covid-19 pandemic (2020-2021) occupancy rates declined substantial to 37 percent in 2020 and 55 percent in 2021. However, the pandemic did not slow production of new hotels or rooms with the addition of three hotels
in 2020 and five in 2021, resulting in 647 new rooms over the two-year period. New construction includes an upscale SpringHill Suites with 118 rooms and two midscale hotels with 196 rooms.
In general, during economic downturns, hoteliers chose to compete by adjusting room rates. Data pulled prior to the impact of the Covid-19 pandemic show the average daily rates for Lexington hotels increased by roughly 13.1 percent from 2014 to 2019 but dropped 19 percent in 2020 with the initial impact of the Covid-19 pandemic. Fortunately, average daily rates began to rise again in 2021, allowing the hotels to achieve revenue per available room (RevPAR) in 2022
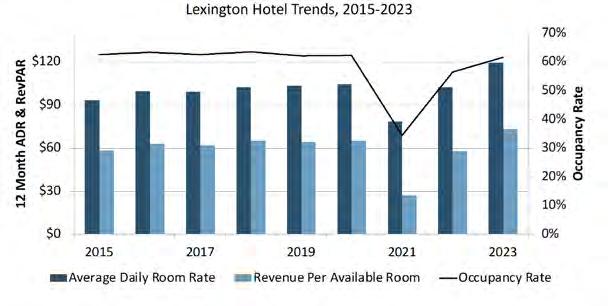
above the 2019 levels; RevPAR combines occupancy and average daily rate data to measure the market’s ability to maximize room revenues.
Over the longer term, the pace of hotel development continues to follow the economic ups and downs. Full recovery for the hotel sector is expected to take much longer; most industry experts are forecasting recovery over four years as travel for business and meetings/ conventions increases. Nationally, hotel occupancy dipped from 66 percent in 2019 to 44 percent in 2020 and has rebounded to an estimated 63 percent, based on data from the American Hotel & Lodging Associations 2023 State of the Hotel Industry report.
Construction of new hotels will continue with the region’s population growth, the addition of new attractions such as the new soccer stadium, and replacement of obsolete facilities.
Expansion Areas 4 and 5 offer competitive highway spots for two to three new hotels by 2045. If a mixed-use retail/restaurant cluster is developed in Expansion Area 3, it might also attract a hotel. However, the viability of these sites will depend on the extent of new hotels being developed as part of the soccer stadium complex.
Residential development in the Expansion Areas will constitute almost all of the new development. The areas are not located in the path of new development being forged by the market, and they do not have the potential to develop into major activity centers that will attract visitors from around the region. Because they will serve primarily the new Expansion Area households, supportable retail, restaurant, service, and office development other than that
associated with the new sports complex will likely be delayed by at least a decade while waiting for the household base to reach a level sufficient to support these new businesses.
The value of the properties to their owners and the larger community would be maximized by the development of diverse neighborhoods offering a variety of housing units of different types, sizes
and price/rent ranges. That would allow the development to address multiple market segments at one time and to address gaps in the current housing supply – smaller units at greater densities to meet the housing needs of the current and future range of Lexington households. Higher densities would allow greater potential to support local businesses and create walkable places to gather and interact with neighbors.
This page left intentionally blank

An important aspect of the UGMP has been community and stakeholder involvement. It was critical to remain transparent and informative and to engage on mutliple platforms throughout the process.
Online Engagement
■ Website
■ Urban Growth Survey
In-Person Engagement
■ Kickoff Event
■ Project Pop-Ups
■ Design Workshop and Urban Growth Fest
■ Public Open House
Additional Engagement
■ Stakeholder Engagement
The following is a summary of outreach efforts to the public, property owners and developers, and key stakeholders.
In November 2023, CivicLex launched the UGMP Website, urbangrowthlex. com. The website served as a hub for project updates and public information, including summarizing the context of the decision, the goals of the plan, a timeline for the process, a list of the Project Team, contact information, and public engagement opportunities. As the Master Plan was developed, the website was updated with presentations and research, market analysis, and draft concepts.
Language: The UGMP website was available in English and Spanish, using the website translation service WeGlot. According to WeGlot statistics, 692 translation requests were submitted between November 2023 and September 2024.
Traffic: Over the last eleven months (November 2023 - September 2024), the website had 7,139 unique visitors and 14,323 page views. 66% of page visitors came from direct links (links in emails, QR codes, or typing the URL directly into a browser). 13% of page visitors came from referral links from local organizations
including WKYT.com, imaginelexington. com, civiclex.org, kentucky.com, and ymcacky.org.
Content: The UGMP website was designed to be a hub of project information and updates. As the plan was developed, project updates were posted, including public engagement summaries, presentations to Planning Commission, the draft existing conditions report, marketing for upcoming public engagement events, the market analysis report, and update presentations including the initial concepts for the plan.

In addition to English, visitors could interact with the project website in Spanish.
Over the life span of the Imagine Lexington website, the page received 727 unique page views. The draft plan document received significantly more traffic—over 37,000 views total, though this includes repeat views and other automated processes. There were 28 comments made by 22 unique commenters. Comments trended positive and mostly consisted of suggestions rather than questions.

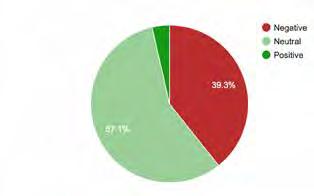
Between December 2023 and April 2024, CivicLex conducted a public survey on the UGMP. The survey was designed to be a starting point for public engagement, and included basic information about the plan followed by a series of ranking and open response questions. The survey also gathered demographic information and optional contact information for staying engaged in the master planning process.
Design: The survey began with basic information about the Urban Service Boundary and master planning process. Each survey question was skipable, and there was an option to opt in for a prize drawing at the end. The majority of questions were organized by the Comprehensive Plan themes (Neighborhoods, Environment, Jobs and Prosperity, Transportation, and Equity). Each theme asked respondents to rank a set of five values in order of importance for the expansion areas, followed by an optional open response question asking “What other priorities or concerns do you have for [insert theme] as Lexington develops new land?”.
Purpose: The goal of the Urban Growth Survey was to add detail and prioritization to On the Table Data and other public engagement on land use in Lexington. Unlike the On the Table survey, the Urban Growth Survey prompted respondents
to make value judgments on what is the most important to them. For each theme, respondents were asked to rank the top five most commonly mentioned values from the On the Table data. For example, in the Neighborhoods theme section, the survey asked:
During On the Table, we heard that the top five priorities for Building Successful Neighborhoods were:
• Amenities & Quality of Life: neighborhood facilities, community events, and healthy living
• Walkability/Bikeability/Accessibility: better infrastructure for walking and biking
• Traffic Calming: slowing down traffic to make neighborhoods safer
• Safety: preventing and responding to crime
• Urban Greenspaces: providing access to parks and green areas in neighborhoods
Understanding that all of these might be important, how would you rank these values in order of most to least important for new development in Lexington?
This data gives more specificity and prioritization than the On the Table Data, and was incorporated into the public
engagement process moving forwards.
Promotion and Outreach: The Urban Growth Survey was promoted with various strategies, including in-person engagement, social media, newsletters and mailing lists, flyers, and cards. Digitally, the survey was featured on the UGMP Website, as well as in the CivicLex Weekly, newsletters from District Councilmembers, a series of social media ads, and on the Imagine Lexington website. For print advertising, cards and flyers about the Urban Growth Survey were distributed at in-person events across town, including at coffee shops, libraries, community centers, campuses, and community organizations.
Respondents: The Urban Growth Survey received 1,027 responses. The average response time was 16 minutes, indicating a high level of interest and thought of the majority of respondents. 770 respondents opted to give contact information and stay in the loop about the plan.
1,004 respondents ranked values for the neighborhoods question. In order of popularity, the values were:
1. Safety (#2.58 average)
2. Walkability/Bikeability/Accessibility (#2.9 average)
3. Amenities and Quality of Life (#2.98 average)
4. Urban Greenspaces (#3.06 average)
5. Traffic Calming (#3.48 average)
854 respondents answered the open response question: “What other priorities or concerns do you have for building successful neighborhoods as Lexington develops new land?”. The most common themes in this question were:
1. Affordable Housing: The most common theme in the open response was affordability of housing for both low- and middle-income families. Respondents were concerned about housing affordability in Lexington generally, and about guaranteeing affordability in the expansion areas. Some respondents mentioned needing density in expansion areas to meet different income levels, and others mentioned prioritizing affordability over high-end developments.
2. Road Infrastructure: Many responses focused on traffic congestion and road safety in and around the expansion areas. Respondents are concerned that the current road infrastructure will not be able to handle increased traffic to new developments, and also expressed concerns about how new developments will be linked to current road infrastructure.
3. Public Transit: The next most popular theme was public transit that can connect new developments to the rest of the city. More reliable and accessible transportation was

mentioned as a concern for Lexington generally and for the expansion areas in particular.
4. Greenspaces: Many respondents called for preservation of existing greenspaces, and incorporation of greenspaces into new developments. Parks and communal greenspaces in the expansion areas were commonly mentioned as an important part of preserving the natural character of the land.
990 respondents ranked values for the environment question. In order of popularity, the values were:
1. Trees (#2.55 average)
2. Rural Greenspace Conservation (#2.77 average)
3. Urban Greenspaces (#2.91 average)
4. Environmental Sustainability and Resiliency (#2.97 average)
5. Recycling/Composting (#3.81 average)
659 respondents answered the open response question: “What other priorities or concerns do you have for protecting the environment as Lexington develops new land?”. The most common themes in this question were:
1. Water and Flooding Concerns: Many respondents expressed concern about water management in the expansion areas, including concerns about flooding, stormwater runoff, and watersheds. Respondents were concerned that development in the expansion areas will increase flooding and runoff issues.
2. Trees and Greenspaces: Many respondents were concerned about the loss of greenspaces with new development, and requested that “neighborhood developments are kept as green as possible”.
3. Impact on Wildlife: Some respondents mentioned concerns about preserving biodiversity and habitats in the expansion

Wolf Run - Lexington, KY
areas, with some specific requests for maintaining wildlife corridors in new developments.
4. Pollution: Some respondents called for greener development practices, with the goal of preserving the environment and air and water quality in expansion areas.
982 respondents ranked values for the jobs and prosperity question. In order of popularity, the values were:
1. Housing Affordability (#2.31 average)
2. Public Education (#2.62 average)
3. Wages and Benefits (#2.75 average)
4. Economic Equity (#3.62 average)
5. Economic Development (#3.69 average)
538 respondents answered the open response question: “What other priorities or concerns do you have for creating jobs and prosperity as Lexington develops new land?”. The most common themes in this question were:
1. Infrastructure: Many respondents highlighted the importance of infrastructure for determining economic success in the expansion areas. This was mainly related to transportation for people living in the expansion areas and working elsewhere, or vice versa. Good roads and utilities were also mentioned as important for new businesses in the expansion areas.
2. Education and Workforce Development: Some respondents mentioned education and workforce development, although not necessarily tied to the expansion areas. Respondents generally supported investing in technical education and skills training to help residents find good employment.
3. Equity: Some respondents expressed concern that economic development in the expansion areas would not be accessible to marginalized people, and emphasized the importance of economic opportunities for low-income residents.
4. Small Businesses: Some respondents advocated for supporting small businesses as a way to improve economic development in the expansion, including with affordable rent and spaces, tax incentives, and small business incubators. Of note, a group of respondents specifically mentioned opposing the use of public funds for private developments.
961 respondents ranked values for the transportation question. In order of popularity, the values were:
1. Traffic Congestion (#2.73 average)
2. Walkability/Bikeability/Accessibility (#2.73 average)
3. Public Transportation (#2.99 average)
4. Infrastructure and Utilities (#3.11 average)
5. Traffic Calming (#3.45 average)
523 respondents answered the open response question: “What other priorities or concerns do you have for improving transportation networks as Lexington develops new land?” The most common themes in this question were:
1. Road Infrastructure: The most common concern in this question is the need for improved road infrastructure with new development, including addressing traffic congestion, maintaining existing roads, and building new infrastructure. Some respondents cite that traffic is already an issue and that the current infrastructure needs improvement, while others are more future oriented and emphasize the importance of road infrastructure keeping up with population growth.
2. Public Transit: Many respondents cited the need for expanded and
improved public transportation, including expanded routes and increased frequency and reliability. Many specifically stated that they think Lextran buses need to go to the expansion areas, and some advocated for alternative modes of public transit, primarily light rail.
3. Walkability and Bikeability: Many respondents mentioned improving bike lanes and sidewalks, and building bike- and pedestrian-friendly infrastructure in the expansion areas. Like other themes in transportation, this theme is referenced both specifically for the expansion areas but also more generally as a goal and need for Lexington as a whole.
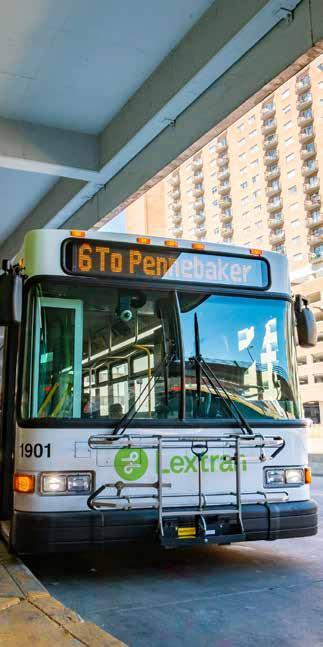
922 respondents ranked values for the equity question. In order of popularity, the values were:
1. Housing Affordability (#2.24 average)
2. Housing Access (#2.6 average)
3. Equitable Development (#3.03 average)
4. Economic Equity (#3.54 average)
5. Social Services (#3.59 average)
386 respondents answered the open response question: “What other priorities or concerns do you have for promoting social and racial equity as Lexington develops new land?”. The most common themes in this question were:
1. Affordable Housing: Many respondents stated that affordable housing is a key component of increasing equity in Lexington, including for new developments in the expansion areas.
2. Economic Equity: Some respondents highlighted economic equity, including programs to help create generational wealth and equitable access to jobs.
3. Social Services: Strengthening social services, including healthcare, childcare, and education, were mentioned by some respondents to increase equity in Lexington.

The last open response question asked: “Do you have anything else to add about your thoughts on the 2024 UGMP?”, answered by 513 respondents. Overarching opinions on the plan vary widely, but can be loosely organized into a few groups.
Some respondents are fundamentally opposed to any expansion of the Urban Service Area. These respondents cite distrust in the legislative and planning process, concerns about inadequate infrastructure, sprawl, and public safety. Some respondents emphasize the importance of investing in already existing infrastructure and public services, or of infill and redevelopment.
Some respondents are conditionally supportive of expansion, depending on the values and implementation of the UGMP. They state that they understand growth and new development is necessary, but have reservations about the specifics of expansion. Infrastructure and environmental sustainability are the most common priorities identified for proper growth.
Some respondents are in favor of growth, and see the expansion areas as an opportunity to grow Lexington’s
economy and accommodate our increasing population. Many respondents who are broadly in favor of growth still cite the importance of planning and investing in infrastructure and public services to make sure new developments don’t harm existing communities.
Some respondents seem to feel ambivalent about new growth, and are more interested in whatever plans and policies can improve housing affordability, equity, economic opportunity, and sustainability in Lexington. These respondents tended to answer open response questions about what Lexington as a whole needs, not necessarily what their specific desires for the expansion areas are.
On December 6, 2023 the UGMP Project Team hosted a kickoff public engagement event at Greyline Station. This event was a chance for all Lexington residents to learn more about the project, including the pieces of land that have been selected for development, and to weigh in on their early values and priorities for the new development process.
There were a variety of input activities to give people a chance to weigh in on their early values and goals for the new areas. The activities were based on values from the Comprehensive Plan, like neighborhoods and transportation. Below are summaries of participant responses:
• The top jobs participants wanted to support or attract in the new expansion areas were leisure and entertainment, medical, and education jobs (64% of total votes).
• The top concepts that participants think will help increase prosperity in Lexington are Housing Affordability, Public Transportation, and Amenities and Quality of Life.
• The top policies that participants thought will help protect the environment in Lexington were Walkability and Bikeability; Recycling, Composting, and Waste Reduction; and Public Transportation.
An activity was available for kids (and adults!) to draw their dream neighborhood. Parks, schools, trains, and water were top features.
One of the most popular activities combined two themes: parks and transportation. Participants were asked what kinds of parks they would like to see, and how they would like to be able to get to those parks. Top options included neighborhood and community parks that you can walk to, and Nature parks that you can drive or take a bus to.
Participants were asked three openended questions about equity for new development in Lexington, including the question “Who do you think needs to be included in the expansion planning process?”. Below are summaries of participant responses:
• All Lexingtonians who will be directly impacted by the expansion should have the opportunity to be heard
• Renters
• Rural centers
• People who use public transportation
• Homeowners within the proposed areas

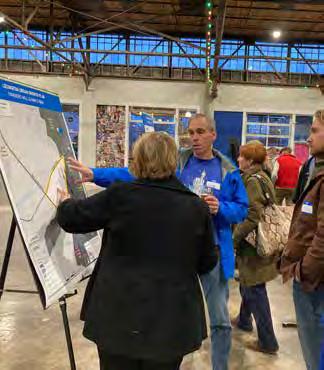
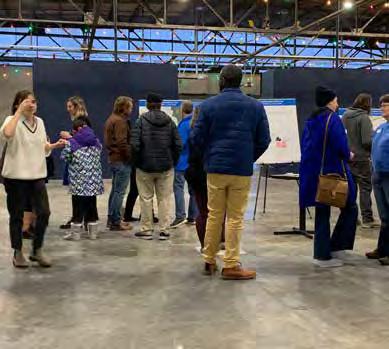
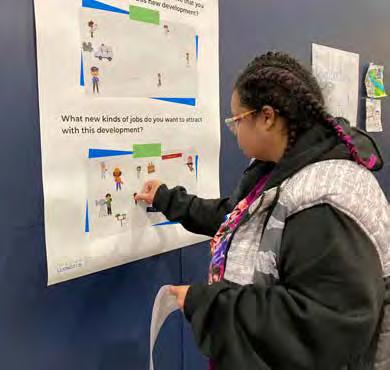
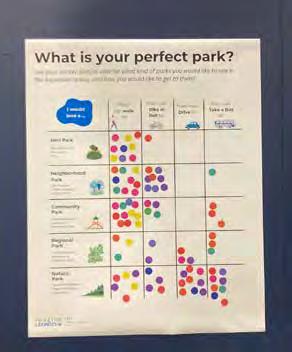

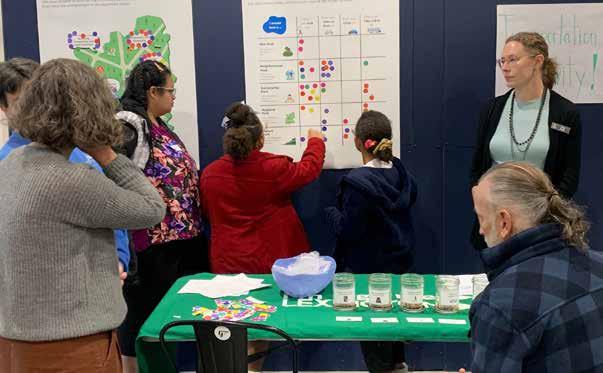
Over the course of the UGMPning process, the Project Team hosted pop up engagements at various community locations and events to reach new residents about the plan and promote further engagement opportunities. CivicLex and Division of Planning staff tabled and attended community events to talk to residents about the UGMP and their vision for growth in Lexington.
Over the spring and summer of the master planning process, popup resources, information, and engagement we provided at the following locations:
• Beaumont Library
• Tates Creek Library
• Eastside Library
• Whitaker Family YMCA
• North Lexington YMCA
• Julietta Market
• University of Kentucky
• Woodhill Community Center
• Pam Miller Downtown Arts Center
• Lafayette High School
• Tates Creek High School
• Henry Clay High School
• Coolavin Park
• Recovery Cafe
• Gardenside Baptist Church
• St. Martin’s Village
Most pop up engagement was with community members who were unaware of the UGMP project and of the Urban Service Boundary as a concept. Most initial conversations revolved around explaining the basics of the plan and emphasized the values and potential outcomes of the planning process, including housing, infrastructure, and economic development. Many residents had opinions and reactions to these themes, and generally agreed that Lexington is growing.



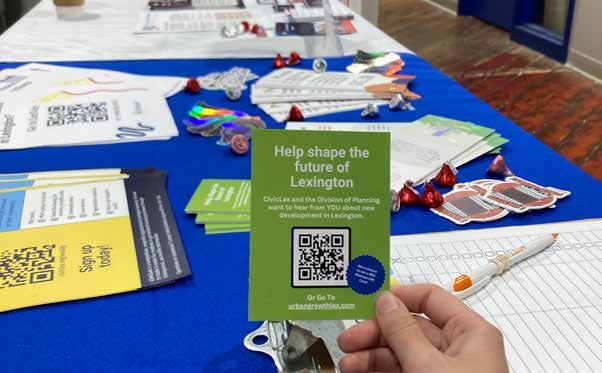
From April 29th - May 1st, 2024, the Project Team hosted a three-day design workshop, capped off with the Urban Growth Festival at the Whitaker Family YMCA. The design workshop included two public presentations of the draft concepts for each of the five expansion areas, in addition to open studio hours for members of the public to meet the Project Team, get an up close look at the draft concepts, and give feedback directly to staff. Hundreds of residents engaged with the plan over the course of the design workshop and public presentations, and were able to speak directly with the Project Team about their vision or concerns for the plan.
The Urban Growth Festival brought hundreds of families, kids, and community members into the planning process through a combination of engagement and recreation. Approximately 200 residents and 10 community partners gathered at the Whitaker Family YMCA on May 1st, 2024 for food, music, face painting, bounce houses, community information, and engagement opportunities. The Project Team manned stations for each of the five expansion areas with printouts of draft concepts to answer questions and help participants understand the plan. A graduate class from the University of Kentucky conducted
interviews of participants about housing, transportation, amenities, and quality of life in the expansion areas. Community partners tabled with information about their work on the five themes of the Comprehensive Plan to add context and anchor engagement.
Community Partners:
• Access Lexington
• LFUCG’s Department of Housing Advocacy and Community Development
• Bluegrass Greensource
• Lextran
• Lexington Fire Department
• YMCA of Central Kentucky
• Lexington Police Department
• Lexington Parks and Recreation
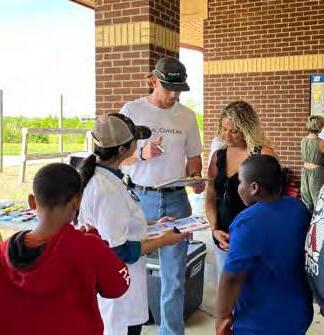

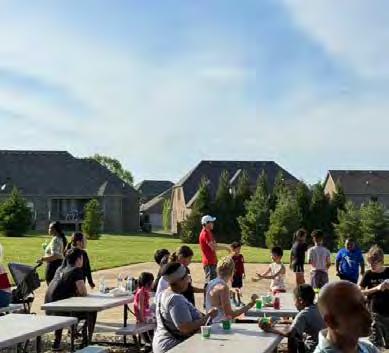
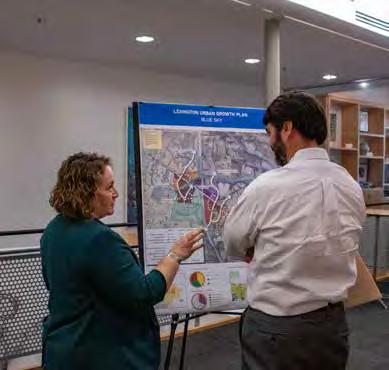

On July 8, 2024, the Division of Planning attended a public meeting at the Beaumont Branch Public Library to discuss Expansion Area 1. The meeting was well-attended and was the second outreach meeting with Beaumont residents. 10th District Councilmember Sevigny was in attendance. At the meeting, Planning Staff gave a presentations and updates on the UGMP. Area 1 is defined by the boundaries of Man O’ War Boulevard, Parkers Mill Road, Heritage Place, and the Beaumont neighborhood.
Attendees raised several concerns about the potential impact of the expansion on their neighborhood. Key concerns included housing density and how the Project Team arrived at the proposed numbers. Questions were also raised about the development process— specifically, whether the city would acquire the property or if a private developer would lead the project. Attendees expressed a strong opposition to combining low-income housing with high-density developments, citing safety concerns and decline in property values.
Traffic was another major issue, with residents worried about the potential connection to Roswell Drive and its impact on traffic flow, road safety, and school transportation. Environmental concerns were also highlighted, particularly related to stormwater runoff karst features, and requests were made to preserve the trees along the property line.
171 attendees+
On July 15 the Division of Planning hosted a public outreach meeting at the Lexington Senior Center located at 195 Life Lane to discuss the Urban Growth Master Plan. At the meeting, Planning presented the updated Master Plan and took comments. Several key concerns and suggestions were raised. Residents expressed a desire for additional facilities, such as senior living facilities, a new elementary school, an indoor water park within the proposed flex space, and a cheer facility. There were also numerous questions about the rezoning process, infrastructure timelines, and how the city arrived at housing density estimates. Additionally, concerns regarding impacts on nearby
PDR farms and the responsibility for upgrading sewer capacity were raised. Transportation and congestion issues were a significant topic, with requests for dedicated bike lanes, safety signs, sound walls, and improvements to Parkers Mill Road and Roswell Drive to address safety concerns due to increased traffic. Other comments included property development timelines, reluctance of the Pine Needles HOA to be involved in the expansion, environmental concerns such as sinkholes, and questions on how greenspace was to be preserved.


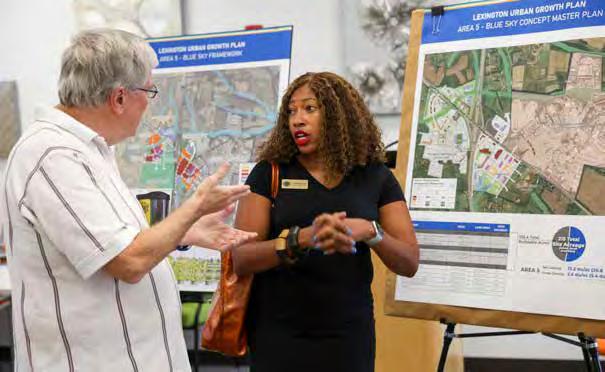

A major outcome of the UGMP project are the Regulating Plans – these identify major streets and roads, open space, and land use, as well as a variety of additional controls critical to the integrity of the land plan.
This chapter covers:
■ Regulating Plans
■ Land Use Typologies
■ Use of a modified street grid
■ Transportation framework
■ Typical street sections
■ Traffic volumes and speeds
■ Intersection types, including alternative intersections
■ Bicycle/pedestrian transportation
■ Future transit service concepts
Following the project’s Guiding Principles, a Regulating Plan was created for each Expansion Area.
The process for each plan was as follows:
1. Non-buildable areas, such streams and ponds, floodplains, steep slopes of 15 percent or greater, or sinkhole risks were identified and set aside for protection based on Existing Conditions analysis.
2. Town and Village Centers were designated along the limited frontage of major arterial roads to serve as gateways.
3. A network of boulevards and avenues was laid out from these hubs, aligning with the terrain.
4. Additional hubs were placed to ensure residents were within 1/2-mile, ideally 1/4-mile, of these focal points.
5. A modified grid of local streets was designed for walkability and long-term development flexibility.
6. Off-road bicycle and pedestrian routes were added for connectivity.
7. Potential transit routes for future Lextran expansion were identified.
As outlined in the Chapter 4 - Public & Stakeholder Engagement, the Regulating Plans were available for review and feedback by the public and developers at several points throughout the process.
Enable a mix of housing options that can serve multiple needs and market sectors
Encourage a variety of uses to meet people’s needs and preferences within their own neighborhoods
Allow modest density increases to drive community improvements and support greater amenities, like retail and public spaces
Provide multiple routes to reduce: congestion, travel distance, travel time, emergency response time, social isolation, and reduce social isolation
Encourage safe alternatives to driving, offering more choices for travel
Respect the natural world and incorporate water, trees, and open space throughout designs


7-13 net dwelling units / acre
Description: Primarily singlefamily dwellings, single-family with ADU (a minimum of 30% of all of all single-family units) and low density multifamily. Multiple-family dwellings with up to 8 units, townhouses, and corner stores.
Setbacks: Per applicable zoning district
Height: Per applicable zoning district
Block perimeter: max. 3,000 linear feet
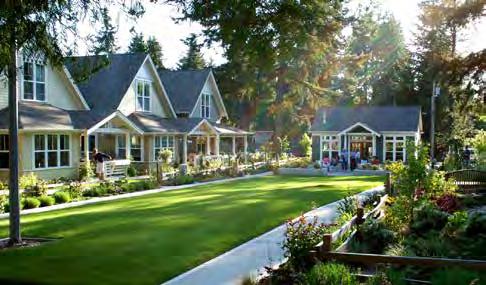
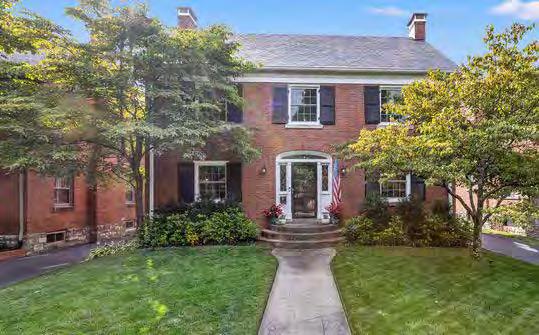
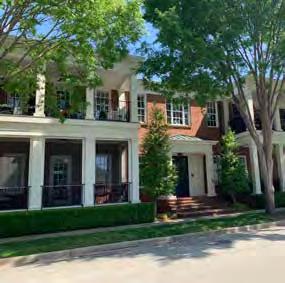
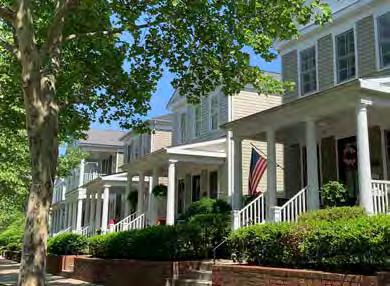
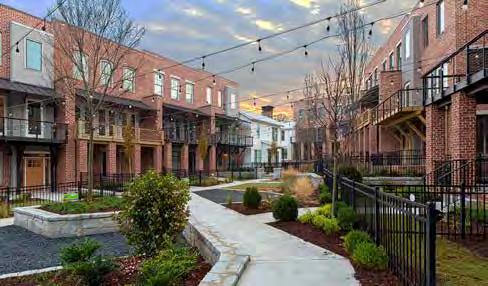
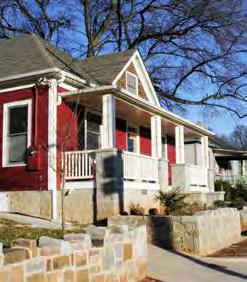
11-25 net dwelling units / acre
Description: Primarily a mix of single-family (maximum of 70% of all units), single-family with ADU (a minimum of 30% of all single-family units) two-family, and townhouse dwellings. Secondary uses include multiple-family dwellings with up to 10 units and corner stores.
Setbacks: Per applicable zoning district
Height: Per applicable zoning district
Block perimeter: max. 2,400 linear feet
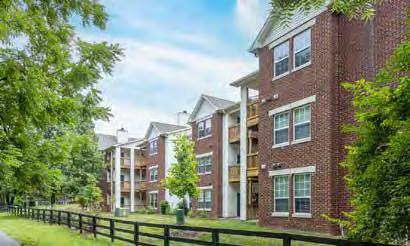
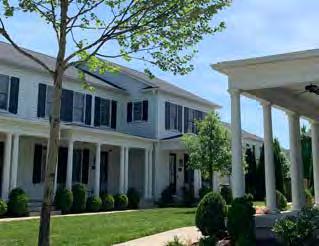
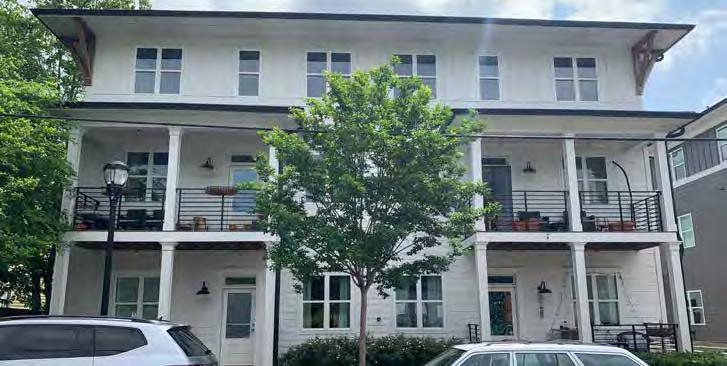
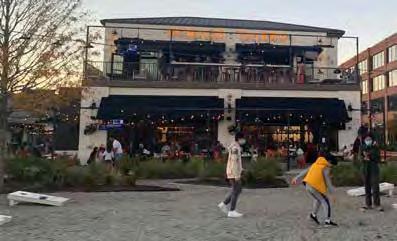
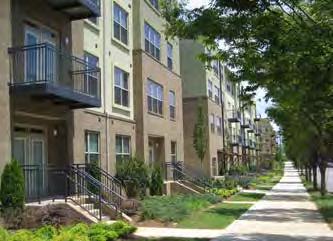
23+ net dwelling units / acre
Description: Primarily a mix of multiple-family dwellings. Secondary uses commercial.
Setbacks: Per applicable zoning district
Height: Per applicable zoning district
Block perimeter: max. 2,000 linear feet
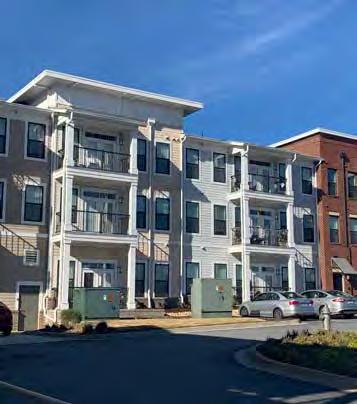
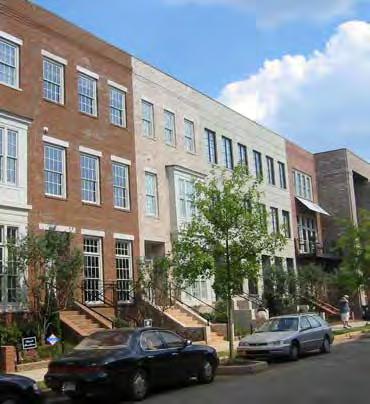
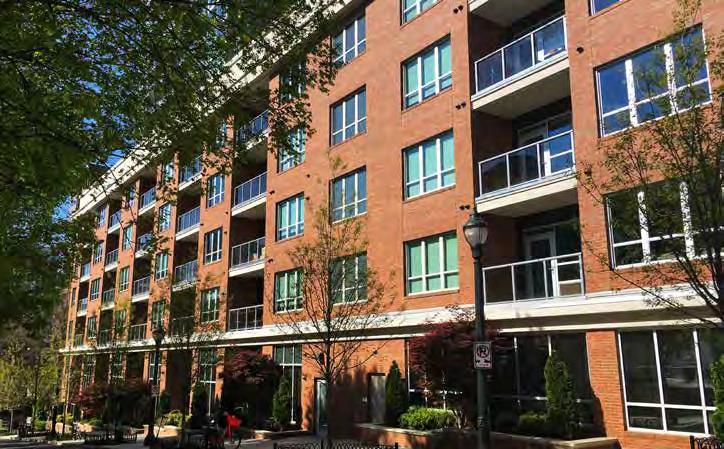
Description: A mix of retail/ restaurant, office, and residential uses. Residential uses are singlefamily (less than 10% of units), townhouses, and multiple-family dwellings either freestanding or in mixed-use buildings. Village centers primarily serve their surrounding and immediately adjacent neighborhoods, providing a focal point of community activities.
Setbacks: max. 20 ft. front setback
Height: max. 4 stories or 60 feet (whichever is less)
Village center size: min. 10 contiguous acres
Block perimeter: max. 2,000 linear feet
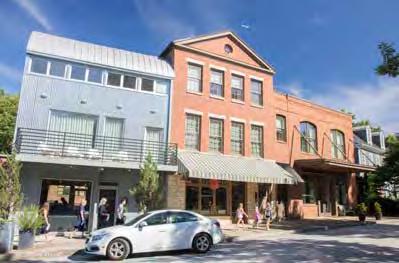

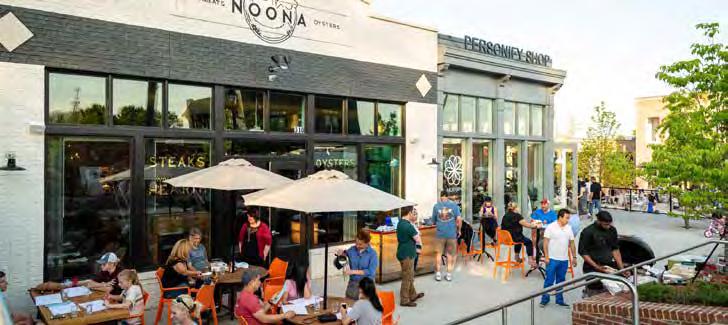
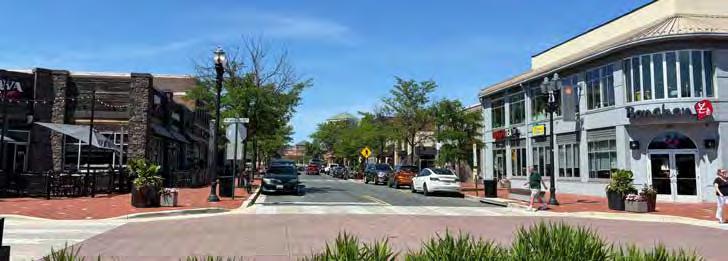
Description: A mix of retail/ restaurant, office, and residential uses within attached buildings set close to the sidewalk, providing destination retail/restaurant uses serving adjacent neighborhoods as well as other areas within a 10to 20-minute drive. Single-family comprises a maximum of 5% of all units. Town centers provide amenities that attract people from areas of the city beyond the immediately adjacent neighborhoods.
Setbacks: max. 10 ft. front setback and buildings built to the front setback for min. 70% of lot frontage.
Height: max. 6 stories or 75 feet (whichever is less)
Town center size: min. 20 contiguous acres
Block perimeter: max. 2,000 linear feet
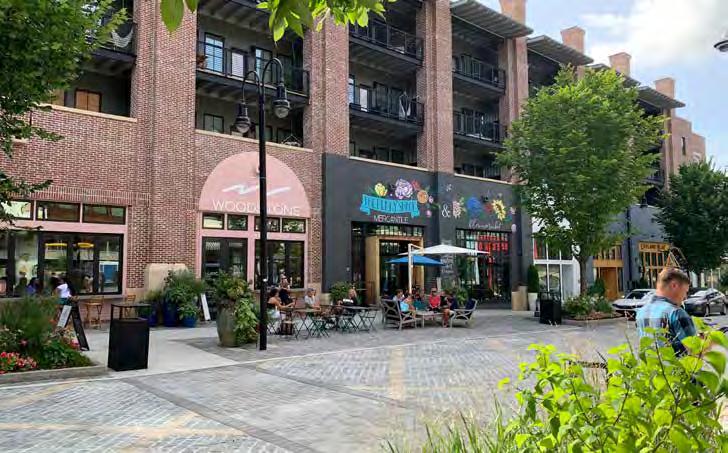
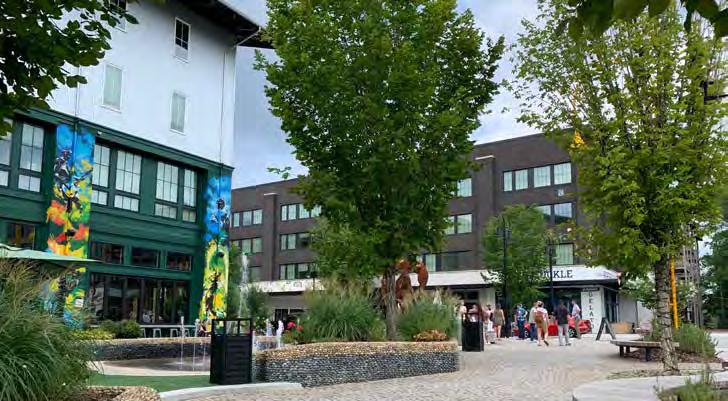
Density: n/a
Description: Primarily retail, restaurant, entertainment, office, industry, recreation, or other regionally significant attractions. Secondary uses include all residential uses.
Setbacks: Per applicable zoning district
Height: Per applicable zoning district
Other: The flex space land use should only occur in areas so designated in a UGMP Regulating Plan.
Block perimeter: max. 5,000 linear feet
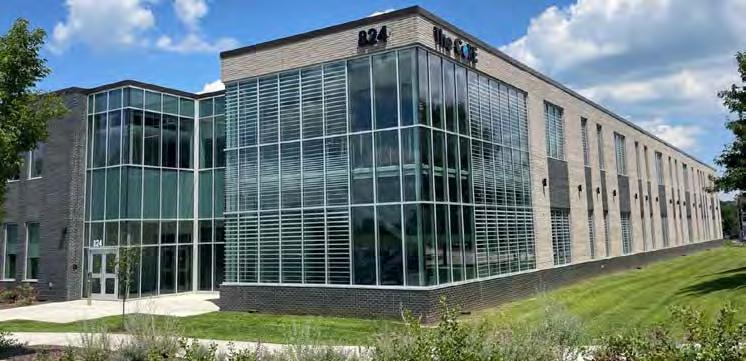

As noted in Theme E - Goal 3 of the 2045 Comprehensive Plan, Lexington continues to support new and robust economic development through the inclusion of land for new jobs. The UGMP has not identified specific acreage for a Regional or Local Business or Industrial Park. However, nothing in this plan is intended to prevent a property owner from bringing forward a proposed Regional or Local Business or Industrial Park. While the UGMP did not identify a specific location for such a use, economic growth remains a priority for the community. Should a Regional or local Business or Industrial user identify land that is within the UGMP area, appropriate flexibility is important to allow for significant job opportunities within Lexington’s Urban Service Area.

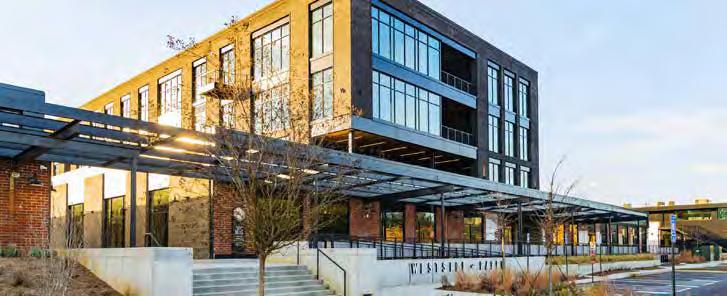
The advantage of designing a grid is that it allows for a circulation system to be laid out in advance, while still allowing for the type of development within each block to respond to the market.
All three of the examples shown to the right use what is considered to be a typical block size to promote walkability and connectivity of 400800 feet x 220-260 feet.
This means that the same block size can be used in a neighborhood context, as is shown in the top example, all the way to a more urban context, shown below, while accommodating a wide range of densities.
In the case of the Master Plan, the grid used is a ‘modified grid’ meaning it still keeps the same qualities of a grid, similar block dimensions, all while responding to the topography of the site.
Dwelling Units : 36
Density : 8.49 du/ac
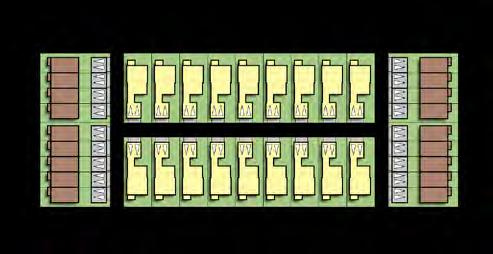
Street Center Line
Dwelling Units : 43
Density : 10.14 du/ac
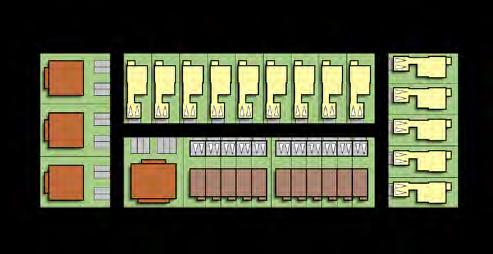
Dwelling Units : 57
Density : 13.44 du/ac
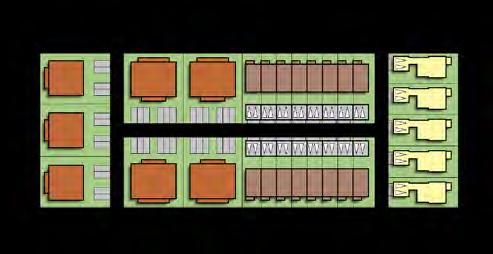
Street Center Line
NOTE: The density calculated here is the Gross Density.
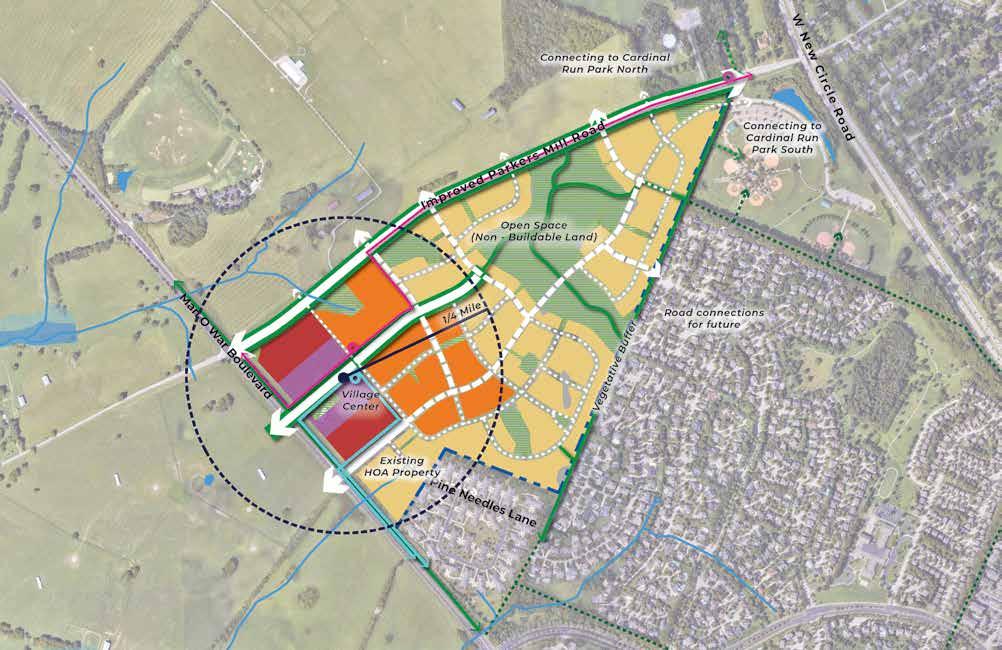

The growth in Area 1 is concentrated along Man O' War Boulevard with Low Density areas, Open Space, and trails working as transition to the adjacent neighborhoods.
• A single Town Center with primary access onto Man O' War Boulevard.
• A system of Boulevards and Avenues connects Man O' War to an improved Parkers Mill Road.
• An interconnected network of neighborhood streets provides access to the Low Density areas and completes the stub street connection to Roswell Drive.
• For the portions of Low Density that directly abut the existing neighborhood, an alternate roadway alignment to the one shown would be a Single Loaded Street section (see Typical Street Sections). In this case, new development would face a Neighborhood Street with the existing tree-lined farm road turned trail running along the backside of the existing houses on the opposite side of the street.
• Bike facilities along the Boulevards and
Avenues will connect with greenway trails through the central open space, as well as off-road through the central open space and along the former farm road, which connects to the Cardinal Run Parks North and South, and to a series of existing Beaumont Trails.
• Neighborhoods dotted with small neighborhood parks, and portions of land shown as potential karst features (e.g., sinkholes) are turned into usable open space.
• Lextran could possibly serve Area 1 with two routes that circulate internal to the site. The first in and back along Man O' War from Palomar. The second out of
town on Parkers Mill and then towards the airport.
• The Heritage Hills HOA-owned lot shows a realigned Pine Needles Lane and is shown with a potential for future Low Density development should the HOA ever choose to develop it.
• Coordinate with the Division of Water Quality for the needed sanitary sewer facilities.
• Conduct geotechnical review regarding extent of sinkholes and other environmentally sensitive areas.
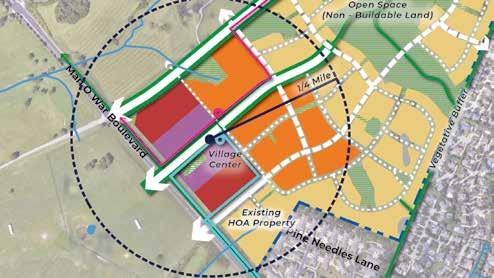
• Major intersection design and traffic control study of access onto Man O' War and Parkers Mill.
• Initiate the engineering design phase for the Parkers Mill roadway modernization project identified in the Metropolitan Transportation Plan.
• Conduct an engineering design phase to redesign the intersection of Man O' War and Parkers Mill as a roundabout or other innovative intersection design.
• Potential transit routes should be evaluated by Lextran for extension to the Areas as they are developed.
• Acts as a gateway along Man O' War Boulevard as the first development entering Lexington coming from the airport.
• Centered around a common open space or plaza with a mix of retail/restaurant, office, and residential uses, primarily serving the surrounding and immediately adjacent neighborhoods, providing a focal point of community activities.
• Residential uses are townhouses, and multiple-family dwellings either freestanding or in mixed-use buildings.
• Potential points of entry exist along Man O' War and Parkers Mill to provide connectivity options.
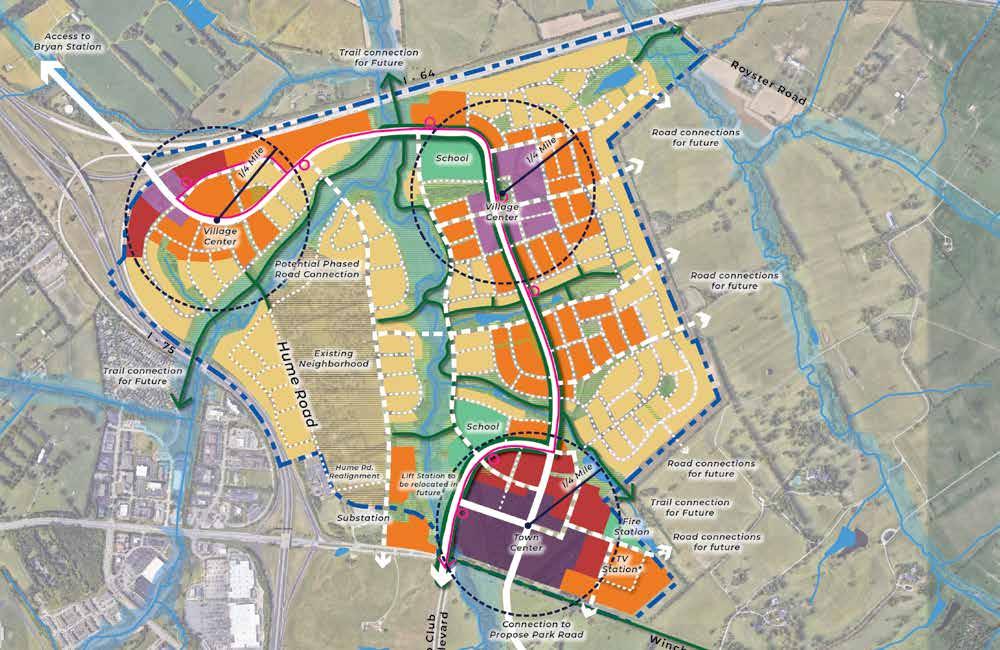

Area 2, with its limited frontage on an arterial, locates most of its development potential along a Boulevard spine, while working to preserve natural resources.
• Includes a gateway Town Center hub along Winchester Road plus two smaller Village Centers.
• A main Boulevard spine connects Winchester Road to an eventual connection towards Bryan Station Road.
• Density is focused around the three neighborhood hubs and along the Boulevards and divided up based on the locations of greenways and open space.
• Two parallel Avenues provide frontage along a greenway connecting two neighborhood hubs, while another serves a Low Density portion of the site.
• An interconnected network of neighborhood streets provides access to the remaining Medium and Low Density areas and acts as stub street connections to adjacent agricultural land in the event of future expansion.
• Bike facilities along the Boulevards and
Avenues will connect with greenway trails through the central open space, as well as off-road along the greenways - making bicycle/pedestrian connections from across I-75 to Royster Road.
• The two converging streams and their associated floodplains, as well as some ephemeral streams, form a connected system of greenways and open space. Streets facing this open space are encouraged for visibility.
• An alternate alignment for the intersection of Hume Road and Winchester Road is shown to make it less appealing to cut through traffic. A
realignment would need to be phased with the relocation of the pump station.
• The existing Hume Road residential neighborhood is protected from increased through-traffic by realigning both ends of Hume Road so that it no longer crosses the stream with vehicular traffic (bicycle/pedestrian connections are still permitted) and instead connects to one of the new Avenues at points to the north and south through a phased approach.
• Transit is shown to serve the northernmost portions of the site looping around and then returning back on itself. The long-term potential
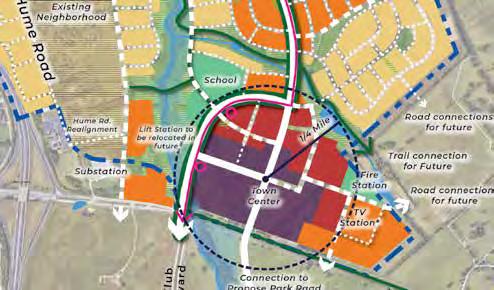
exists to connect transit from Winchester Road to Bryan Station along this alignment.
• Assumes that the existing lift station on Winchester Road closes and is replaced by a larger pump station where the streams have converged and gone under I-64.
• Acts as a gateway to the rest of Area 2 along Winchester Road.
• Centered around a common open space or plaza lined with dense mixed use buildings typically 3 stories or more and surrounded by High and Medium Density.
• Two major points of entry include a continuation of Polo Club Boulevard and a future connection to Park Road (aka Blackburn Parkway).
• Contains a potential site for a fire station to the east, and a school, and civic use building to the west backing up to the greenway.
• This portion of the site, in close proximity to Winchester Road, would most easily be served by transit.
• Coordinate with the Division of Water Quality for the needed sanitary sewer facilities.
• Immediate coordination with KYTC District 7 for funded project currently under design for Winchester Road improvements, particularly at Hume Road. Ensure that future access points and intersection treatments are considered and designed for future urbanization including multimodal safety and appropriate speeds
• Conduct future study to review bicycle/ pedestrian connectivity under I-75 and I-64 along proposed trail section connecting Hume Road and the nearby floodplain to Elkhorn Road or Call Drive.
• If the existing neighborhood portion of Hume Road seeks to redevelop in the future, coordinate the realignment of the northern section of the road.
• Consider safety upgrades on rights-ofway north of the I-64 overpass at Bryan Station and Hume Road to address traffic and safety concerns if additional traffic loaded onto the current road.
• Potential transit routes should be evaluated by Lextran for extension to the Areas as they are developed.
• Evaluate feasibility of potential transit circulator route connecting areas 2, 3, 4 and 5.
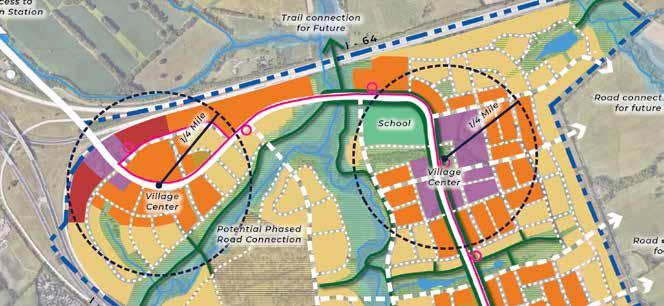
• Density set to line the curve of the highway to absorb highway noise by using building setbacks, liner garages, and parking facilities to the rear of buildings.
• Development is contained by floodplain bisecting it from the rest of Area 2.
• Accessed along the major Boulevard and serving as a gateway for those entering from Bryan Station.
• Transit stops serve the Village Center and the trailhead.
• Density and neighborhood-serving mixed use focused on a central green finger to be used as common open space.
• Density radiates out on a grid system of connected streets.
• Accessed along the major Boulevard and the greenway-fronting Avenue.
• Contains a potential site for a school to serve the northern half of the site.
• Transit stops for access to the school, Village Center, and open space
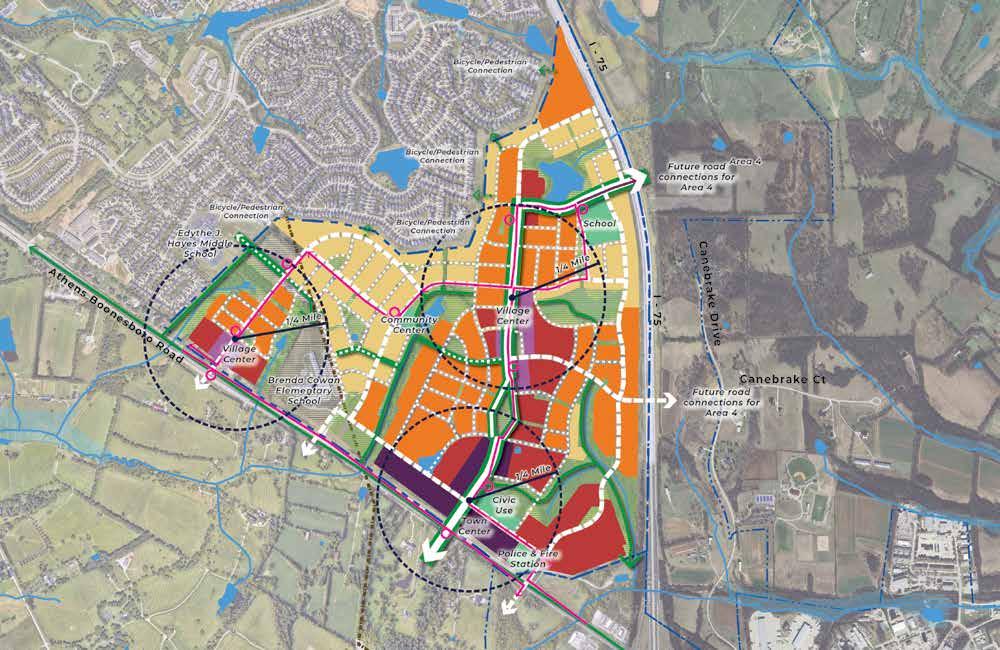

While Area 3 has its challenges for connectivity, its location and terrain lend itself to the possibility of significant community-building and density.
• Includes a Town Center and two Village Centers.
• A main Boulevard connects Athens Boonesboro Road back into the eastern half of the site with a long term potential connection to Area 4 across I-75.
• Density is focused around Boulevard and Avenues to the east and up along Athens Boonesboro Road, some of which could be expected to serve Blue Sky or the energy around the Entertainment Districts.
• A series of interconnected Avenues work to crisscross the site and provide as many circulation alternatives as possible within Area 3 since other connections are not available.
• A modified grid of streets is used throughout to continue interconnectivity.
• Bike facilities along the Boulevards and Avenues will connect with greenway
*Shows an assumed density range.
trails through the central open space, as well as off-road along the greenways and make some of the few connections available to the Athens-Chilesburg neighborhoods.
• Area 3 contains several streams, ponds, and low-lying areas with existing tree canopy, in conjunction with a number of neighborhood parks, to form an area
• Coordinate with KYTC District 7 to ensure urban complete street roadway improvements along Athens Boonesborough Rd and coordinate access points and intersections for future development.
• Coordinate with the MPO and KYTC District 7 to conduct a feasibility study
• Evaluate feasibility of potential transit circulator route connecting areas 2, 3, 4 and 5. Timeframe may vary between mid and long term depending on how quickly these expansion areas develop.
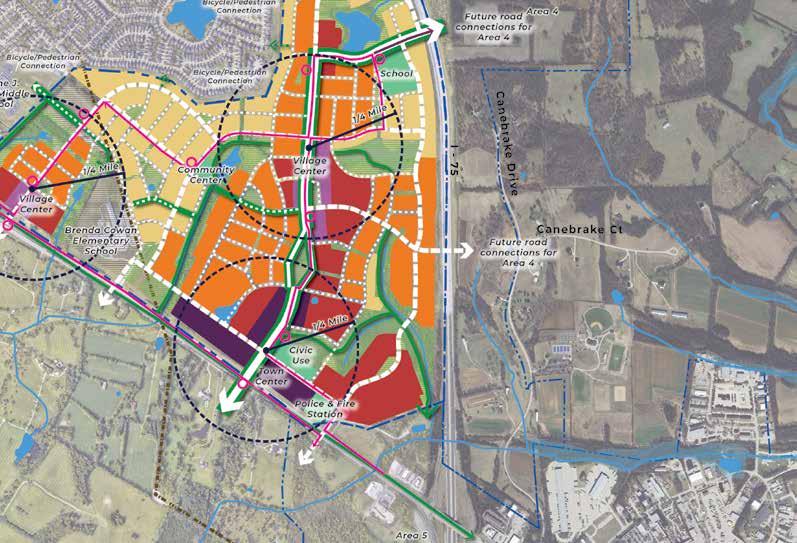
Acts as a gateway to the City of Lexington for visitors coming
Acts as a gateway to the rest of Area 3 along Athens
Centered around a common open space or plaza lined with dense mixed use buildings typically 3 stories or more and surrounded by High and Medium Density, with the opportunity for a signature civic building.
Location and potential density create the potential for transitoriented development for eventual service by Lextran.
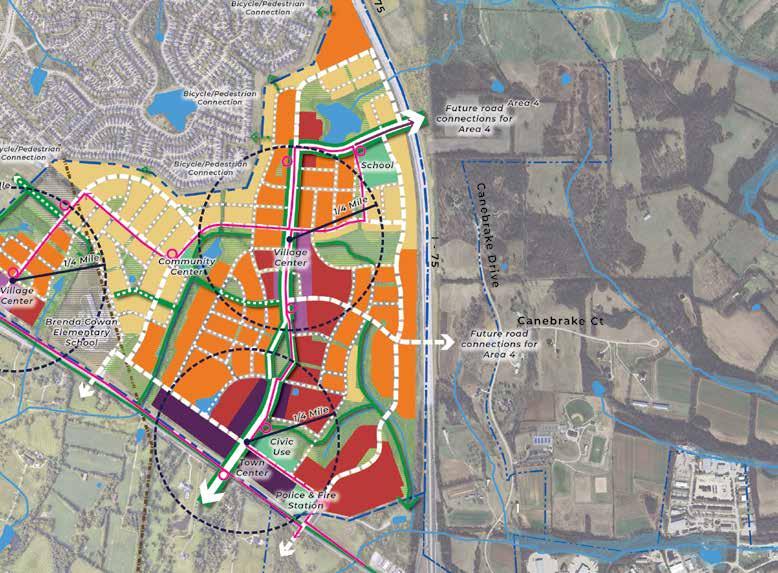
Density and neighborhood-serving mixed use along either side of the Boulevard and centered around a common open
Density radiates out on a grid system of connected streets.
Roughly bounded by a greenway on one side and the
Transit within the interior aids in access throughout the site and to major points of civic infrastructure, such as the new school site and the community center.
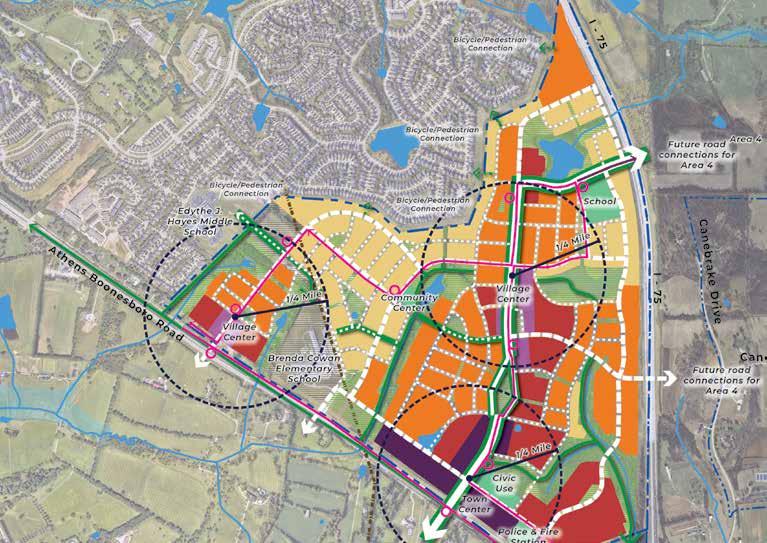
A contained pocket of density bounded by two greenway fingers, Athens Boonesboro Road to the south, and FCPS
Density transitions from High to Medium as it moves further from Athens Boonesboro Road.
Challenges of only one Avenue to serve as the major access
Opportunity to leverage FCPS sites along with greenways as
Transit stops serve both the Village Center and the nearby
Area 4 has the potential to provide another circulation option from Todds Road to Athens Boonesboro Road, while unlocking land for development in an area of Lexington that has seen steady growth.
• A Town Center is located along Todds Road to continue the momentum and growth of the previous Expansion Area Master Plan along Polo Club Boulevard.
• Another Village Centers serving the surrounding neighborhood exists further into the site and has the potential to flourish if the connection across I-75 is accomplished.
• A main Boulevard spine connects from Athens Boonesboro Road to the south, to Todds Road to the north, following the general alignment of Canebrake Drive.
• A direct connection to Polo Club Boulevard is impeded by existing development.
• Two potential connections crossing I-75
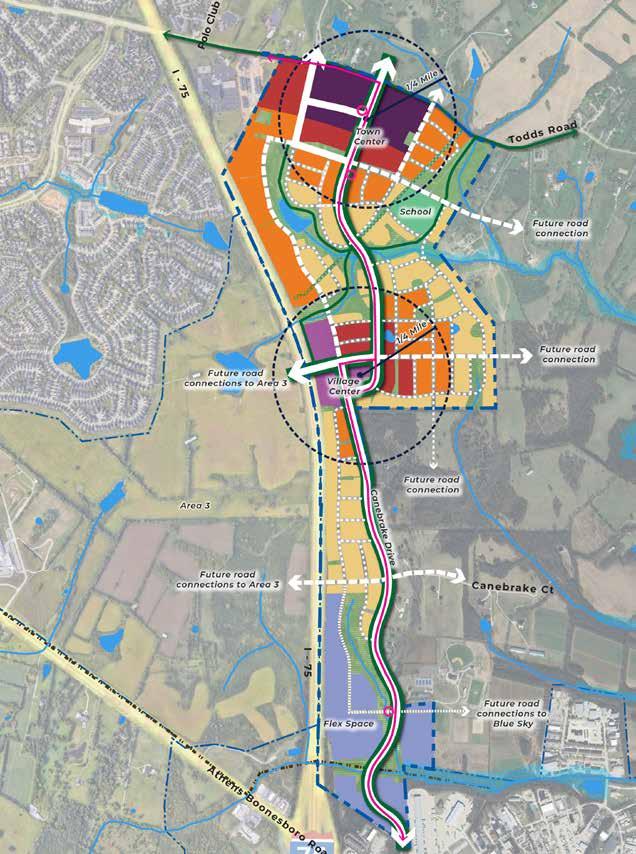

are shown to help both Areas improve their limited cross-connectivity and could help with determining how to serve civic infrastructure such as emergency response and schools.
• Future road connections are shown into adjacent agricultural land to show a continued need to acknowledge the potential for future growth through the presence of stub streets.
• Density is located between areas set aside for floodplain and greenways, which also work to help divide Area 4 into distinct communities.
• At least one school site is warranted based on the population projections.
• An interconnected network of neighborhood streets provides access to the remaining Medium and Low Density areas and acts as stub street connections to adjacent agricultural land in the event of future expansion.
• The southern half of the site is shown as flex space given its proximity to Blue Sky and a natural divide between adjacent uses along an existing hilly embankment and low-lying stream. This flex space would most likely need to be served by an industrial road section.
• Bike facilities along the Boulevards and Avenues will connect with greenway trails through the central open space
making bicycle/pedestrian connections between two major spokes of Lexington’s hub and spoke system.
• Transit is planned to connect to either/both Todds Road or Athens Boonesboro Road with stops in the Town and Village Center, to serve the school, as well as at the employment associated with the flex space to the southern end.
• If the connection is one day made across I-75, transit will use it to connect Areas 3 and 4.
• Coordinate with KYTC District 7 to ensure urban complete street roadway improvements along Athens Boonesborough Rd and Todds Rd and coordinate access points and intersections for future development.
• Study of extension of Canebrake Drive to Todds Road.
• Coordinate with the MPO and KYTC District 7 to conduct a feasibility study on the best potential connections between Areas 3 and 4 across I-75.
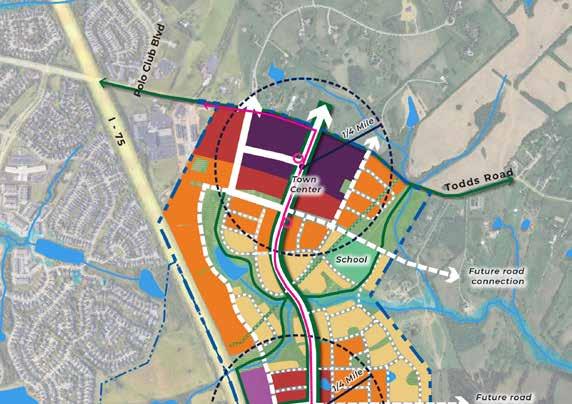
• Potential transit routes should be evaluated by Lextran for extension to the Areas as they are developed.
• Evaluate feasibility of potential transit circulator route connecting areas 2, 3, 4 and 5. Timeframe may vary between mid and long term depending on how quickly these expansion areas develop.
• Continues the push of development along Todds Road by making multimodal improvements at intersections and along Todds Roads.
• Town Center density has a potential mix of uses within attached buildings set close to the sidewalk and surrounding a public open or green space serving adjacent neighborhoods as well as other nearby neighborhoods.
• Central location of a transit stop within the heart of the Town Center will be needed.
• Natural resources such as ponds and streams act as natural amenities.
• A potential school site is shown fully integrated into the Town Center, and served by a potential transit stop.
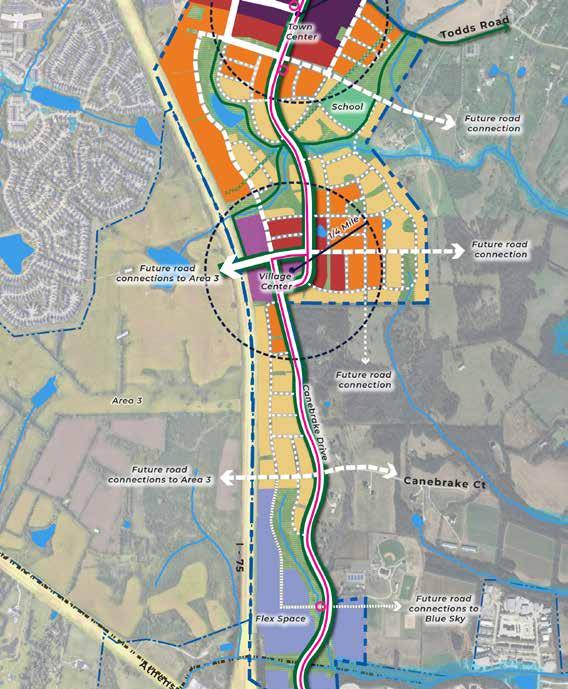
• A Village Center helps to focus development on the center of Area 4, which is inherently more difficult to access.
• If the connection is made across I-75 this area could see additional development, and transit and bicycle/pedestrian connections between Areas 3 and 4.
• Density radiates out on a grid system of connected streets.
• Roughly bounded by a greenway to the north and Area 5 bounds on most other sides.
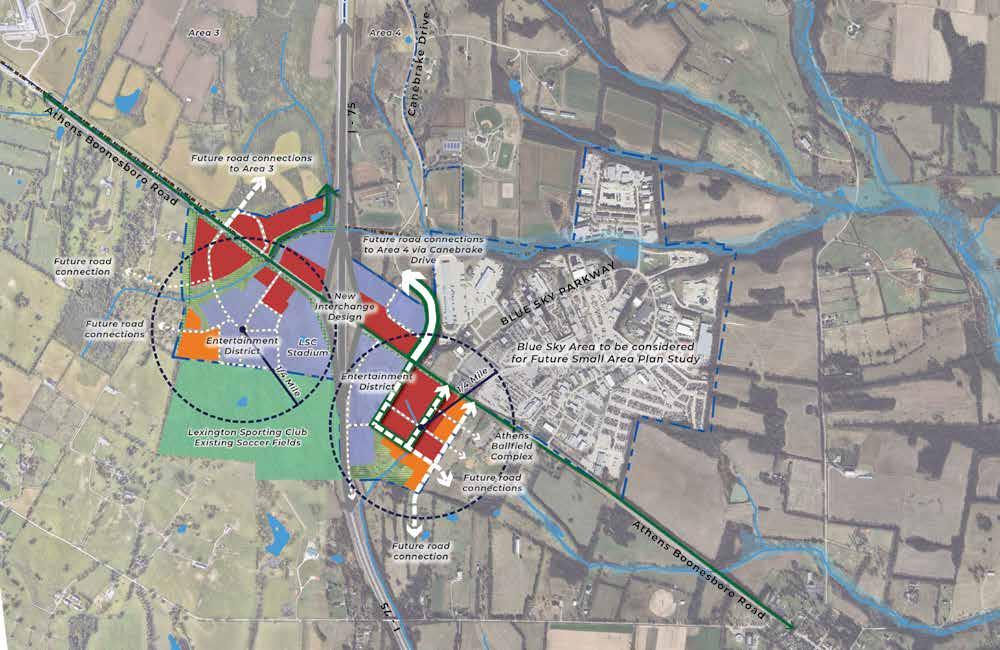

The location of Area 5 at the interchange of I-75 and with the current development of the Lexington Sporting Club site has the potential to be a lively Entertainment District.
• The area shows a large amount of flex space, which provides flexibility and adaptability to the market to either foster an Entertainment District or become supportive development to the future of Blue Sky.
• High and Medium Density are favored here due to the proximity to the highway and ability to serve Lexington Sporting Club staff and athletes or provide workforce housing for the businesses in the area.
• Existing highway-serving businesses are reimagined with additional density.
• Future road connections to adjacent agricultural land are shown for potential long-term connectivity needs.
• Bicycle/pedestrian infrastructure throughout the site is focused on getting people to and from the Area for major events.
• Transit runs along Athens Boonesboro Road dipping into both Entertainment Districts with a stop, plus a third stop to serve the corner of Blue Sky.
• Conduct Blue Sky Activity Center Small Area Plan.
• Coordinate with KYTC District 7 to ensure urban complete street roadway improvements along Athens Boonesborough Rd and coordinate access points and intersections for future development.
• Consider a study exploring alternative designs for the I-75/Athens Boonesboro
Road interchange, focused on vehicular stacking and transportation safety.
• Potential transit routes should be evaluated by Lextran for extension to the Areas as they are developed.
• Evaluate feasibility of potential transit circulator route connecting areas 2, 3, 4 and 5. Timeframe may vary between mid and long term depending on how quickly these expansion areas develop.
*Shows an assumed density range.
The Concept Plans propose a humanscaled design to make it easier for people to choose to make trips outside of a vehicle. The ideal design is a curvilinear loop which has multiple streets that serve as entrances and exits to the exterior of the Areas, and a highly connected network of streets internal to the Areas with no dead-end streets permitted.
This redundancy in the street network provides multiple routes that serve the same origins and destinations which reduces traffic volumes, congestion delays, and trip distances, and improves livability by allowing for alternative route choices and reducing emergency response times. This design also fits the context of the existing neighborhoods surrounding each of the Areas without compromising on the need for a humanscaled design.
Lexington’s upcoming Complete Streets Design Manual (2025), based on LFUCG's Complete Streets Policy adopted in 2022, may supplant the recommendations of this section.

Street Network Typologies. The Curvilinear Loop Design should be prioritized when designing the Areas in order to add redundancy in the network and create a human-scale street network. Source: Congress for New Urbanism Street Networks 101 | CNU
Following the design of the street network in the Concept Plans, five different street typologies were established, shown in the table below. The ideal characteristics of these street typologies prioritize Complete Streets principles that make it comfortable, safe, and efficient for people using all modes of transportation.
Use of these street typologies will depend on the proximity to a main entrance or exit to the Area and desired traffic patterns. The streets were devised to be functionally classified as either Local Roads, Minor Collectors, or Major Collectors. As the Areas are fully developed, there are two proposed corridors that may carry enough traffic and connect to enough destinations beyond these Areas that they could
lane
direction (unmarked)
lane
direction (marked or unmarked)
Unmarked one or both sides; Sign restricted or self-enforcing
One or both sides (marked or unmarked)
lane each direction; left turns restricted Marked or unmarked (minor collector); marked (major collector)
Bicyclists share vehicular lane
Sidewalk; Bike lane or Buffered Bike Lane (higher volume) or Shared with vehicular lane (very low volume)
Sidewalk; Protected bike lane / cycletrack; shared use trail if access points are very limited
be upgraded to Minor Arterials; these corridors are the Boulevards proposed in Areas 2 and 4.
The density and type of adjacent land uses will inform which street elements are provided for each street type, as well as their dimensions. Lexington's forthcoming Complete Streets Design Manual will provide this guidance for streets within the UGMP Area.
Street Types and Characteristics - For specific dimensions of each street section, consult Lexington’s Complete Streets Manual.
Roundabout (or miniroundabout)
Alleys are functionally classified as local roads with a 10MPH target speed. They have a shared, unmarked drive aisle that bicyclists and pedestrians also share. In commercial contexts, alleys are appropriate for loading zones. In both commercial and residential contexts, alleys provide access to driveways and garages and parking may be permitted in designated areas. Alleys are used for waste collection and provide an alternative for the placement of utilities rather than the main roadway.
Alleys may also be utilized as flexible outdoor space to boost business and foster a sense of community. Appropriate intersection treatments include stop signs and neighborhood traffic circles.
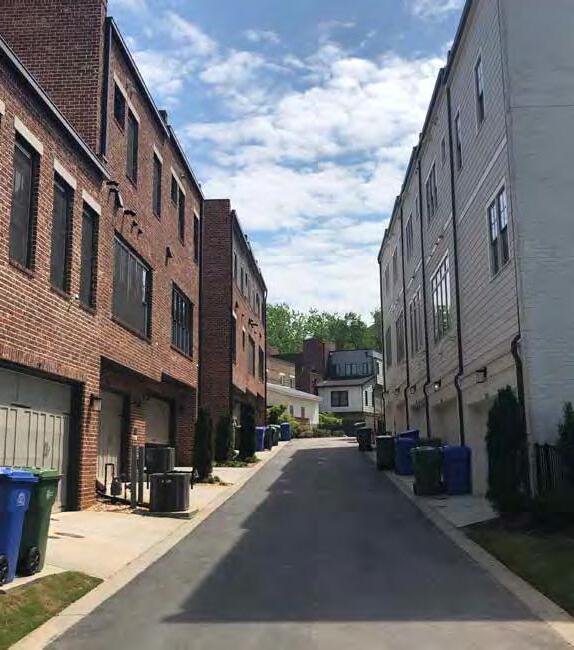
NOTE: ALL SECTIONS ARE SUBJECT TO COMPLIANCE WITH THE COMPLETE STREET DESIGN MANUAL
These are functionally classified as local roads with a 20MPH target speed. Neighborhood Streets can include yield streets which have parking on both sides and a shared, unmarked drive aisle in the center. Yield streets are appropriate in lower density contexts where on street parking occupancy is less than 50%. In higher density areas where parking occupancy is expected to be greater than 50%, neighborhood streets should be wide enough for two passenger vehicles to pass unimpeded, but slowly.
Traffic volumes on neighborhood street are low enough that bicyclists can comfortably share the lane with vehicles. Residential driveways, commercial access and left turns are allowed on a limited basis to avoid conflicts with bicycles and pedestrians and vehicles. The width of sidewalks and planting strips may vary based on adjacent land uses.
The preferred intersection treatments along neighborhood streets include neighborhood traffic circles and mini roundabouts. Where stop signs are used, traffic calming features such as raised intersections and curb extensions should be spaced at recommended intervals per the Complete Streets Design Manual.
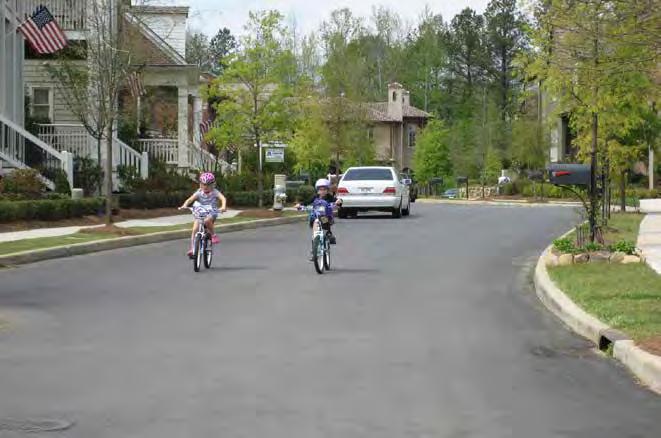
NOTE: ALL SECTIONS ARE SUBJECT TO COMPLIANCE WITH THE COMPLETE STREET DESIGN MANUAL
Avenues are functionally classified as minor collectors with a 25MPH target speed. These streets have two travel lanes, one in each direction, and can either be marked or unmarked. Driveways, commercial access, and left turns are allowed. Bike lanes are typically provided except where very low traffic volumes are expected (less than 3,000 trips per day), and in these cases bicyclists may share the lane. Likewise, if traffic volumes are higher, a buffered or protected bike lane may be warranted. The dimensions of sidewalks and planting strips may vary per land use. Medians* are not typically present for access management, but are optional when traffic volumes are higher, or for experiential purposes. The preferred intersection treatment is an appropriately sized roundabout.

*For the purposes of the fiscal impact analysis, medians were assumed as a typical element of each section for the length of all Avenues.
*Medians* are not typically present for access management, but are optional when traffic volumes are higher, or for experiential purposes.
These are functionally classified as minor collectors or major collectors with a 25MPH target speed. Boulevards typically have two marked travel lanes, one in each direction, but may be up to four lanes*, two in each direction, depending on traffic volumes. Left turns are restricted through the use of medians. Driveways are not allowed, commercial access points are limited, and left turns are accommodated at intersections only.
A protected bike lane separates bicyclists from traffic with a barrier. A shared use path may be used where intersecting streets and access points are very limited. When adjacent to a greenway, a trail may be used in place of a bike lane.
The presence or absence of on-street parking and dimensions of sidewalks, planting strips, and medians can vary based on land use and traffic volumes. The preferred intersection type is an appropriately sized roundabout, or other alternate intersection types (when entering or exiting the Area).
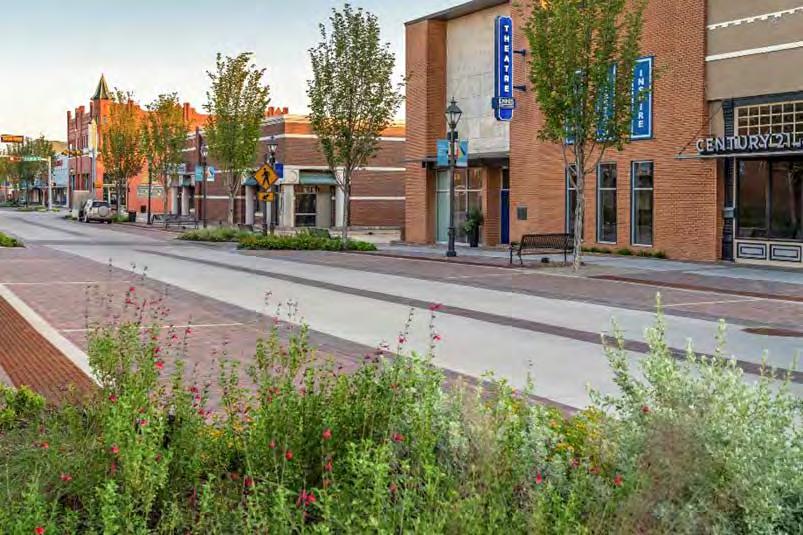
*For the purposes of the fiscal impact analysis, four travel lanes and two lanes of parking were assumed for the length of all Boulevards.
NOTE: ALL SECTIONS ARE SUBJECT TO COMPLIANCE WITH THE COMPLETE STREET DESIGN MANUAL
Single-loaded streets have buildings only on one side, which provides visual connections to open space from every building and for users who are driving, biking, or walking through the corridor. This configuration is required for 60% of road frontage adjacent to greenspaces, parks, schools, and other public facilities. Single-loaded streets could be present along any of the defined street types. Most single-loaded streets will have a sidepath on the same side as the public facility and a sidewalk on the other. Parking can be located on either one side or both sides of the street, depending on demand.
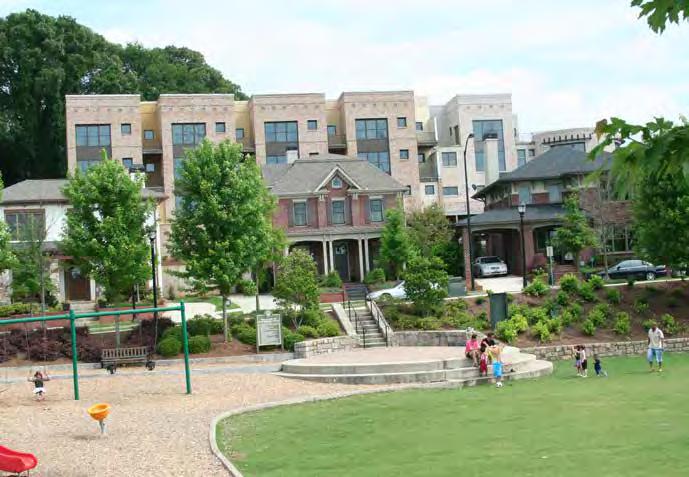
NOTE: ALL SECTIONS ARE SUBJECT TO COMPLIANCE WITH THE COMPLETE STREET DESIGN MANUAL
Traffic volume is a measure of how many vehicles or people travel on a road or through an intersection.
Estimated number of trips were calculated using the ITE Trip Generation Manual by identifying the land use and size of the new development and then determining the average trip rate, which is the number of trips generated per unit of a specific land use. Traffic volumes are typically higher at access points and decrease further within each Area. Most access is via Boulevards and Avenues, with less on Neighborhood Streets. More access points distribute traffic across the roadway network, causing a wide volume range on Boulevards between different Areas.
Varies depending on game days for Lexington Sporting Club. The southeast part of the area has multiple access points to Athens Boonesboro; therefore trips will be well distributed on internal routes.
Target speeds are the desired maximum speed a vehicular should operate in the corridor. The highest targeted speed for all the Areas is 25MPH on Boulevards and Avenues. Neighborhood Streets are even lower at 20MPH, and Alleys are targeted for 10MPH, which makes both of these streets safe for bicyclists to share the lane with vehicles.
Designing roadways using higher target speeds can act as a cue to drivers that higher operating speeds are appropriate, even if posted speed limits are lower than target speeds. To ensure the actual speeds match the target speeds, the design of the streets should include traffic calming techniques such as a maximum of one-travel lane in each direction, narrow lane widths (no more than 11’ on minor and major collectors), tighter curb radii, on-street parking, all-way stops, bulb outs, street trees, neighborhood traffic circles, roundabouts, and landscaping.
Intentionally designing the Areas with target speeds no more than 25MPH will increase the chances of survival if a pedestrian is hit by a vehicle. The design of streets should balance the need to efficiently collect and move vehicles towards their destination with the need to keep the roadway safe for all modes
of transportation. The curvilinear loop street network, alternative intersection techniques, and providing bicyclist and pedestrian networks to encourage people to take trips outside of a vehicle can reduce congestion which eliminates the need for design techniques that make it unsafe for vulnerable road users, such as multiple travel lanes in one direction.

Historically, motor vehicle traffic has been managed with traffic signals. However, alternative intersections can improve traffic flow, improve the safety of all modes of transportation, calm traffic in neighborhoods, and reduce the long-term operations and maintenance burden of the intersection. Alternative intersection designs that improve safety and reduce the use of traffic signal infrastructure should be prioritized at all intersections entering or exiting each Area. Further study is needed to review the location of and type of intersection treatments along the major corridors bordering the Areas. There shall be no traffic signals internal to the Areas to remove the burden of operating and maintaining new traffic signals and related infrastructure.
• These are appropriate at different scales throughout the Areas. Some roundabouts could move multiple throughlanes of traffic (image top right), while some may be miniroundabouts or roundabouts with a flat or mountable center to permit emergency access (image below right). Roundabouts are designed to accommodate vehicles of all sizes, including transit buses and freight delivery vehicles. They can also be designed to safely accommodate bicyclists and pedestrians, which should be a priority for future designs. Roundabouts save time by streamlining vehicle movement, reducing delays and congestion, improving access to destinations, and reducing pollution and fuel use. They are also much easier to maintain than signalized intersections, therefore they should be prioritized when designing each of the Areas.
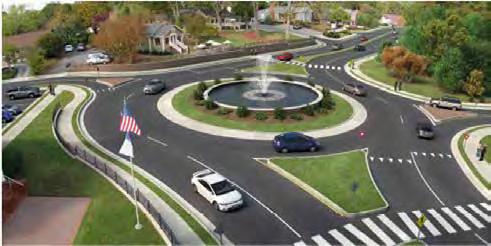

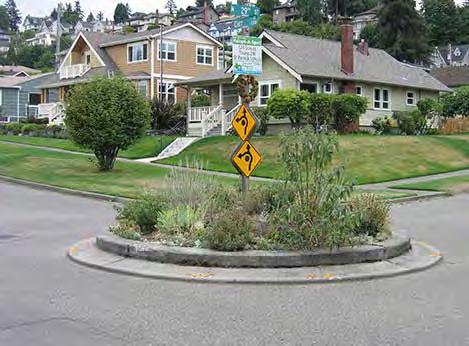
of a landscaped neighborhood traffic circle. Source: www.pedbikeimages.org/ - Carl Sundstrom
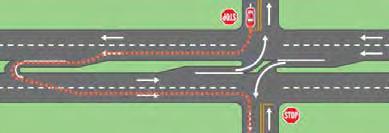
• Neighborhood Traffic Circles are raised circular islands constructed in the center of residential street intersections. They reduce vehicle speeds by forcing motorists to maneuver around them, and can take the place of a signal or four-way stop sign. Mini-circles are commonly landscaped, most often at locations where the neighborhood has agreed to maintain the plants. In locations where landscaping is not feasible, traffic circles can be enhanced through specific pavement materials.
• These are appropriate for multi-lane divided roadways, which serve as the exterior boundaries of each of the Areas, including: Man o’ War Blvd., Winchester Rd., and Athens Boonesboro Rd. In anticipation of future development, an RCUT was constructed and began use in August 2024 on Athens Boonesboro Road adjacent to Areas 3 and 5.
• RCUT intersections improve safety by reducing the number of conflict points, but still allow for the efficient movement of turning vehicles, making these intersection types a good fit for main entrances into each Area and connecting to Boulevard street sections (Minor or Major Collectors) once inside the Area.
• These only permit vehicles to turn right into or out of the intersection by channelizing the turns and adding an island or median barrier that disallows left turns in or out of the access point. This improves safety for all road users by providing clarity about their position on the roadway and reduces conflict points. Because this intentionally restricts left-turns, this intersection type is best used for entrances into each Area which are not primary entrances. These intersections create redundancy in the network by providing multiple options for people to choose the best route to their destination. Note the use of roundabout intersections makes it easy for people to exit a right-out only and reverse their direction of travel at the roundabout at the next intersection.
All intersections should consider the following design principles:
• Adequate lighting to ensure both vehicles and pedestrians can see each other,
• No slip lanes should be designed since they increase vehicle speed and reduce safety for pedestrians and bicyclists,
• Daylighting and restricting parking when approaching intersections to ensure visibility of pedestrians and reduce their crossing distances.
• Enhance signage and striping through the use of reflective strips on sign posts, and providing a stop line at all stop controlled intersections.
• Corridor access management should restrict driveways within 250 ft. of intersections.
• Leading pedestrian intervals (LPIs) should be installed if signalized intersections are used on major roads, in order to give pedestrians a head start when crossing the street.
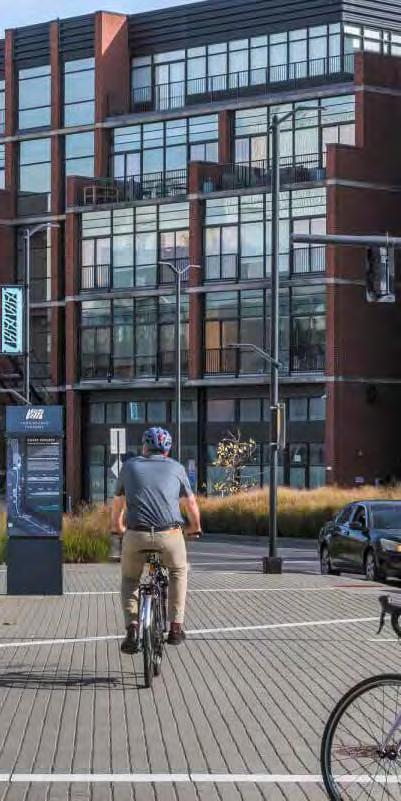

Bicycle and pedestrian transportation with the Areas should be designed for all ages and abilities to ensure that all residents and visitors can safely walk or bike to their destination within and beyond each of the Areas.
Streets should prioritize connections to established neighborhoods to provide safe and direct access the new development through multiple modes of transportation. There are few opportunities for connecting to established neighborhoods, so they should be prioritized during the design process to ensure these opportunities are not lost.
Quality bicycle facilities on our street network provide safe and direct routes for people who are commuting and want the shortest trip to their destination. Greenway trails can supplement those commuting routes by providing shortcuts that are not available through the street network. Or, trails may meander through greenspaces to provide recreational and experiential bicycling and walking opportunities. Both types of bicycle facilities should be designed within each of the Areas. For example, a household may need a route with direct bicycling access to an elementary school in the shortest time possible, but that same household may also desire to have access to a trail so that they could ride their bike for a joy ride. Both types of facilities should be designed within each of the Areas.
The implementation of Complete Streets that provide safe and comfortable bicycle and pedestrian facilities throughout the street network supports all of the goals of the Lexington Area Bicycle & Pedestrian Master Plan, including: enhance connectivity, encourage economic growth, promote equity, improve health, increase safety, and increase mobility.
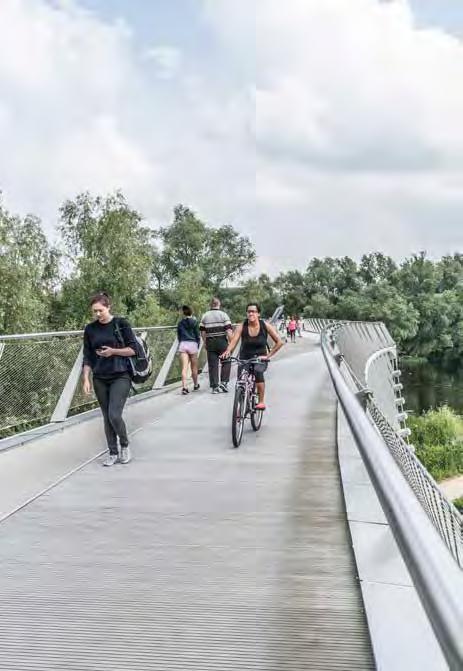
Bicycle/pedestrian infrastructure that is separated from vehicles is more appealing to less experienced bicyclists for recreation and commuting. - The Living Bridge at the University of Limerick [Courtesy of William Murphy].
A significant goal within these areas is for many residents to be able to walk to meet their daily needs (and for their to be enough roof tops nearby to support those businesses). Quality pedestrian infrastructure is therefore a critical component of urban design within these areas, especially related to the success of the town/village centers.
Sidewalks should be constructed on both sides of the road for every road that is built within the Areas, with the exception of alleys. This may be superseded by a shared-use path where appropriate. This ensures that pedestrians have a safe route to walk no matter where their trip starts or ends.
Crosswalks should be highly visible, ladder-style crosswalks to ensure that pedestrians are visible when they cross the street. Where appropriate, curb extensions should be built to reduce crossing distances for pedestrians and tighten turning radii for vehicles. These traffic calming techniques will make the roadway safer for all user types, but especially for vulnerable road users such as pedestrians.
Pedestrian zones will expand much more than the minimum width of a sidewalk along Boulevards or Avenues that are within more commercial land use contexts and within Town and Village Centers. These zones should also encompass a furnishing zone for lighting, benches, bicycle parking, and space for businesses to utilize for outdoor seating, signage, etc. Both pedestrians and businesses thrive where sidewalks are designed at scales that provide enough space for all possible uses, but also keep people walking separated from bicyclists and vehicles.

All streets should be designed so that bicyclists can travel safely. The type of bicycle accommodation varies based on several factors including traffic volumes, traffic speeds, the presence of parking, and the number of intersections and access points. As traffic volumes get higher, more protection should be afforded to the bicyclist. Therefore, the Concept Plans propose routes for shared-use paths and bike lanes to collect bicyclists who are sharing vehicular lanes on neighborhood streets and funnel them towards destinations such as Town Centers and Village Centers, or towards other bicycling trails that can connect people to destinations throughout the city.
• Shared-use paths are transportationfocused trails that supplement other transportation options like bike lanes and shared roadways. They are designed for a variety of non-motorized users, including: bicyclists, pedestrians, in-line skaters, roller skaters, and wheelchair users (NACTO). They should be located on high-volume corridors and where access points are limited; typically along boulevards. Shared-use paths are physically separated from traffic with a minimum width of 6.5 ft. per the Lexington Area Bicycle & Pedestrian Master Plan, and may be separated by open space or a vertical barrier. Shared-use paths should be designed for people who are commuting
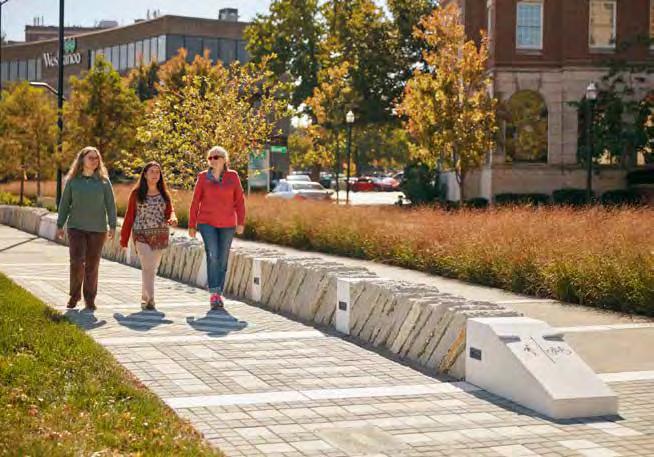
or traveling with purpose; therefore they should be direct, non-circuitous, and complement the roadway network either within the same right-of-way or within an independent rightof-way.
• Greenway trails may be designed primarily for recreational purposes, and therefore are not usually parallel to the roadway. These are for users to experience the outdoors and
may take circuitous routes by following water and land features.
In both cases, particular care must be taken to provide a safe experience for a wide range of people from children to older adults including bicyclists at different skill levels, walkers, runners, skaters, and people with disabilities.
• Bike Lanes are a portion of the roadway that has been designated by striping, signage, and pavement markings for the preferential or exclusive use of bicyclists (NACTO). These are appropriate on boulevards and avenues with moderate traffic volumes and more driveways and access points. Bike lanes share the same right-of-way as motorized vehicles and therefore should always have signage and striping that delineates the space.
• Buffered bike lanes are conventional bicycle lanes paired with a designated buffer space separating the bicycle lane from the adjacent motor vehicle travel lane and/or parking lane (NACTO). These can be more appropriate on corridors with moderate to high volumes but not enough room for a protected bike lane
or shared use path or if there are too many driveways and access points to safely accommodate a shared-use path.
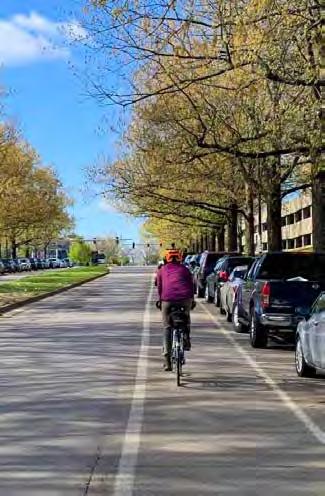
Bike lane on University of Kentucky campus - Lexington, KY (Gresham).
• Protected bike lanes (or cycle tracks) are bikeways that are at street level and use a variety of methods for physical protection from passing traffic. A protected bike lane may be combined with a parking lane or other barrier between the bike lane and the motor vehicle travel lane. When a cycle track is elevated above street level it is called a raised cycle track and different design considerations may apply (NACTO). Suggested barriers include:
• Parked cars, delineated by a striped parking lane
• Raised lanes, either at sidewalk grade or at an intermediate grade
• Raised medians, either landscaped or concrete (image right)
• Planter boxes
• Bollards
• Concrete barrier walls
• Shared Roadways are appropriate on alleys and neighborhood streets where traffic volumes are low and target speeds do not exceed 20MPH. Some avenues may also have low enough traffic volumes to warrant shared roadways.

Operational Considerations
Any of the following: high curbside activity, frequent buses, motor vehicle congestion, or turning conflicts‡
< 10 mph Less relevant
≤ 20 mph
≤ 1,000 – 2,000
≤ 500 – 1,500
≤ 1,500 – 3,000
≤ 25 mph
No centerline, or single lane one-way
Pedestrians share the roadway Shared Street
< 50 motor vehicles per hour in the peak direction at peak hour Bicycle Boulevard
Greater than 26 mph†
Single lane each direction, or single lane one-way
Conventional or Buffered Bicycle Lane, or Protected Bicycle Lane
≤ 3,000 – 6,000 Buffered or Protected
Low curbside activity, or low congestion pressure
Greater than 6,000 Protected Bicycle Lane Any
Multiple lanes per direction
Single lane each direction
≤ 6,000
Greater than 6,000
High-speed limited access roadways, natural corridors, or geographic edge conditions with limited conflicts
Low curbside activity, or low congestion pressure Protected Bicycle Lane, or Reduce Speed
Multiple lanes per direction Protected Bicycle Lane, or Reduce to Single Lane & Reduce Speed
High pedestrian volume
Low pedestrian volume
Bike Path with Separate Walkway or Protected Bicycle Lane
Shared-Use Path or Protected Bicycle Lane

Diagram of Bike Lane with a Raised Median separating it from vehicular traffic, Source: FHWA Separated Bike Lane Planning and Design Guide

RF-11 Sign – Bikes May Use Full Lane. Source: FHWA Separated Bike Lane Planning and Design Guide
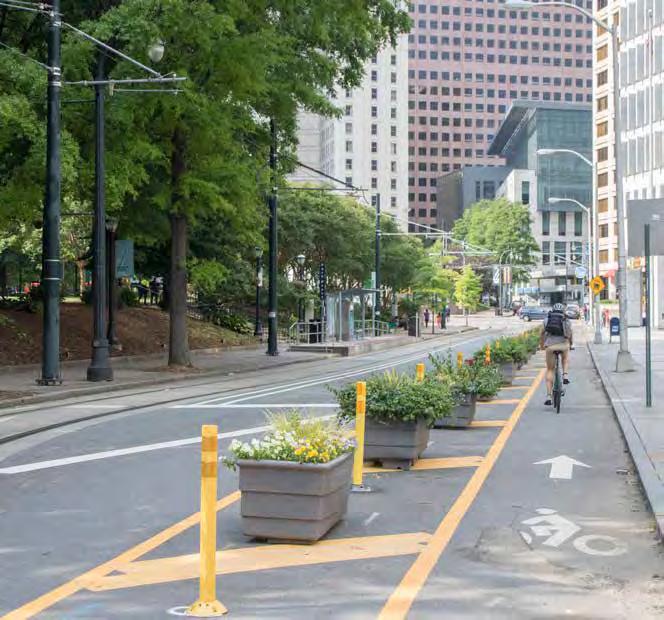
The Areas are designed to accommodate future transit service with fixed bus routes, and to provide space for microtransit services to drop off and pick up passengers on demand. The Concept Plans propose fixed routes on corridors that serve Town Centers and Village Centers to keep the routes efficient and headways short. To ensure that all residents and visitors to the areas have access to transit stops, they shall be located on the bicycle network, and preferably adjacent to bike lanes, buffered bike lanes, shared-use paths, or trails that enable access for people of all ages and abilities.
• Transit routes may be extended from existing Lextran routes or new routes could be implemented to provide service to each of the Areas. Fixed bus routes should be located along Minor or Major Collectors, such as Boulevards or Avenues. To maximize efficiency, inbound or outbound routes may skip entering into the Areas and only provide access on the arterials that border each Area. If the route enters the Area, these corridors may have bus turnouts where the bus can pull out of the flow of traffic to pick up and drop off passengers. Buses should be a consideration when designing intersection treatments such as
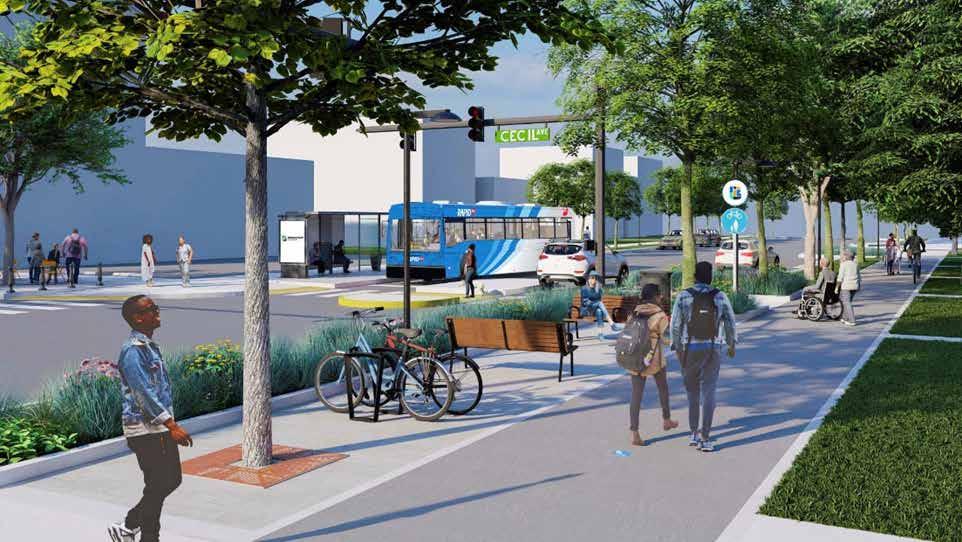
roundabouts and RCUTs. Intersection treatments such as mountable aprons should be considered to accommodate large vehicles such as buses and encouraging slower turning speeds for smaller, personal vehicles to improve safety for all modes of transportation.
• Transit stops are not necessarily set at specific intervals, but should be strategically located at areas with high ridership potential, including: schools, community services, parks,
trailheads, commercial areas, and major employers such as Blue Sky. In primarily low-density residential areas located off of direct transit routes, transit stops will be accessible via bicycle and pedestrian facilities. Transit stops should be designed with pedestrian-scaled lighting, provide sufficient shelter from sun and rain, and include other amenities such as benches and trash receptacles.
For fixed bus routes, existing Lextran routes could be extended, or new routes could be implemented if deemed appropriate. These routes should be evaluated for extension to the Areas as they are developed:
• Area 1:
• Route 8 – Versailles Road
• Route 13 – South Broadway
• Route 58 – Night – Versailles Road
• Area 2:
• Route 7 – North Limestone
• Route 10 – Hamburg Pavilion
• Route 17 – Northside Connector
• Areas 3, 4, and 5:
• Route 1 – Woodhill Drive
• Route 11 – Richmond Road
• Route 18 – Centre Parkway Connector
• Route 51 – Night – Woodhill Drive
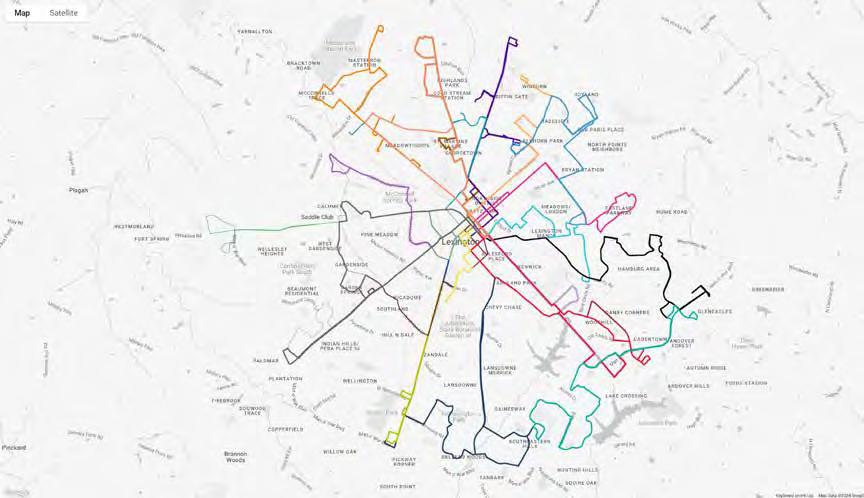
Potential route alignments through each area are shown on the following page. The diagrams include recommendations for key stops and which routes make the most sense to connect to these areas.
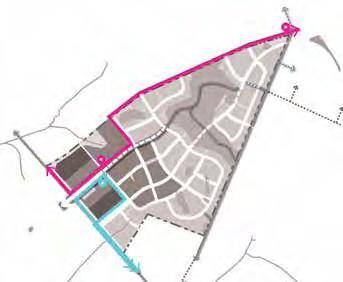
Extension of Lextran
Route 8 - Versailles Road
Extension of Lextran
Route 13 - South Broadway, or
Route 58 - Night Versailles Rd
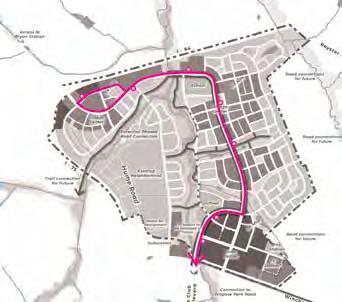
Extension of Lextran
Route 7 - North Limestone, or
Route 10 - Hamburg Pavilion
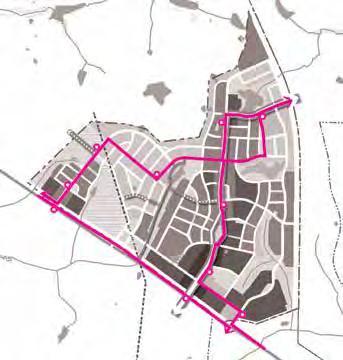
Extension of Lextran
Route 1 - Woodhill Drive, Route 11 - Richmond Road, Route 18 - Centre Parkway Connector, or
Route 51 - Night Woodhill Drive
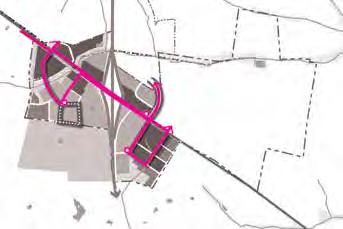
Extension of Lextran
Route 1 - Woodhill Drive, Route 11 - Richmond Road, Route 18 - Centre Parkway Connector, or
Route 51 - Night Woodhill Drive
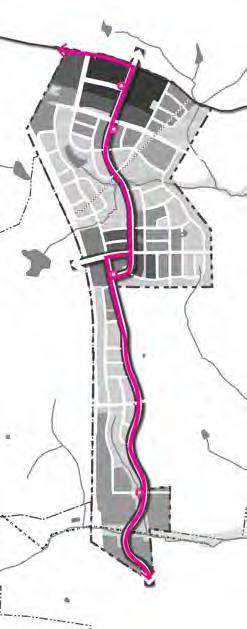
Extension of Lextran
Route 1 - Woodhill Drive, Route 11 - Richmond Road,
Route 18 - Centre Parkway Connector, or
Route 51 - Night Woodhill Drive

This document contains recommendations that support the implementation of the 2024 UGMP (UGMP). These recommendations were identified by reviewing the UGMP and identifying potential implementing standards that were:
■ Quantifiable at the scale of the Concept Plans (e.g., setbacks, density; open space); or
■ Not quantifiable at the scale of the Concept Plans, but which would support the UGMP’s vision and align with best practices.
The recommendations are divided into two main types:
■ Development Criteria, which offer guidance for the City of Lexington when reviewing rezoning applications; and
■ Proposed Implementing Regulations, which suggest updates to the City’s Zoning Ordinance and related regulations.
Both types of recommendations are further categorized by priority:
■ Primary Recommendations, which are essential to the UGMP and directly linked to its implementation; and
■ Supporting Recommendations, which could support the UGMP but may have broader, citywide impacts that must be evaluated.
The recommendations within this Master Plan address Lexington’s need for housing to support the Urban County’s growing population through walkable and sustainable development. Whereas not all development criteria included in this section will be achievable or applicable in every situation, they are meant to provide a guide for new development within the identified areas.
i. Developments should incorporate the following in the locations shown in the Regulating Plans:
a. Village center land uses (see Sec. 1C)
b. Town center land uses (see Sec. 1C)
c. Boulevards, avenues, trails, and shared-use paths (see Sec. 3A)
d. Future road connections (see Sec. 3C)
ii. Developments should incorporate the following in proportion to their area shown in the Regulating Plans:
a. Low density land uses
b. Medium density land uses
c. High density land uses
Any of the above may be converted to a denser land use, except flex space.
i. Rezone sites to multiple existing zoning districts that closely reflect the UGMP land uses.
ii. Where the UGMP land uses are more restrictive than an existing zoning district, the UGMP land use standards apply.
Developments should contain land uses in accordance with the listed standards in Chapter 5 - Land Use & Transportation Regulating Plans:
i. Village centers. A village center may be adjusted from the location shown in a Regulating Plan, provided it is still at least 10 acres in size and:
a. Contains or abuts a boulevard, avenue, or existing arterial; or
b. Is within one quarter-mile of the center of a public park that is at least 3,000 square feet in area (measured in a straight line) and immediately abutting a boulevard.
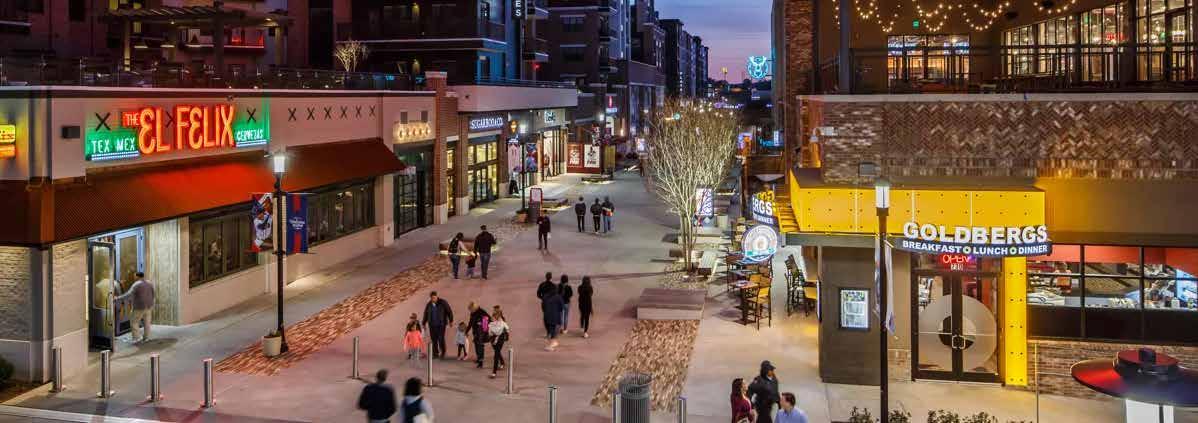
Where development is adjacent to an active farming operation of 40 acres or greater in the Rural Service area, a buffer of 100 feet should be maintained, subject to the following:
i. The buffer depth should be measured parallel to the edge of the Rural Service Area.
ii. No principal or accessory building, parking, signage, or driveways should occupy the buffer.
iii. Streets, shared-use paths, and vegetated open space should be allowed in the buffer.
iv. If the buffer is used to meet open space requirements, it should remain open space unless its loss would not render the development nonconforming with regard to open space requirements.
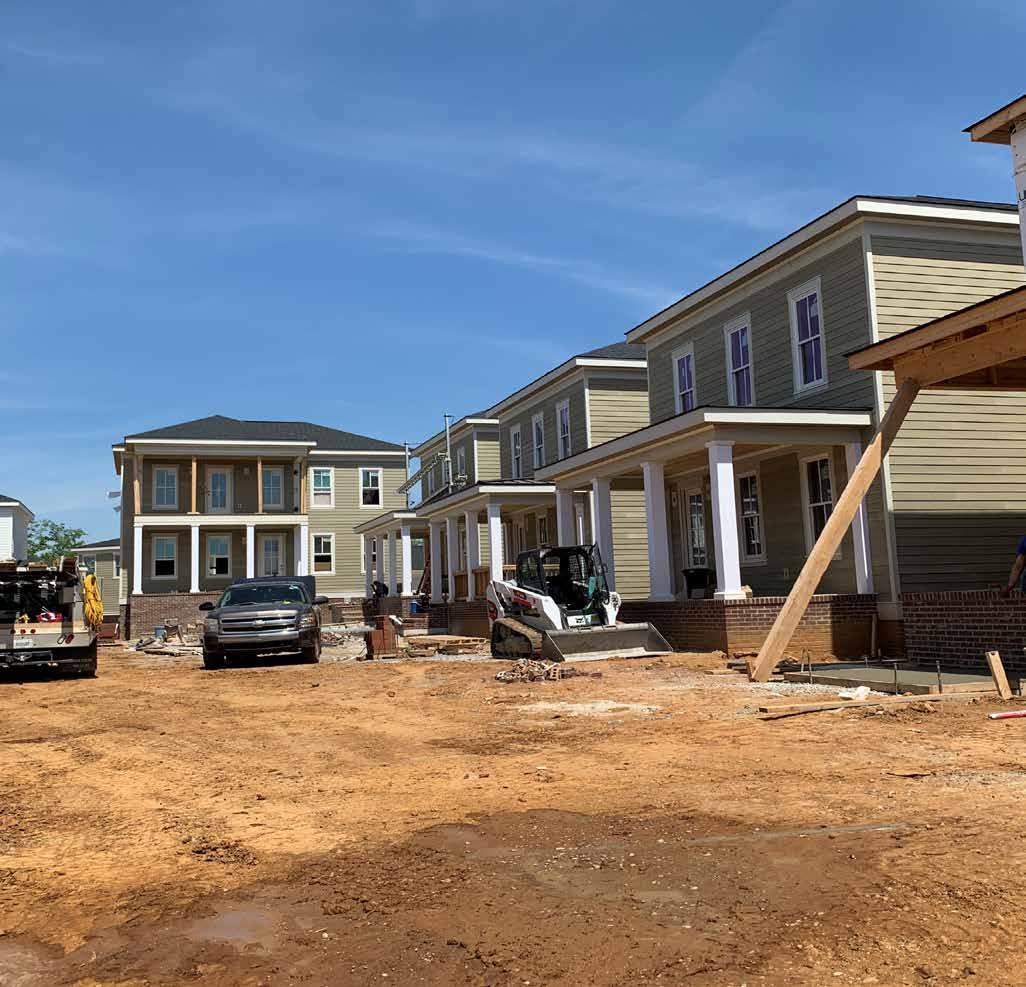
The following should apply within a given village or town center and all areas within one-quarter mile of it (measured in a straight line):
i. No more than 20% of the total number of proposed singlefamily detached dwelling units should be issued a certificate of occupancy until at least 4,000 square feet of commercial floor area has been issued a certificate of occupancy.
ii. No more than 80,000 square feet of commercial floor area should be issued a certificate of occupancy until at least 50% of the proposed number of dwelling units have been issued a certificate of occupancy.
“Retail-ready” and the ground story of live-work units should be considered “commercial” for concurrency purposes. See Sec. 5A. for the definition of “retail-ready.”
i. Codify concurrency standards.
ii. Include definition of “retail-ready” as specified in Sec. 5A, in the Zoning Ordinance.
The following are intended to provide a distributed mix of dwelling types that serve diverse housing needs:
i. Dwelling distribution. No more than five contiguous lots with frontage along the same street should contain singlefamily detached dwellings.
ii. Large-lot single-family limits. No more than 20% of singlefamily detached dwelling lots should exceed 5,000 square feet in size. Overall residential density standards for the development should still apply.
iii. Dwelling concurrency. Where there is a mixture of dwelling types, no more than 25% of single family detached dwellings should be constructed before the construction of other housing types.
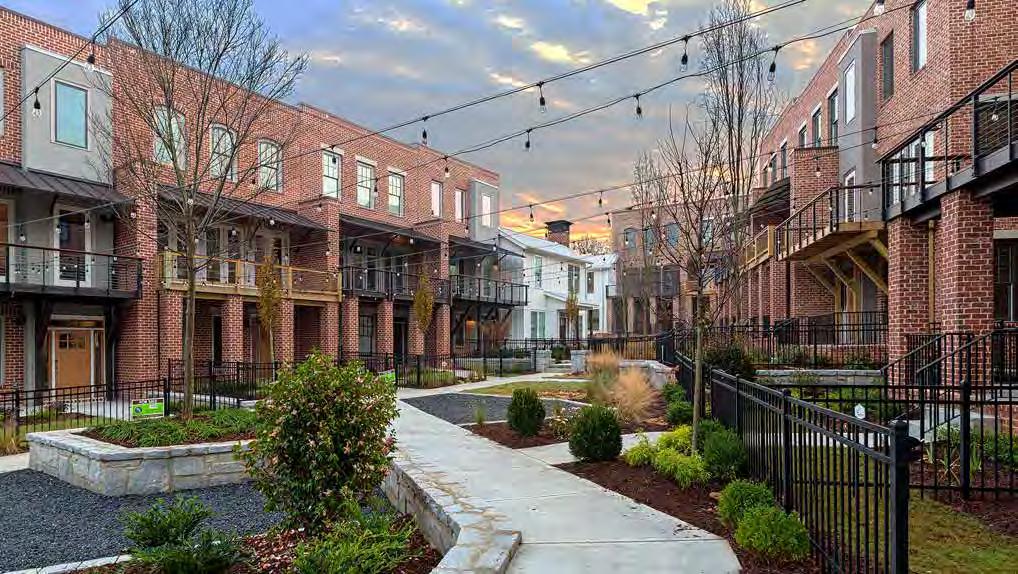
Codify residential mix standards in the Zoning Ordinance.
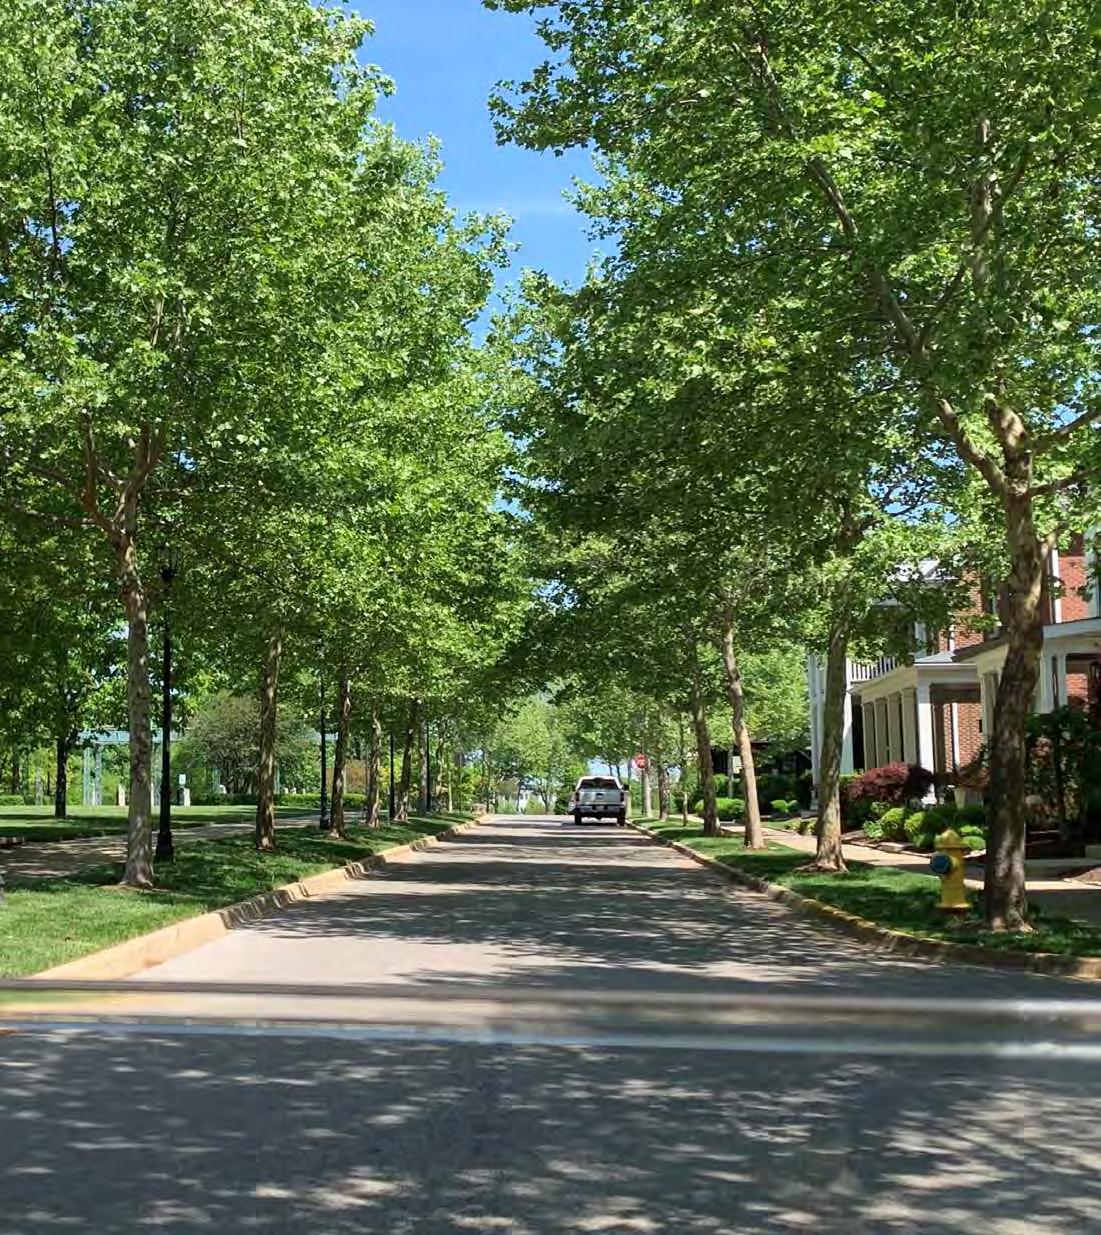
i. Block network. Blocks should interconnect and be arranged to support multiple route options for people walking, biking, and driving.
ii. Block sizes. Blocks should be sized to encourage walkability and should not exceed the maximum block perimeters for the specified land use (measured at the street centerline). See Sec. 1B.
iii. Ownership. Public and private streets may be used to satisfy this provided private streets are built to public standards with streetscape on both sides.
iv. Gated streets. Streets used to satisfy block size standards should not be gated.
v. Cul-de-sacs. Cul-de-sac streets should not exceed 250 feet in length (measured from the centerline of the intersecting street to the furthest point of the cul-de-sac or dead-end street along the vehicular path of travel).
Codify block standards in the Zoning Ordinance and/or Land Subdivision Regulations, as applicable.
Developments should provide street connections to adjacent sites in order to create an interconnected block network, as follows:
i. Along the Rural Service Area. One or more stub streets should be constructed up to the boundary of the Rural Service Area. A stub street should not be more than 1,500 feet (measured along the Rural Service Area boundary) from another stub street, except that, when the land along the boundary is used for industrial & production uses, the distance between stub streets should not exceed 3,000 feet.
ii. To existing stub streets. Developments that abut an existing stub street should construct an extension of the stub street and incorporate it into a practical and logical part of its circulation network.
iii. All other situations. Along property lines where “i” or “ii” above does not apply, one or more stub streets should be constructed up to the boundary of the adjacent site. A stub street should not be more than 750 feet from another stub street.
iv. Exceptions. Stub street standards should not apply to property along an exterior street.
Codify development connectivity standards in the Zoning Ordinance and/or Land Subdivision Regulations, as applicable.

Development Criteria
Connections to existing, required, or proposed shared-use paths should be provided as follows:
i. Along shared-use paths. When a development contains or abuts a shared-use path (whether existing, required, or proposed), at least one non-vehicular connection should be provided for every 1,300 feet of path length. Connections to shared use paths should be constructed to the standards defined in the Complete Streets Manual.
The connection should have a right-of-way at least 30 feet wide or easement with a 10' wide shared-use path.
Codify shared-use path connectivity standards in the Zoning Ordinance and/or Land Subdivision Regulations, as applicable.

Development Criteria
i. Shared driveways. Driveways should be shared by adjacent lots.
ii. Inter-parcel access. Lots with 10 or more parking spaces should provide at least one vehicular access connection to each abutting lot. Alleys may be used to satisfy this standard.
iii. Exceptions. Inter-parcel access requirements may be reduced or eliminated when:
a. The adjacent lot is developed and contains fewer than 10 parking spaces.
b. The adjacent lot is undeveloped and will be developed for single-family or townhouse dwellings.
c. Land that would otherwise be developed includes environmentally sensitive areas or steep slopes over 15%, such that vehicular access construction would disrupt the environmentally sensitive area and/or be impractical to build.
Codify shared-use path connectivity standards in the Zoning Ordinance and/or Land Subdivision Regulations, as applicable.
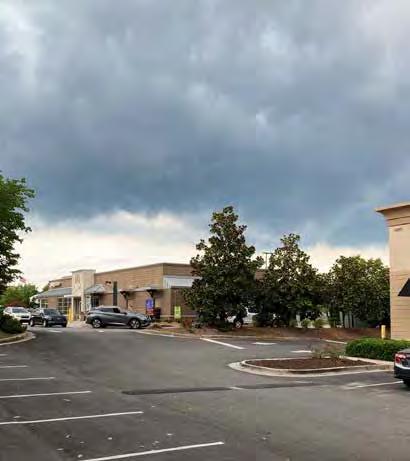
Developments should incorporate alleys in order to reduce pedestrian-vehicular conflicts, support walking, reduce the number of curb cuts, and reduce the aesthetic and traffic operational impacts of vehicular areas, as follows:
i. Residential alleys. Single-family and townhouse dwellings should not have vehicular access directly from or across an arterial, collector, boulevard, or shared-use path right-of-way, unless from an alley that is shared by multiple lots.
ii. Village and town centers. Vehicular access should only be from alleys in village and town center land uses.
iii. Garage location. Garages should only be located in rear yards.
i. Codify alley standards in the Zoning Ordinance and/or Land Subdivision Regulations, as applicable.
ii. Amend the Zoning Ordinance’s definition of “alley” by removing the last sentence – thereby allowing them by-right by removing the requirement for special permission from the commission.
iii. Amend Sec. 15-6(a)(2) of the Zoning Ordinance to remove the rear yard minimum required setback from alleys that are at least 20 feet wide.
Bicycle facilities and bicycle parking should be integrated into the design of a site, with practical organization, ease of access, and priority given to pedestrians and bicyclists, as follows:
i. Along shared-use paths. Non-residential lots fully or partially within 300 feet of a shared-use path should provide bicycle parking that is visible and accessible from the shared-use path.
ii. Minimum bicycle parking. In addition to the current minimum bike parking requirements, at least one bicycle parking space per 1,000 square feet of floor area should be provided for principal uses, subject to the following:
a. Bicycle parking is not required for single-family dwellings.
b. When more than 20 bicycle parking spaces are recommended, at least 25% of the spaces provided after the 20th space (rounded up to the nearest whole number of spaces) should be shaded and/or covered.
c. Bicycle parking spaces inside buildings should count as covered bicycle parking.
d. All bicycle parking spaces should be accessible from streets or shared-use paths without the use of steps.
Codify bicycle parking and storage standards in the Zoning Ordinance.
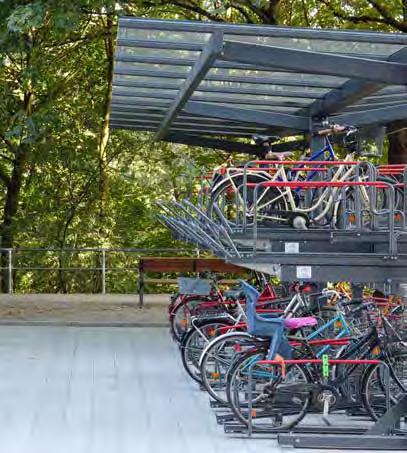
Loading and unloading areas should be provided as follows:
i. On-street loading. Required off-street loading spaces may be satisfied in part or in full by:
a. Permanent on-street loading spaces within 300 feet of the lot.
b. Temporary on-street loading spaces within 300 feet of the lot, such as on-street parking spaces marked with signage restricting their use to loading/unloading at certain times.
ii. Location. Off-street loading spaces may not be in a front yard.
iii. Screening. Off-street loading spaces in a side yard should be screened from view from front lot lines.
i. Codify loading and unloading standards in the Zoning Ordinance.
ii. Amend the citywide requirements as follows:
i. General. Street trees should be planted along existing and new streets.
ii. Placement. Street trees should be located between the street and the sidewalks.
Once the Complete Streets Manual is finished, codify street trees standards in the Zoning Ordinance and/or Land Subdivision Regulations, as applicable.

90% of all dwelling units should be within a walking distance of 1,500 feet of a park or open space (measured along continuous sidewalks and/or shared-use paths from the closest pedestrian entrance of the residential building to the closest lot line of the park or open space).
PROXIMITY
Codify proximity to dwelling unit standards in the Zoning Ordinance.
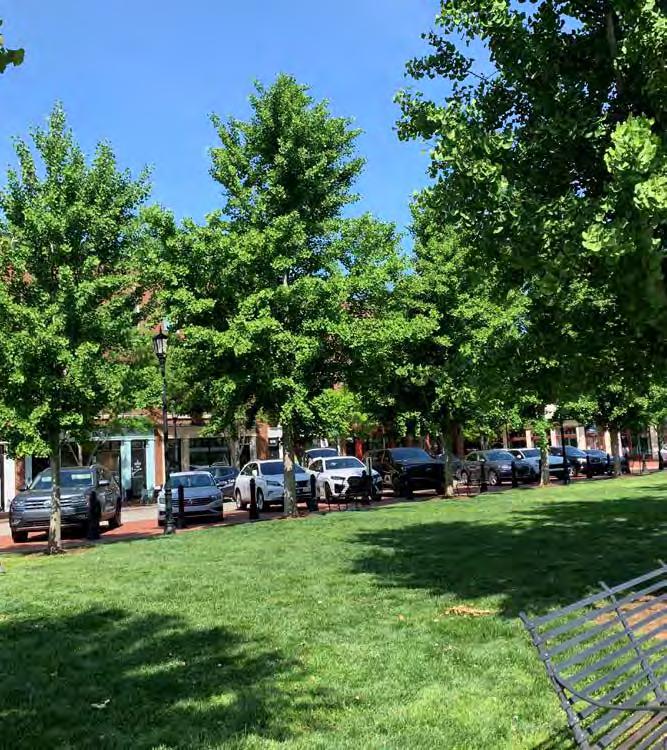
Buildings in village or town centers, or along boulevards, avenues, and collector streets, should provide active depths, subject to the following:
i. Applicability. Active depth requirements should apply as follows:
a. Active depth standards should apply to the portions of a building along a street.
b. On boulevards and avenues, active depth should apply to all stories of a building.
c. Single-family and townhouse dwellings do not have to meet active depth requirements.
d. Industrial uses do not have to meet active depth requirements.
ii. Standards. Buildings should meet all the following active depth requirements:
a. Applicable portions of a building should provide an active depth of at least 20 feet, unless otherwise specified for the use or zoning district.
b. No more than 20% of the floor area of the required active depth should be used for inactive spaces such as storage, hallways, stairwells, elevators, and equipment rooms.
c. Vehicle parking, loading docks, drop-off zones, and other vehicular uses should not occupy the active depth. This should not apply to approved driveways passing perpendicular through the active depth.
i. Codify active depth standards in the Zoning Ordinance.
ii. Amend the Zoning Ordinance to add the following definitions:
Active depth. The horizontal depth of a building that must contain active spaces.
Active spaces. The use of interior spaces with consistent human activity that can be viewed from the exterior of the building through windows, creating engagement and drawing attention from the street. Unlike data centers, self-storage units, and similar types of spaces, active spaces involve frequent human interaction, enhancing the vibrancy of an area.
Retail-ready. A ground story active depth that is built to accommodate retail, but may be used for residential uses until retail uses are viable and has all the following features:
a. At least 14 feet floor-to-ceiling height;
b. At least 65% transparency (via the use of glass) along street-facing elevation;
c. A pedestrian door that faces the sidewalk and is wheelchair accessible; and
d. A pathway between the sidewalk and the sidewalk-facing door’s threshold that does not have any steps and is wheelchair accessible.
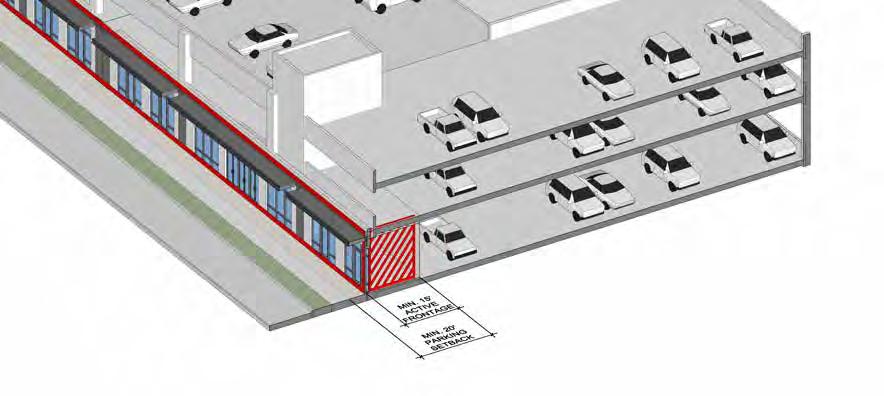
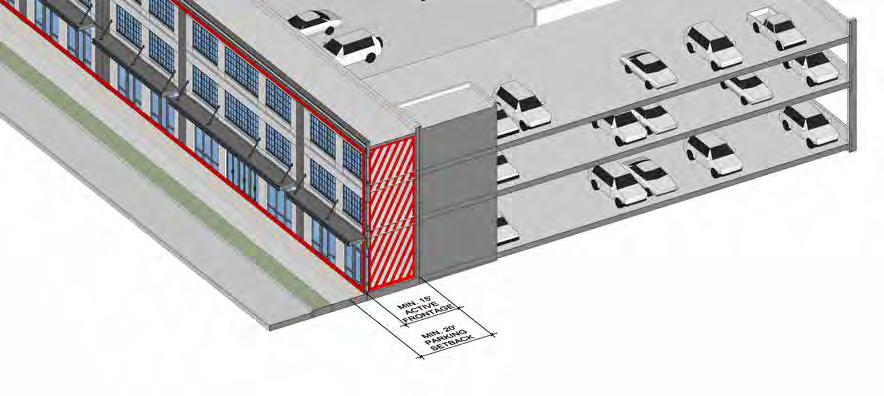
Within the UGMP area, specified uses should be restricted as follows:
i. Except in industrial districts, computer and data processing centers should be restricted as specified in iii., below. See also Sec. 7A.
ii. Except in industrial districts, commercial self-storage uses should be restricted as specified in iii., below. See also Sec. 7B.
iii. Computer and data processing centers and commercial selfstorage uses should meet the following requirements:
a. No more than 50% of the total floor area in a development should be used for any combination of computer and data processing centers and commercial self-storage.
b. Active depth should be provided along all abutting streets.
c. No certificate of occupancy for computer and data processing centers and/or commercial self-storage should be issued until such time as a certificate of occupancy has been issued for all required active depth in the associated building.
d. No certificate of occupancy for computer and data processing centers or commercial self-storage should be issued until such time as a certificate of occupancy has been issued for an equal or greater floor area of any other permitted use.
Codify the use restrictions in the Zoning Ordinance.
None
Amend the Zoning Ordinance to limit data center noise as follows:
Noise-making devices, noise-amplifying devices, and noise-producing devices in any public or private place may not be operated at or louder than 65 dBA from 9:00pm to 7:00am on weekdays and 9:00pm to 9:00am on weekends where sounds at such levels may be detected offpremises. No such device may be operated at or louder than 75 dBA at all other times.
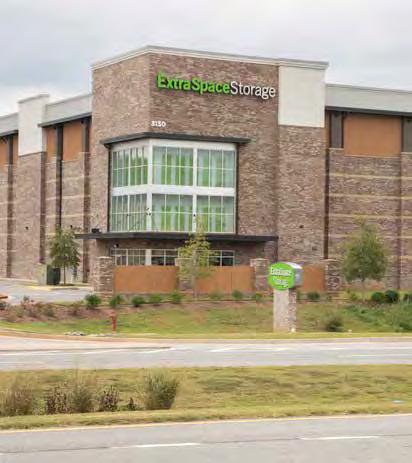
i. Amend the Zoning Ordinance to require active depth for commercial self-storage, except in industrial district, as follows: A certificate of occupancy for a commercial self-storage facility may not be issued before issuance of a certificate of occupancy for all required active depth spaces of the associated building(s) on the associated lot(s).
ii. Amend the Zoning Ordinance to distinguish the existing definition of “wholesale establishment with warehouse” from the recommended definition of “commercial self-storage” by adding, “This use is defined separately from, and does not include commercial self-storage.”
iii. Amend the Zoning Ordinance to add the following definition:
Commercial self-storage. A warehouse and distribution use that offers secure self-storage in individual rooms, compartments, lockers, or containers, to which clients bring goods for storage and retrieve them at any time during normal business hours. Such storage spaces are rented to the general public for storing non-hazardous personal property of household goods and are not utilized for general commercial inventory.
None

i. Amend the Zoning Ordinance to add the following definitions:
Micro-distribution hub. An independent warehouse and distribution use up to 10,000 square feet in floor area providing the receipt, transfer, shortterm storage, and dispatching of retail merchandise and similar goods. The term does not include retail establishments that transfer or dispatch retail merchandise to other retail establishments.
Low-impact manufacturing. An industrial and manufacturing use up to 10,000 square feet in floor area where some or all of the following characteristics are present or anticipated:
a. All manufacturing or industrial activity takes place indoors;
b. No significant heat, noise, sounds, vibrations, odors, or particulates detectable off premises; and
c. No outdoor storage unless fully screened from the street and adjacent lots.
Hand tools. Those tools which are manipulated by hand to shape, assemble, or otherwise mechanically alter products. Such tools may or may not include powered or battery-operated components.
ii. Amend the Zoning Ordinance to allow micro-distribution hubs, subject to the following:
c. Research and development uses may be permitted in nonresidential zones INNOVATION USES, CONT.
a. Micro-distribution hubs are allowed in industrial zones.
b. Micro-distribution hubs are allowed in business zones if active depth requirements are met.
c. Micro-distribution hubs may occupy a required active depth if:
1. At least 10% of the floor area is designated for walk-in customers; and
2. The interior customer area extends at least 20 feet from the building elevation that is subject to an active depth requirement; and
3. Customers can conduct a transaction within such active depth, including, but not limited to, picking up previously ordered merchandise, returning previously purchased merchandise, or purchasing merchandise.
iii. Adjust use permissions in the Zoning Ordinance as follows:
a. Low-impact manufacturing is allowed in industrial, business, and mixed-use zones if active depth requirements are met.
b. Artisan manufacturing may be permitted in non-residential zones and may be permitted as a home occupation subject to all restrictions therein.
None
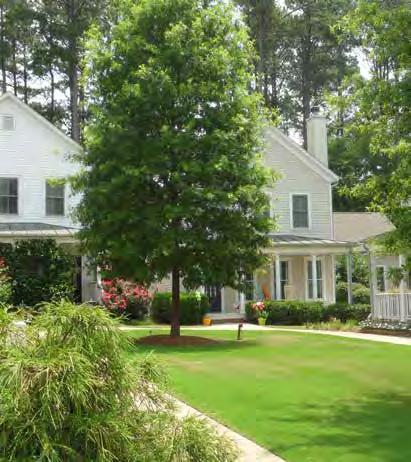
Amend Sec. 6-4(c) of the Land Subdivision Regulations as follows: All lots shall abut an approved street, approved cottage housing shared open space, or approved shared-use path for at least the minimum frontage requirement for the zone in which the lot is located. Frontage shall be measure at the street right-of-way line, except that in nonagricultural zones, in cases where curbed streets or cul-de-sac radii are involved, the measurement shall be taken at the building line as set forth for the zone in which the lot is located; or if more restrictive, as set forth on the subdivision plan. All lots shall be designed so as to provide safe and convenient vehicular and pedestrian access to the street. Where vehicular access is not required or not proposed to be provided, clear pedestrian access that is at least 5 feet wide from the approved street, approved cottage housing shared open space, or approved shareduse path must be provided between the frontage and the principal building(s).
i. Amend Sec. 6-4(b), 6-4(c), 6-4(d), and 6-4(e) of the Land Subdivision Regulations so the standards may be waived if a proposed major subdivision meets the approved design of a development plan. In such a waiver, the commission must make the following findings, as applicable to the request:
a. A waiver from Sec. 6-4(b) Lot Shape may be granted if the commission finds that the proposed lot shape and proportions are consistent with the overall design of the development plan and do not create lots that are impractical to develop with a principal building. The commission must further find that the proposed lot depth, even if exceeding the standard proportion, will not adversely affect the usability of the lot.
b. A waiver from Sec. 6-4(c) Lot Frontage and Access may be granted if the commission finds that safe and convenient pedestrian access is provided. Where vehicular access is required or proposed, the commission must further find that safe and convenient vehicular access is provided. The commission must further find that the design of lots and associated pedestrian and/or vehicular access do not compromise the safety or functionality of the circulation network within and along the boundaries of the subdivision.
c. A waiver from Sec. 6-4(d) Lot Lines may be granted if the commission finds that the proposed lot lines, even if not at right angles or radial to the street centerline, are necessary to achieve design goals such as maximizing solar energy potential
or aligning with topographical features. The commission must further find that the proposed lot lines do not create undue hardship in terms of lot usability and are consistent with the design intent of the development plan.
d. A waiver from Sec. 6-4(e) Lot Area and Minimum Building Setback Line may be granted if the commission finds that the proposed lot area and building setback lines meet the overall intent of the Zoning Ordinance and any applicable development criteria of the Lexington Place Builder. The commission must further find that the proposed lots provide adequate space for development of principal buildings and associated access pathways.
ii. Amend the Zoning Ordinance to add the following to the development plan approval process:
The approval of a development plan that requires a major subdivision may be subject to a waiver review per [insert the locations codified in “i” above] of the Land Subdivision Regulations.
CORNER STORES IN RESIDENTIAL DISTRICTS
None
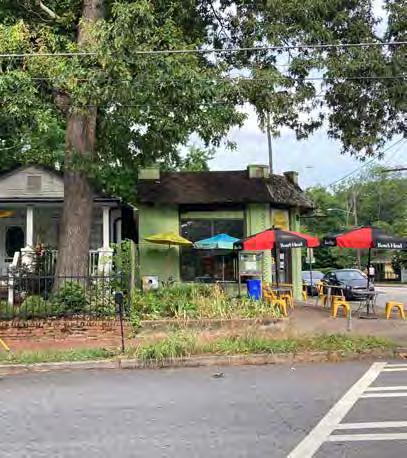
Explore amending the Zoning Ordinance to allow B-1, or similar uses in the R-2, R-3, and R-4 zones when the following conditions are met:
i. The use is on or adjacent to a corner lot;
ii. Non-residential uses are limited to 2,000 square feet in total floor area per lot;
iii. Building height is limited to 3 stories or 40 feet (whichever is less);
iv. Buildings have a street-facing setback of no more than 15 feet, with such setback applying to at least 70% of the width of any street-facing elevations; and
v. Side and rear setbacks match the required setbacks of adjacent residential lots.
CORRIDOR NODE (CN) ZONE None
Explore amending the Corridor Node (CN) Zone district as follows:
i. Accessory outdoor sales and storage. Allow up to 1,000 square feet of accessory outdoor sales and storage on each lot, subject to all applicable setback and screening requirements.
ii. Garden center and commercial greenhouse. Allow garden center and commercial greenhouse uses with outdoor sales and storage areas up to 3,000 square feet in size.
iii. Minimum floor area ratio. Reduce the minimum required Floor Area Ratio from 2.0 to 0.75 for lots that include non-residential uses.
iv. FAR bonus for sustainable design. Revise the FAR bonus for sustainable design to read as follows: A bonus 0.25 additional FAR may be granted per building that may be LEED Certified. A bonus of .50 additional FAR may be granted per building that may be certified LEED Silver. A bonus of .75 additional FAR may be granted per building that may be certified LEED Gold. A bonus of 1.0 additional FAR may be granted per building that may be certified LEED platinum. To qualify for this bonus, a LEED certification review report must be submitted before zoning approval that demonstrates how the project meets the applicable LEED standards.
Following the adoption of the UGMP, the City should seek to develop an infrastructure funding plan (IFP) and financial program that will guide the establishment of necessary infrastructure to serve Areas 1 through 5. Greater detail regarding the need for such a program is described in Chapter 7, however the formulation and administration of such a program necessitates greater review. Additionally, the process outcome from an IFP would then include the specific engineering and design for the physical infrastructure for each of the areas. The IFP, fee development or funding resource review, and the engineering and design of infrastructure should be considered starting in 2025.
To support the development of the areas described in the UGMP (UGMP), an Infrastructure Coordination Team should be established and included early in the pre-development process. The Infrastructure Coordination Team will work with developers of Areas 1 through 5 to ensure the infrastructure needs of new developments outlined in the UGMP are constructed. Designed to facilitate development, the team will meet
regularly to identify infrastructure needs and costs at a project level to ensure that future development proposals address the criteria identified in the UGMP. This group will connect developers with representatives from divisions and departments within the LFUCG, including Finance, Public Works, Parks, Housing, and Planning. The Infrastructure Coordination Team would integrate with an IFP as identified above.
To ensure adequate parkland is properly dedicated and parks are constructed to meet the needs of the residents and users of the urban Growth Areas, it is recommended that Lexington pursue the adoption of a Park Dedication Ordinance (PDO), as well as other financial mechanisms for the establishment of parks, like an impact fee. Such ordinances and financial mechanisms ensure that new development contributes its proportionate share toward maintaining existing levels of service and are limited to the acquisition and capital improvement of parks and are not used for operations or maintenance.

Woodland Park - Lexington, KY
In December 2022, the Lexington-Fayette Urban County Government (LFUCG) adopted a Complete Streets Policy that commits LFUCG to plan, design, build and maintain a more sustainable and accessible multi-modal transportation system that comfortably and safely accommodates users of all ages, abilities and modes of transportation. The Policy directs the city to use best-practice Complete Streets design principles and standards when reconstructing streets, building new streets, and maintaining existing streets.
The Complete Streets Design Manual will update and better integrate existing LFUCG street design standards including the LFUCG Roadway Manual, Subdivision Regulations, and Neighborhood Traffic Management Program Guide to create a comprehensive Design Manual with standards that align with current Complete Streets best-practices.
The adoption of a Vision Zero Policy for Lexington is also anticipated in the near future. Thus, the Manual will incorporate proven safety countermeasures and safety-based design approaches to reduce fatal and serious injury crashes. The goal to achieve Universal Design and to make bicycling, walking, and public transit a desirable way to travel for people
of all ages and abilities is also prominent within LFUCG’s Complete Streets Policy and Lexington’s Comprehensive Plan. Thus, the Manual will include guidelines and standards that will help accomplish these community goals.
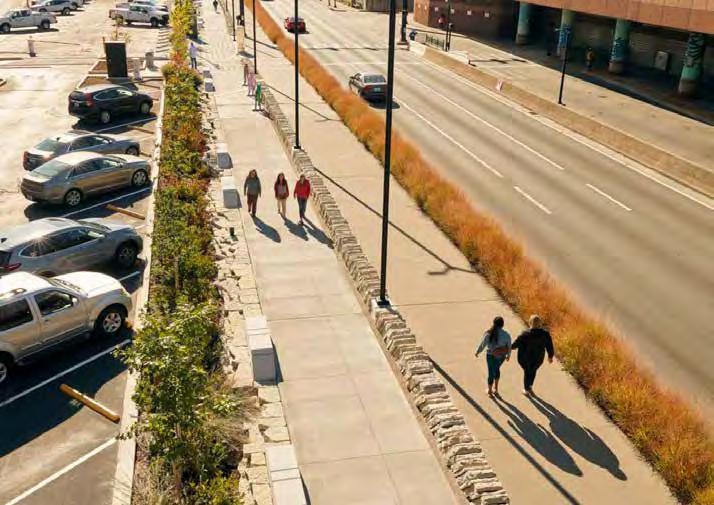

Coordinate with the Division of Water Quality for the needed sanitary sewer facilities.
Conduct geotechnical review regarding extent of sinkholes and other environmentally sensitive areas.
Major intersection design and traffic control study of access onto Man O' War and Parkers Mill.
Initiate the engineering design phase for the Parkers Mill roadway modernization project identified in the Metropolitan Transportation Plan. The construction timeline is estimated between 2030 and 2035.
Conduct an engineering design phase to redesign the intersection of Man O' War and Parkers Mill as a roundabout or other innovative intersection design. Timeline is mid term and should coordinate with the proposed Parkers Mill improvements.
Potential transit routes should be evaluated by Lextran for extension to the Areas as they are developed.
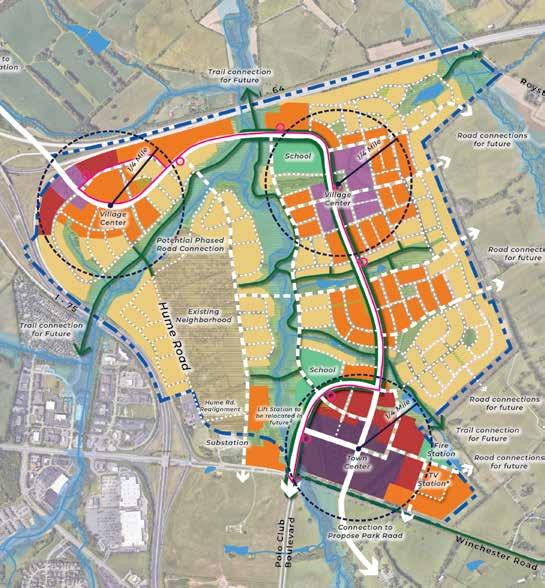
Coordinate with the Division of Water Quality for the needed sanitary sewer facilities.
Immediate coordination with KYTC District 7 for funded project currently under design for Winchester Road improvements, particularly at Hume Road. Ensure that future access points and intersection treatments are considered and designed for future urbanization including multimodal safety and appropriate speeds
Conduct future study to review bicycle/pedestrian connectivity under I-75 and I-64 along proposed trail section connecting Hume Road and the nearby floodplain to Elkhorn Road or Call Drive.
If the existing neighborhood portion of Hume Road seeks to redevelop in the future, coordinate the realignment of the northern section of the road.
Consider safety upgrades on rights-of-way north of the I-64 overpass at Bryan Station and Hume Road to address traffic and safety concerns if additional traffic loaded onto the current road.
Potential transit routes should be evaluated by Lextran for extension to the Areas as they are developed.
Evaluate feasibility of potential transit circulator route connecting areas 2, 3, 4 and 5. Timeframe may vary between mid and long term depending on how quickly these expansion areas develop.
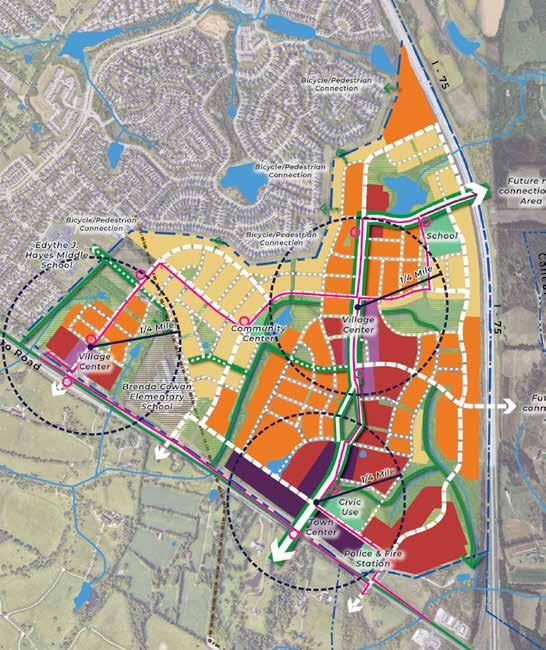
Coordinate with KYTC District 7 to ensure urban complete street roadway improvements along Athens Boonesborough Rd and coordinate access points and intersections for future development.
Coordinate with the MPO and KYTC District 7 to conduct a feasibility study on the best potential connections between Areas 3 and 4 across I-75.
Potential transit routes should be evaluated by Lextran for extension to the Areas as they are developed.
Evaluate feasibility of potential transit circulator route connecting areas 2, 3, 4 and 5. Timeframe may vary between mid and long term depending on how quickly these expansion areas develop.
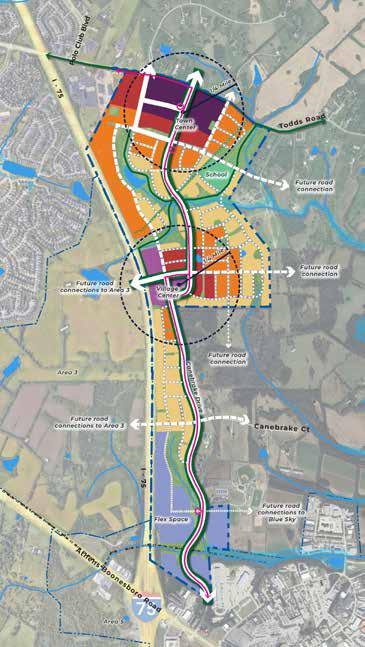
Coordinate with KYTC District 7 to ensure urban complete street roadway improvements along Athens Boonesborough Rd and Todds Rd and coordinate access points and intersections for future development.
Study of extension of Canebrake Drive to Todds Road.
Coordinate with the MPO and KYTC District 7 to conduct a feasibility study on the best potential connections between Areas 3 and 4 across I-75.
Potential transit routes should be evaluated by Lextran for extension to the Areas as they are developed.
Evaluate feasibility of potential transit circulator route connecting areas 2, 3, 4 and 5. Timeframe may vary between mid and long term depending on how quickly these expansion areas develop.
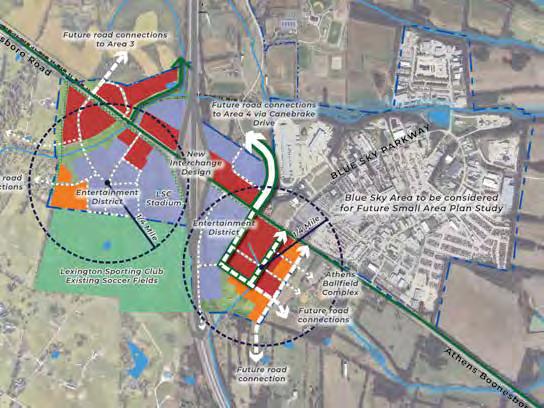
Conduct Blue Sky Activity Center Small Area Plan.
Coordinate with KYTC District 7 to ensure urban complete street roadway improvements along Athens Boonesborough Rd and coordinate access points and intersections for future development.
Consider a study exploring alternative designs for the I-75/Athens Boonesboro Road interchange, focused on vehicular stacking and transportation safety.
Potential transit routes should be evaluated by Lextran for extension to the Areas as they are developed.
Evaluate feasibility of potential transit circulator route connecting areas 2, 3, 4 and 5. Timeframe may vary between mid and long term depending on how quickly these expansion areas develop.

Lexington has a goal of reaching net-zero greenhouse gas emissions by 2050. The City takes seriously its role in reducing emissions, and recognizes that it must go beyond the minimum efforts called for by the Intergovernmental Panel on Climate Change's very low greenhouse gas emissions scenario.
Currently, Lexington’s electricity usage of 4 million megawatt-hour (MWh) - natural gas not included - generates 3 million metric tons of carbon emissions using the Kentucky electricity emission factor of 1,739 lbs/MWh (2021 Greenhouse Gas Emissions Inventory).
Lexington’s projected population growth and expanded Urban Service Area would, under 'business as usual' development, increase emissions. The Project Team has modeled energy usage of the proposed development and recommends sustainable, net zero development guidelines.
Empower Lexington 2023
is a comprehensive update to Lexington's original 2012 Empower Lexington recommendations, aiming to improve environmental sustainability and resilience in Lexington-Fayette County.
The plan focuses on six areas:
• Materials and Resources
• Natural Systems and Ecology
• Quality of Life
• Transportation and Land Use
• Water Efficiency
• Energy and Greenhouse Gas Emissions
Each area includes strategies for reducing Lexington’s environmental impact and carbon footprint.
Key highlights with a direct connection to the UGMP include:
• Greenhouse Gas Inventory: Lexington conducted a 2021 emissions inventory, using the Global Protocol for Community-Scale Greenhouse Gas Emissions (shown on the following page). This showed significant reductions in emissions since 2007, more work is required to meet the City's goal of reducing emissions by 50% by 2030 and reaching net zero by 2050.
• Natural Systems and Ecology: The plan emphasizes land preservation, increasing tree canopy, and promoting sustainable agricultural practices to enhance carbon sequestration and biodiversity.
• Transportation: To reduce reliance on cars, the plan promotes walking, biking, and public transit while supporting electric vehicle infrastructure.
• Water Management: Strategies proposed in the plan include improving stormwater management and reducing sewer overflows to protect Lexington’s waterways.
• Energy: The plan aims to enhance energy efficiency, promote renewable energy, and lower greenhouse gas emissions across municipal, residential, and industrial sectors.

“Cities consume over two-thirds of the world’s energy and account for more than 75% of global CO2 emissions. In addition, access to energy is critical in determining the quality of life of residents. This category encourages cities to provide equitable access to reliable power while simultaneously reducing the adverse impacts of energy use on environment.” -LEED for Cities and Communities

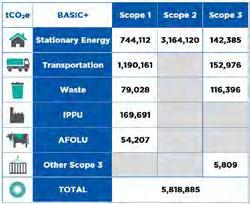
Scope 1 = Emissions in Fayette County
Scope
The 'Stationary Energy' sector accounts for almost 70% of Fayette County’s greenhouse gas emissions. The bulk of this total is a result of electricity and natural gas usage. The commercial sub-sector used the most electricity (48%) and natural gas (53%) in 2021, followed by the residential and industrial sub-sectors. - Empower Lexington 2023
The Stationary Energy sector accounts for almost 70% of Fayette County’s greenhouse gas emissions. The bulk of this total is a result of electricity and natural gas usage.
The commercial sub-sector used the most electricity (48%) and natural gas (53%) in 2021, followed by the residential and industrial sub-sectors.

It’s important to know where our GHG emissions come from so we know where to target our sustainability efforts. Lexington will be developing an Emissions Reduction Plan to evaluate options and focus efforts for emissions reductions projects.
The residential sub-sector is comprised of structures primarily designed for housing including single-family homes, apartments, and townhouses. The commercial sub-sector includes establishments like retail stores, shopping centers, office buildings, and restaurants. The industrial sub-sector includes buildings designated for activities related to manufacturing, production, warehousing, and distribution. Examples of such properties include factories, warehouses, and distribution centers.

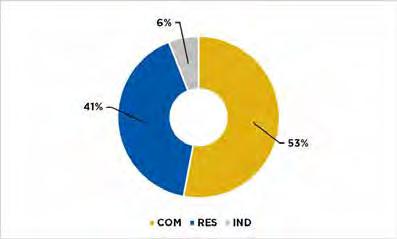
Below are listed the goals and strategies from Empower Lexington 2023policy recommendations. The items with a are supported by the concepts of the UGMP.
• Preserve land with vegetative and tree cover, in both rural and urban areas.
• Preserve and develop additional greenspace within Fayette County.
• Increase equitable park and greenspace access, meeting the goal of 70% of the dwelling units having access to greenspace within 1/2-mile (800 meters) walking distance.
• Continue infrastructure improvements to reduce sanitary sewer pipe leakage and overflows.
• Reduce drinking water use (gallons per person).
• Manage stormwater with functional green spaces in new and redeveloped areas.
• Protect and enhance stream buffer zones throughout Fayette County.
• Build infrastructure to withstand extreme weather events and other impacts of climate change.
• Reduce pollutants entering Fayette County waterways.
• Increase tree canopy coverage to improve water quality and reduce rainwater runoff.
• Reduce or eliminate drinking water loss by updating aging infrastructure.
• Improve water efficiency in built new and redeveloped areas.
• Complete a comprehensive ecosystem assessment that includes the following: topography, soils, vegetation & habitat, hydrology & aquatic ecosystems, tree mapping, endangered species, flood zones, and hydrology.
• Promote awareness and appreciation of the unique qualities of soils in Fayette County and the importance of agriculture at local, regional, and national levels.
• Continue to support the Purchase of Development Rights (PDR) program.
• Explore innovative land preservation and conservation concepts (in addition to PDR) with a focus on the protection of Lexington-Fayette County’s bluegrass soils.
• Implement information and engagement efforts to support existing programs that facilitate sustainable agricultural practices.
• Promote practices and policies that maintain vegetation, sequester carbon dioxide, preserve soil, and reduce surface water runoff for agricultural, residential and commercial lands.
• Provide funding for the development of a resilience plan that identifies vulnerabilities and risk capacity related to climate change and other natural and man-made hazards.
• Reduce light pollution and glare.
• Reduce reliance on cars and trucks by enacting the Lexington Area Bicycle and Pedestrian Master Plan.
• Develop a plan to provide more sustainable transportation options and reduce reliance on single-occupancy vehicles.
• Identify areas in need of infrastructure (e.g., sidewalks, trails, bike lanes, etc.) to encourage walking, scooting and biking.
• Leverage existing and future reports and plans to improve transportation options, safety and efficiency.
• Integrate green infrastructure into high quality public streets, in line with the Complete Streets Action Plan and based on the Complete Streets Design Standards.
• Implement practices that will shorten travel times for commuters using the public transit system such a signal priority for busses and/or dedicated bus lanes.
• Develop a Long Range Transit plan for the future of high-quality transit service in Lexington, complete with a funding and implementation strategy.
• Add zoning ordinance requirements for Electric Vehicle (EV) charging stations.
• Encourage the transition of large vehicle fleets to EV and alternative fuels.
• Assess electric vehicle (EV) and alternative fuel needs in Lexington. Develop an action plan to address any deficiencies.
• LFUCG support the creation of an organization to coordinate efforts for strategic planning and development in Lexington. The organization would pursue federal funding for equitable redevelopment in high-priority areas.
• Analyze the effects of the Urban Service Boundary on transportation and land use.
• Reduce the amount of textiles/clothing sent to the landfill.
• Reduce the amount of food waste and/or organics sent to the landfill.
• Divert 35% of Construction and Demolition Debris away from landfills.
• Increase education and engagement opportunities to increase residential recycling levels and decrease contamination in the recycling stream.
• Increase community programs that encourage reuse/reduction, such as tool libraries.
• Consider establishing Extended Producer Responsibilities (ERP) policies for some items, such as batteries. Under EPR policies, producers of materials (e.g., batteries) pay the cost to collect and recycle.
• Explore opportunities to improve waste collection route optimization.
• Expand types of material that are accepted in the mixed comingled recycling stream.
• Establish programs that discourage the use of single-use plastics, such as plastic bags.
• Request utility companies to reduce greenhouse gas emissions by 60% by 2035 and reach net-zero by 2050.
• Use LEED Certified Criteria (national sustainable building standards) to set LFUCG building standards.
• Set community-wide renewable energy goals as a percent of total energy used (5 years, 10 years).
• Conduct an inventory of greenhouse gas emissions every 2 years.
• Create additional, elevated sustainability positions within LFUCG including one focused on researching, applying for and implementing sustainability/resilience grants.
• Develop a list of local companies and individuals who are leaders in energy and greenhouse gas emissions. Utilize that list to coordinate a sustainability-focused business network group and establish a high-profile sustainability awards ceremony to unite the community and boost awareness.
• Fund and implement a Climate Change Vulnerability Report focused on both mitigation and adaptation initiatives.
• Allow large energy users to directly enter into long-term contracts with renewable energy developers.
• Establish a Building Energy Reporting and Disclosure Ordinance for large and medium-size buildings.
• Develop a Green Bank to expedite funding for energy efficiency and renewable energy projects.
• Create and utilize renewable biogas through organic waste collection.
• Plan for safe, affordable, accessible housing to meet the needs of all Lexington residents.
• Enable all existing and new neighborhoods to flourish through thoughtful (re) development. This includes connectivity to other neighborhoods and key businesses/ services, safe biking, scooting and walking options, natural features, green infrastructure, neighborhood-level services and businesses and other assets. Emphasis should be placed on keeping current residents in place.
• Ensure equitable development and rectify Lexington’s segregation by race and socioeconomic status.
• Strengthen efforts to develop a variety of job opportunities that support a living wage and lead to prosperity for all.
• Enhance job training and career connection opportunities for all residents seeking better economic options.
• Improve opportunities for small business development with focused support for minority businesses.
• Create opportunities for low, moderate and middle income residents to access affordable and equitable home financing options for those who desire to own a home.
• Enhance opportunities for robust public outreach and engagement, particularly for issues that affect quality of life.
The study of building science has substantially increased our understanding of how our built environment uses energy to condition our homes and community buildings, including the up-front costs and longterm impacts of construction type. Modern building codes have added energy codes to reflect this advancement, balancing energy performance requirements with affordability. The National Institute of Standards and Technology has provided research support backing the premise that energy efficient buildings ensure the longterm cost benefits over the life cycle of a building. However, the energy required to operate a building over its life cycle can exceed the energy it originally took to build the building by a factor of 5 in poorly constructed buildings.
Reducing energy consumption through efficiency measures is often more costeffective than producing new energy. This concept is central to energy efficiency discussions, especially in the context of building energy use:
• Energy Savings vs. Generation:
Improving energy efficiency (such as upgrading insulation, better windows, or more efficient HVAC systems) saves energy that would otherwise need to be generated. This is often cheaper than producing an equivalent amount of energy from any source.
• Cost-Effective Strategy: Energy efficiency measures—like better construction practices and modernized building codes—often have a higher return on investment over the life of the building. The upfront cost of building or retrofitting for energy efficiency is generally outweighed by the long-term savings in energy bills, meaning the cost of saving energy is lower than the cost of generating it.
• Grid and Infrastructure Relief: Reducing demand for energy also reduces stress on the grid and decreases the need for costly new infrastructure like power plants or transmission lines.
Research by organizations like the Lawrence Berkeley National Laboratory and National Institute of Standards and Technology demonstrates that reducing energy use in buildings—whether through new codes or retrofitting existing structures—creates economic and environmental benefits. The "kilowatt saved" is not only the cheapest energy source in monetary terms but also reduces emissions and supports energy resilience by lessening the load on the grid.
This becomes especially critical when addressing outdated building codes. Kentucky's building code is behind national codes by over a decade, meaning buildings in Kentucky are less efficient and use more energy than necessary, leading to increased energy costs. The table to the right shows a comparison of the energy required under each construction type.
The expansion areas should utilize the latest building standards and modernized codes. Kentucky's 'Business as Usual' approach means that builders will need to look elsewhere for guidance. There are multiple high-performance programs, privately and publicly managed, that focus on delivering high-performance buildings.
Up to Date Code refers to the most current building codes are developed and updated by organizations like the International Code Council, the American Society of Heating, Refrigerating and Air-Conditioning Engineers, and the National Fire Protection Association.
High Performance
refers to initiatives, standards, or certification programs designed to promote and implement advanced energy efficiency and sustainability in building design, construction, and operation, such as LEED (Leadership in Energy and Environmental Design), ENERGY STAR, Passive House, and Net-Zero Energy. These programs focus on creating buildings that perform significantly better than those constructed under standard or outdated codes. Key features include:
• Energy Efficiency
• Sustainability
• Improved Indoor Environment
• Long-Term Cost Savings
Business as Usual refers to the continuation of standard practices and policies without significant changes or improvements, especially regarding energy use, building codes, and construction standards.
Given that the primary land use type applied in the Growth Areas is Residential, it is helpful to understand a more practical application of energy efficiency in building code. The Project Team conferred with Home Energy Consultants (HEC), an organization that works with builders to differentiate their product through the Home Energy Rating System (HERS). HERS is a nationally recognized system that measures a home’s energy efficiency. It is the industry standard for evaluating a home’s energy usage and is often used to show compliance with local energy codes.
HEC reports their clients typically achieve a score in the 70s as demonstrated in the sample HERS score card. HEC reports that Kentucky LowIncome Housing Tax Credit recipients receive incentives for energy efficiency and often achieve better scores than their peers.
Engagement of the clean energy industry will be critical in achieving the net zero greenhouse gas emissions goal.
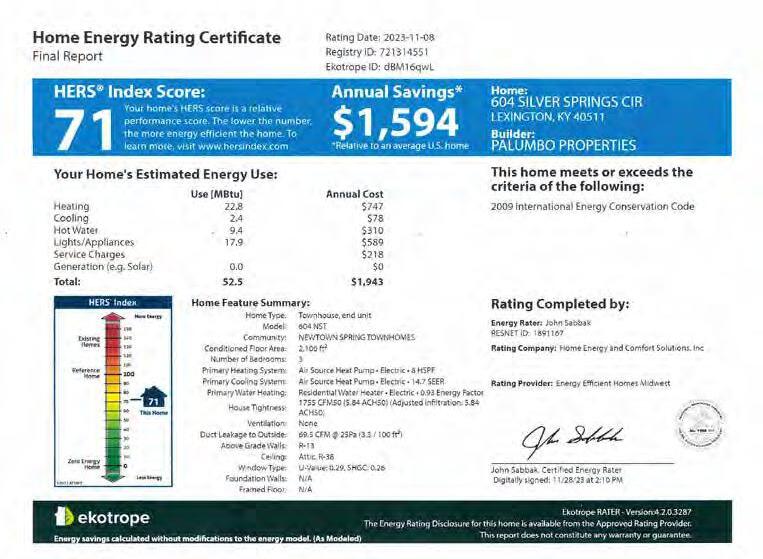
Buildings are machines with structural, electrical, and mechanical systems that must work in concert with one another. Building codes are the quality control specifications adopted by governments to ensure that buildings within their jurisdiction meet standards for habitability, safety, and performance. Energy codes, which are a subset of building codes, are the quality control specifications adopted by governments for energy efficiency. Kentucky's codes, and therefore Lexington-Fayette County's codes are substantially behind current standards.
Effective energy code enforcement helps reduce energy consumption and increases building efficiency, which leads to fewer fossil fuels being burned for energy generation. This, in turn, reduces carbon dioxide emissions, which are the primary driver of climate change. Making buildings more energy-efficient contributes to long-term carbon emission reductions—a key goal in global efforts to mitigate climate change.
Thus, enforcing energy codes in Lexington not only benefits the local economy and public health but also directly supports the city's and the broader global goal of reducing greenhouse gas emissions and fighting climate change.
Effective energy code implementation immediately saves residents and businesses money by reducing energy consumption, which lowers utility bills. Monetary savings increase consumer purchasing power and companies’ ability to invest in their businesses.
Improved compliance with the energy code can also result in job growth within the building sector by boosting demand for skilled professionals whose products and services enable buildings to meet code (e.g., certified duct and envelope tightness verifiers and independent energy specialists). These positions are the types of clean-tech jobs identified in the Imagine Lexington 2045 Comprehensive Plan as important to the future growth of Lexington.
Over 93 percent of the electricity consumed in Lexington is generated by thermoelectric power plants, which require an enormous amount of water. While most of the water withdrawn for electricity production is ultimately discharged back into the environment, some is lost through evaporation. Approximately half a gallon of surface water is consumed by thermoelectric power plants for every kilowatt hour (kWh) of electricity that is produced. Improving energy code compliance in buildings reduces electricity consumption, which in turn reduces the stress placed on Lexington's water supply. Findings indicate that improved compliance with the up to date energy code would save 175,000 megawatt hours (MWh) annually in the expansion areas, which translates to a savings of 500 million gallons of water over a five-year period.
Inefficient buildings can contribute to serious health concerns, especially for children, the elderly, and those suffering from illness. Buildings that comply with the energy code can reduce health risks from, among other things, mold, dust and dust mites, rodents, insects, and combustion byproducts.
Electricity used in buildings is largely generated by burning coal, which releases harmful pollutants such as sulfur oxides (SOx), nitrogen oxides (NOx), and particulate matter into the atmosphere. Inhaling these pollutants and their
byproducts has adverse consequences for human health (e.g., respiratory disease, heart problems, and early mortality).
Recent reports by the Sierra Club and the National Institutes of Health estimates that emissions from coal-powered electricity plants kill twenty thousand people a year in the U.S. and result in almost twice as many non-fatal heart attacks. A more efficient energy code will decrease electricity consumption per capita, reducing these pollutants that harm human health.
Buildings that are built to the energy code standards also provide greater yearround comfort (e.g., reduced outdoor noise, stuffy/muggy air, condensation, excessively dry air, and hot and cold areas) and improved long-term energy performance of the heating and air conditioning system.
Additionally, efficient buildings reduce peak demands on the electricity grid, thereby allowing utilities to deliver more consistent and effective services across the service area.
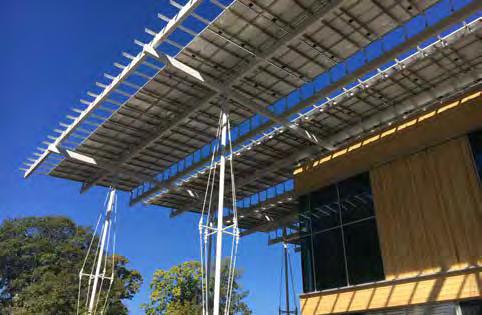

Renewable energy investments are another important step towards Lexington's net-zero 2050 goal. Utilityscale solar has seen the steepest cost decline of any electricity source since 2009. Transmission of electrical power over the grid occurs on a regional scale (within 300 miles). Therefore, utility-scale solar does not need to be built in Fayette County, but can come from surrounding counties across Central Kentucky.
While building integrated solar is substantially more expensive than utility scale solar, tax credits help close that gap.
The chart below compares the cost for implementing renewable energy solutions at the building level (e.g., rooftop solar panels for individual buildings), versus at the utility scale (e.g., large solar farms feeding electricity to the grid). At the building level, there are higher initial costs per building because they lack the economies of scale seen in utilityscale projects. While utility-scale projects tend to be more cost-effective, they may require infrastructure investments for energy transmission and distribution.

Mixed-use development is transportation-efficient
Implementing mixed-use development and a multimodal transportation network will draw on the features of historic towns and villages that make it convenient to take fewer or shorter trips.
occupancy vehicles
The concepts support the Lexington Area Bicycle and Pedestrian Master Plan by requiring the typical street sections to have infrastructure for pedestrians and bicyclists at the scale appropriate for vehicle volumes and speeds. This infrastructure, including shareduse paths, protected bike lanes, and sidewalks, will reduce reliance on single occupancy vehicles. The mixed-use development and requirement that open spaces must be within walking distance of residential areas will enable more residents to take shorter trips without using a car, thereby reducing the number of vehicles miles traveled in the city.
The mixed-use development and multimodal transportation network within it will minimize greenhouse gas emissions due to transportation. This will improve public health outcomes such as respiratory diseases from poor air quality, minimize effects to the environment, and lower transportation costs.

Include green infrastructure techniques in the development
Nature-based solutions such as buffer areas, street trees, native plants, rain gardens, green roofs, bioretention areas, and constructed wetlands emulate natural ecological processes. Green infrastructure absorbs pollutants and carbon dioxide, manages stormwater, reduces heat, and promotes biodiversity. Economically, it boosts property values, attracts businesses, and saves energy. It also fosters improved mental and physical health, reduces air and noise pollution, and enhances aesthetic appeal.
Maximize the use of environmentally-friendly construction materials
Prioritize the use of pervious pavement to allow rainwater to seep through and infiltrate the ground, reducing surface runoff. Prioritize the use of rubberized asphalt and other recycled construction materials. These materials are often more durable than traditional materials, which means they can provide a longer service life and reduce maintenance costs. Their use can also reduce waste in landfills.

Without modernizing state building code requirements, the goal of net zero greenhouse gas emissions will be difficult to achieve. The Project Team recommends incremental improvements to prepare the industry for the construction techniques necessary to achieve the goal. Over time the clean energy industry can build to accommodate the following guidelines:
• Continuing education requirements for inspectors and builders
• LFUCG-provided diagnostic testing, rating, and labeling requirements
• Developer covenants for high performance building programs
• Utility incentive programs
• State level advocacy for modern requirements
Continuing Education requirements
Continuing education for inspectors and
builders working in the city can help increase compliance with the current energy codes and lay the foundation for increased future requirements.
While current state-level code does not require diagnostic testing, LFUCG designees can provide testing and rating services. Additionally, energy efficiency labeling of a home can be required. This would be an expansion within the Empower Lexington recommendation for a Building Energy Reporting and Disclosure Ordinance. Creating a transparent market where buyers weigh their long term operation cost in their home buying decision advances the goal of net zero greenhouse gas emissions. The HERS rating system discussed herein was specifically designed for the mortgage and realty industries to utilize for this purpose. ANSI/RESNET/ ICC Standards 301, 310 and 380 can be added to the Empower Lexington recommendation for a Building Energy Reporting and Disclosure Ordinance. Additionally, the appraisal industry has a Green and Energy Efficient Addendum that could be required to help drive a transparent marketplace.
Covenants negotiated by LFUCG and placed on expansion areas by developers can be a private pathway to higher performance. Successful programs include:
■ Zero Energy Ready Homes
■ LEED (Leadership in Energy and Environmental Design)
■ NGBS (National Green Building Standard)
■ EarthCraft
■ HERS
■ City of Lexington Green Check program

Energy-efficient construction and onsite renewable energy help to stabilize a utility’s load curves. Therefore, programs known as Demand Side Management (DSM) are often instituted by utilities - LG&E/KU have an existing DSM initiative. Partnerships between LFUCG and local utilities can help build the local clean energy industry necessary to attain the goal of net zero greenhouse gas emissions.
Successful advocacy for local control of building energy requirements would allow LFUCG to adopt one of the many stretch codes available. The 2021 International Energy Conservation Code Zero Code appendices are suitable:
“The residential Zero Code appendix is based on the Energy Rating Index (ERI) path of the code. It requires more efficiency than is required in the base code and requires enough onsite or offsite renewable energy production to achieve an ERI score of
zero. Renewable energy compliance may happen through a combination of onsite power production, energy generated through community renewable energy facilities, and renewable energy purchase contracts or leases. The commercial Zero Code appendix is based on the Architecture 2030 ZERO Code, which requires a building to meet the minimum code requirements plus enough on-site or off-site renewable energy to compensate for all the energy anticipated to be consumed by the building.”
This page left intentionally blank
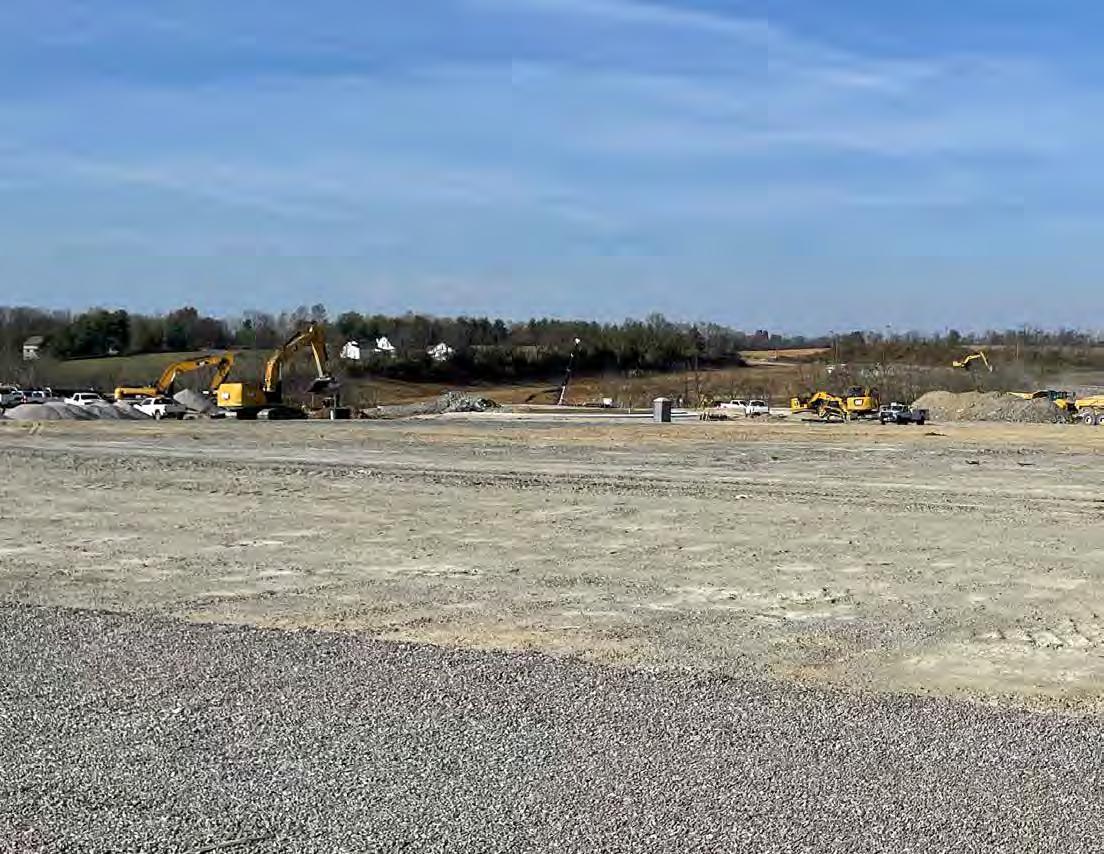
The development shown in the Regulating Plans will require major infrastructure improvements at build-out, including roads and streets, intersections, trails, parks, libraries, and sewer, water, and stormwater systems. The following is a high-level rundown of major capital improvements and costs including:
■ Roadways, Trails, and Intersections
■ Sewer
■ Emergency Response - Police and Fire
■ Neighborhood Parks
■ Library
■ Lextran
In addition to the above improvements is a calculation of operating and maintenance costs.
The Project Team developed a fiscal impact model to measure the effects of Expansion Area development projects on the LFUCG General Fund Operating Budget.
■ LFUCG Expenditures
■ LFUCG General Revenues
■ Fiscal Impact Estimates
The development shown in the Expansion Area framework plans will require major infrastructure improvements at build-out, including roads and streets, intersections, trails, parks, libraries, and sewer, water, and stormwater systems.
Table 8-1 summarizes the total capital costs of $569.5 million (2024 dollars). Of that total, $52.4 million are for public costs, including a police roll call station, fire stations, and neighborhood parks. Traditionally, Lexington has required that developers fund the road, trail, intersection, sewer and other on-site infrastructure costs ($517.1 million of these estimated costs) on the basis that new development should pay for itself. Lexington Public Library and Lextran would incur an additional $19.0 million in costs to serve new populations. The ultimate allocation of these costs between LFUCG and the developers will be informed by an Infrastructure Funding Program analysis that will be conducted over the next few months.
To provide an indication of the scale of roadway and off-road trail infrastructure costs, Gresham Smith quantified the length of the boulevards and avenues that will create the spine for the future development and road network of each Expansion Area. Also identified were the number and type of intersection improvements and stream crossings required under each plan. Based on experience with comparable improvements in the Lexington area, Gresham Smith estimated average costs per 100 linear feet of roadways and shared use trails along with costs per intersection or stream crossing. The roadway costs included pavement, curb and gutter, sidewalks, trees, streetlights, telecommunication conduits, and sewer, water, and stormwater collection and distribution lines constructed with the roadway. The boulevards are assumed to include four drive lanes and two parking lanes with a center median with a line of trees. The commercial avenues include two drive lanes, two parking lanes, and a center median with a line of trees. Off-road shared-use trails through open
space are assumed to be 12-foot trails with eight-foot treed buffers on either side. Due to the great variation across different types and sizes of stream crossings, costs were estimated as a range with the mid-point used in this analysis. A 30-percent contingency factor was added due to the conceptual nature of the improvements and the lack of engineering. An additional 20-percent allowance was included to cover the costs of design, engineering, surveys, and geotechnical services. The estimates are in 2024 dollars without escalations for inflation. Together, these costs for roadways, trails, and intersections total $510 million across the five Expansion Areas.
Roadway maintenance costs provided by the Division of Streets and Roads plus annual paving costs are equivalent to $11,811 per lane-mile of road. Applying that factor to the mileage of new boulevards and avenues indicates an annual maintenance cost of $415,000 for boulevards and avenues. Off-road trails are maintained by the Division of Parks & Recreation at an estimated average cost of $8,600 per mile for a total of $108,300 annually.
The costs of sewer, water, and stormwater infrastructure were not estimated for this plan with the exception of sanitary sewer improvements in Expansion Area 2. Stantec Consulting Service Inc. evaluated
sanitary sewer capacities in each Expansion Area and found that Expansion Area development required minimal upgrades to the LFUCG’s existing wastewater collection, transmission, and treatment systems within the Urban
Table 8-1. Major Capital Costs Associated with Expansion Area Build-Out
Service Area (USA). While wastewater infrastructure would be needed to serve Expansion Areas 1, 3, 4 and 5, none of those wastewater improvements are an LFUCG responsibility.
Expansion of the USA to include
Expansion Area 2 offers the opportunity to achieve greater operational efficiency by eliminating the existing North Elkhorn and North Elkhorn #2 pump stations in compliance with the consent decree that requires LFUCG to reduce pollution from sewer overflows. To achieve those efficiencies, Stantec recommended installing 48-inch and 54-inch diameter gravity sewers, a 30-inch diameter force main, an 18 million gallons per day (MGD) pump station, and a wet weather storage tank of 9.0 to 9.25 million gallons (MG) with diversion pumping capacity of 26.8 MGD to fill the wet weather storage tank. Of the total $54.3 million sanitary sewer cost for Expansion Area 2, Stantec estimated that $6.7 million would be the developer’s share of sanitary sewer improvement costs based on the share of the capacity needed to service Expansion Area development at an average 21 people per acre. LFUCG’s share would be $47.6 million. Because these improvements would help to meet the requirements of the consent decree and are not required to accommodate Expansion Area development, LFUCG’s $47.6 million cost is excluded from this analysis.
The addition of 39,200 to 58,700 new residents will result in additional calls for police service, requiring additional officers. The Expansion Areas are somewhat removed from existing Police Department facilities. The Commissioner of Public Safety estimates that timely service will require the addition of a new roll call center for the Fourth Sector near the Man o’ War intersection at I-75 that could serve Expansion Areas 2-5. Expansion Area 1 could likely be served by existing officers and staff. Based on the costs of developing the most recent Tates Creek/Man O’ War police sector house, the capital costs associated with building a new roll center and equipping new officers are estimated to total $7.5 million.
Two beats would likely be needed to adequately police the new Expansion Areas at full build-out. Staffing two beats would require 18 new staff at a total annual cost of $1,869,000. The roll call center utilities are estimated at $100,000 annually.
Expansion Areas 2-5 all fall outside of the National Fire Protection Association 1710’s minimum requirements for provision of emergency services by career fire departments of 480-second travel time for emergency responses. As the Expansion Areas build out and response times from existing stations lengthen due to traffic congestion and distance from the existing stations, the Fire Chief estimates that two new fire stations will be needed to serve Expansion Area 2 and Expansion Areas 3-5. The total cost of building and equipping a fire station and its crew is estimated at $16.2 million for Expansion Area 2. Costs for Expansion Areas 3-5 total $16.1 million, based on recent construction. The Area 2 station would serve a larger area, including the new Baptist Health Campus. The Fire Chief estimates that 40 percent of the calls would be to Expansion Area 2, so the attributable cost is $6.5 million.
Staffing the Expansion Area 2 station would require 48 new staff. The Expansion Areas 3-5 station would need 30 new staff. Operating costs for salaries, benefits, uniforms, equipment and utilities would total $5.5 million for Expansion Area 2 with $2.2 million attributable to the new development. Operating costs for the Expansion Areas 3-5 station would total $3.5 million.
The Expansion Area framework plans call for 270 acres of open space and parks. The areas could be well served by the addition of 16 new neighborhood parks with about 10 acres each, providing a neighborhood park within 10 minutes of the new housing units. The Division of Parks & Recreation reports that improvements cost $1,405,800 per park, based on recent construction, excluding the cost of the land. That indicates a total capital cost of $22.5 million for the new neighborhood parks.
Annual operating and maintenance costs average $25,240 per neighborhood park for an annual total of $403,000 across all the Expansion Areas.
The Lexington Public Library operates six branches with the Marksbury Family Branch Library being the most recent to come back online this year on Versailles Road. The standard from the Master Facilities Plan calls for 0.6 square feet of library space per capita. The proposed population growth associated with Expansion Area development would require 23,500 to 35,200 square feet of new space at build-out, assumed to be developed as expansions of existing branch libraries. Based on recent costs, those additions would cost $13.7 to $20.5 million.
The staff required by the increased size would be limited and could be absorbed within the Library system’s operating budget.
Lextran runs 65 vehicles on 25 fixed routes as well as door-to-door paratransit for the disabled. Expansion Areas 3-5 are not well served by existing Lextran fixed-route buses. The nearest service is provided by Route 1 – Woodhill Drive, which extends only a short way beyond Man o’ War Boulevard. The Lextran Director of Planning, Technology and Community Relations estimates that serving Athens Boonesboro Road would require two buses. Each CNG bus costs $800,000 with an electric bus costing $1.0 million.
Operating costs average $100 per hour for a total annual cost of $939,000 for two buses operating 6 am to 9 pm on weekdays with one bus on weekends.
The new infrastructure serving the Expansion Areas will bring new operating and maintenance costs. As summarized in Table 8-2, the estimated costs of operating and maintaining those new public facilities would total $8.5 million annually at build-out with Lextran
incurring an additional $939,000 in annual operating costs.
Urban Service District (USD) taxes support the direct costs of providing street cleaning, waste management and street lighting to individual portions of the urbanized area. Because the USD taxes are treated as an enterprise fund with fees set to recoup actual costs,
these costs have been excluded from this estimate of General Fund operating and maintenance costs for the required capital improvements.
Going forward, LFUCG should undertake an Infrastructure Funding Program to resolve which of the capital and operating/maintenance costs should be borne by developers and which should be supported by LFUCG.
Sanitary Sewer (covered by fees)
Area 3/4/5 Station
The team developed a fiscal impact model to measure the effects of Expansion Area development projects on the LFUCG General Fund Operating Budget. The model relates LFUCG government spending by the groups served: residents; businesses and their workers; and visitors.
The fiscal impact model assumes that an individual that is employed, a resident, or a visitor to Lexington-Fayette County requires services and benefits in equal proportion, including those provided by law enforcement, public works, and fire protection. Using the most recent available data, Fayette County had 327,288 residents, 197,525 employees and 5.6 million annual visitors in 2023. Estimates of the number of workers in new Expansion Area development are based on 300 square feet of commercial space per worker, 500 square feet of industrial space per worker and 0.1 hotel rooms per worker. Residents in new units are estimated at 2.50 persons per household in a single-family unit and 2.31 persons per household in a multifamily unit based on data provided by Esri, excluding 3.0 percent of units for vacancies and 2.0 percent for short-term rentals. Average household size varies by Expansion Area based on the mix of new units. Visitor counts reflect 2023 hotel occupancy levels of 61.0 percent as
reported by CoStar and an average of 2.0 persons per hotel room and 2.5 persons per party for other visitors.
The LFUCG budget is broken down into four categories:
• General Services District (GSD) (Unrestricted funds dedicated to providing basic services to residents)
• Urban Service District (USD) (Revenue from property taxes that pay the cost of street lights, waste collection, and street cleaning)
• Special Revenue Funds
• Enterprise Funds Special revenue funds are for services funded from non-local tax revenues, such as municipal and county aid from the State, police confiscations and resale of property, workforce development grants, and funds with an initial capital allocation that do not depend on annual General Fund appropriations (e.g., Lexington Economic Development Fund and Affordable Housing Fund).
Enterprise funds are those services that cover their operating expenses and capital costs primarily through user fees. Key among those are funds for sanitary
sewers, water quality management, landfill, right of way program, extended school program, enhanced 911, and Central Kentucky 911. The Urban Service District also acts as an enterprise fund with residents taxed based on the cost of providing specific services (e.g., street cleaning, street lights, and refuse collection). This analysis excludes those enterprise funds on the basis that users and beneficiaries bear the costs directly.
This impact analysis is based on Fiscal Year 2025 General Fund expenditures. The General Fund budget is organized into nine key categories:
• general government
• justice
• environmental quality and public works
• public safety
• development
• social services
• parks, recreation, and culture
• community development
• economic development
Also included in the analysis are revenues and expenditures for Fayette County Public Schools (FCPS).
Development projects generate a variety of revenues beyond real property taxes. The properties and their residents, tenants, and visitors generate a range of occupational license taxes, motor vehicle taxes, licensing and permits, and other service fees.
Real property taxes are based on property assessments that reflect market value. They are paid annually by each property owner and development. Each property pays a General Services District tax of $0.076 per $100 of assessed value, of which $0.05 is earmarked for Lexington Public Library and $0.026 remains in the General Fund. Only the LFUCG General Fund revenues are included in this analysis. Within the Urban Service District, properties pay an additional tax up to $0.166 per $100 of assessed value depending on the mix of services provided (e.g., refuse collection, streetlights and street cleaning). The Urban Service District revenues are excluded as they are used to cover direct costs. Also paid is the FCPS real property tax of $0.081 per $100 of assessed value.
Motor vehicles are taxed by both the LFUCG and Fayette County Public Schools. Residents pay an estimated $3.76 per vehicle to LFUCG and $58.61 to FCPS. Commercial vehicles are taxed
an estimated $19 per vehicle for LFUCG and $296 for FCPS. Census data indicate an average of 1.2 vehicles per residential households. Commercial vehicles are estimated at 0.1 per 1,000 square feet of commercial or industrial space and 2.0 per 100 hotel rooms.
Occupational license taxes are paid by both employees and employers. On the employee side, wages are taxed at a rate of 2.25 percent by LFUCG and 0.5 percent by FCPS. Wages are estimated based on average wages for a variety of occupations that could occupy future commercial and industrial spaces. Forprofit businesses pay net profits at the same tax rates. The calculations assume a prototypical 2,000 square-foot retailer making $300 per square foot in annual sales with a 10-percent profit margin for an average occupational license fee of $1,350 per business. For hotels, the prototypical 75-room hotel with annual revenues of $27,200 per room and a 10-percent profit margin generates a $4,600 tax to LFUCG and $1,000 to FCPS. This model includes only the occupational license taxes generated by businesses located in the Expansion Areas and their employees.
LFUCG charges services fees for Emergency Medical Services, Detention Center and District Court jail, building permits, golf courses, parks and recreation, and other miscellaneous services. Collections in FY 2025 are projected to average $94.36 per resident.
Fines and forfeitures generated $0.61 per resident in 2023. FCPS receives government transfers from the State that average $4,500 per school-age child and $730 per capita.
The team estimated the net fiscal returns to LFUCG and FCPS from new
development in each Expansion Area. The numbers of new residents, on-site workers, and visitors reflect the ranges of development shown on the framework plans, as summarized in Table 8-4.
For each area, the numbers of new residents, on-site workers, and visitors were calculated and expenditures
estimated based on the factors described above. Revenues were estimated as described above. Table 8-5 summarizes the estimates of residents, on-site workers, and daily visitors associated with all the Expansion Areas.
Summarized in Table 8-6, the General Fund fiscal impact estimates for all five Expansion Areas range between a net cost of -$32.0 million with development at the lower residential densities and -$48.1 million at the higher residential densities. As current budgets stand, the largely residential program results in higher expenditures than revenues. Impacts by individual Expansion Area are summarized in Table 8-7.
The fiscal deficits associated with the new development are due to the LFUCG revenue structure that relies very heavily on occupational license revenues, which is generated by businesses and their employees. With a limited base of new commercial and industrial uses planned for the Expansion Areas, the annual General Fund revenues will be significantly less than future expenditures.
The fiscal cost estimates reflect current average revenues and expenditures.
The analysis does not consider the Occupational License wage taxes paid by future Expansion Area residents if they are not employed in the Expansion Area. LFUCG collects wage taxes only from those that work in Fayette County. Those Expansion Area residents that also work in the county will pay occupational license taxes that will help to cover the LFUCG costs of serving them. Those revenues are not considered in this analysis.


In order to ensure the availability of adequate community facilities in what is an increasingly constrained fiscal environment, local governments need to employ management systems which provide a predictable and certain basis for public and private investment. One of the most important management systems involves long-range planning for capital improvements where annual budget decisions are made within the context of a near-term and longterm infrastructure needs assessment. The inclusion of infrastructure needs (sewers, transportation network, parks, civic facilities, public safety, etc.) must be matched with a long-range financial plan which projects future revenues for those improvements on a comprehensive basis. This long-range financial plan may require thoughtful consideration of new or unique revenue sources.
There are numerous advantages to the establishment of a long-range infrastructure funding plan and financing program for the areas described in the UGMP. First, the funding plan creates a more predictable environment for public and private investment and avoids the creation of unrealistic expectations regarding the timing of development and level of service for needed facilities. The timing of the development of land is directly related to the availability of
needed community facilities, either as a matter of public policy or market preference. Further, the value of land is affected by the timing of development because of the time value of money. By providing surety to the private sector regarding when facilities will be available to serve a particular area, the risk inherent in private sector investment decisions in those areas is greatly reduced.
Second, a long-range infrastructure funding plan and financing program ensures discipline in public sector decisions. Each year, elected officials are challenged to allocate scarce financial revenues to competing interests. In the absence of a long-range infrastructure funding plan and financing program, budget decisions are often influenced by immediate external pressures. This reactive approach can result in critical long-term improvements being deferred or overlooked.
Third, decisions regarding incurring debt require the long-range perspective of an infrastructure funding plan due to the length of repayment periods. What may seem like a beneficial decision to meet an immediate need may not be justifiable when compared to long-term revenue demands to meet overall, larger and more important, capital improvement plans.
Finally, there are economies of scale which can be realized in the context of a long-range infrastructure funding plan and schedule. Routinely, a particular infrastructure project turns out to later require an improvement that ends up costing more money than if it had been constructed all at once at the outset.
The infrastructure costs and fiscal impact model coupled with the regulating plans included in this master plan serve as the community facilities element of the UGMP. The creation of an infrastructure funding plan is a critical tool to implement this community facility element. The concept of a long-range capital facilities financing program for the establishment of infrastructure within the UGMP areas is simple: needed improvements will be identified on the basis of a comprehensive needs assessment and then prioritized according to relative need and projected financial capacity. Lastly, annual budgeting decisions would be made in the context of the long-range infrastructure funding plan for the whole of the urbanized area. Future capital expenditures must be integrated into the citywide budgeting process to ensure equitable distribution of resources.
PLAN (IFP):
Opportunity to establish an innovative infrastructure financing plan that:
• Increases revenue efficiency without raising taxes,
• Improves cash flow,
• Supports policy objectives,
• Pursues economic sustainability,
• Provides accountability, transparency and enhanced service across public infrastructure, and
• Provides need analysis and support for the creation of new or dedicated funding sources.
INFRASTRUCTURE ELEMENTS OF AN IFP:
• Transportation
• Roads & Highways
• Bridges
• Public Transit
• Sidewalks, Bike Lanes, and Pedestrian Paths
• Utilities
• Stormwater & Detention
• Sanitary Sewer
• Telecommunications
• Public Safety
• Fire & Emergency Services
• Police
• Public Facilities
• Parks
• Trails & Greenways
• Community & Senior Centers
• Housing
Model IFP Attributes:
1. Clearly Identified Policy Priorities
2. Community Process/Review
3. Projects Prioritized
4. Ongoing Needs Assessments
5. Comprehensive Financing Strategy
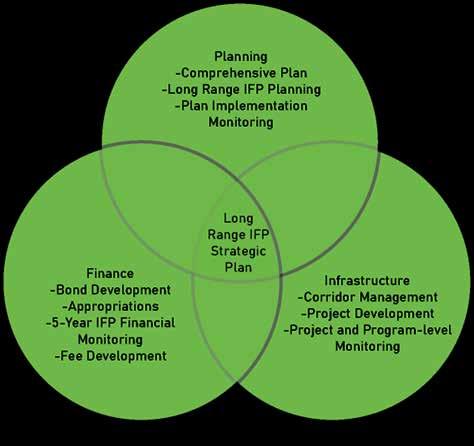
Simultaneous to the creation of an IFP, the City should seek to establish a parkland dedication ordinance to ensure the parks and open space needs of the future residents of the UGMP Areas are met. While a parkland dedication ordinance can have greater utility for the whole of the Urban County, it is essential that the proposed development of Areas 1 through 5 meets the Regulating Plans outlined as follows. A parkland dedication ordinance should start in 2025.
The public input for both Imagine Lexington 2045 and the UGMP stresses the need for access to adequate public parks and natural open spaces. Parks and green spaces are essential for inclusive urban growth that supports healthy communities, economic growth, and climate resiliency. The establishment of parks and natural open spaces within
all five Areas of the UGMP is essential to providing adequate service to future residents of Lexington, as well as ensures that the City maintains the current level of service (LOS) that was established by the Your Parks, Our Future: Parks and Recreation System Master Plan (2018); bolstered by the Parks and Recreation Strategic Plan Update (2024).
Park LOS is a nationally recognized and legally supported standard to calculate the amount of developed park land and open space needed to meet a community’s recreation needs. It helps assess how well Lexington’s parks and recreation system is meeting the needs of residents. Lexington calculates the LOS for publicly accessible parks separately from the LOS for open space and aggregates the total park/open space LOS per 1,000 residents. The table below
shows the current level of service for the Urban County as calculated in the 2018 Parks Master Plan.
The projected deficit of park acreage within Lexington is concerning for the City’s current population and must be addressed with the addition of facilities to meet the needs of the community. The addition of acreage and population to the Urban Service Area shown in the UGMP necessitates that the City plan ahead to ensure that parks are developed simultaneously with new development as an infrastructural element. The UGMP identifies several parks throughout each of the areas to meet the needs of the growing population.
The UGMP calls for the inclusion of neighborhood parks, natural/open
spaces, and protected natural areas along floodplains. The regulating plans described within this chapter provide the size, location, and configuration of parks and natural/open space within the five new urban Growth Areas.
Neighborhood parks are defined in the Parks Master Plan as areas that are 2.5 to 15 acres of developed parkland that have a one-mile service areas and can be reached within a 10-minute walk by an able-bodied adult. These parks are suited for intense urban development. The typical facilities include athletic fields, game courts, playgrounds, small pools/ spray-grounds, small neighborhood centers, drinking fountains, picnic areas/ shelters, and walking trails.
The total acreage of neighborhood parks shown in the UGMP exceeds the current LOS for Lexington. As development occurs, specific attention should be paid to provide adequate developed neighborhood park facilities to serve the proposed populations within a 10-minute walking distance to align with the goals of the Parks and Recreation Master Plan.
Community and regional park needs for these areas are met by existing and
planned LFUCG parks within the adjacent areas, including parks like Jacobson Park, Cardinal Run Park, and a proposed park south of Winchester Road. Additional capacity-expanding improvements to these existing and planned parks may be warranted by added population in areas of expansion. Future development of community-wide park or capital facilities may necessitate financing mechanisms to serve new populations in the City.
The Parks Master Plan defines natural/ open space as special use areas of low or limited development. They include small designated natural areas and can include urban greenspaces (mowed and landscaped areas) of any size. These areas are considered developed but have predominantly passive uses, few structures, and limited impervious areas. Typical facilities include walking/hiking trails, picnic areas, gardens, and open grass areas. These areas can coincide with greenways and shared-use pathways, but primarily act as a space for passive recreation.
This page left intentionally blank