Boulder MARKET UPDATE
Boulder County is filled with communities that offer a variety of lifestyles and opportunities for homebuyers to create the life they love. As a national leader in sustainability efforts and bountiful recreation options, Boulder County attracts those looking for a combination of exciting city luxuries and proximity to nature that few other areas offer. Over the past few years, Boulder County and the unique communities within it have seen strong real estate activity because of the unique lifestyle the area provides.

Boulder’s real estate market is starting off 2023 on a positive note and outperforming many conservative expectations. The number of homes sold in Boulder County slightly decreased in comparison to 2022 Through March of this year, there have been 736 homes sold— down 0.8% from 2022. However, low inventory coupled with continued buyer demand resulted in housing prices remaining strong and a decrease in the days on market. After a slow end of 2022, momentum is certainly building in Denver’s real estate market.
While rising interest rates mean that buyers have less purchasing power and sellers have come down ever so slightly on pricing, limited inventory and high demand still give sellers a lot of control in this market. During the first quarter of the year, the average price for a single-family home in Boulder County is $924,021—down 5.8% from 2022.
Boulder’s individual neighborhoods vary in market trends, as there are many distinctions even within this small geographic region. We are seeing a wide variance in buyer demand for certain neighborhoods, subdivisions and even buildings. In the first quarter of 2023, North Boulder saw a 8.1% average price increase compared to 2022, and the South Boulder neighborhood saw a —30.9% decrease for the same time period.
We recognize each locality is unique and no two regions respond to market shifts the same way. To aid in presenting an accurate picture of each of the areas that make up Boulder County, LIV Sotheby’s International Realty is proud to present our Micro-Market Report, representing the metrics of many key and beloved neighborhoods.
Boulder County
coloradomicroreports.com
Based on Information from IRES, LLC and REColorado for the period January 1st, 2023 - March 31th, 2023. This representation is based in whole or in part on data supplied by IRES, LLC and REColorado. IRES, LLC and REColorado does not guarantee nor is in any way responsible for its accuracy. Data maintained by IRES, LLC and REColorado may not reflect all real estate activity in the market.
January through March 2022 2022 % Change New Listings 1,296 1,240 -4.3% Sold Listings (All Properties) 742 736 -0.8% Sold Single Family 466 447 -4.1% Sold Condos 246 247 0.4% Average Days on Market 57 70 22.8% Average Price $980,833 $924,021 -5.8% % Sold Price to List Price 103.3% 98.1% -5.0% Total Sold Sales Volume $727,778,009 $680,079,523 -6.6%
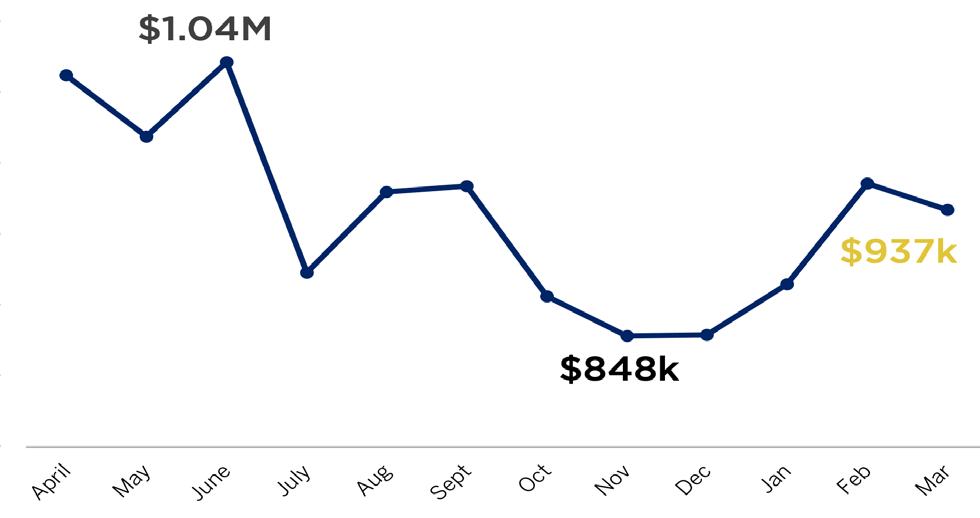
Average Sales Price (All Properties)
MICRO MARKET REPORT | Boulder JANUARY - MARCH 2023 • COLORADOMICROREPORTS.COM livsothebysrealty.com BOULDER NEIGHBORHOODS
1. Arvada
2. Boulder County Plains
3. Broomfield
4. Central Boulder & Historic District
5. Downtown Boulder
6. East Boulder & Gunbarrel
7. Erie / Southwest
Weld County
8. Foothills Communities
9. Lafayette
10. Longmont
11. Louisville
12. Lyons
13. Mountain & Canyon Communities
14. North Boulder
Westminster 7 5 2 1 8 9 4 6 3 10 11 12 13 14 15 18 17 16
15. South Boulder 16. Superior 17. University Hill & Chautauqua 18.
61.4%
The average home price in Boulder increased by 61.4% in the first quarter of 2023 compared to that of 2022.
Northwest of Denver, Arvada holds the spot as Colorado’s eighth largest city, while still boasting small-town charm. Popular attractions and amenities include the Arvada Center, Apex Center, Olde Town, and 125 miles of hiking, biking, and horseback riding trails.
BOULDER (CITY) ARVADA BOULDER COUNTY PLAINS Niwot, Somerset Meadows, White Hawk Ranch, Fairview Estates, Paragon Estates January through March 2022 2023 % Change Average Price $838,239 $742,434 -11.4% Average Days on Market 40 65 62.5% Highest Price $8,515,000 $3,650,000 -57.1% Properties Sold 280 326 16.4% % Sold Price to List Price 102.2% 97.8% -4.3% Total Sold Sales Volume $234,706,881 $242,033,486 3.1% January through March 2022 2023 % Change New Listings 414 176 -57.5% Sold Listings (All Properties) 327 267 -18.3% Sold Single Family 161 146 -9.3% Sold Condos 151 111 -26.5% Average Days on Market 57 62 8.8% Average Price $789,098 $1,273,452 61.4% % Sold Price to List Price 105.6% 98.2% -7.0%
January through March 2022 2023 % Change Average Price $655,193 $615,948 -6.0% Average Days on Market 21 45 114.3% Highest Price $1,795,000 $2,010,000 12.0% Properties Sold 567 452 -20.3% % Sold Price to List Price 105.4% 99.4% -5.7% Total Sold Sales Volume $371,494,598 $278,408,455 -25.1%
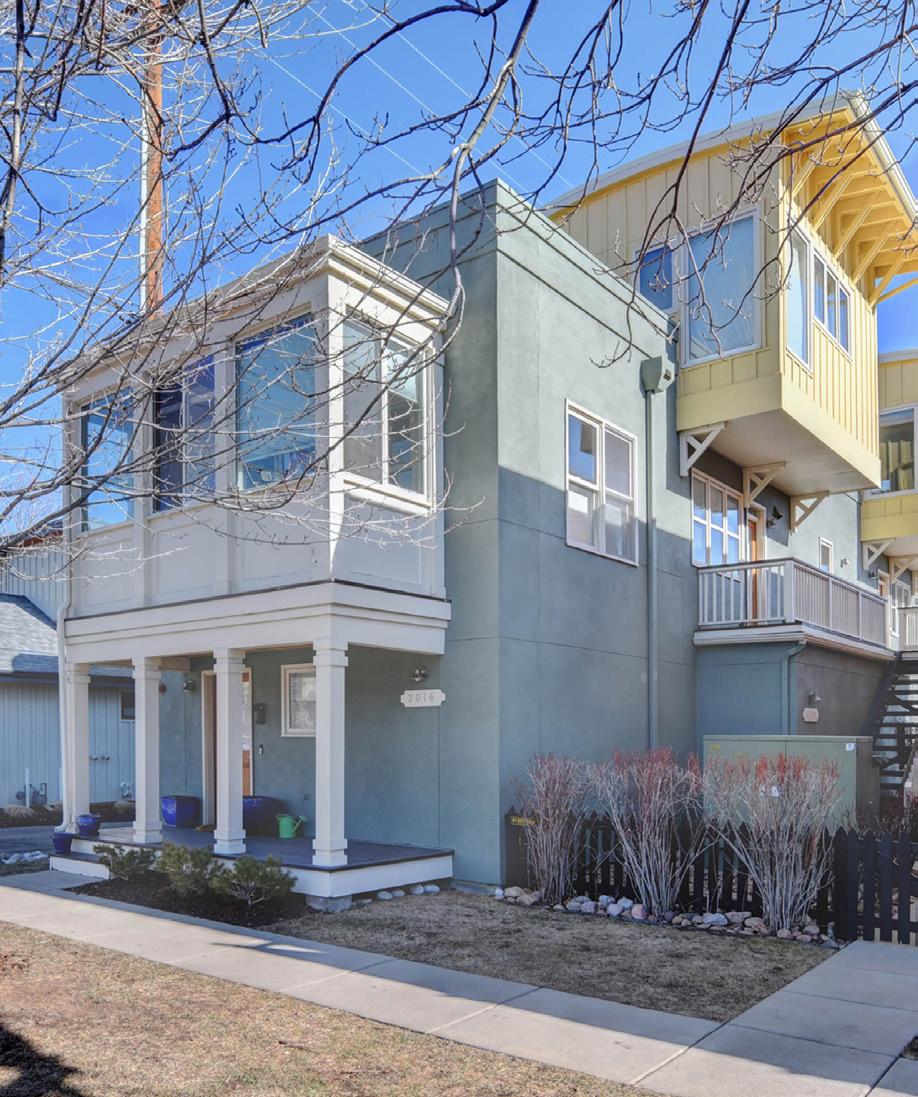
Stretching across a handful of smaller neighborhoods, Central & Historic District is an expansive area. Residents of this neighborhood enjoy the peace and serenity of its tree-lined streets and convenient access to Pearl Street Mall.
32.8%
The average home sale price in downtown Boulder increased by 32.8% in the first quarter of 2023 compared to that of 2022.
January through March 2022 2023 % Change Average Price $1,556,190 $2,066,776 32.8% Average Days on Market 85 73 -14.1% Highest Price $3,800,000 $5,000,000 31.6% Properties Sold 10 7 -30.0% % Sold Price to List Price 97.8% 97.7% -0.2% Total Sold Sales Volume $15,561,900 $14,467,435 -7.0% January through March 2022 2023 % Change Average Price $690,643 $705,056 2.1% Average Days on Market 18 55 205.6% Highest Price $2,750,000 $2,300,142 -16.4% Properties Sold 240 217 -9.6% % Sold Price to List Price 103.5% 99.0% -4.4% Total Sold Sales Volume $165,754,252 $152,997,070 -7.7% January through March 2022 2023 % Change Average Price $1,558,757 $1,615,382 3.6% Average Days on Market 86 67 -22.1% Highest Price $3,920,000 $4,950,000 26.3% Properties Sold 60 38 -36.7% % Sold Price to List Price 102.6% 97.0% -5.5% Total Sold Sales Volume $93,525,393 $61,384,500 -34.4% DOWNTOWN BOULDER CENTRAL & HISTORIC DISTRICT BROOMFIELD
14.0%
The highest home sale price in East Boulder & Gunbarrel increased by 14.0% in the first quarter of 2023 compared to that of 2022.
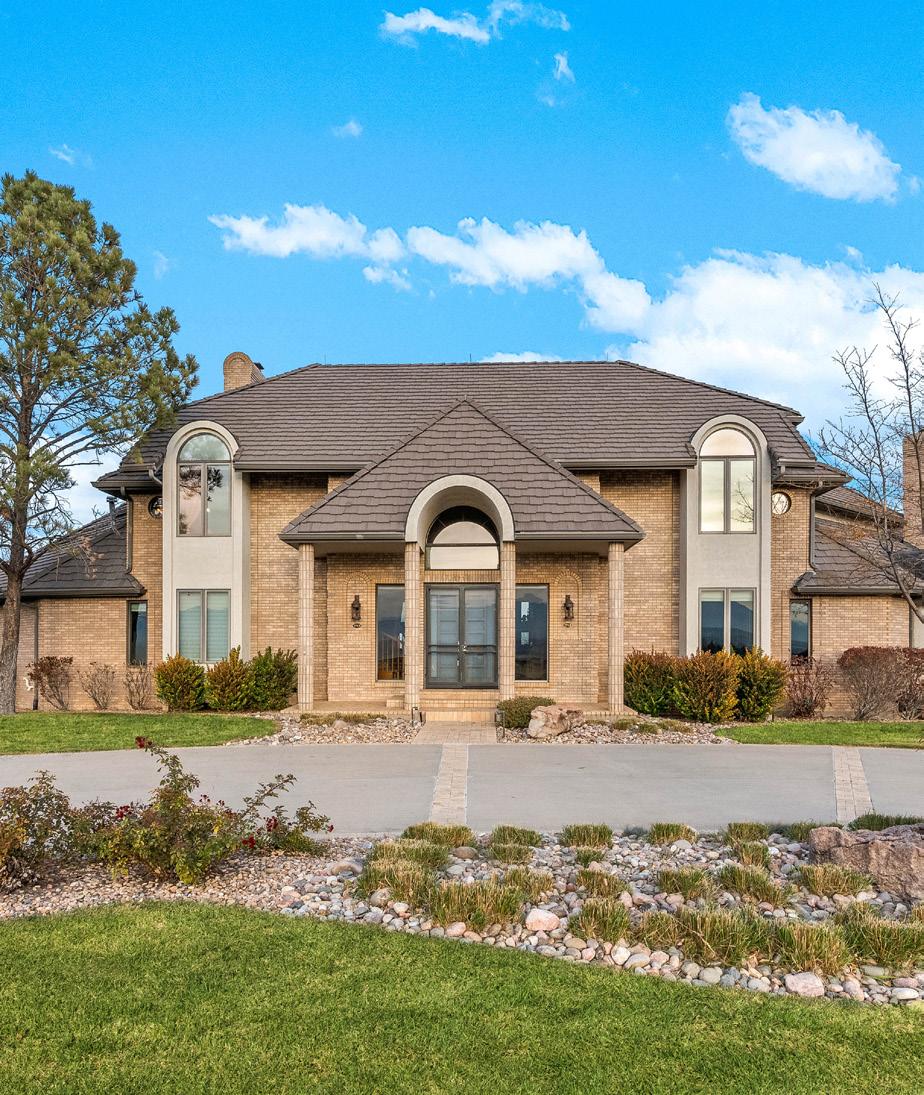
The Foothills Communities are nestled against the backdrop of Boulder Open Space where the plains meet the mountains. Larger properties are common in these areas, and many have direct access to open space and trails.
EAST BOULDER & GUNBARREL ERIE/SOUTHWEST WELD COUNTY FOOTHILLS COMMUNITIES Pine Brook Hills, Boulder Heights, Lake of the Pines, Jamestown, Eldorado Springs January through March 2022 2023 % Change Average Price $1,308,898 $1,353,939 3.4% Average Days on Market 60 68 13.3% Highest Price $5,590,000 $9,810,000 75.5% Properties Sold 256 217 -15.2% % Sold Price to List Price 102.2% 97.9% -4.3% Total Sold Sales Volume $335,077,835 $293,804,696 -12.3% January through March 2022 2023 % Change Average Price $947,701 $864,636 -8.8% Average Days on Market 46 44 -4.3% Highest Price $4,300,000 $4,900,000 14.0% Properties Sold 119 97 -18.5% % Sold Price to List Price 105.1% 99.2% -5.7% Total Sold Sales Volume $112,776,374 $83,869,731 -25.6% Erie, Frederick, Firestone, Dacono January through March 2022 2023 % Change Average Price $642,855 $603,846 -6.1% Average Days on Market 41 63 53.7% Highest Price $2,300,000 $2,200,000 -4.3% Properties Sold 170 291 71.2% % Sold Price to List Price 102.8% 98.5% -4.2% Total Sold Sales Volume $109,285,318 $175,719,143 60.8%
In Lafayette, you can find plenty of greenbelts, parks, open spaces, and bikeways, allowing residents to enjoy the beauty of Colorado and the Rocky Mountains.
5.9%
The number of properties sold in Longmont increased by 5.9% in the first quarter of 2023 compared to that of 2022.
January through March 2022 2023 % Change Average Price $967,876 $813,601 -15.9% Average Days on Market 38 96 152.6% Highest Price $2,350,000 $2,695,000 14.7% Properties Sold 38 48 26.3% % Sold Price to List Price 108.2% 95.8% -11.5% Total Sold Sales Volume $36,779,275 $39,052,859 6.2% January through March 2022 2023 % Change Average Price $791,718 $682,093 -13.8% Average Days on Market 61 58 -4.9% Highest Price $3,895,000 $2,400,000 -38.4% Properties Sold 63 71 12.7% % Sold Price to List Price 106.1% 99.5% -6.2% Total Sold Sales Volume $49,878,220 $48,428,635 -2.9% January through March 2022 2023 % Change Average Price $713,042 $675,490 -5.3% Average Days on Market 35 68 94.3% Highest Price $8,515,000 $3,650,000 -57.1% Properties Sold 236 250 5.9% % Sold Price to List Price 102.5% 98.3% -4.1% Total Sold Sales Volume $168,277,811 $168,872,430 0.4% LOUISVILLE LONGMONT LAFAYETTE
176.4%
The average number of days on market in Lyons increased by 176.4% in the first quarter of 2023 compared to that of 2022.
8.1%
The average home sale price in North Boulder increased by 8.1% in the first quarter of 2023 compared to that of 2022.
LYONS MOUNTAIN & CANYON COMMUNITIES NORTH BOULDER January through March 2022 2023 % Change Average Price $960,538 $761,816 -20.7% Average Days on Market 55 152 176.4% Highest Price $2,825,000 $1,675,000 -40.7% Properties Sold 13 12 -7.7% % Sold Price to List Price 101.8% 96.8% -5.0% Total Sold Sales Volume $12,487,000 $9,141,790 -26.8%
Nederland, Allenspark, Gilpin County January through March 2022 2023 % Change Average Price $661,127 $615,168 -7.0% Average Days on Market 70 97 38.6% Highest Price $2,550,000 $1,850,000 -27.5% Properties Sold 27 40 48.1% % Sold Price to List Price 98.0% 97.7% -0.3% Total Sold Sales Volume $17,850,420 $24,606,700 37.8% January through March 2022 2023 % Change Average Price $1,060,062 $1,073,091 1.2% Average Days on Market 45 49 8.9% Highest Price $5,590,000 $2,700,000 -51.7% Properties Sold 75 47 -37.3% % Sold Price to List Price 103.9% 98.7% -5.0% Total Sold Sales Volume $79,504,650 $50,435,278 -36.6%
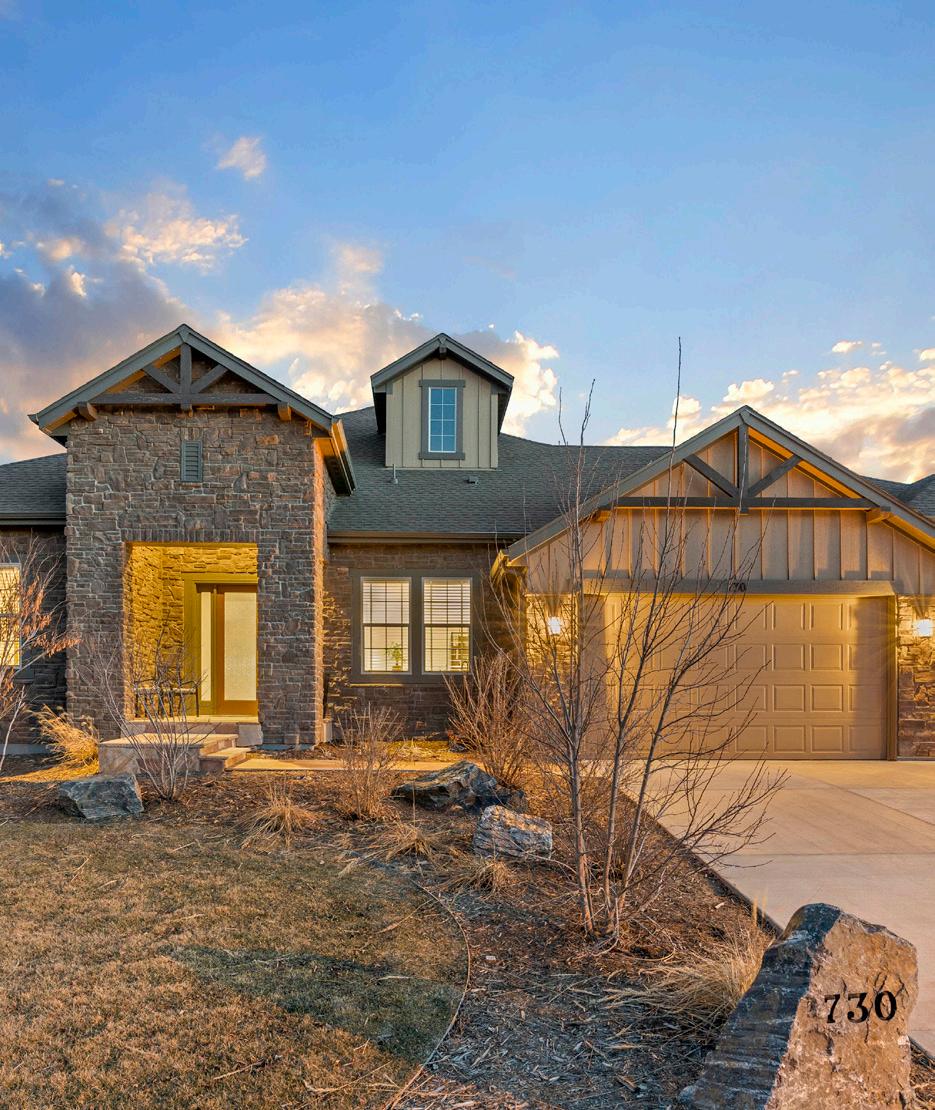
Residents love South Boulder for the generous open space, hiking trails, and family-friendly atmosphere. South Boulder includes neighborhoods like Table Mesa, Devil’s Thumb, and Shanahan Ridge.
48.0%
The number of homes sold in Superior increased by 48.0% in the first quarter of 2023 compared to that of 2022.
January through March 2022 2023 % Change Average Price $1,616,360 $2,397,971 48.4% Average Days on Market 44 67 52.3% Highest Price $3,960,000 $9,810,000 147.7% Properties Sold 20 22 10.0% % Sold Price to List Price 99.6% 99.1% -0.6% Total Sold Sales Volume $32,327,197 $52,755,372 63.2% January through March 2022 2023 % Change Average Price $1,131,037 $1,168,609 3.3% Average Days on Market 51 49 -3.9% Highest Price $3,960,000 $2,700,000 -31.8% Properties Sold 42 39 -7.1% % Sold Price to List Price 99.6% 99.5% -0.1% Total Sold Sales Volume $47,503,552 $45,575,750 -4.1% January through March 2022 2023 % Change Average Price $838,417 $781,213 -6.8% Average Days on Market 25 88 252.0% Highest Price $1,500,000 $1,301,245 -13.3% Properties Sold 25 37 48.0% % Sold Price to List Price 109.3% 99.0% -9.4% Total Sold Sales Volume $20,960,433 $28,904,895 37.9% UNIVERSITY HILL & CHAUTAUQUA SUPERIOR SOUTH BOULDER
WESTMINSTER January through March 2022 2023 % Change Average Price $567,385 $518,630 -8.6% Average Days on Market 20 13 -35.0% Highest Price $3,000,000 $3,000,000 0.0% Properties Sold 376 301 -19.9% % Sold Price to List Price 106.4% 99.6% -6.4% Total Sold Sales Volume $213,336,605 $156,107,696 -26.8%
04 07 300 28 350+ NATIONAL PARKS MOUNTAIN RANGES AVG DAYS OF SUNSHINE SKI AREAS & RESORTS CRAFT BREWERIES WHY COLORADO?
MICRO MARKET REPORT | Boulder JANUARY - MARCH 2023 • COLORADOMICROREPORTS.COM