Micro Market Report


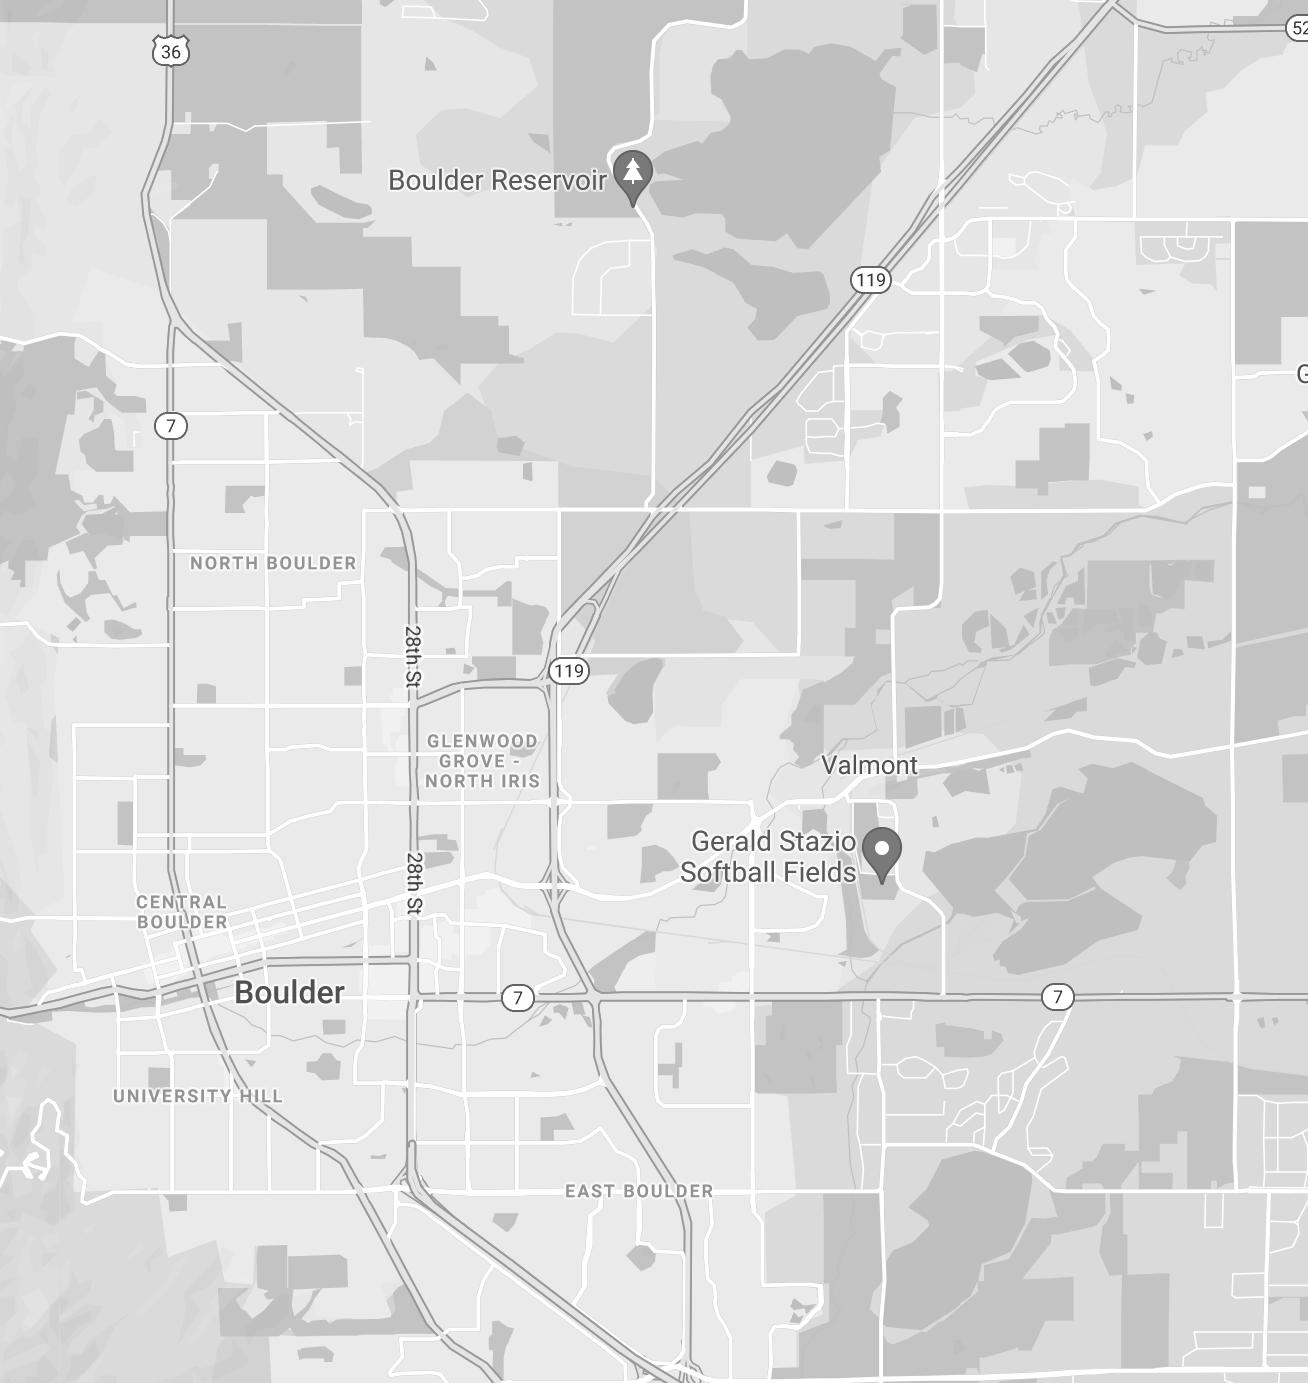
2493 Greenfield Lane1940 23rd Street BOULDER
QUARTER 3 2022

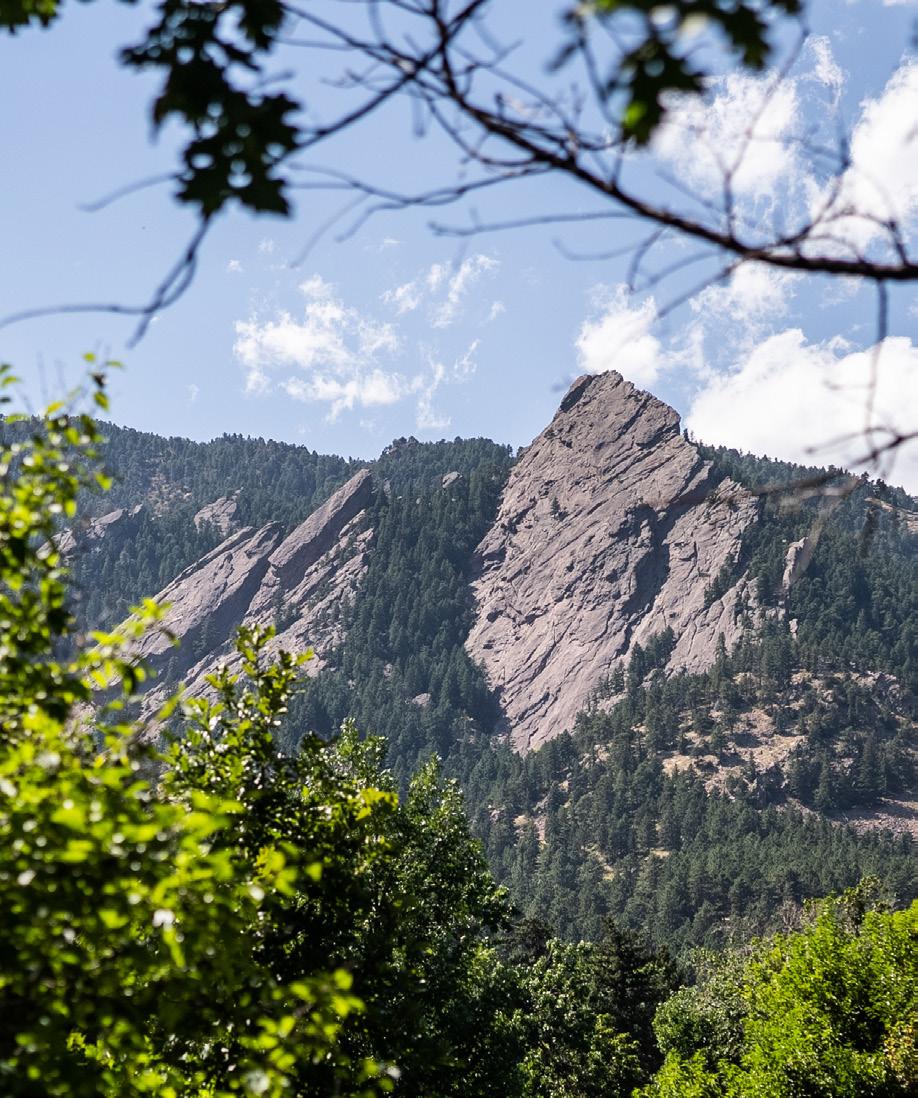
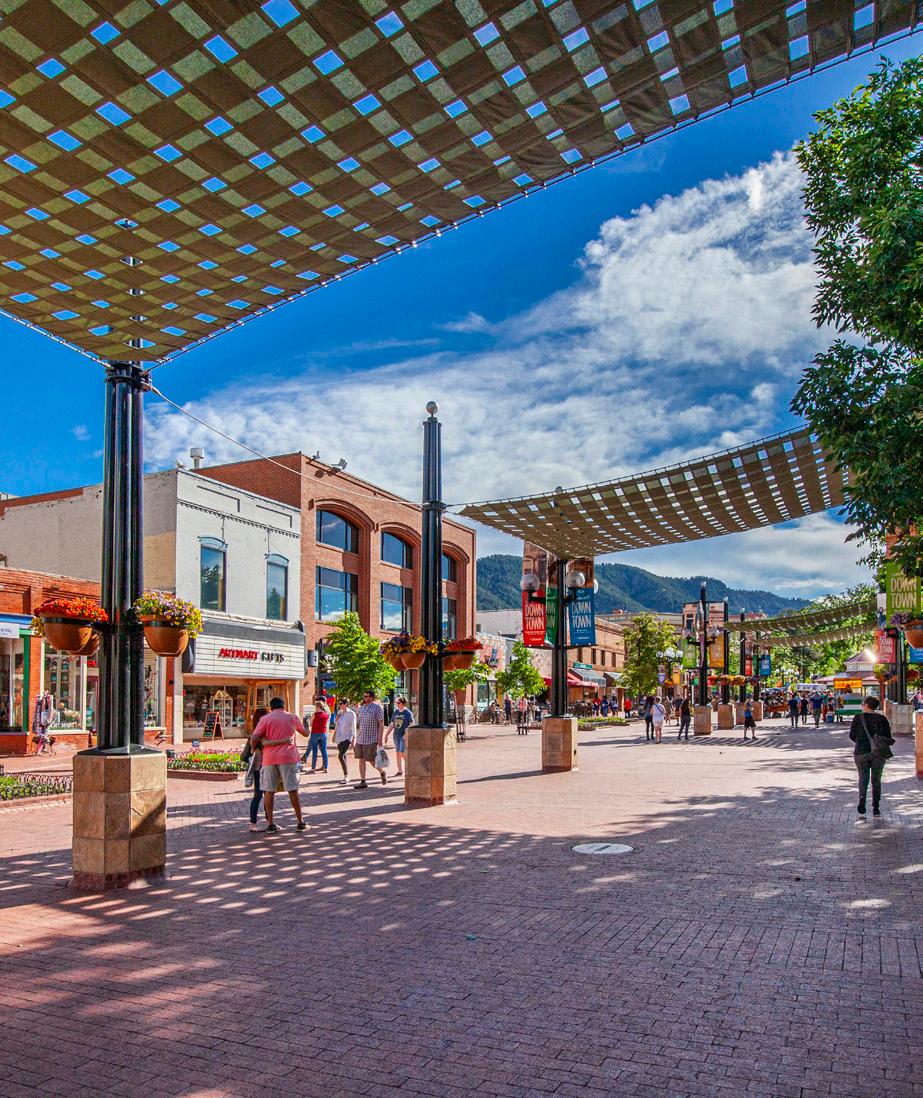
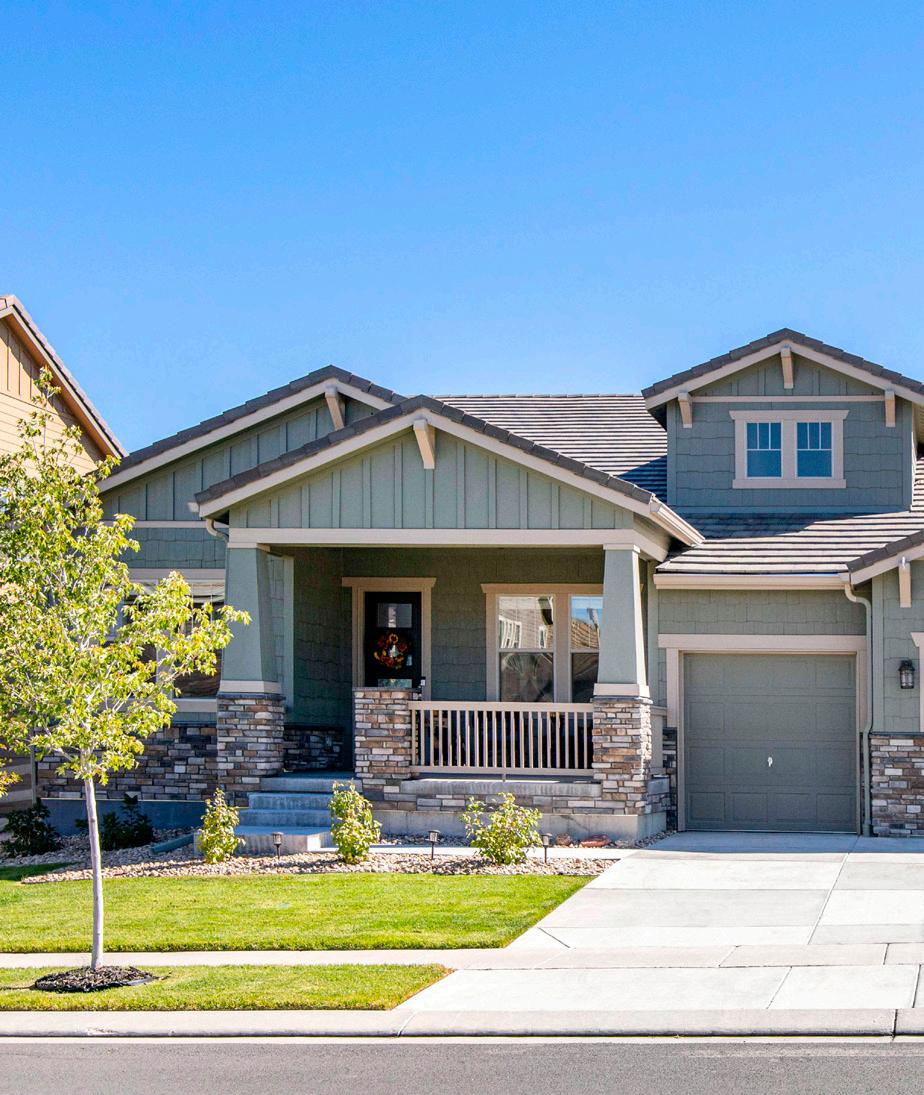
Just north of Denver, the Boulder County community has something for everyone. Here, hundreds of miles of hiking and biking trails offer easy access to some of the Front Range’s most beautiful natural spaces while the community’s business, arts, and entertainment scene provide ample opportunity for creating the life you love every day. For these reasons, the area has been a long-time favorite destination for buying and selling homes in Colorado.
LIV Sotheby’s International Realty produces a Micro Market Report focused on Boulder County and each of the unique neighborhoods within it. The report examines key performance indicators from January through September of 2022 and compares them to the same period in 2021. In comparison to the real estate boom that was observed here during the same period last year, Boulder County saw a 19.5% decrease in the number of listings sold. The average sold price for homes in this county was $952,846 through September. Those listings sold spent an average of 47 days on the market – a 11.3% decrease from Q3 of 2021.
Most neighborhoods within the Boulder County community saw slight decreases in total property sales. In the city of Boulder, overall sales volume decreased by 25.8%. While the city of Arvada saw a 9.8% decrease in the number of homes sold, this community has the highest number of sales through Q3, totaling 1,993 properties sold.
The average price for sold homes in Mountain and Canyon Communities remained relatively steady in Q3 of 2022 as it did in Q3 of 2021. Homes in this neighborhood sold for an average price of $556,625, which is just 1.8% higher in comparison. This same community was also the most affordable area in which to purchase a home through September of this year. In downtown Boulder, listings have appreciated by 56.9% to bring the average sale price to $1,933,711–
a significant increase from the same time just one year ago.
Days on market is an important indicator and can often reflect the demand for real estate in each area. In the city of Boulder, the average days on market decreased by 12.8%, dipping from 39 days down to an average of 34 days – the shortest average time within the Boulder County community. The Foothills Communities, which includes Pinebrook Hills, Boulder Heights, Lake of Pines, Jamestown, and Eldorado Springs, saw a 10.8% decrease in the average days on market. Homes in these neighborhoods are selling within an average of 58 days.
Boulder is an incredible place to live with convenient access to culture, city life, and captivating mountain views. The real estate market in this area continues to show signs of strength and growth as it attracts more consumers to its thriving communities.

New Listings
Sold Listings (All Properties)
Sold Single Family
3,259 -16.5%
3,731 -19.5%
2,456 -19.7%
Sold Condos 1,375 1,085 -21.1%
Average Days on Market 53 47 -11.3%
Average Price $842,785 $952,846 13.1%
% Sold Price to List Price 101.7% 102.2% 0.5%
Total Sold Sales Volume $3,906,309,084 $3,555,068,830 -9.0%
Based on Information from IRES, LLC and REColorado for the period January 1st, 2022 - September 30th, 2022. This representation is based in whole or in part on data supplied by IRES, LLC and REColorado. IRES, LLC and REColorado does not guarantee nor is in any way responsible for its accuracy. Data maintained by IRES, LLC and REColorado may not reflect all real estate activity in the market.
The average home price in Boulder increased by 15.9% January through September 2022 compared to that of 2021.
January through September 2021 2022 % Change
New Listings 1,479 1,168 -21.0%
Sold Listings (All Properties) 1,807 1,340 -25.8%
Sold Single Family 967 707 -26.9%
Sold Condos 763 574 -24.8%
Average Days on Market 62 53 -14.5%
Average Price $1,089,756 $1,263,000 15.9%
% Sold Price to List Price 100.6% 101.8% 1.2%
Northwest of Denver, Arvada holds the spot as Colorado’s eighth largest city, while still boasting small-town charm. Popular attractions and amenities include the Arvada Center, Apex Center, Olde Town, and 125 miles of hiking, biking, and horseback riding trails.
January through September
2022 % Change
Average Price $576,905 $663,764 15.1%
Average Days on Market 42 48 14.3%
Highest Price $7,500,000 $2,680,000 -64.3%
Properties Sold 2,210 1,993 -9.8%
% Sold Price to List Price 103.8% 103.2% -0.6%
Total Sold Sales Volume $1,274,959,726 $1,322,882,053 3.8%
2022 % Change
Average Price $710,752 $790,357 11.2%
Average Days on Market 52 43 -17.3%
Highest Price $8,150,000 $10,000,000 22.7%
Properties Sold 1,827 1,463 -19.9%
% Sold Price to List Price 101.8% 102.2% 0.4%
Total Sold Sales Volume $1,298,543,092 $1,156,291,973 -11.0%
Average
Average Price
Average Days
Highest Price
Average Price
Average
Highest
Stretching across a handful of smaller neighborhoods, Central & Historic District is an expansive area. Residents of this neighborhood enjoy the peace and serenity of its tree-lined streets and convenient access to Pearl Street Mall.
The average home price in East Boulder & Gunbarrel increased by 26.7% January through September 2022 compared to that of 2021.
January through September 2021 2022 % Change
Average Price $770,939 $976,499 26.7%
Average Days on Market 50 39 -22.0%
Highest Price $5,750,000 $5,900,000 2.6%
Properties Sold 655 453 -30.8%
% Sold Price to List Price 102.5% 102.8% 0.3%
Total Sold Sales Volume $504,965,268 $442,353,958 -12.4%
The Foothills Communities are nestled against the backdrop of Boulder Open Space where the plains meet the mountains. Larger properties are common in these areas, and many have direct access to open space and trails.
January through September 2021 2022 % Change
Average Price $554,158 $660,471 19.2%
Average Days on Market 51 47 -7.8%
Highest Price $2,100,000 $4,800,000 128.6%
Properties Sold 1,366 1,306 -4.4%
% Sold Price to List Price 102.8% 102.1% -0.7%
Total Sold Sales Volume $756,979,365 $862,575,218 13.9%
January through September
2021 2022 % Change
Average Price $1,191,875 $1,341,888 12.6%
Average Days on Market 65 58 -10.8%
Highest Price $7,900,000 $10,000,000 26.6%
Properties Sold 1,413 1,059 -25.1%
% Sold Price to List Price 100.4% 101.4% 1.0%
Total Sold Sales Volume $1,684,118,835 $1,421,059,099 -15.6%
Pine Brook Hills, Boulder Heights, Lake of the Pines, Jamestown, Eldorado Springs
Average Price
Average Days on Market
Highest Price
Properties Sold
% Sold Price to List Price
Sold Sales Volume $324,471,978
-0.8%
-1.4%
In Lafayette, you can find plenty of greenbelts, parks, open spaces, and bikeways, allowing residents to enjoy the beauty of Colorado and the Rocky Mountains.
January through
Average Price $630,072
Average Days on Market
-9.5%
Highest Price $8,150,000 $10,000,000 22.7%
Properties Sold 1,482 1,191 -19.6%
% Sold Price to List Price 102.1% 102.6% 0.5%
Total Sold Sales Volume $933,766,652 $815,785,185 -12.6%
The highest sale price in Longmont increased by 22.7% January through September 2022 compared to that of 2021.
January
Average Price
Average Days on Market
Highest Price
Properties Sold
% Sold Price to List Price
Total Sold Sales Volume
-1.8%
-13.7%
-0.2%
The average home price in Lyons increased by 22.0% January through September 2022 compared to that of 2021.
The highest sale price in North Boulder increased by 26.6% January through September 2022 compared to that of 2021.
2022 % Change
Average Price $675,682 $824,521 22.0%
Average Days on Market 72 59 -18.1%
Highest Price $2,100,000 $2,825,000 34.5%
Properties Sold 107 98 -8.4%
% Sold Price to List Price 100.6% 101.6% 1.0%
Total Sold Sales Volume $72,297,993 $80,803,097 11.8%
Average Price $546,516 $556,625 1.8%
Average Days on Market 99 71 -28.3%
Highest Price $12,000,000 $3,150,000 -73.8%
Properties Sold 282 229 -18.8%
% Sold Price to List Price 98.2% 98.1% -0.2%
Total Sold Sales Volume $154,117,593 $127,467,231 -17.3%
Average Price $1,013,283 $1,134,972 12.0%
Average Days on Market 47 48 2.1%
Highest Price $7,900,000 $10,000,000 26.6%
Properties Sold 341 264 -22.6%
% Sold Price to List Price 100.7% 102.7% 2.0%
Total Sold Sales Volume $345,529,462 $299,632,589 -13.3%
Average Price
Average Days on
Highest Price
Properties
%
Price
Sales Volume
January
Average Price $801,852
Average Days on Market
Highest Price $1,740,000 $1,625,000 -6.6%
Properties Sold
% Sold Price to List Price
Total Sold Sales Volume $139,522,275 $149,265,491
-2.1%
Residents love South Boulder for the generous open space, hiking trails, and family-friendly atmosphere. South Boulder includes neighborhoods like Table Mesa, Devil’s Thumb, and Shanahan Ridge.
The average home sale price in Superior increased by 5.8% January through September 2022 compared to that of 2021.
Average Price
Average Days on
Highest Price
% Sold Price to
Total
Price
Sales Volume
Average
Highest

MICRO MARKET REPORT | Boulder JANUARY SEPTEMBER 2022 • COLORADOMICROREPORTS.COM