Colorado Springs MARKET UPDATE
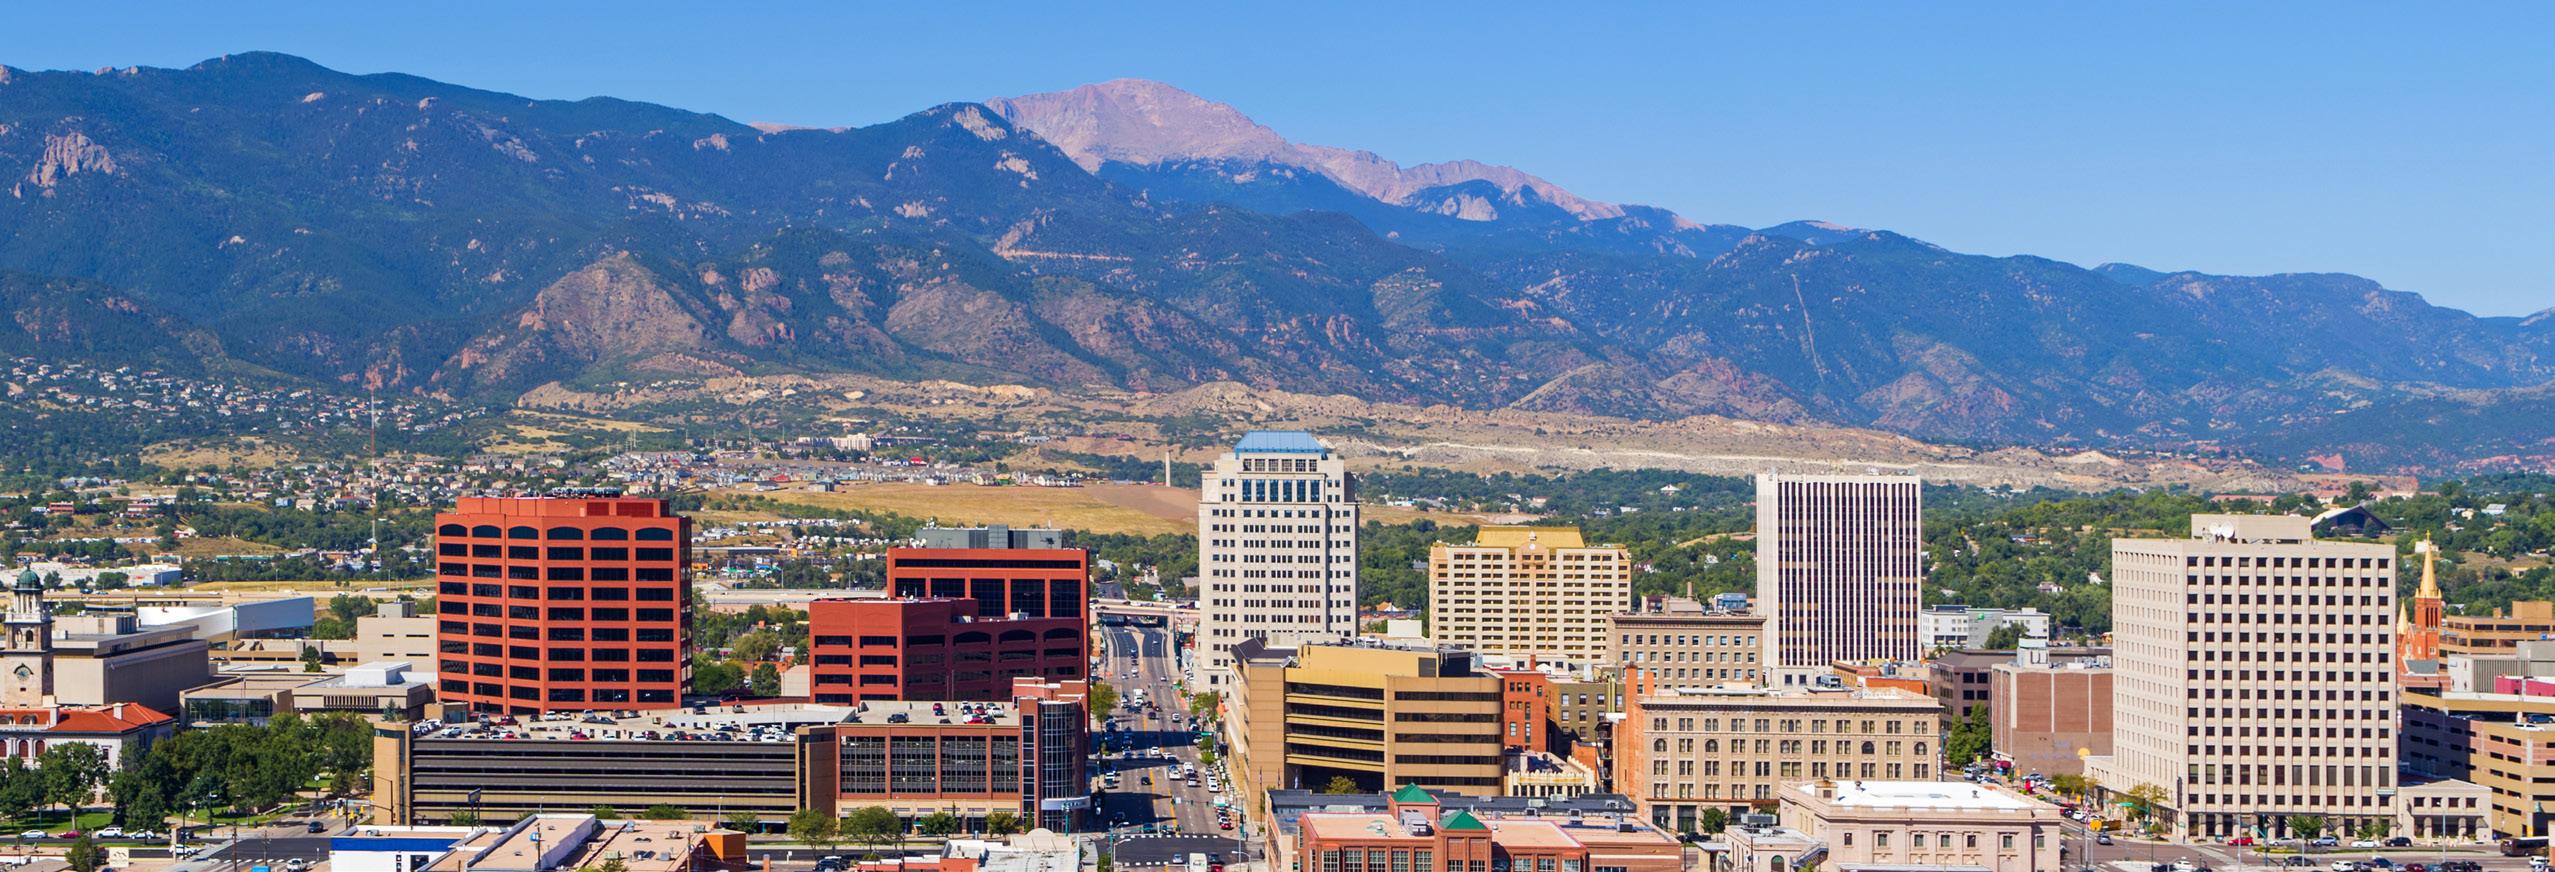
Colorado Springs, the state’s second largest city, is currently one of the most sought-after areas to live in the country. This colorful Colorado community offers its residents exciting entertainment options, unique cultural offerings, and enough outdoor activities to keep any adventurer satisfied. Thanks to the amazing array of lifestyles this city can cater to, more consumers are deciding to make this community their home.
Colorado Springs real estate market is starting off 2023 on a positive note and outperforming many conservative expectations. The number of homes sold across El Paso County decreased in comparison to 2022. Through March of this year, there have been 2,154 homes sold—down 24.8% from 2022. However, low inventory coupled with continued buyer demand resulted in housing prices remaining strong and a decrease in the days on market. After a slow end of 2022, momentum is certainly building in Colorado Springs’ real estate market.
While rising interest rates mean that buyers have less purchasing power and sellers have come down ever so slightly on pricing, limited inventory and high demand still give sellers a lot of control in this market. During the first quarter of the year, the average price home in
Colorado Springs is $517,859—down 1.5% from 2022. Colorado Springs’ individual neighborhoods vary in market trends, as there are many distinctions even within this small geographic region. We are seeing a wide variance in buyer demand for certain neighborhoods, subdivisions, and even buildings. In the first quarter of 2023, Mountain Shadows saw a 5.9% average price increase compared to 2022, and Broadmoor saw a 15.7% decrease for the same time period.
We recognize each locality is unique and no two regions respond to market shifts the same way. To aid in presenting an accurate picture of each of the areas that make up Colorado Springs, LIV Sotheby’s International Realty is proud to present our Micro Market Report, representing the metrics of many key and beloved neighborhoods.
Considering the lifestyle and market advantages that Colorado Springs provides to its residents, this community will continue to be a popular destination for those looking to buy and sell homes in the state.
Counties: El Paso, Teller
coloradomicroreports.com Based on information from the Pikes Peak REALTOR® Services Corp. (“RSC”), for the period January 1st, 2023 - March 31th, 2023. RSC does not guarantee or is in any way responsible for its accuracy. Data maintained by RSC may not reflect all real estate activity in the market. January through March 2022 2023 % Change New Listings 3,565 2,657 -25.5% Sold Listings (All Properties) 2,864 2,154 -24.8% Average Price $525,830 $517,859 -1.5% Average Days on Market 11 49 345.5% % Sold Price to Original List Price 103.00% 98.8% -4.1% Total Dollar Volume Sold $1,505,977,120 $1,115,468,286 -25.9%
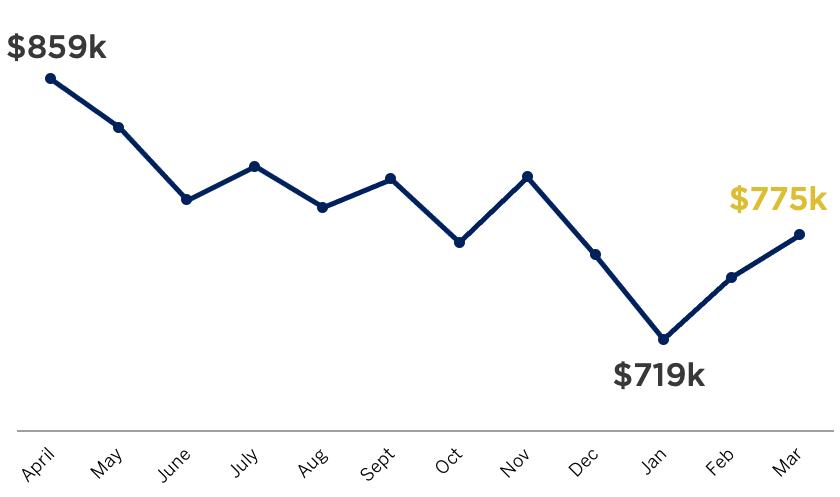
Average Sales Price (All Properties)
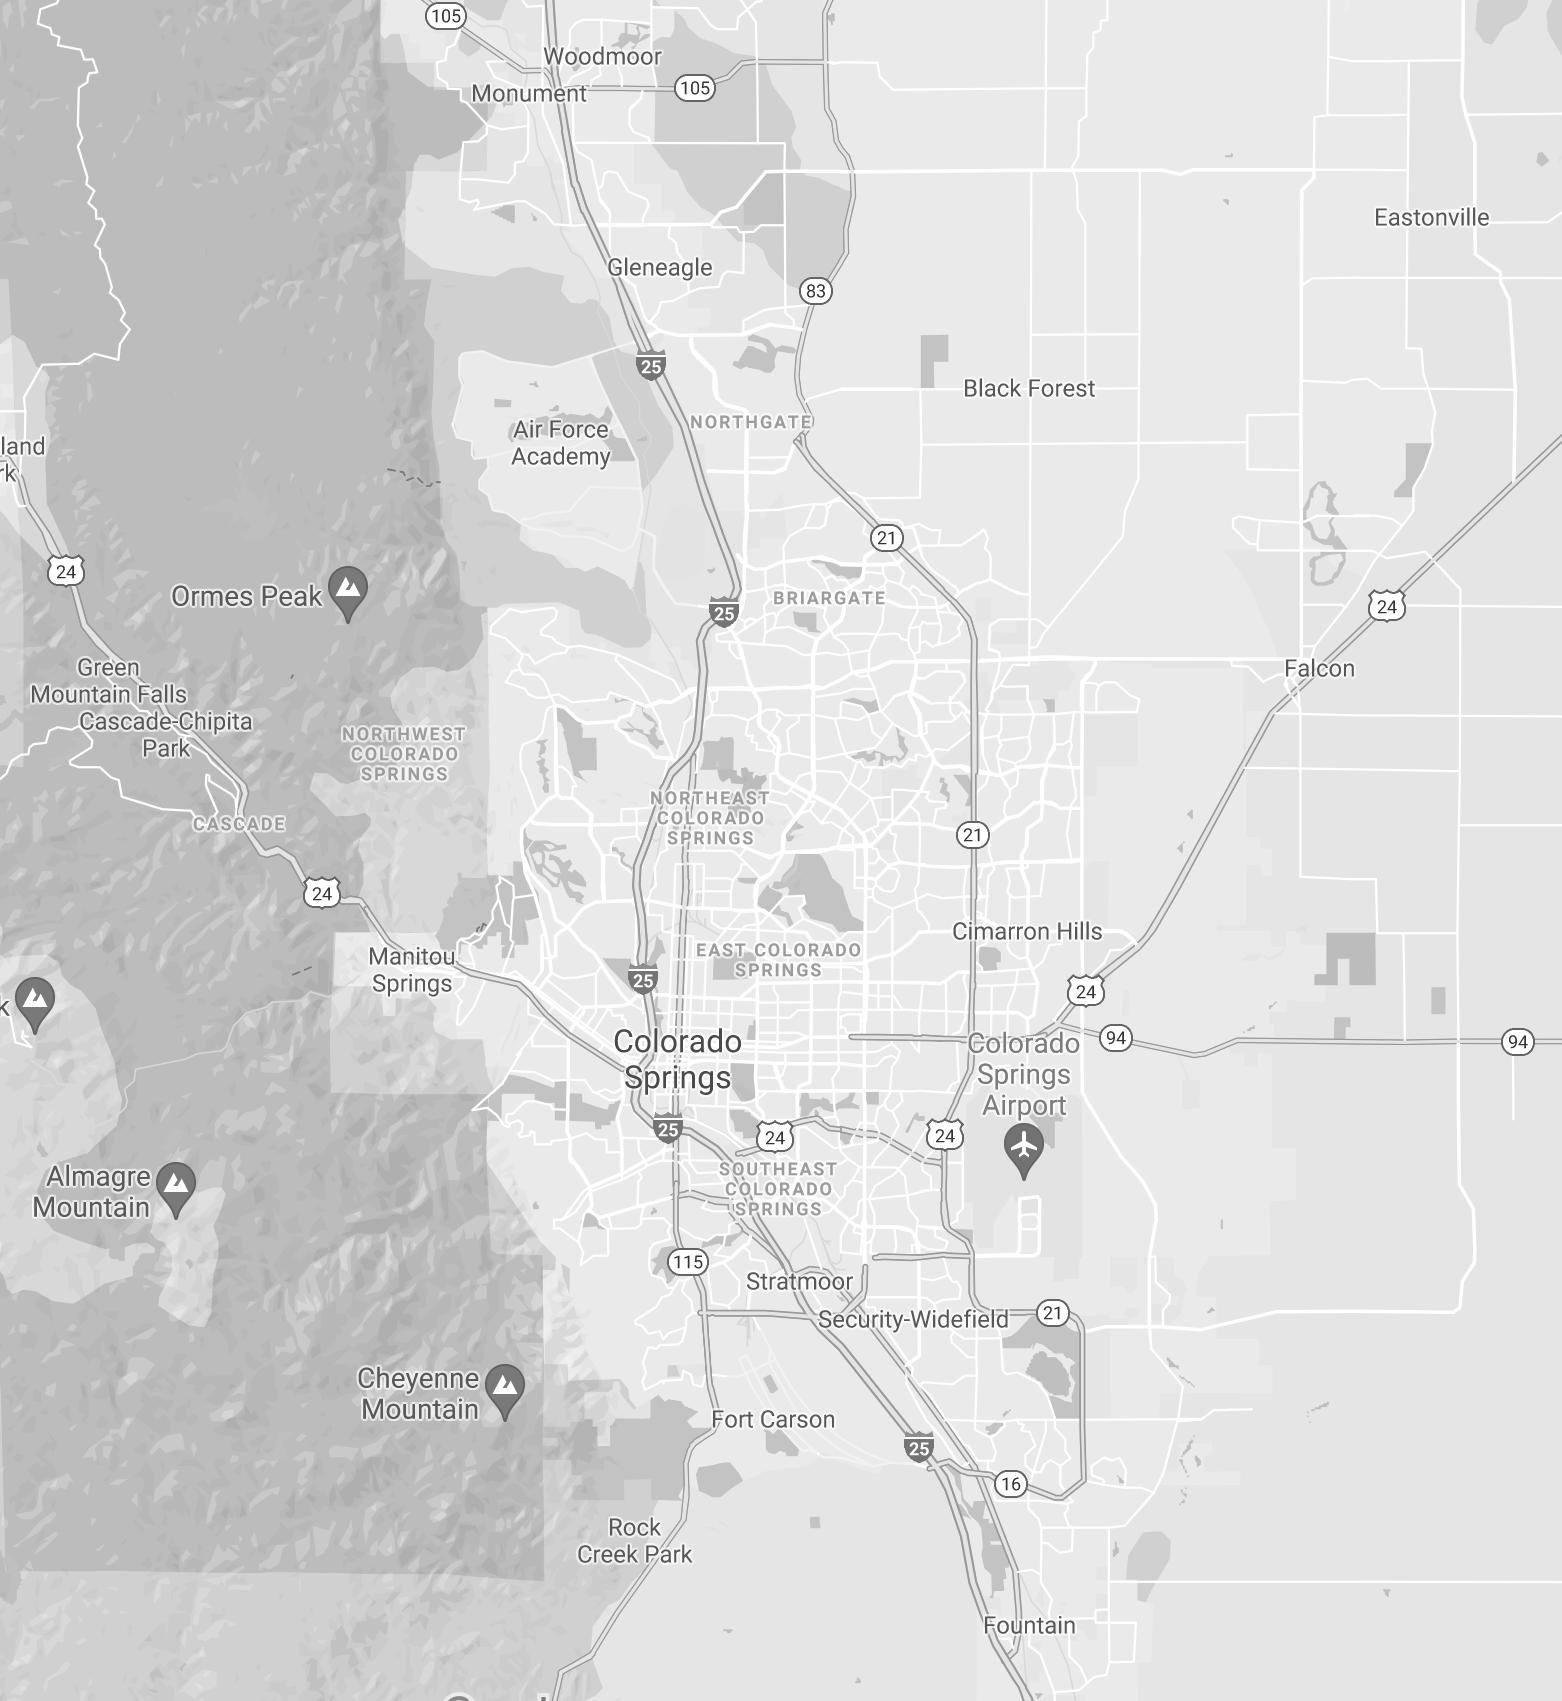
COLORADO SPRINGS NEIGHBORHOODS
MICRO MARKET REPORT | Colorado Springs JANUARY - MARCH 2023 • COLORADOMICROREPORTS.COM livsothebysrealty.com
1. Broadmoor
2. Broadmoor Bluffs/ The Spires
3. Broadmoor Resort
4. Cordera
5. Flying Horse
6. Kissing Camels
7. Mountain Shadows
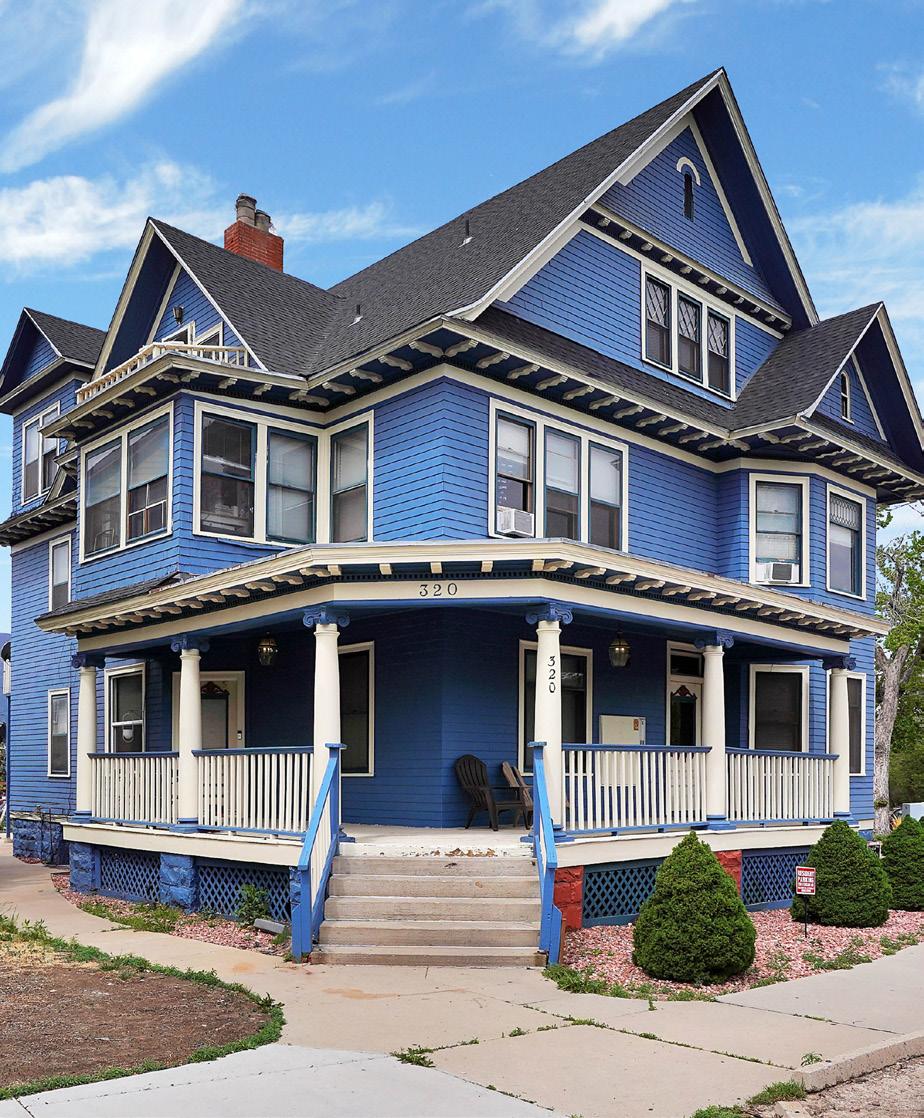
8. Old North End/ Patty Jewett
9. Peregrine
10. Pine Creek
11. Sanctuary Pointe/ Fox Run
12. Skyway
13. Wolf Ranch
12 7 5 9 13 3 10 2 14 4 11 1 8 6
14. Woodmoor
5.4%
The average home sale price in Broadmoor Bluffs/The Spires increased by 5.4% in the first quarter of 2023 compared to that of 2022.
BROADMOOR BROADMOOR RESORT January through March 2022 2023 % Change Average Price $1,975,000 $1,485,000 -24.8% Average Price Per Square Foot $282 $258 -8.5% Average Days on Market 242 4 -98.3% Highest Price $3,500,000 $1,485,000 -57.6% Properties Sold 3 1 -66.7% % Sold Price to List Price 91.1% 94.0% 3.2% January through March 2022 2023 % Change Average Price $1,253,281 $1,056,504 -15.7% Average Price Per Square Foot $255 $262 2.7% Average Days on Market 64 52 -18.8% Highest Price $3,500,000 $3,000,000 -14.3% Properties Sold 32 26 -18.8% % Sold Price to List Price 98.6% 97.9% -0.7% January through March 2022 2023 % Change Average Price $835,500 $880,417 5.4% Average Price Per Square Foot $212 $212 0.0% Average Days on Market 7 44 528.6% Highest Price $1,150,000 $1,050,000 -8.7% Properties Sold 10 6 -40.0% % Sold Price to List Price 103.1% 97.7% -5.2%
BROADMOOR BLUFFS/THE SPIRES
53.5%
The highest home sale price in Cordera increased by 53.5% in the first quarter of 2023 compared to that of 2022.
The Colorado lifestyle comes together in one magnificent vision at Flying Horse, where you’ll find elegant homes, breathtaking views, and a private resort-style athletic club and spa. With homes priced from the upper $400k’s to custom homes in the millions, there’s something for everyone.
January through March 2022 2023 % Change Average Price $964,246 $1,030,358 6.9% Average Price Per Square Foot $251 $250 -0.4% Average Days on Market 56 13 -76.8% Highest Price $1,900,000 $1,492,271 -21.5% Properties Sold 7 5 -28.6% % Sold Price to List Price 99.5% 99.3% -0.2% January through March 2022 2023 % Change Average Price $742,119 $857,538 15.6% Average Price Per Square Foot $200 $218 9.0% Average Days on Market 23 58 152.2% Highest Price $967,532 $1,484,733 53.5% Properties Sold 41 23 -43.9% % Sold Price to List Price 100.8% 98.8% -2.0% January through March 2022 2023 % Change Average Price $859,667 $947,913 10.3% Average Price Per Square Foot $202 $224 10.9% Average Days on Market 20 30 50.0% Highest Price $3,800,000 $3,500,000 -7.9% Properties Sold 159 130 -18.2% % Sold Price to List Price 100.5% 99.7% -0.8% KISSING CAMELS FLYING HORSE CORDERA
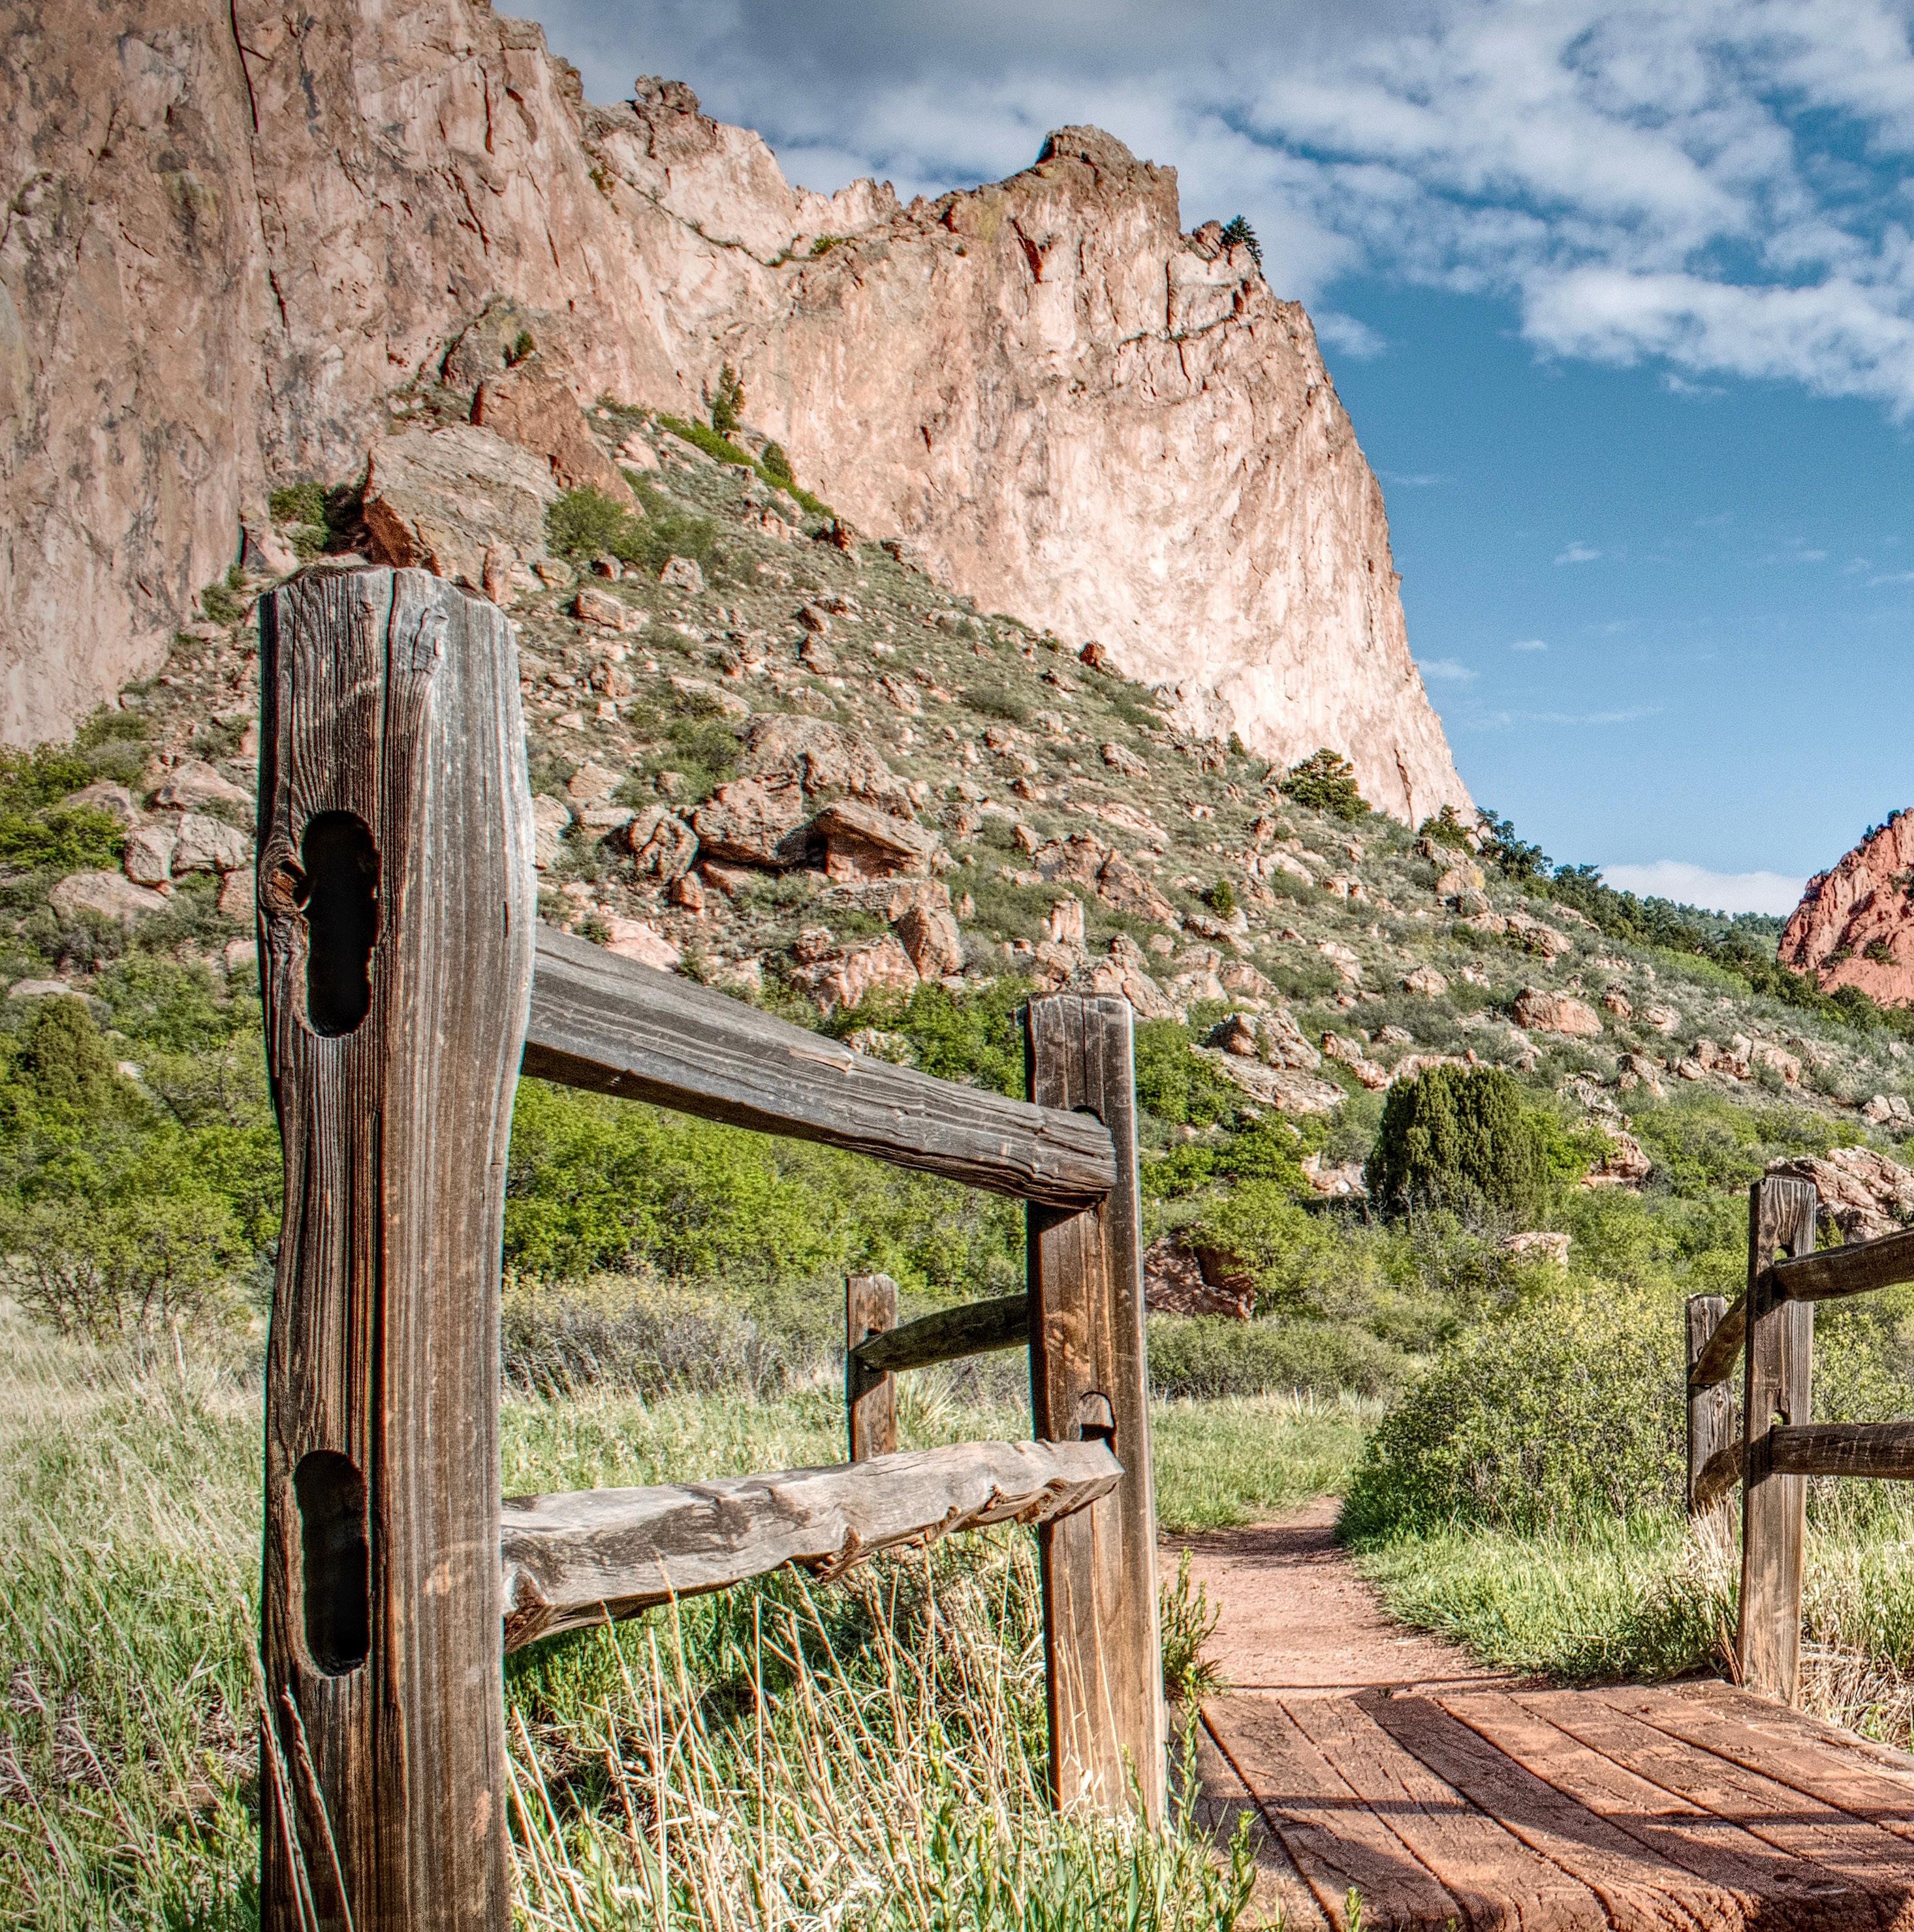
Mountain Shadows is a unique community built up against the Rocky Mountains. It’s located off of Centennial Boulevard and Flying W Ranch Road, just minutes from Garden of the Gods.
33.3%
The number of properties sold in Peregrine increased by 33.3% in the first quarter of 2023 compared to that of 2022.
MOUNTAIN SHADOWS OLD NORTH END/PATTY JEWETT PEREGRINE January through March 2022 2023 % Change Average Price $1,001,600 $813,625 -18.8% Average Price Per Square Foot $195 $189 -3.1% Average Days on Market 11 50 354.5% Highest Price $1,200,000 $1,010,000 -15.8% Properties Sold 3 4 33.3% % Sold Price to List Price 106.5% 97.7% -8.3% January through March 2022 2023 % Change Average Price $693,117 $733,750 5.9% Average Price Per Square Foot $208 $194 -6.7% Average Days on Market 28 41 46.4% Highest Price $1,102,500 $960,000 -12.9% Properties Sold 17 12 -29.4% % Sold Price to List Price 101.0% 98.7% -2.3% January through March 2022 2023 % Change Average Price $618,700 $595,309 -3.8% Average Price Per Square Foot $330 $257 -22.1% Average Days on Market 13 64 392.3% Highest Price $1,425,000 $1,725,000 21.1% Properties Sold 20 11 -45.0% % Sold Price to List Price 102.4% 97.2% -5.1%
27.2%
The average home sale price in Pine Creek increased by 27.2% in the first quarter of 2023 compared to that of 2022.
20.9%
The average price per square foot in Skyway increased by 20.9% in the first quarter of 2023 compared to that of 2022.
January through March 2022 2023 % Change Average Price $749,527 $864,500 15.3% Average Price Per Square Foot $239 $289 20.9% Average Days on Market 18 26 44.4% Highest Price $1,300,000 $1,750,000 34.6% Properties Sold 15 6 -60.0% % Sold Price to List Price 102.2% 98.5% -3.6% January through March 2022 2023 % Change Average Price $694,814 $884,031 27.2% Average Price Per Square Foot $198 $197 -0.5% Average Days on Market 3 50 1566.7% Highest Price $865,000 $1,195,000 38.2% Properties Sold 8 8 0.0% % Sold Price to List Price 104.1% 98.5% -5.4% January through March 2022 2023 % Change Average Price $923,921 $1,173,782 27.0% Average Price Per Square Foot $223 $232 4.0% Average Days on Market 6 117 1850.0% Highest Price $1,445,000 $1,862,412 28.9% Properties Sold 12 5 -58.3% % Sold Price to List Price 104.7% 99.2% -5.3% SKYWAY SANCTUARY POINTE/FOX RUN PINE CREEK
8.1%
The average price per square foot in Wolf Ranch increased by 8.1% in the first quarter of 2023 compared to that of 2022.
2.9%
The number of properties sold in Woodmoor increased by 2.9% in the first quarter of 2023 compared to that of 2022.
WOLF
WOODMOOR January through March 2022 2023 % Change Average Price $682,579 $668,931 -2.0% Average Price Per Square Foot $185 $200 8.1% Average Days on Market 57 93 63.2% Highest Price $885,000 $847,726 -4.2% Properties Sold 58 38 -34.5% % Sold Price to List Price 102.1% 99.0% -3.0% January through March 2022 2023 % Change Average Price $788,480 $680,294 -13.7% Average Price Per Square Foot $211 $187 -11.4% Average Days on Market 18 61 238.9% Highest Price $1,350,000 $950,000 -29.6% Properties Sold 34 35 2.9% % Sold Price to List Price 102.9% 98.6% -4.2%
RANCH

in your happy place The definition of paradise depends on your point of view. Find a home that makes each day more extraordinary than the last with LIV Sotheby’s International Realty. 719.578.8800 | livsothebysrealty.com
04 07 28 NATIONAL PARKS MOUNTAIN RANGES SKI AREAS & RESORTS
AVG DAYS OF SUNSHINE ANNUALY CRAFT BREWERIES 300 350+
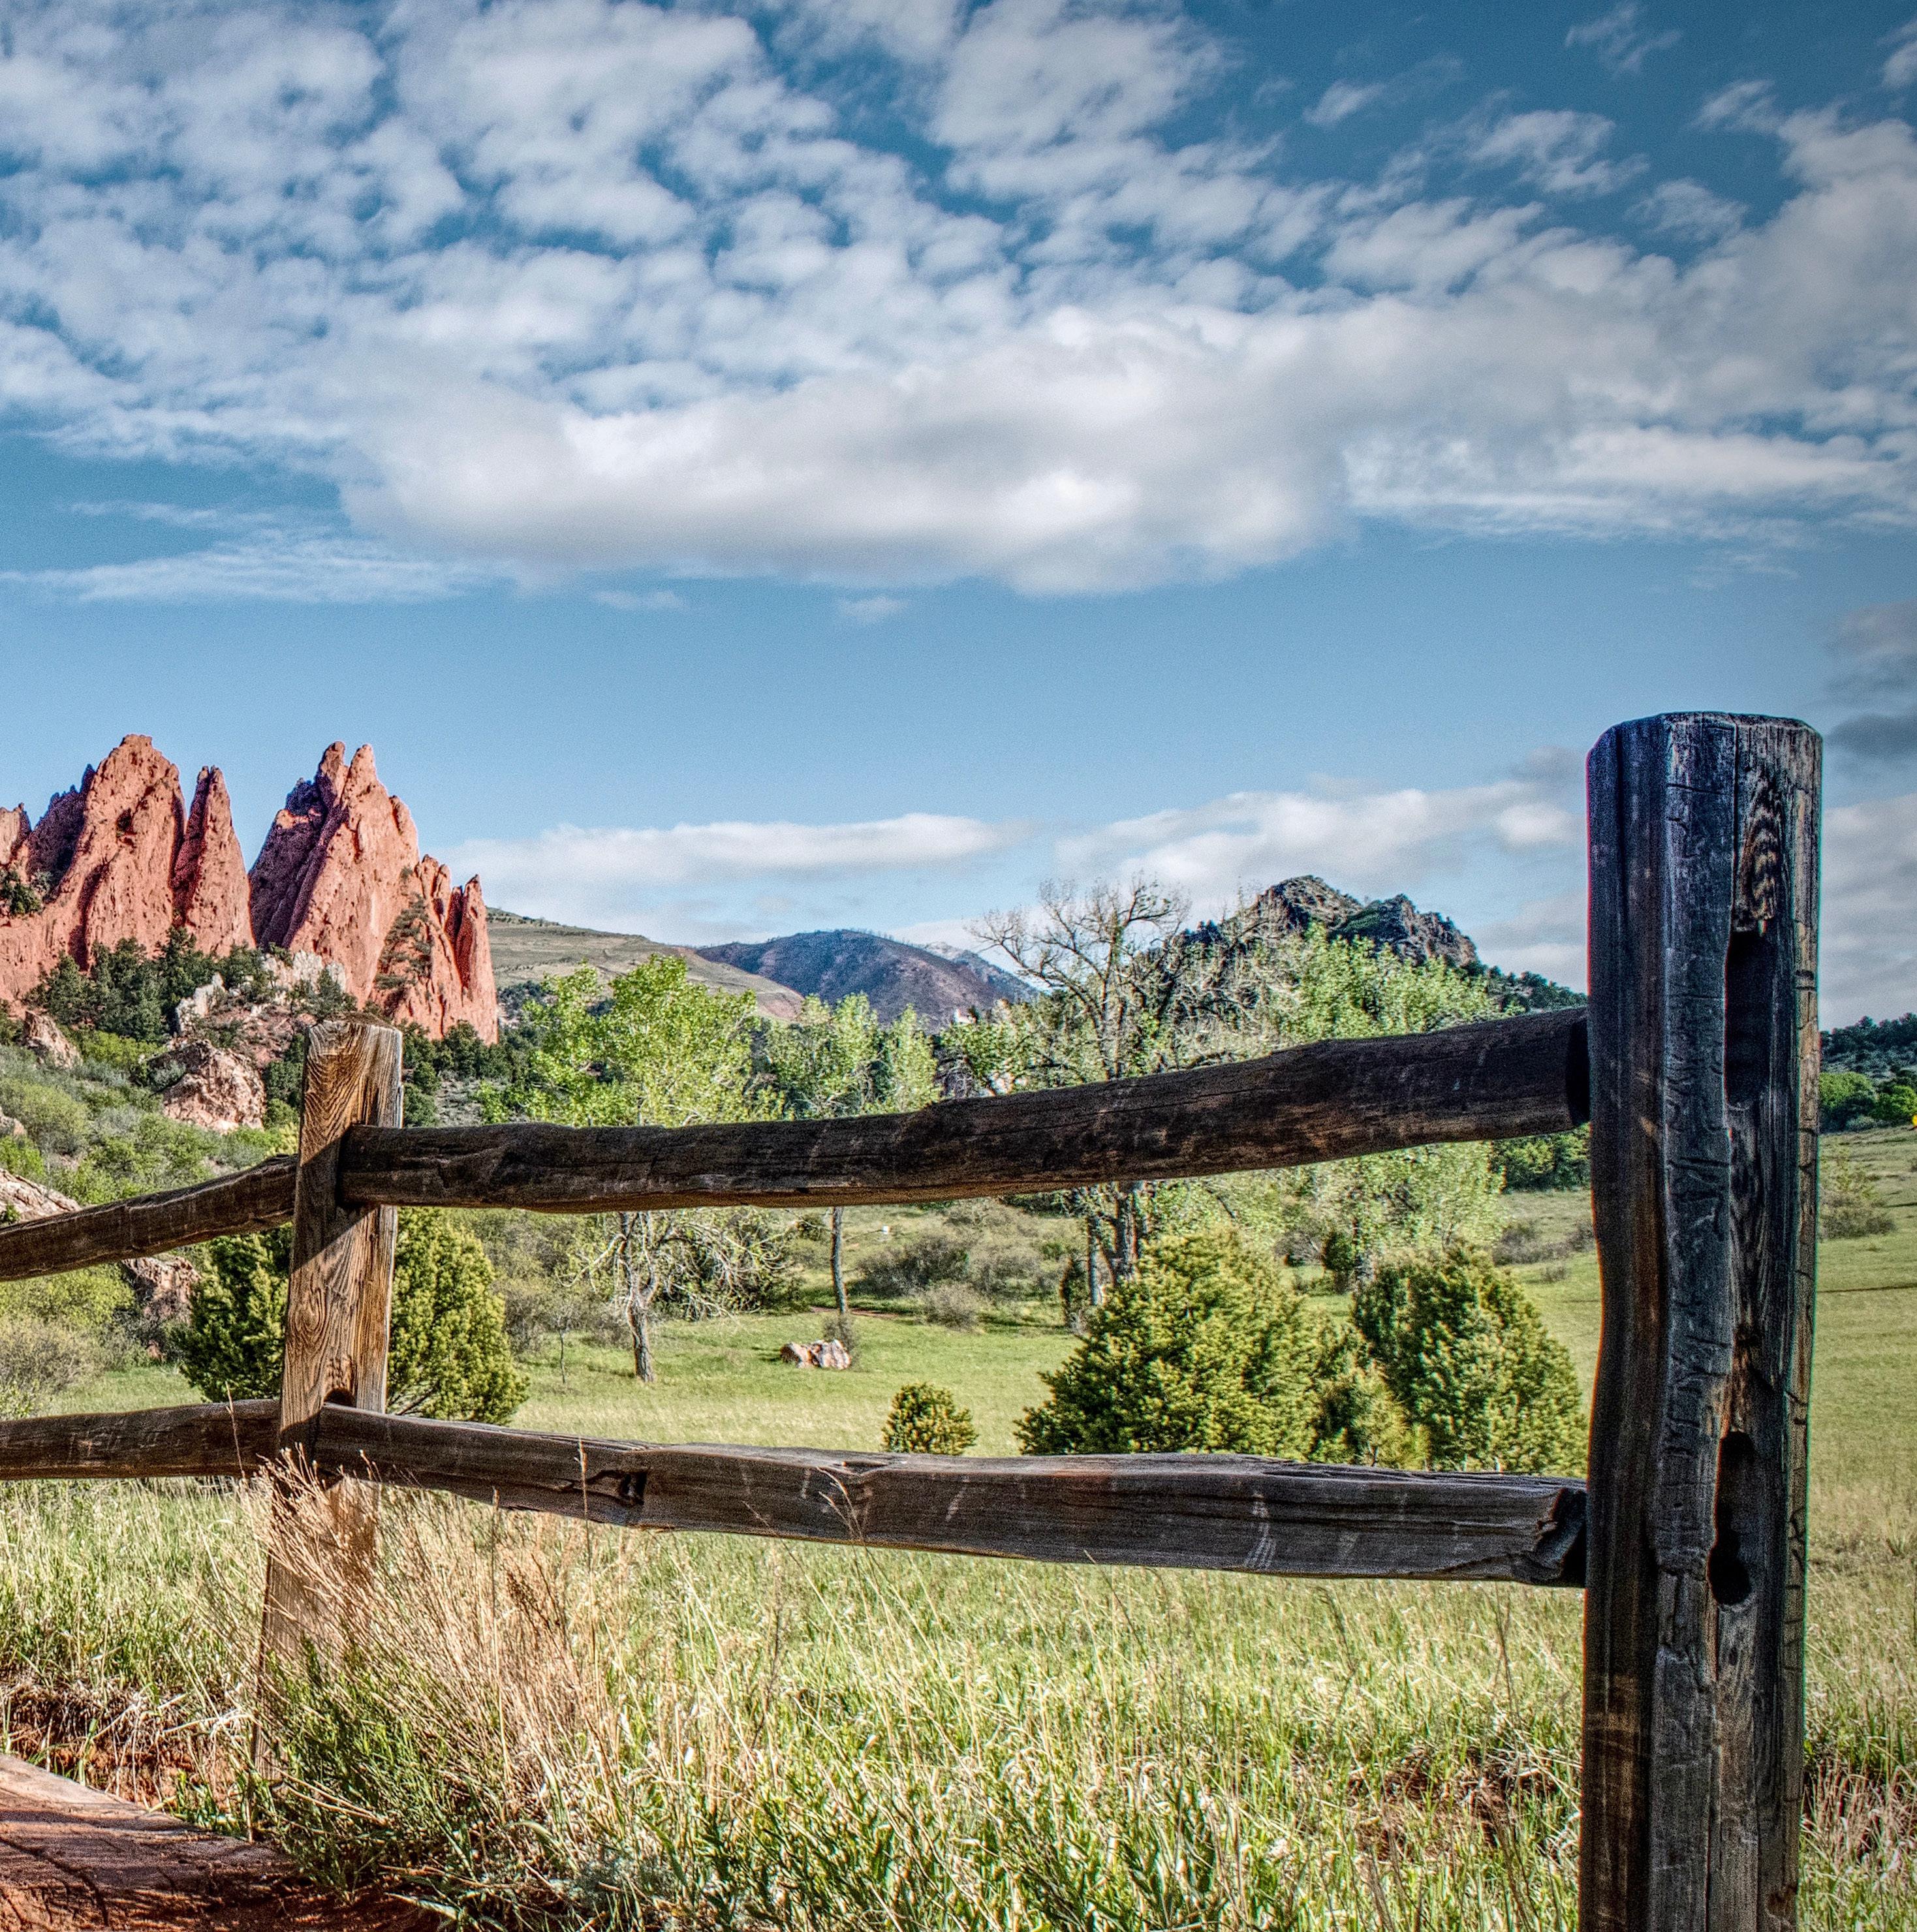
WHY COLORADO?
MICRO MARKET REPORT | Colorado Springs JANUARY - MARCH 2023 • COLORADOMICROREPORTS.COM