Micro Market Report
CRESTED BUTTE, COLORADO

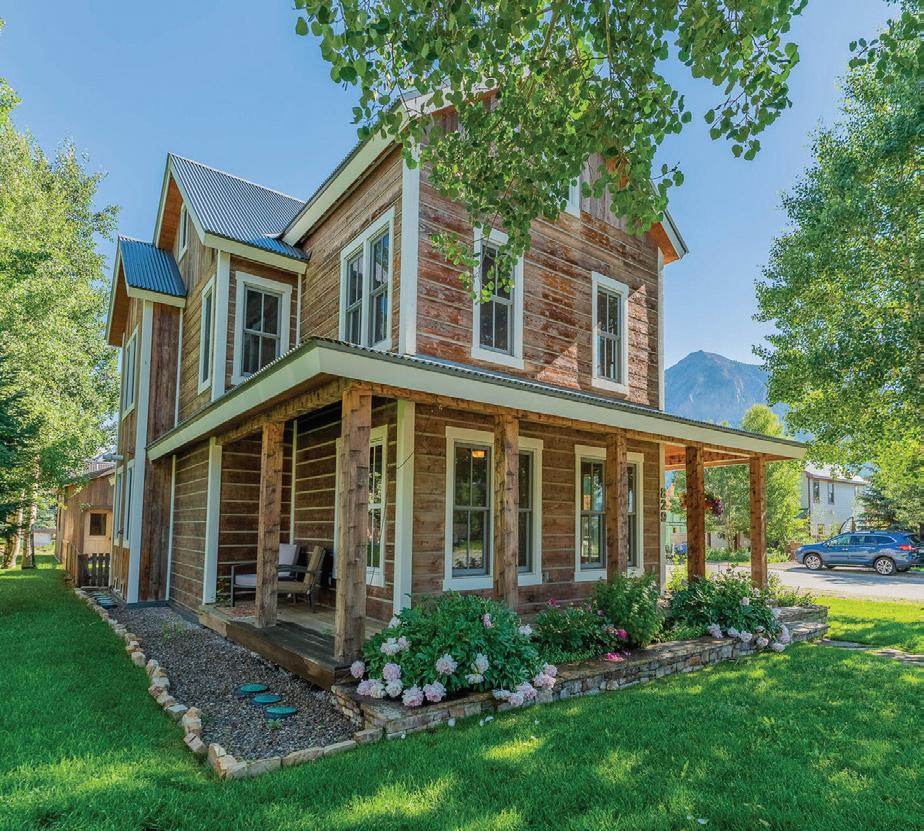
818 Elk Avenue 14 Kokanee Lane Q3 2022
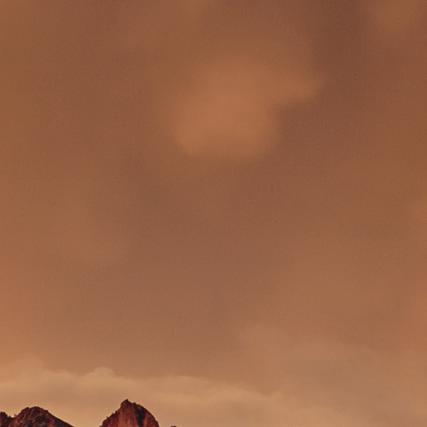
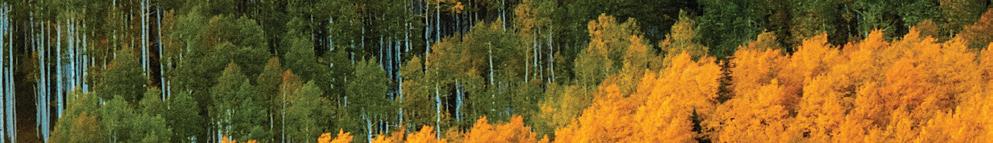
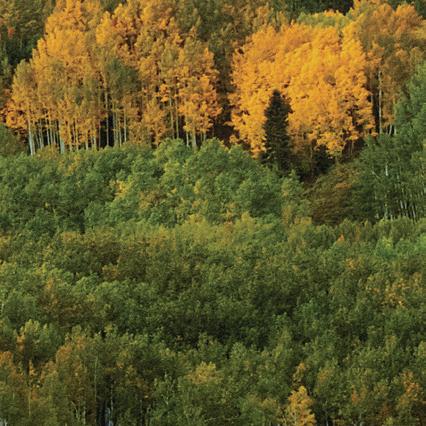
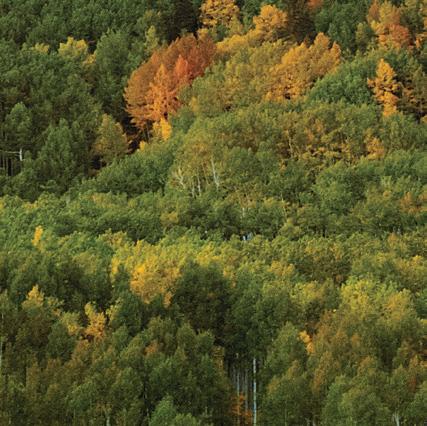
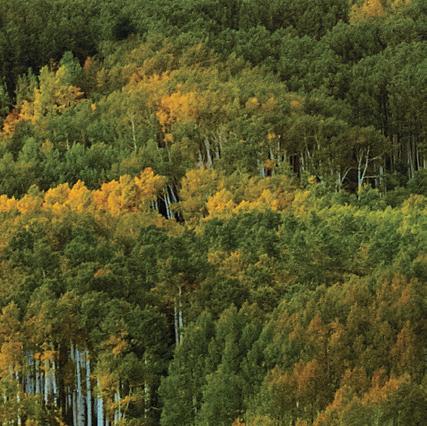
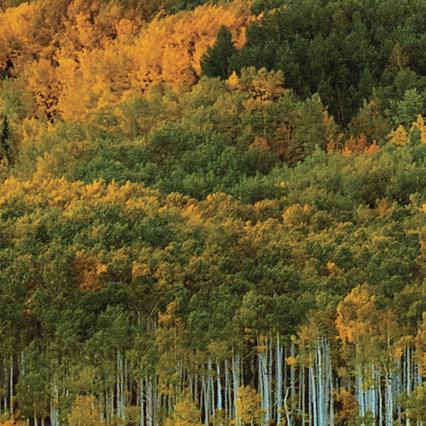
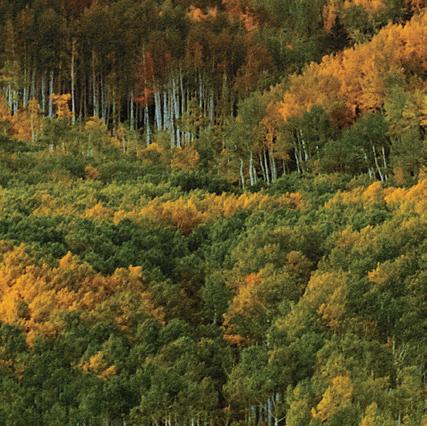
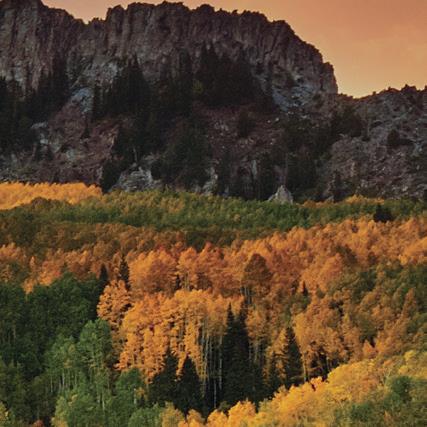
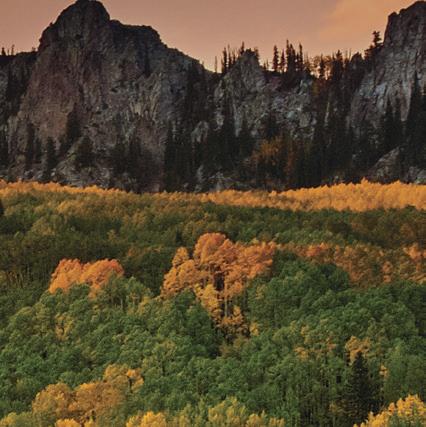
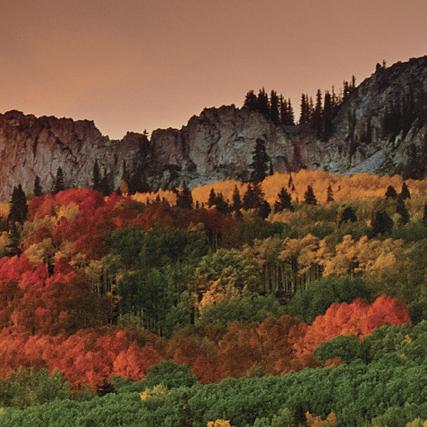
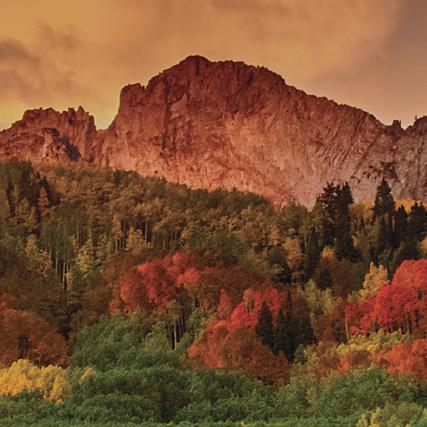
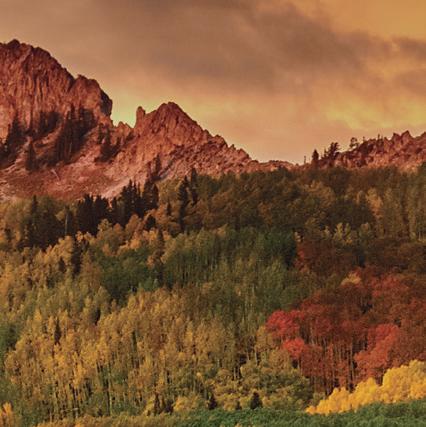
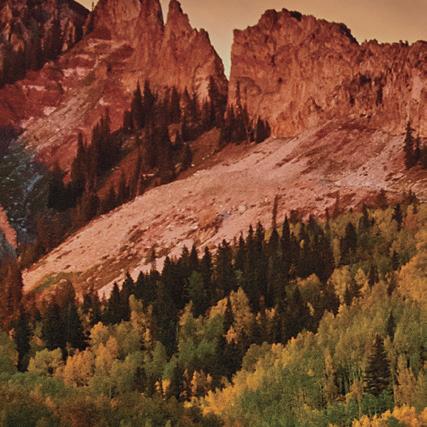
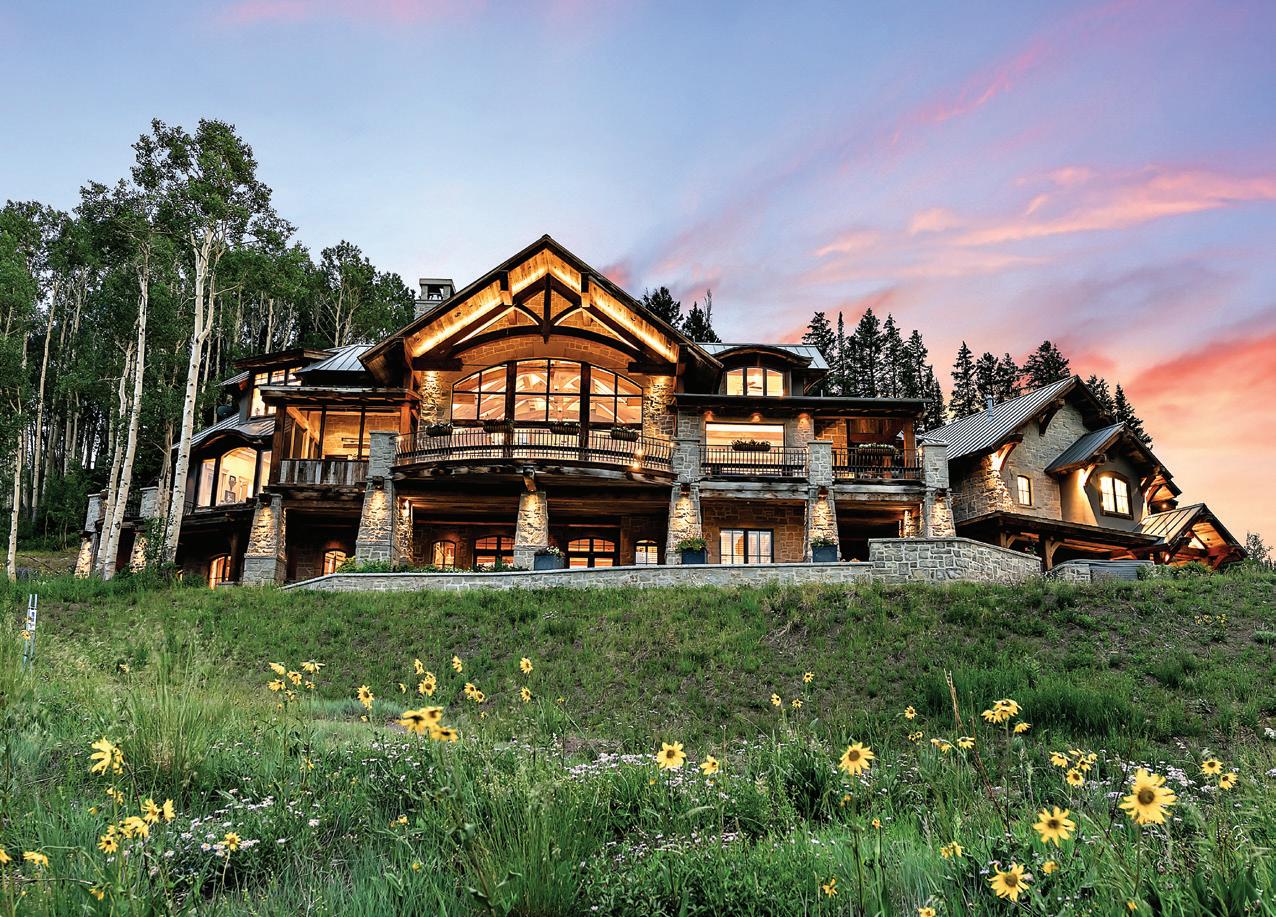
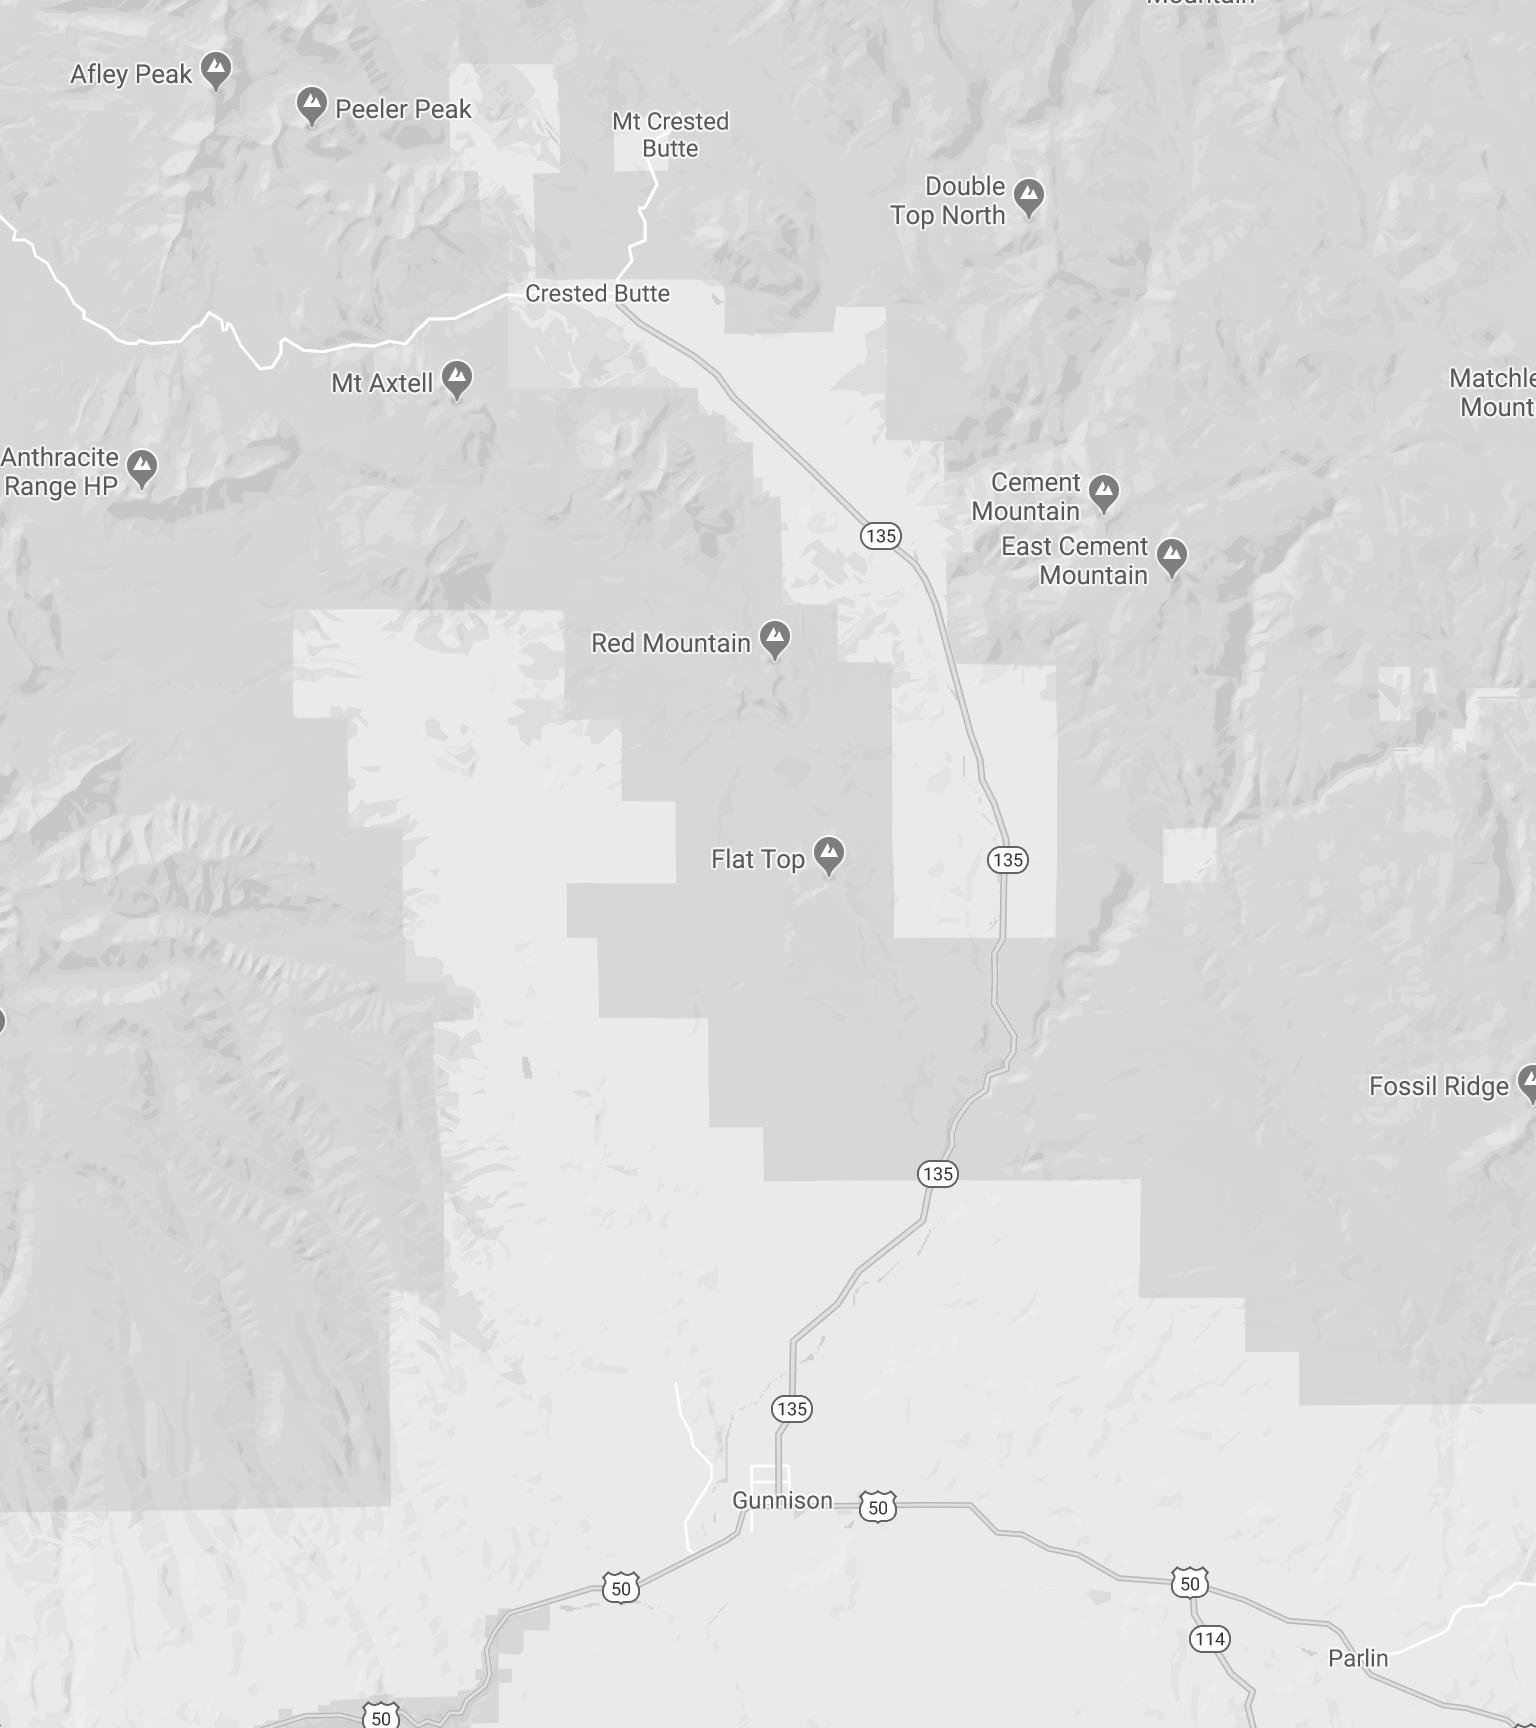
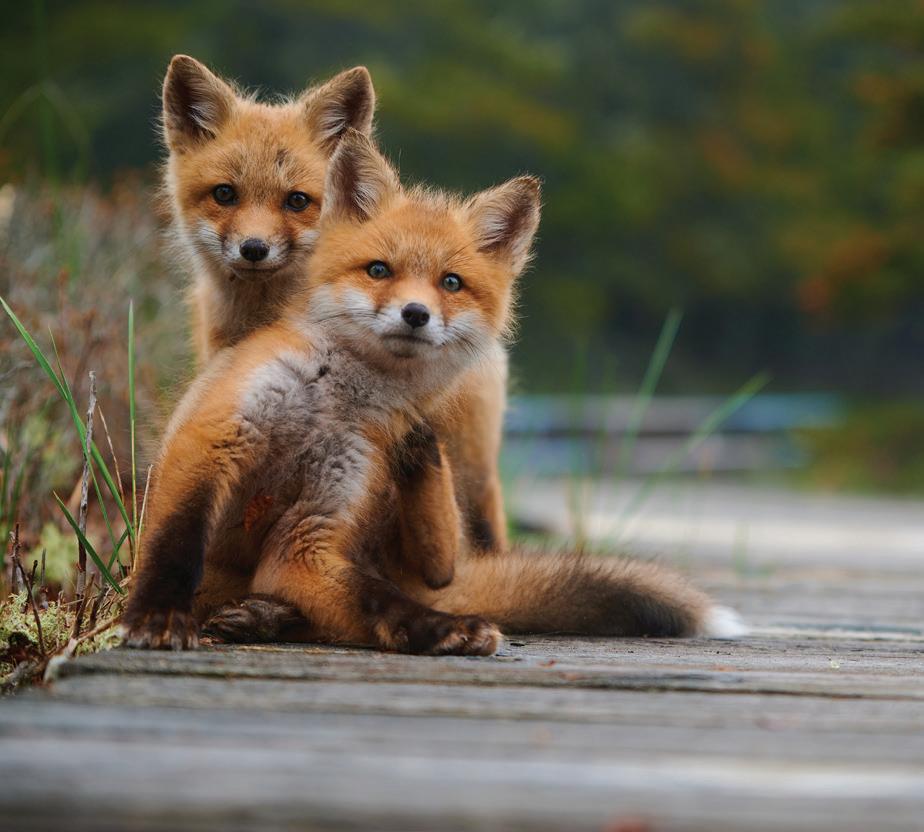
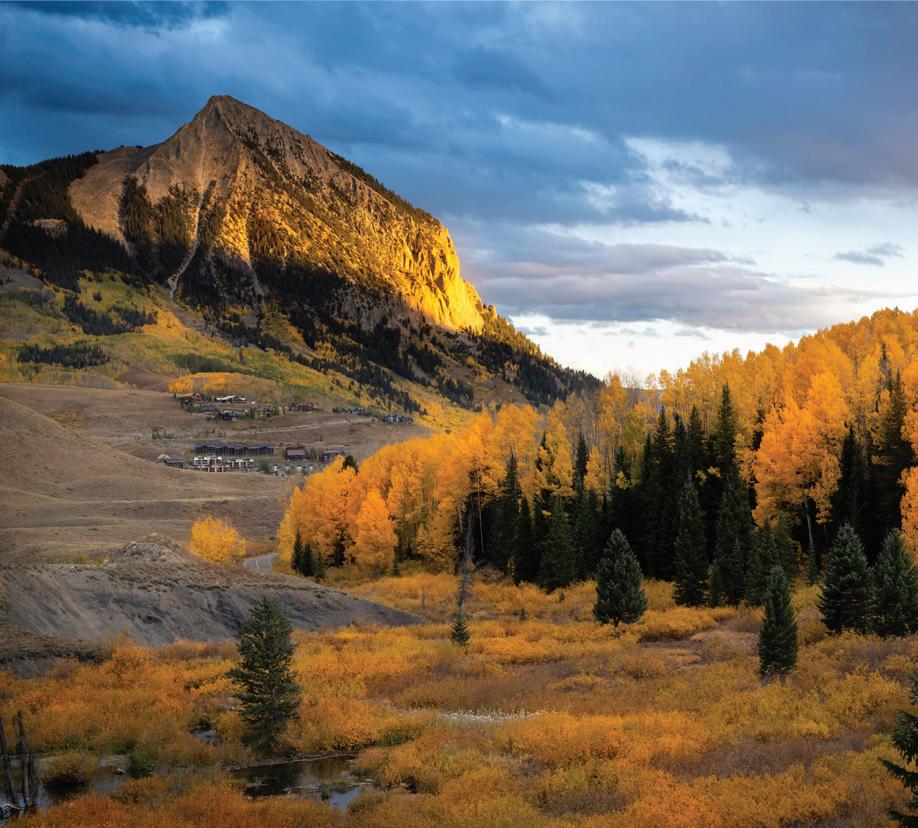
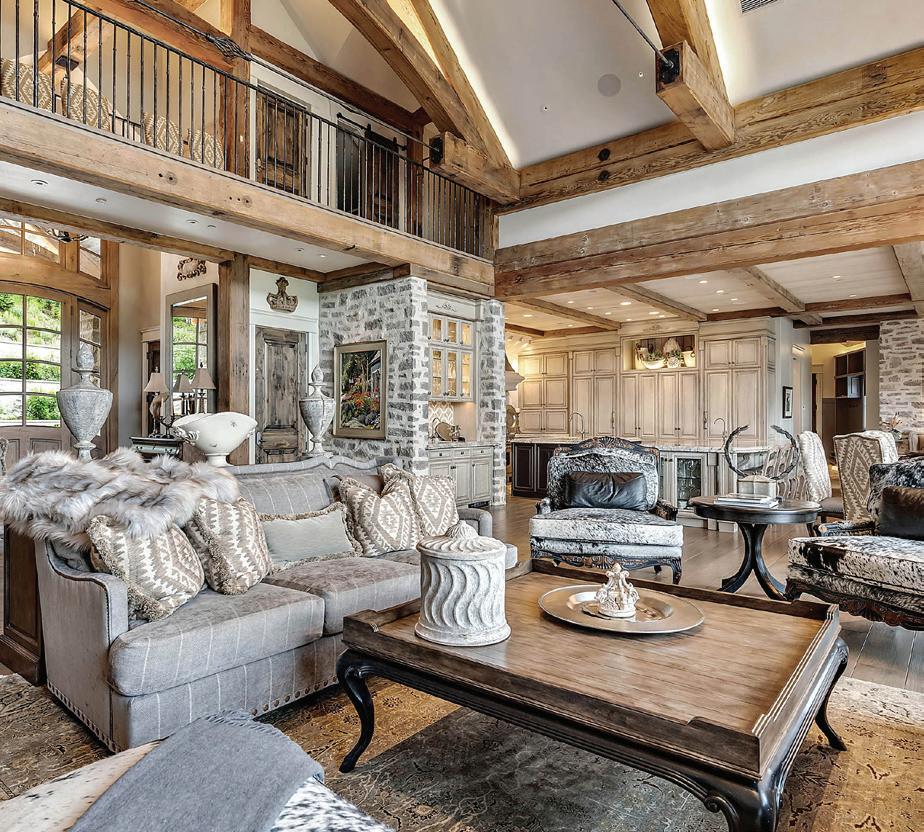
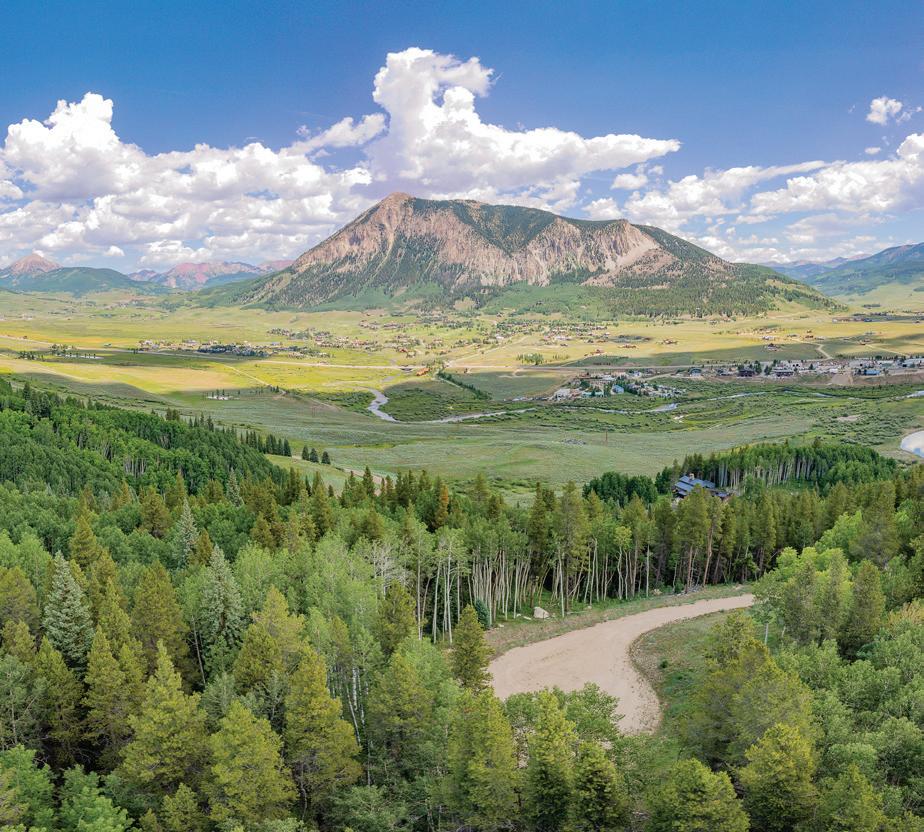
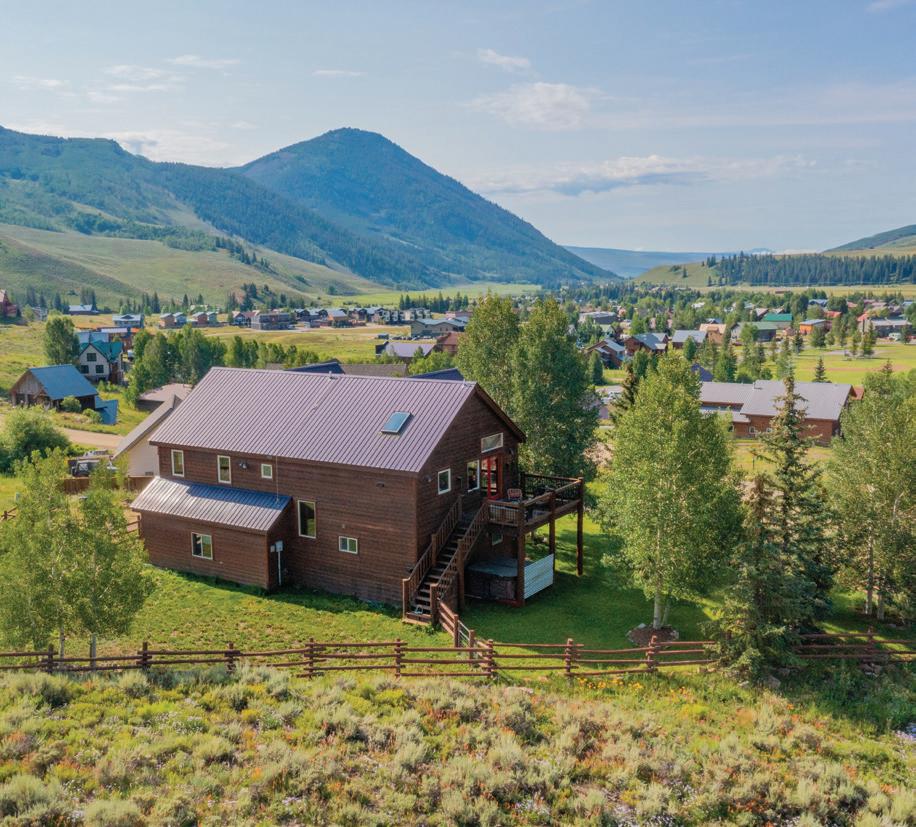
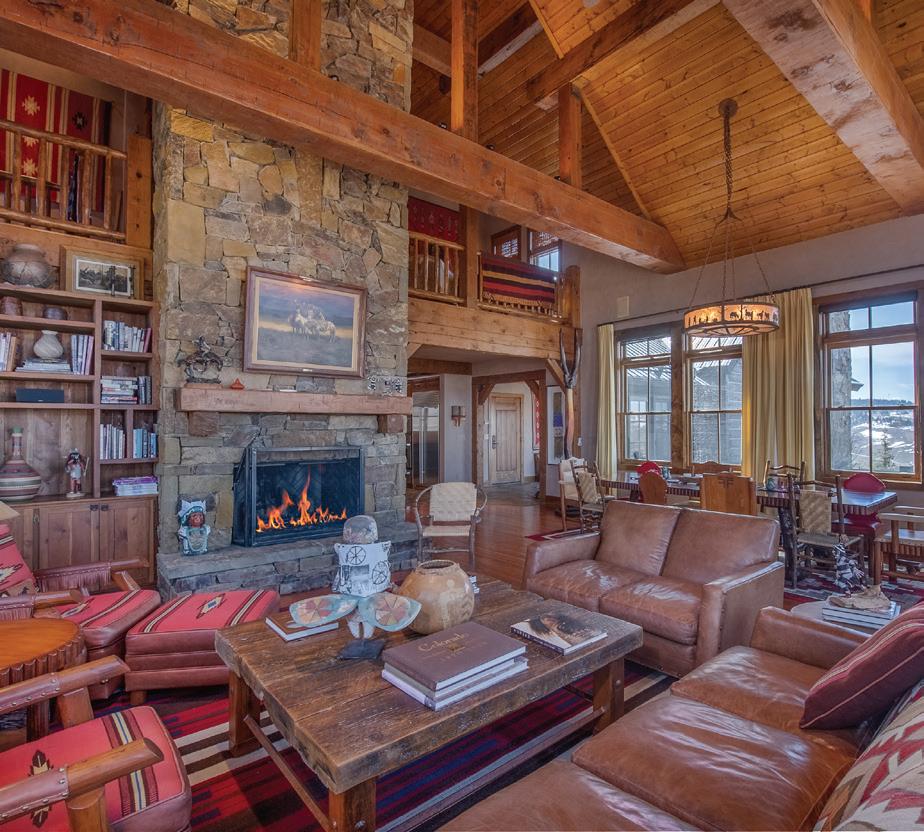
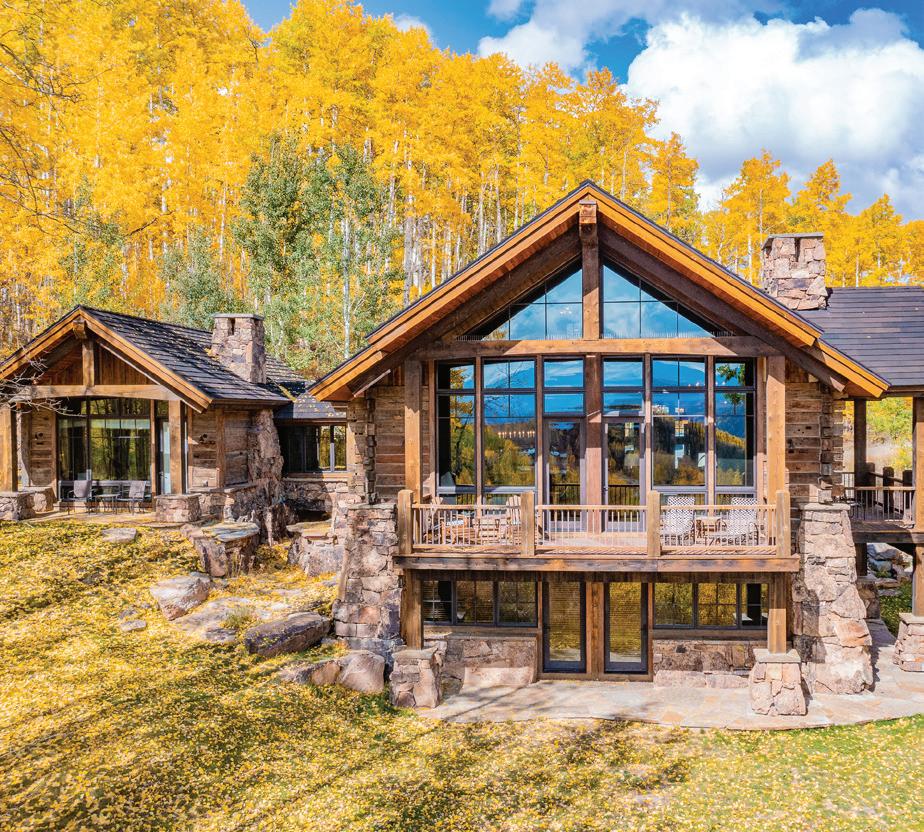
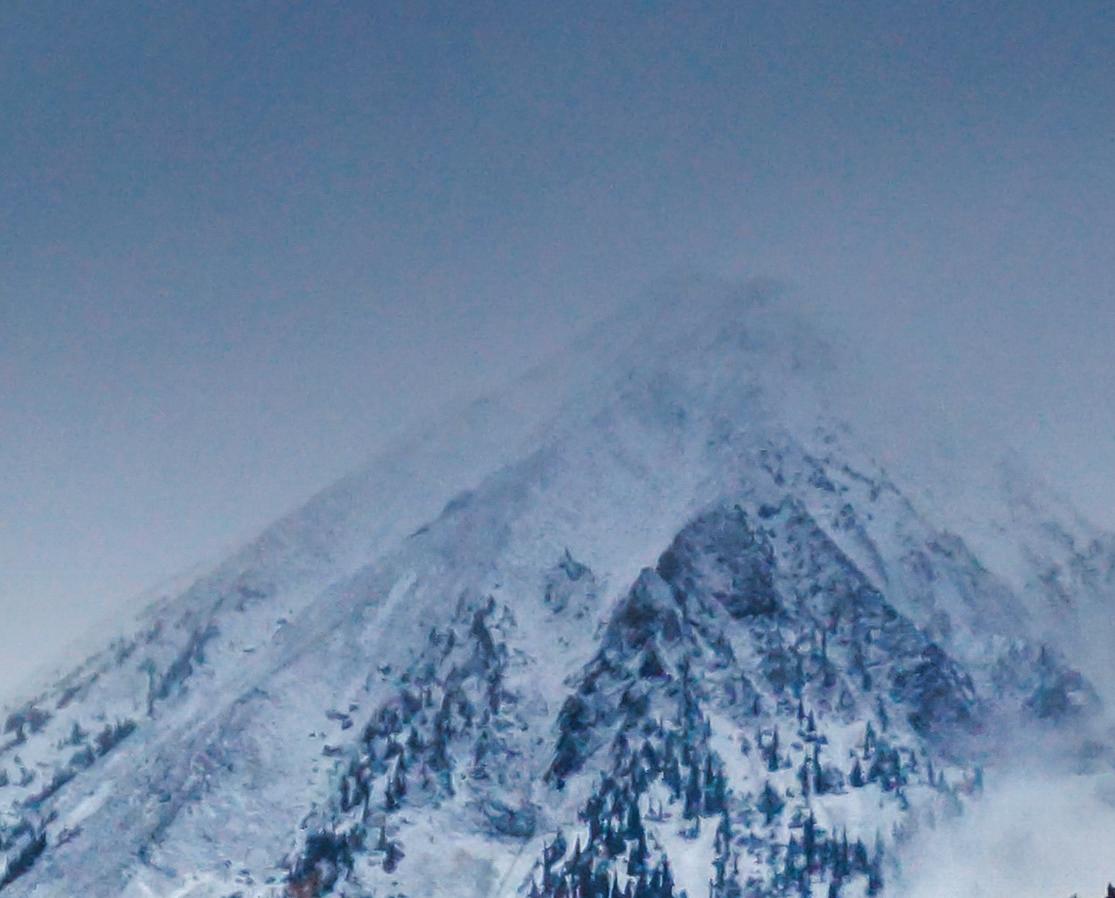
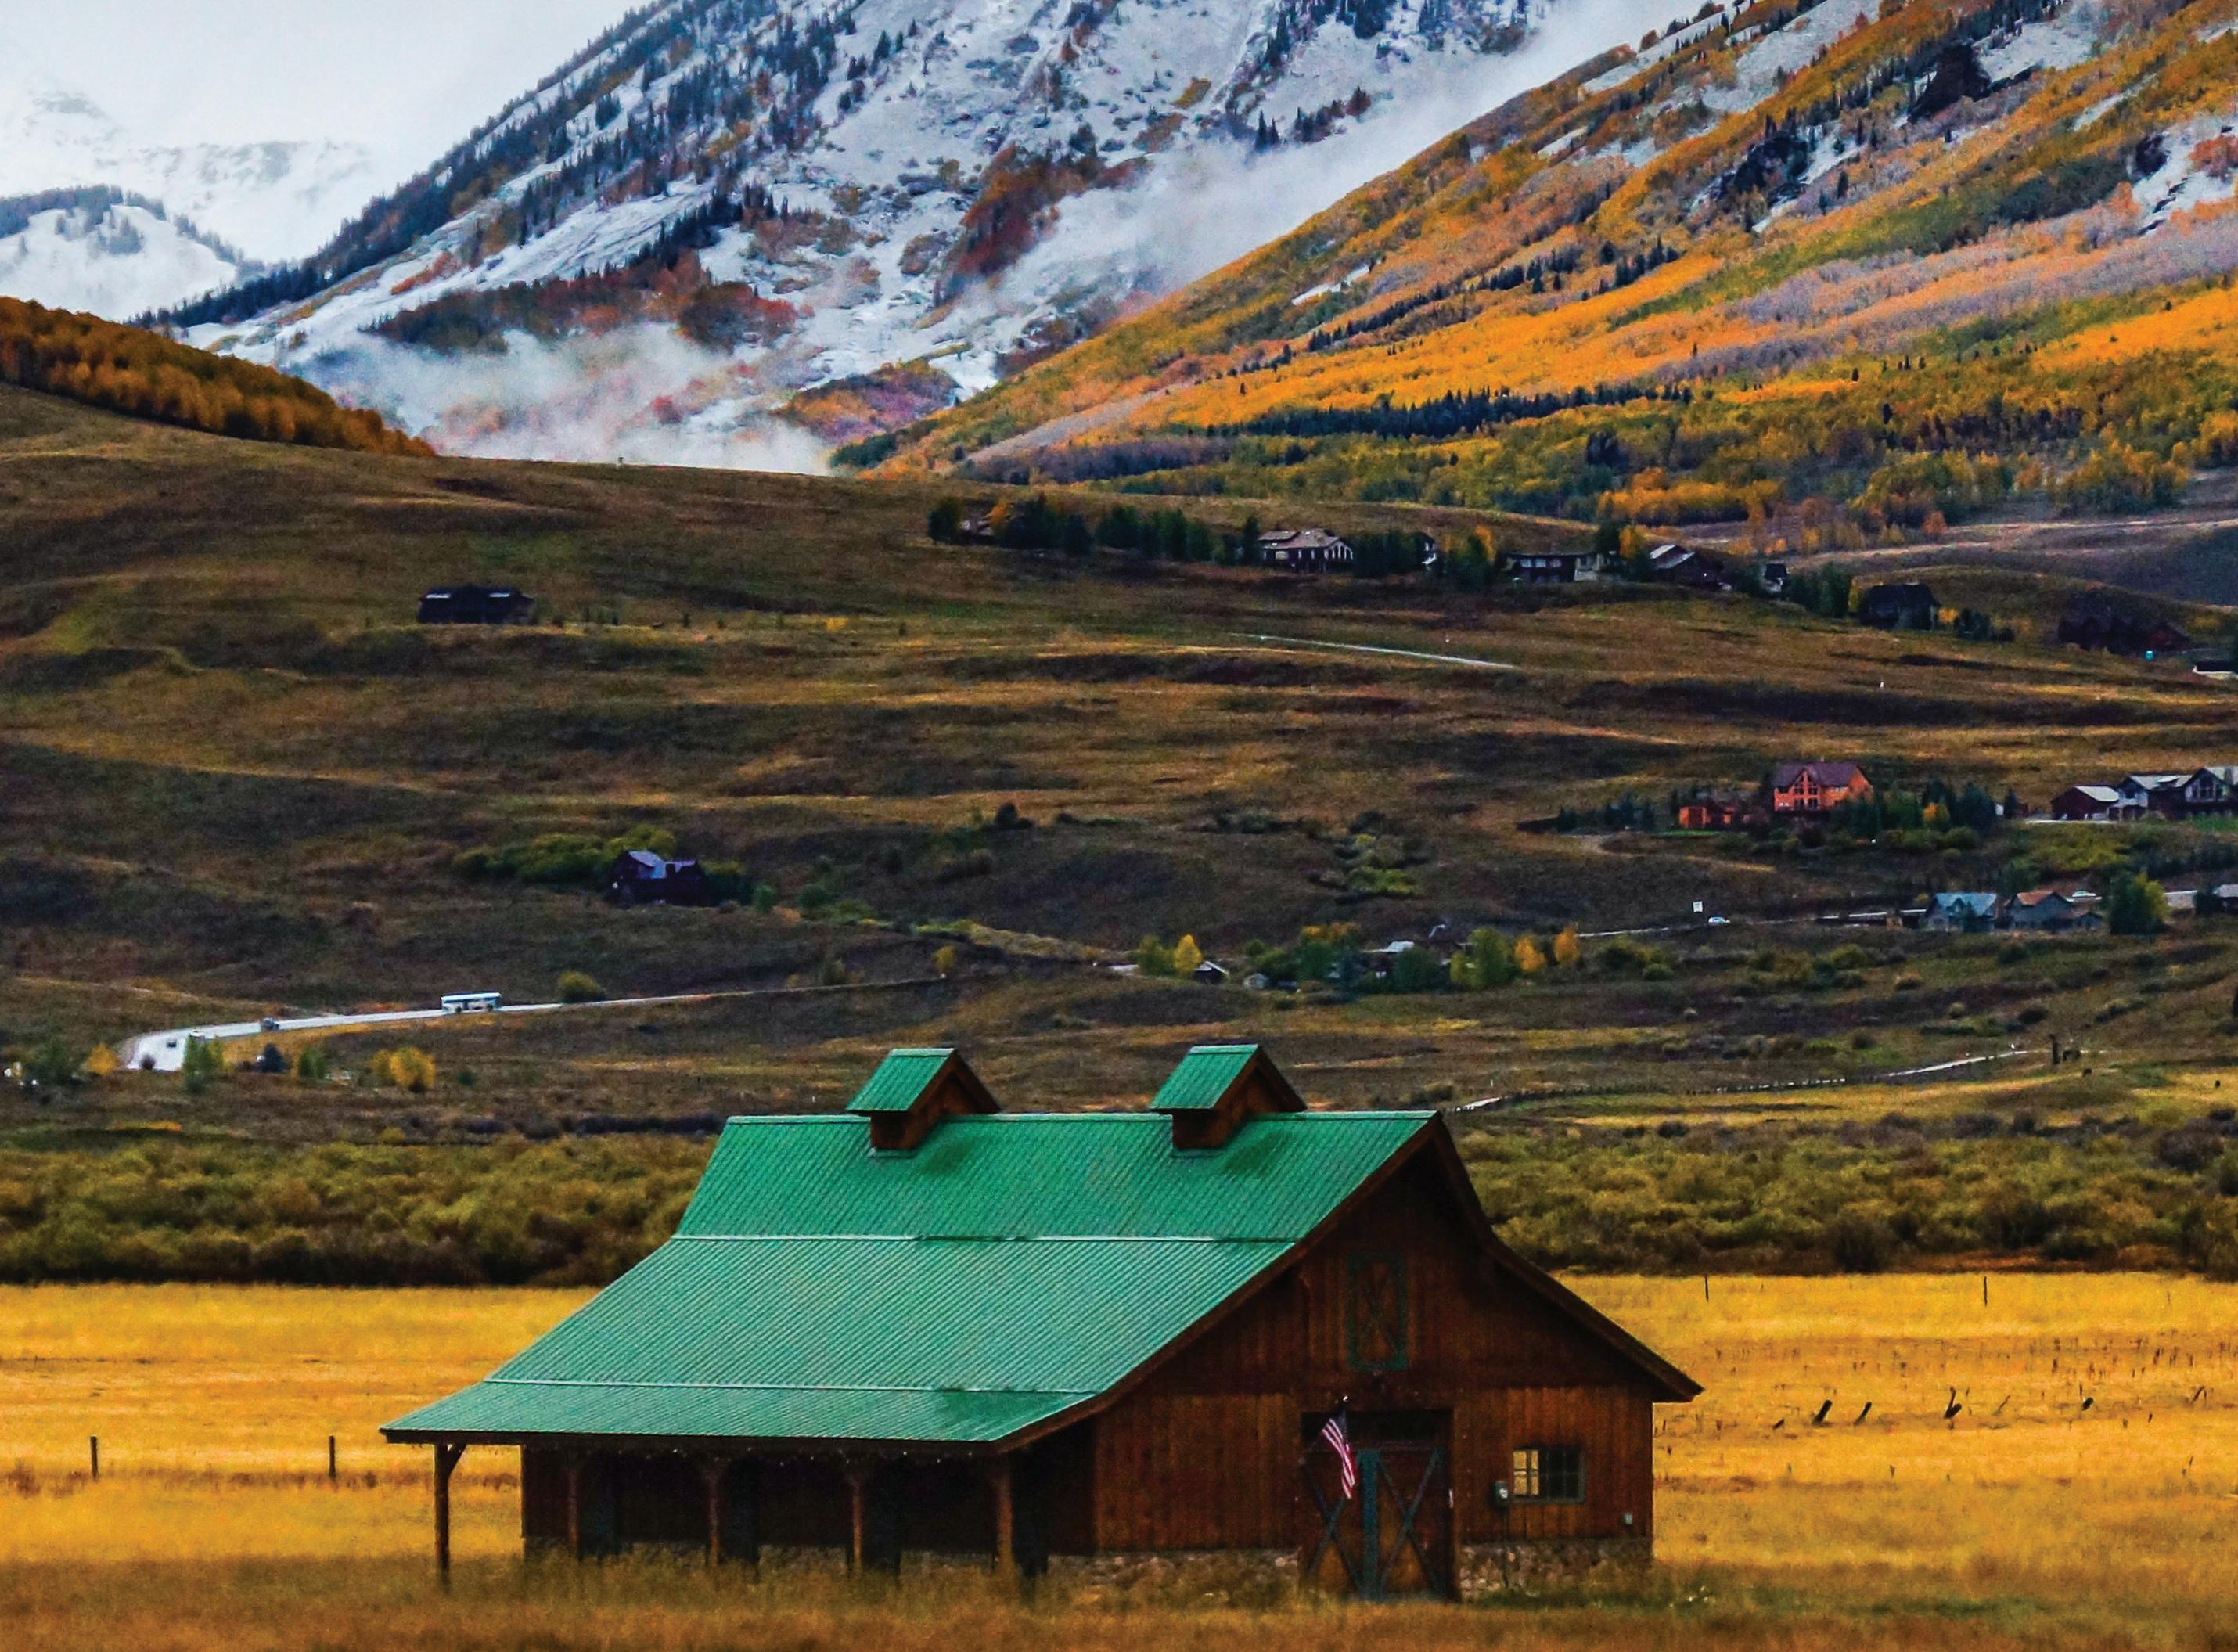
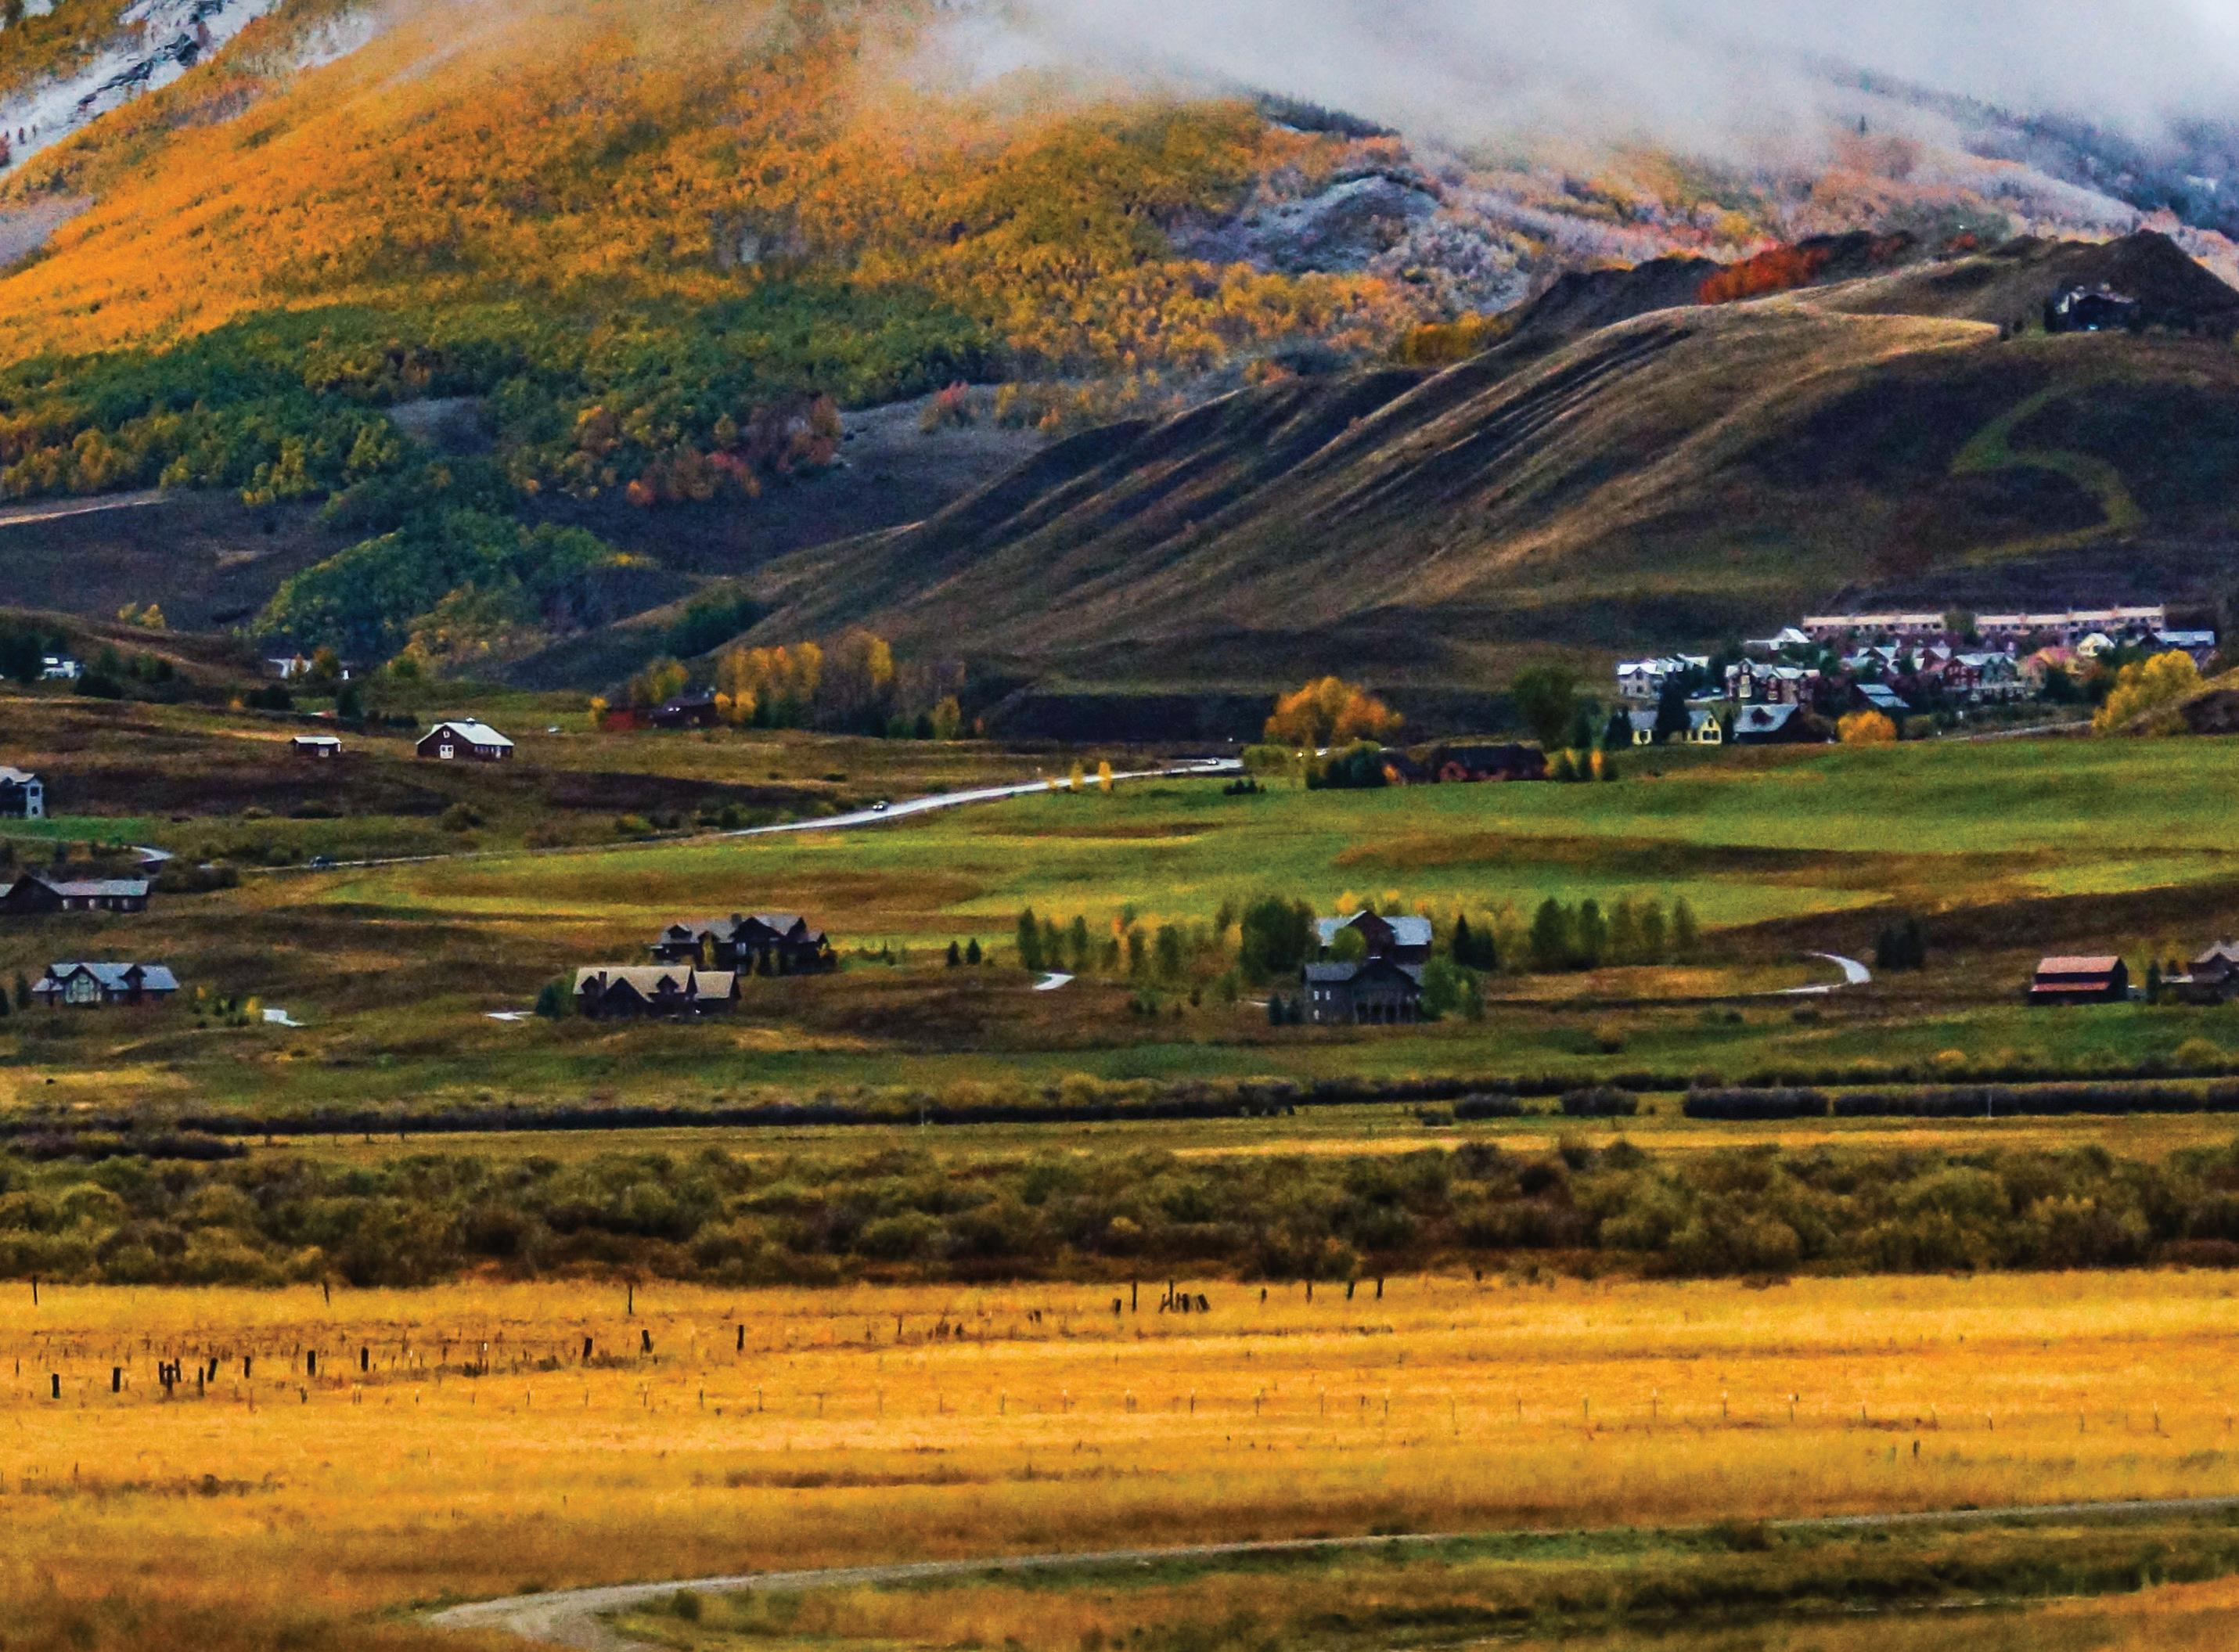
Located in the upper valley of Gunnison County, the historic mountain town of Crested Butte is known for its stunning mountain vistas and its serene escape from the ordinary. There are no traffic lights, highrise buildings, or big box stores, with beloved local restaurants and shops lining Elk Avenue. Kebler Pass, just west of town, is home to Colorado’s largest Aspen grove which captivates visitors with golden hues each autumn. Hiking and biking trails, as well as flyfishing brings outdoor enthusiasts to enjoy the area. With just over 2,300 year-round residents between Crested Butte and Mt. Crested Butte, this Colorado mountain community offers access to a plethora of outdoor recreation.
Every quarter, LIV Sotheby's International Realty produces a Micro Market Report focused on Gunnison County’s market performance, which includes Crested Butte. For quarter three, this report is a yearover-year comparison of the first nine months of 2021 compared to the first nine months of 2022, analyzing January through September.
Gunnison County saw a 42.7% decline in the average days on market, from 253 days to 145 days, as buyers flocked to purchase properties in the area. The average price in Gunnison County increased over 7% from $715,602 to $766,732. The Town of Crested Butte had a 92.5% increase in the highest priced property sold, with the top transaction ringing in at $11.5 million. The average sold price in Crested Butte South increased 74.8% to $786,372. The highest price for property sold in Rural Crested Butte was $7.4 million, a 72.1% jump over the same period in 2021.
Gunnison’s highest priced property that sold was $5.6 million for a significant 397.8% increase from the previous year, exemplifying the strength of real estate throughout the county.
Continue reading to learn more about how the real estate market in Gunnison County performed during the first nine months of the year. This Colorado Micro Market Report includes real estate data statistics for the following neighborhoods: Town of Crested Butte, Mt. Crested Butte, Crested Butte South, Rural Crested Butte, City of Gunnison, Almont & Rural Gunnison.
coloradomicroreports.com
Based on data from the Gunnison – Crested Butte Association of REALTORS® MLS, Colorado Real Estate Network (CREN). Verify with a local REALTOR®. All information is deemed reliable but not guaranteed. Data maintained by CREN MLS may not reflect all real estate activity in the market.
Crested Butte MARKET UPDATE GUNNISON COUNTY All Parcels Over 10 Acres January through September 2021 2022 % Change Average Sold Price $1,288,609 $988,603 -23.3% Average Price per Acre $13,911 $28,711 106.4% Average Days on Market 382 305 -20.2% Highest Sold Price $27,000,000 $6,792,000 -74.8% Properties Sold 110 57 -48.2% % Sold Price to List Price 92.9% 96.9% 4.3% January through September 2021 2022 % Change Sold Listings (All) 911 549 -39.7% Sold Single Family 263 145 -44.9% Sold Condos/TH 223 195 -12.6% Average Days on Market 253 145 -42.7% Average Sold Price $715,602 $766,732 7.1% % Sold Price to List Price 96.5% 97.8% 1.3% Total Dollar Volume Sold $651,913,514.00 $420,936,261.00 -35.4% All Properties
CRESTED BUTTE
MICRO MARKET REPORT | Crested Butte JANUARY SEPTEMBER 2022 • COLORADOMICROREPORTS.COMlivsothebysrealty.com
NEIGHBORHOODS 3 5 4 2 1 1. Town of Crested Butte 2. Mt. Crested Butte 3. Crested Butte South 4. Almont 5. City of Gunnison
TOWN OF CRESTED BUTTE
42.1%
The average sold price in the Town of Crested Butte increased by 42.1% January through September 2022 compared to that of 2021. Incorporated in 1880, the Town of Crested Butte rests at an elevation of 8,885 feet and serves as “the Gateway to the Elk Mountains.” Explorer Ferdinand Hayden referred to the dominant peak guarding the residents as a ‘crested butte,’ and the namesake was born.
January through September
2022 % Change
Average Sold Price $1,533,283 $2,179,000 42.1%
Average Price per SqFt $745 $1,001 34.3%
Average Days on Market 275 534 94.2%
Highest Sold Price $6,000,000 $11,550,000 92.5%
Properties Sold 72 29 -59.7%
% Sold Price to List Price 97.2% 98.5% 1.4%
All Properties
January through September
2022 % Change
Average Sold Price $2,184,291 $2,761,111 26.4%
Average Price per SqFt $1,173
Average Days on Market 127 230 81.1%
Highest Sold Price $4,250,000 $5,100,000 20.0%
Properties Sold 24 9 -62.5%
% Sold Price to List Price 96.8% 99.0% 2.3%
Single Family Homes
January through September
% Change
Average Sold Price $595,808 $995,333 67.1%
Average Price per SqFt $579 $824 42.4%
Average Days on Market 194 64 -67.0%
Highest Sold Price $1,115,000 $1,567,500 40.6%
Properties Sold 17 6 -64.7%
% Sold Price to List Price 99.8% 100.0% 0.2%
Condominiums, Townhomes, Duplexes and Triplexes
January through September
2022 % Change
Average Sold Price $1,405,323 $2,460,750 75.1%
Average Price per Acre $5,694,221 $7,392,153 29.8%
Average Days on Market
1074 89.8%
Highest Sold Price $5,500,000 $11,550,000 110.0%
Properties Sold 17 12 -29.4%
% Sold Price to List Price 99.0% 98.9% -0.1%
Commercial Lots
Residential /
2021
566
2021 2022
2021
2021
Average
Average
%
Average
Average
Average
Highest
%
January through
Average
January through
Average
21.4%
The average price per square foot in Mt. Crested Butte increased by 21.4% January through September 2022 compared to that of 2021.
All Properties
Single Family Homes
Change
Smaller in size than the Town of Crested Butte (approximately 800 residents compared to 1,500 residents), Mt. Crested Butte is the actual location of the famous resort. Located inside the Gunnison National Forest, this picture-perfect town covers an area just over two square miles, and those two square miles are a skier or snowboarder’s paradise.
Condominiums, Townhomes, Duplexes and Triplexes
Change
Residential / Commercial Lots
MT. CRESTED BUTTE
January through September 2021 2022 % Change
Sold Price $2,085,348 $2,131,193 2.2%
Price per SqFt $566 $718 26.8%
Days on Market 114 172 50.9%
Sold Price $5,700,000 $3,500,000 -38.6% Properties Sold 33 16 -51.5%
Sold Price to List Price 97.4% 97.1% -0.3%
January through September 2021 2022 % Change
Sold Price $822,002 $847,798 3.1%
Price per SqFt $552 $670 21.4% Average Days on Market 385 110 -71.4% Highest Sold Price $5,700,000 $5,500,000 -3.5% Properties Sold 196 135 -31.1%
Sold Price to List Price 96.9% 98.7% 1.9%
September 2021 2022 %
Sold Price $592,420 $613,010 3.5% Average Price per SqFt $551 $663 20.3% Average Days on Market 144 81 -43.8% Highest Sold Price $2,700,000 $3,700,000 37.0% Properties Sold 114 107 -6.1% % Sold Price to List Price 98.3% 99.8% 1.4%
September 2021 2022 %
Sold Price $508,541 $1,230,125 141.9% Average Price per Acre $640,604 $1,467,561 129.1% Average Days on Market 1146 286 -75.0% Highest Sold Price $2,975,000 $5,500,000 84.9% Properties Sold 48 12 -75.0% % Sold Price to List Price 91.9% 98.0% 6.6%
The average days on market in
Butte South decreased by
January through September
compared
For those who like the area of Crested Butte but perhaps want to shy away from the resort area or the large open rural spaces, Crested Butte South is a subdivision located eight miles south of the town center. This area offers more for those who prefer a suburban setting, yet want to enjoy the clean air and breathtaking vistas of Crested Butte.
January through September
Average Sold Price
Average Price per SqFt
Average Days on Market
Highest Sold Price
Properties Sold
% Sold Price to List Price
January through September
Average Sold Price
Average Price per SqFt
Average Days on Market
Highest Sold Price
Properties Sold
% Sold Price to List Price
January through September
Average Sold Price
% Change
47.3%
-47.8%
-56.4%
-0.4%
All Properties
% Change
-38.9%
-2.6%
Single Family Homes
% Change
Condominiums, Townhomes, Duplexes and Triplexes
January through September
Average
Average
Highest
Change
/ Commercial Lots
CRESTED BUTTE SOUTH
2021 2022
$449,924 $786,372 74.8%
$416 $613
203 106
$1,530,000 $1,647,500 7.7%
78 34
99.3% 98.9%
2021 2022
$1,028,871 $1,230,878 19.6%
$440 $648 47.4%
71 65 -8.5%
$1,530,000 $1,647,500 7.7%
18 11
100.8% 98.2%
2021 2022
$667,111 $898,181 34.6% Average Price per SqFt $426 $578 35.6% Average Days on Market 74 77 4.1% Highest Sold Price $890,000 $1,200,000 34.8% Properties Sold 9 11 22.2% % Sold Price to List Price 100.2% 100.4% 0.3% Residential
2021 2022 %
Sold Price $176,774 $276,416 56.4%
Price per Acre $415,464 $697,964 68.0% Average Days on Market 276 170 -38.4%
Sold Price $570,000 $430,000 -24.6% Properties Sold 47 12 -74.5% % Sold Price to List Price 97.0% 97.9% 0.9% 47.8%
Crested
47.8%
2022
to that of 2021.
January
Average
Average
Average
Average
Average
January through
Average
Average
Average
Highest
72.1%
The highest sold price in Rural Crested
increased by 72.1% January through September 2022 compared to that of 2021.
All Properties
Single Family Homes
24.7%
The average price per
and
in Rural Crested Butte increased by 24.7% January through September 2022 compared to that of
Change
Residential / Commercial Lots
RURAL CRESTED BUTTE Condominiums, Townhomes, Duplexes and Triplexes January through September 2021 2022 % Change Average Sold Price $817,338 $630,464 -22.9% Average Price per SqFt $526 $656 24.7% Average Days on Market 134 159 18.7% Highest Sold Price $2,410,000 $1,250,000 -48.1% Properties Sold 31 14 -54.8% % Sold Price to List Price 100.7% 100.6% 0.0%
through September 2021 2022 % Change
Sold Price $948,590 $1,246,280 31.4%
Price per SqFt $613 $730 19.1% Average Days on Market 215 212 -1.4% Highest Sold Price $4,300,000 $7,400,000 72.1% Properties Sold 165 81 -50.9% % Sold Price to List Price 97.1% 97.0% -0.1%
January through September 2021 2022 % Change
Sold Price $2,042,792 $2,771,682 35.7%
Price per SqFt $698 $774.00 10.9%
Days on Market 135 102 -24.4% Highest Sold Price $4,200,000 $7,400,000 76.2% Properties Sold 39 23 -41.0% % Sold Price to List Price 96.7% 97.2% 0.5%
September 2021 2022 %
Sold Price $534,000 $644,852 20.8%
Price per Acre $408,129 $794,296 94.6%
Days on Market 276 286 3.6%
Sold Price $4,300,000 $1,815,000 -57.8% Properties Sold 93 44 -52.7% % Sold Price to List Price 95.9% 95.5% -0.4%
Butte
square foot for condominiums, townhomes, duplexes
triplexes
2021.
45.6%
The average sold price in the City of Gunnison increased by 45.6% January through September 2022 compared to that of 2021.
January through September
2022 % Change
Average Sold Price $380,227 $553,508 45.6%
Average Price per SqFt $259 $320 23.8%
Average Days on Market 140 105 -25.0%
Highest Sold Price $1,125,000 $5,600,000 397.8%
Properties Sold 125 105 -16.0%
% Sold Price to List Price 98.1% 96.7% -1.4%
All Properties
January through September
For those who enjoy all that Gunnison County has to offer in the way of skiing and wide-open spaces but still prefer the idea of being in a proper town, the City of Gunnison is an attractive option. The City of Gunnison prides itself on having an Old West heritage feel while still providing the modern comforts of life.
59.6%
The average days on market for residential/ commercial lots in the City of Gunnison decreased by 59.6% January through September 2022 compared to that of 2021.
2022 % Change
Average Sold Price $488,650 $523,830 7.2%
Average Price per SqFt $294 $347 18.1%
Average Days on Market 75 74 -1.3%
Highest Sold Price $1,125,000 $738,000 -34.4%
Properties Sold 54 32 -40.7%
% Sold Price to List Price 98.1% 97.1% -1.0%
Single Family Homes
January through September
2022 % Change
Average Sold Price $301,220 $442,107 46.8%
Average Price per SqFt $289 $356 23.4%
Average Days on Market
63 -11.3%
Highest Sold Price $750,000 $645,000 -14.0%
Properties Sold
35.0%
% Sold Price to List Price 100.3% 99.9% -0.3%
Condominiums, Townhomes, Duplexes and Triplexes
January through September
2022 % Change
Average Sold Price $240,375 $1,191,166 395.5%
Average Price per Acre $899,587 $1,039,450 15.5%
Average Days on Market
163 -59.6%
Highest Sold Price $550,000 $3,250,000 490.9%
Properties Sold 4 3 -25.0%
% Sold Price to List Price 97.6% 93.5% -4.2%
Residential / Commercial Lots
CITY OF GUNNISON
2021
2021
2021
71
40 54
2021
403
Average
Average
Average
Highest
%
January
Average
Average
Average
Highest
%
Average
All Properties
4.1%
The average price per square foot in Almont & Rural
increased by 4.1% January through September 2022 compared to that of 2021.
Single Family Homes
The unincorporated community of Almont was originally named Fisher for the founding family but was then changed to honor a famous racehorse of the late 19th century. In its early history, Almont served as a depot for the various nearby mines to store ore that would later be sent to the larger neighboring town of Gunnison. In modern times, the community and the surrounding rural landscape are popular with visitors and nature lovers with vacation homes.
Condominiums, Townhomes, Duplexes and Triplexes
Average
%
Commercial Lots
21.9%
The average price per
and
for
in
increased by 21.9% January through September 2022 compared to that of
& Rural
ALMONT & RURAL GUNNISON
January through September 2021 2022 % Change
Sold Price $574,218 $522,347 -9.0%
Price per SqFt $309 $322 4.1%
Days on Market 229 158 -31.0%
Sold Price $10,000,000 $5,700,000 -43.0% Properties Sold 146 73 -50.0%
Sold Price to List Price 94.9% 96.7% 1.9%
through September 2021 2022 % Change
Sold Price $733,893 $678,005 -7.6%
Price per SqFt $342 $332 -3.1%
Days on Market 113 118 4.4%
Sold Price $3,100,000 $1,595,000 -48.5% Properties Sold 58 31 -46.6%
Sold Price to List Price 97.2% 96.8% -0.4%
January through September 2021 2022 % Change
Sold Price $415,000 $450,500 8.6% Average Price per SqFt $284 $336 18.4% Average Days on Market 142 42 -70.4% Highest Sold Price $855,000 $549,000 -35.8% Properties Sold 12 3 -75.0% % Sold Price to List Price 98.9% 101.8% 3.0% Residential /
January through September 2021 2022 % Change
Sold Price $255,297 $248,922 -2.5% Average Price per Acre $87,680 $106,908 21.9% Average Days on Market 386 221 -42.7% Highest Sold Price $1,351,000 $1,700,000 25.8% Properties Sold 59 30 -49.2%
Sold Price to List Price 94.8% 93.8% -1.0%
Gunnison
acre
residential
commercial lots
Almont
Gunnison
2021.
WHY COLORADO?

04 07 28NATIONAL PARKS MOUNTAIN RANGES SKI AREAS & RESORTS
WHY AVG DAYS OF SUNSHINE ANNUALY CRAFT BREWERIES 300 350+
MICRO MARKET REPORT | Crested Butte JANUARY SEPTEMBER 2022 • COLORADOMICROREPORTS.COM
