Micro Market Report
CRESTED BUTTE, COLORADO
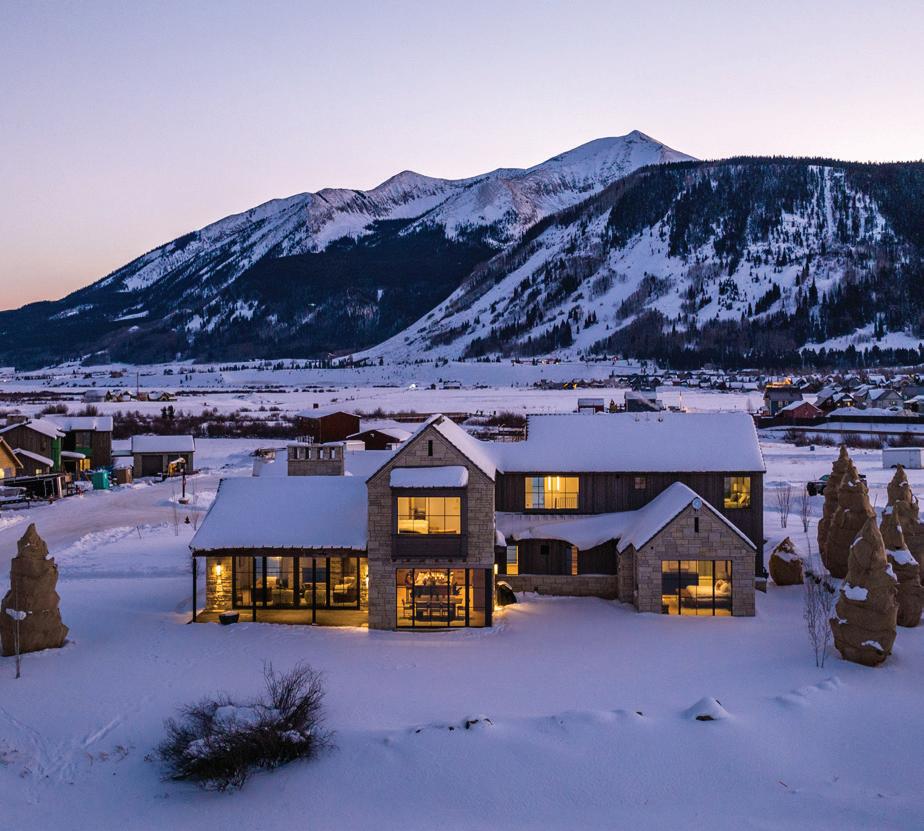
14 Kokanee Lane 5415 Wildcat Trail YEAR END 2022
Crested Butte MARKET UPDATE
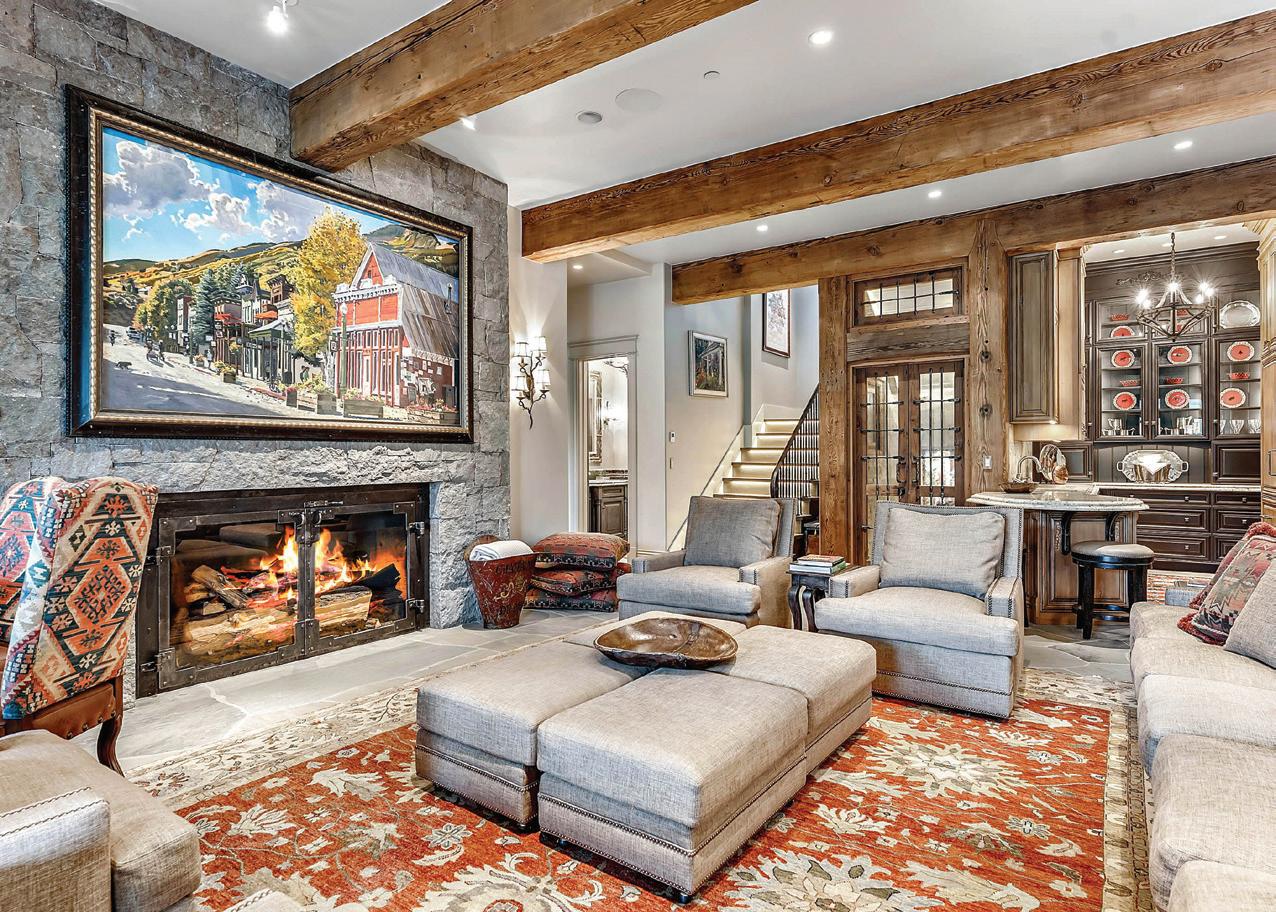
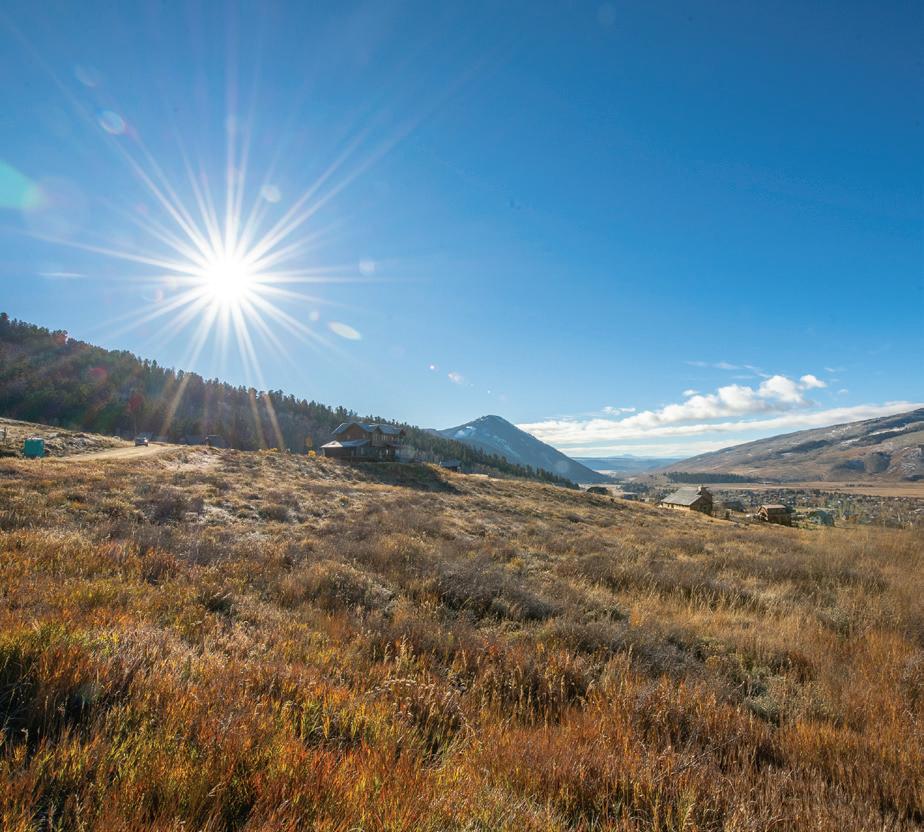
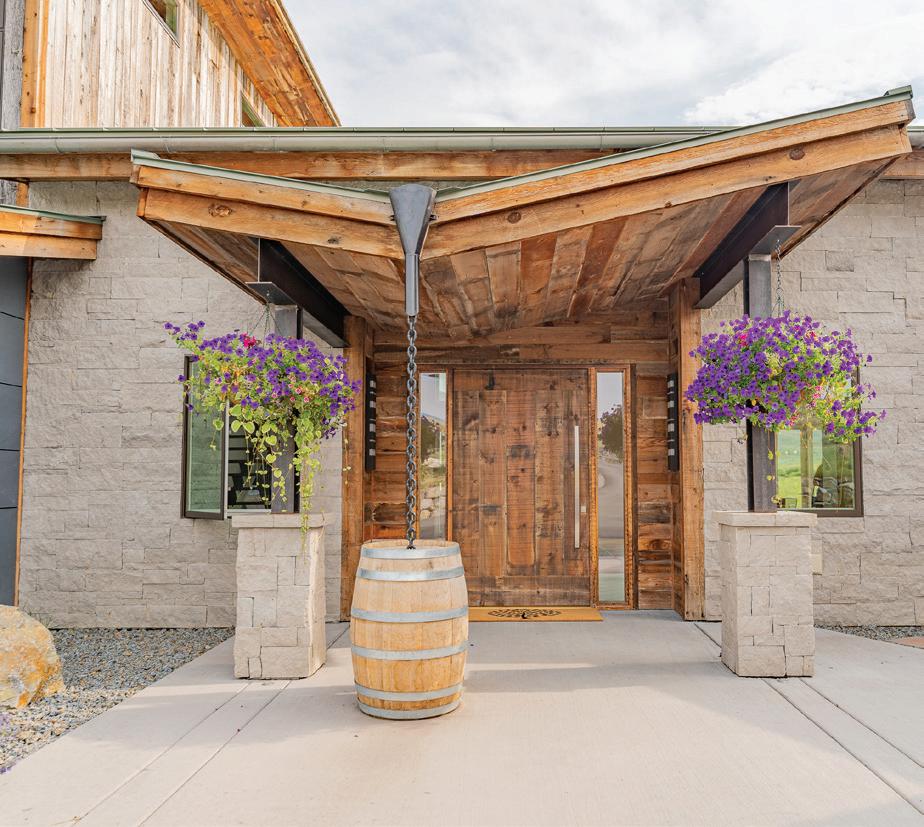
Affectionately known as “Colorado’s last great ski town,” Crested Butte offers endless challenging in-bounds skiing and charming shops and restaurants along Elk Avenue. Originally a supply town to support coal and silver mines in the 1800s, the Crested Butte area saw the ride of the ranching industry in the 1900s, followed by the opening of the ski resort in 1962.
After record-breaking sales volume in 2020-2021, the market in Crested Butte and surrounding communities cooled slightly in 2022 with overall sales volume off 37% compared to the prior year. However, Gunnison County saw a 37% decrease in average days on market to 142, as buyers sought to make moves on properties more quickly in a competitive real estate climate.
Crested Butte South saw the largest jump in average sale price, up 60.9% compared with 2021. The average price per square foot in Crested Butte South notched up 42.5% as the area saw more demand. The highest priced property sold in the Town of Crested Butte was $11.5 million, up 44% from the previous year. The City of Gunnison, just 30 miles from Crested Butte, had an increase of 35% in the average sale price compared to 2021.
With its rugged landscape, independent spirit, and access to untamed wilderness, Crested Butte’s properties appeal to buyers looking for a small-town lifestyle and endless recreation.
GUNNISON COUNTY
coloradomicroreports.com
Based on data from the Gunnison – Crested Butte Association of REALTORS® MLS, Colorado Real Estate Network (CREN). Verify with a local REALTOR®. All information is deemed reliable but not guaranteed. Data maintained by CREN MLS may not reflect all real estate activity in the market.
All Parcels Over 10 Acres January through December 2021 2022 % Change Average Sold Price $1,172,248 $1,115,032 -4.9% Average Price per Acre $13,749 $25,268 83.8% Average Days on Market 351 279 -20.5% Highest Sold Price $27,000,000 $9,400,000 -65.2% Properties Sold 149 70 -53.0% % Sold Price to List Price 93.2% 95.9% 2.8% January through December 2021 2022 % Change Sold Listings (All) 1208 688 -43.0% Sold Single Family 349 196 -43.8% Sold Condos/TH 324 242 -25.3% Average Days on Market 226 142 -37.2% Average Sold Price $723,874 $796,133 10.0% % Sold Price to List Price 96.5% 96.9% 0.4% Total Dollar Volume Sold $874,440,987.00 $547,740,043.00 -37.4% All Properties
MICRO MARKET REPORT | Crested Butte JANUARY - DECEMBER 2022 • COLORADOMICROREPORTS.COM livsothebysrealty.com
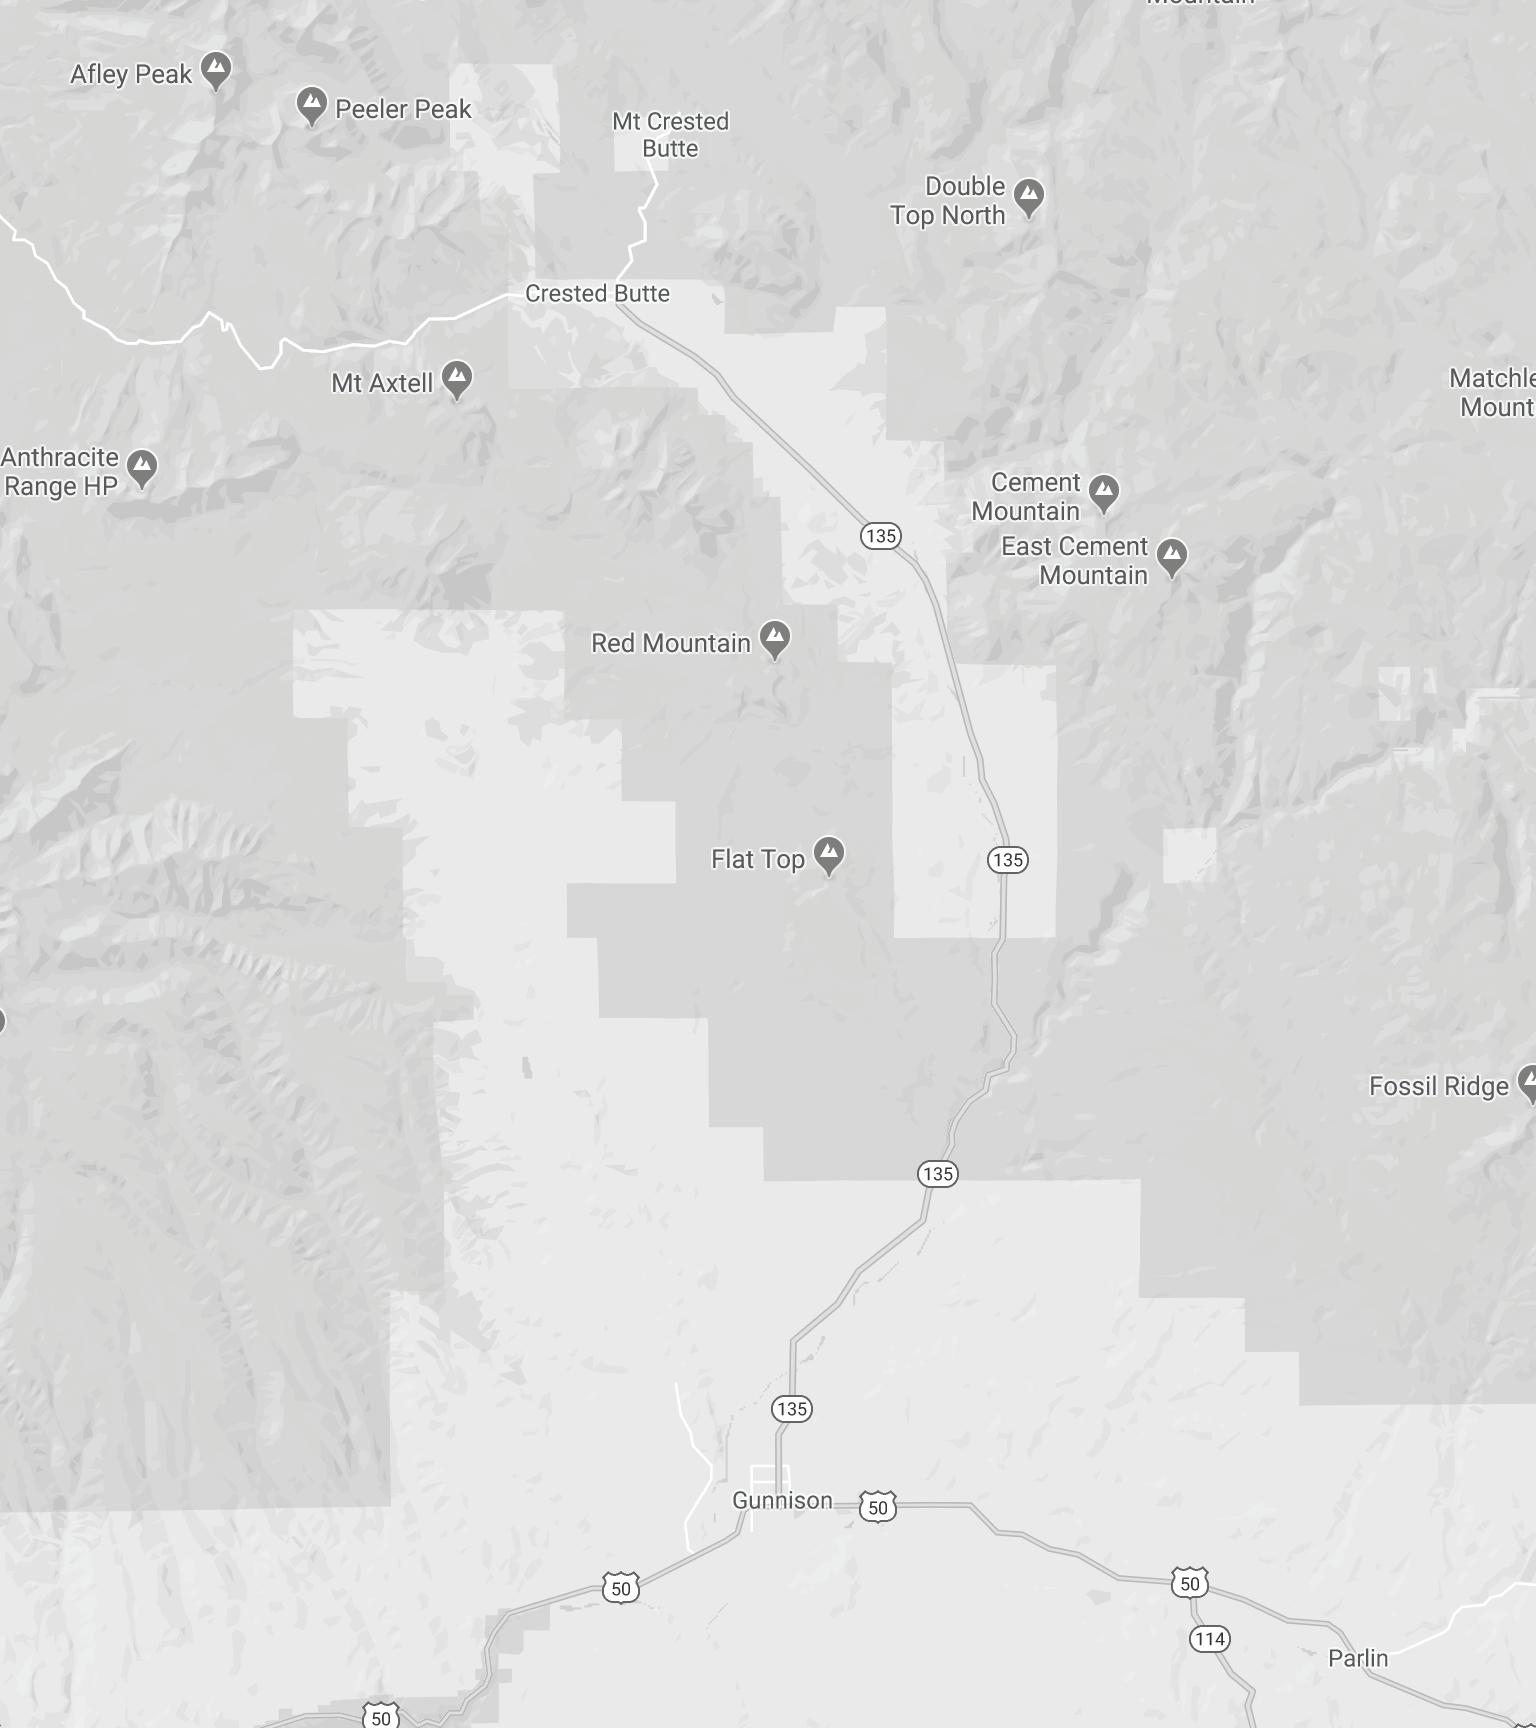
3 5 4 2 1
CRESTED BUTTE NEIGHBORHOODS
1. Town of Crested Butte 2. Mt. Crested Butte 3. Crested Butte South 4. Almont 5. City of Gunnison
The average sold price in the Town of Crested Butte increased by 24.4% January through December 2022 compared to that of 2021.
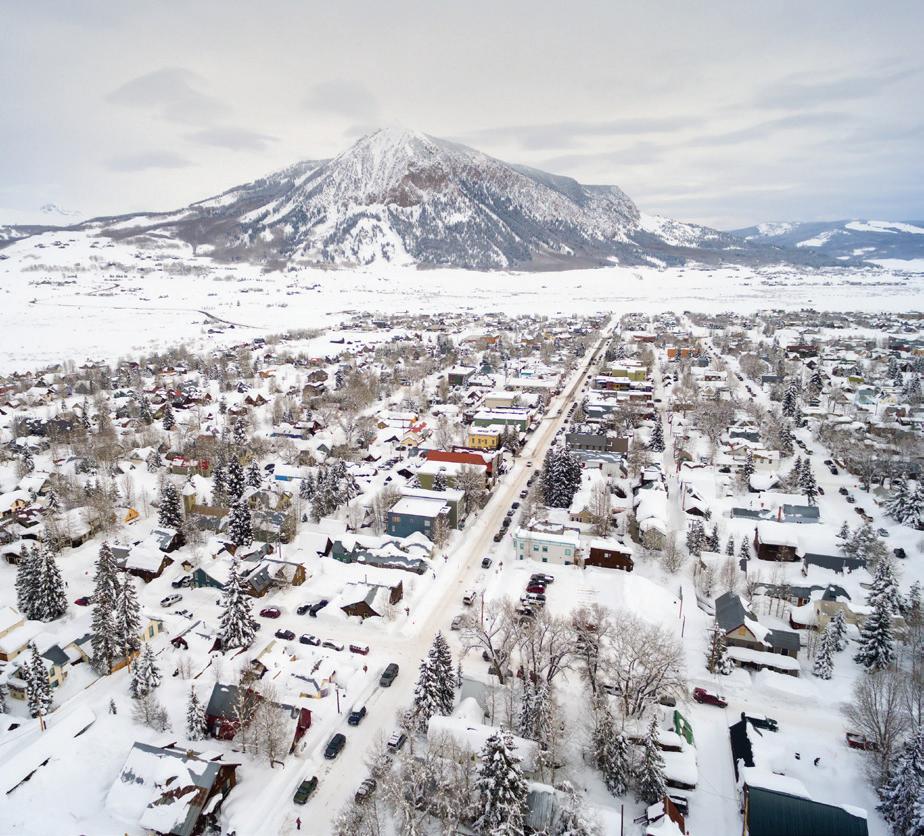
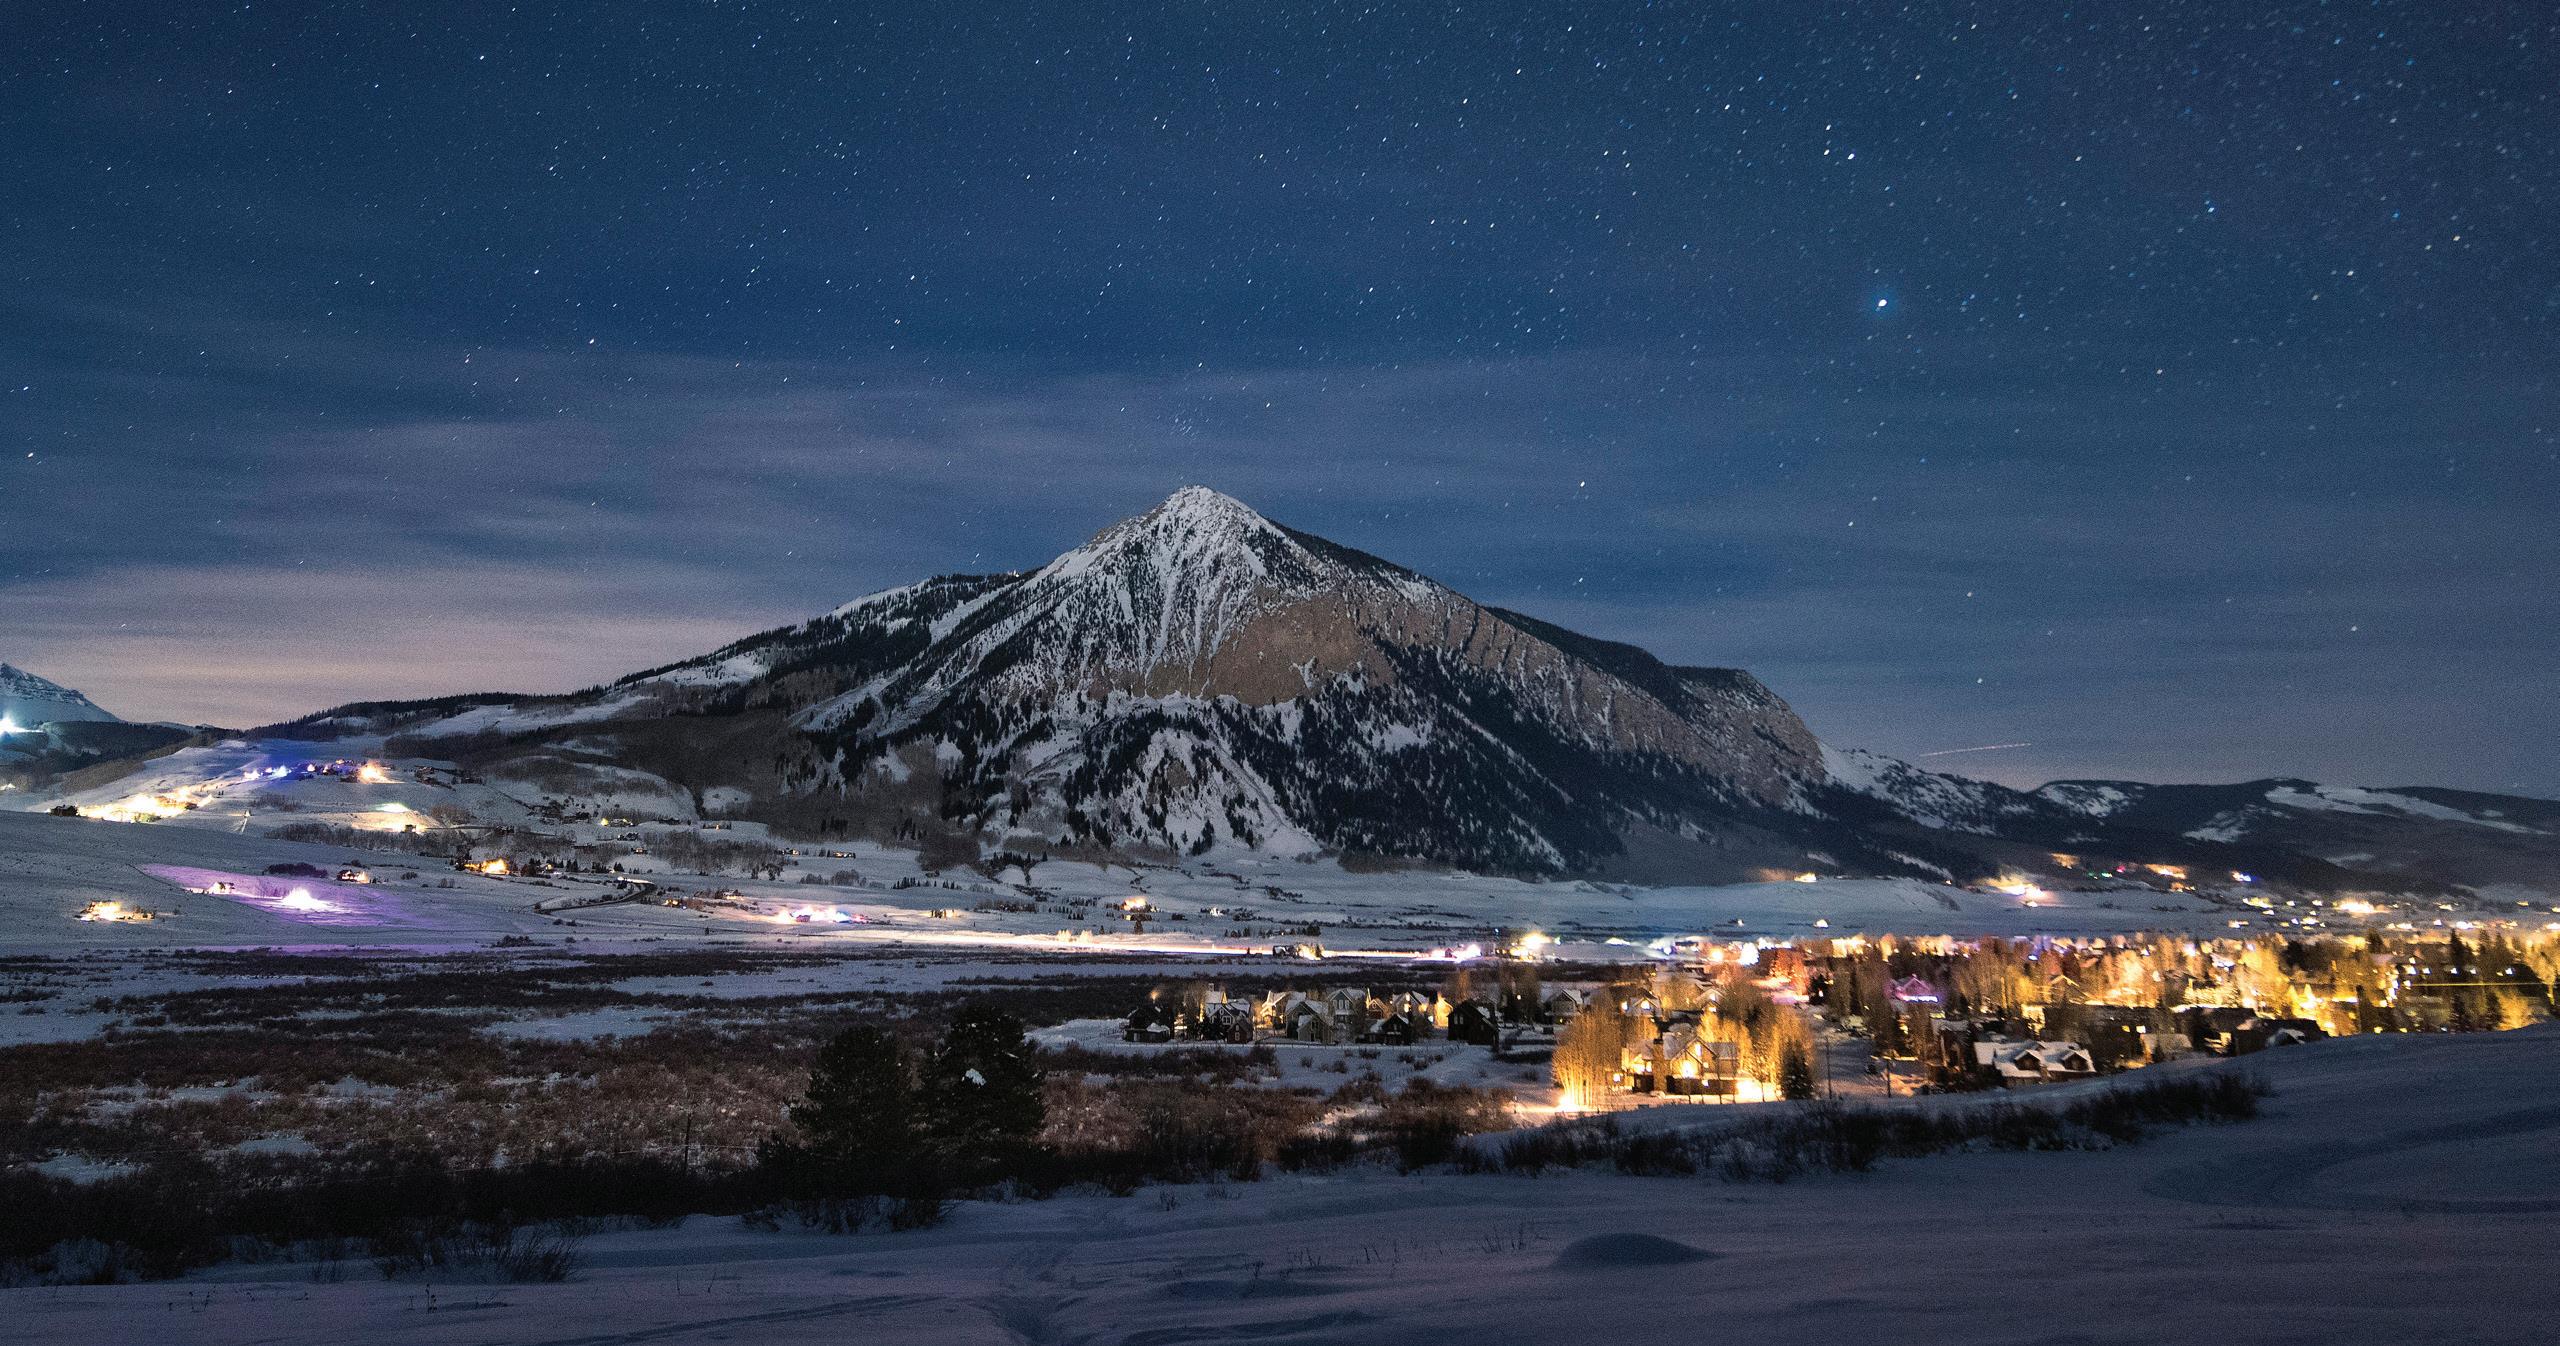
Incorporated in 1880, the Town of Crested Butte rests at an elevation of 8,885 feet and serves as “the Gateway to the Elk Mountains.” Explorer Ferdinand Hayden referred to the dominant peak guarding the residents as a ‘crested butte,’ and the namesake was born.
Residential / Commercial Lots January through December 2021 2022 % Change Average Sold Price $1,405,323 $2,290,692 63.0% Average Price per Acre $5,694,221 $6,986,987 22.7% Average Days on Market 566 995 75.8% Highest Sold Price $5,500,000 $11,550,000 110.0% Properties Sold 17 13 -23.5% % Sold Price to List Price 99.0% 98.9% -0.2% Condominiums, Townhomes, Duplexes and Triplexes January through December 2021 2022 % Change Average Sold Price $604,137 $1,081,611 79.0% Average Price per SqFt $607 $836 37.7% Average Days on Market 187 91 -51.3% Highest Sold Price $1,115,000 $1,850,000 65.9% Properties Sold 20 9 -55.0% % Sold Price to List Price 99.0% 97.6% -1.4% TOWN
OF CRESTED BUTTE 24.4%
All Properties January through December 2021 2022 % Change Average Sold Price $1,696,349 $2,110,828 24.4% Average Price per SqFt $989 $1,030 4.1% Average Days on Market 247 440 78.1% Highest Sold Price $8,000,000 $11,550,000 44.4% Properties Sold 87 38 -56.3% % Sold Price to List Price 96.2% 95.5% -0.8% Single Family Homes January through December 2021 2022 % Change Average Sold Price $2,318,500 $3,087,500 33.2% Average Price per SqFt $993 $1,288 29.6% Average Days on Market 128 212 65.6% Highest Sold Price $4,606,000 $5,100,000 10.7% Properties Sold 30 12 -60.0% % Sold Price to List Price 96.9% 92.9% -4.0%
The average price per square foot in Mt. Crested Butte increased by 24.2% January through December 2022 compared to that of 2021.
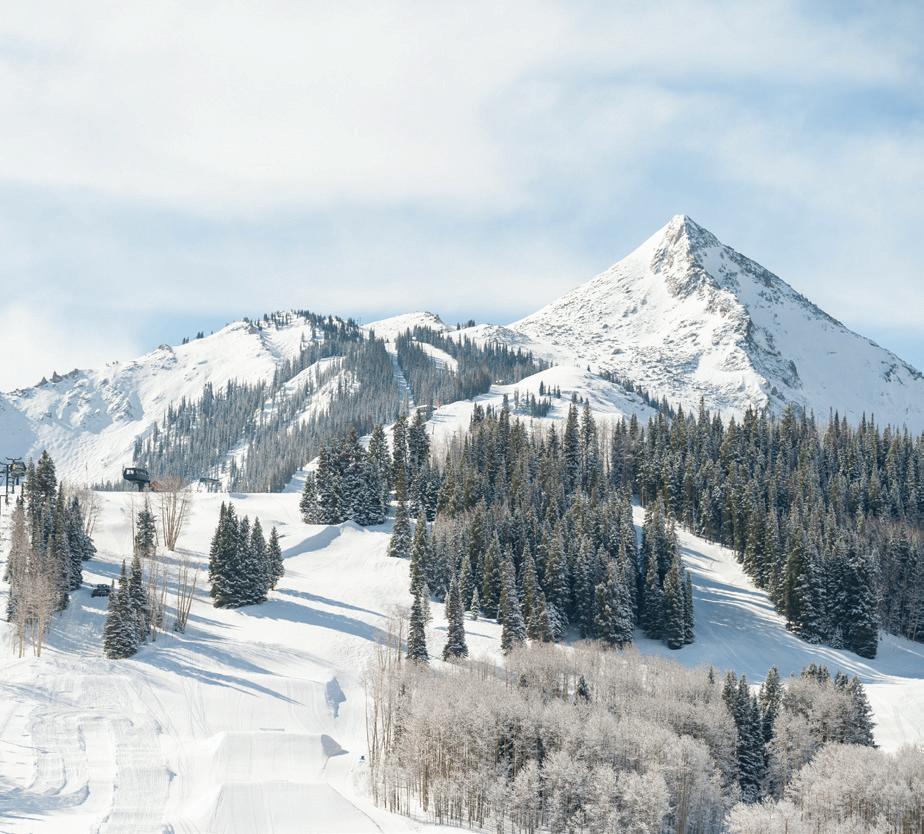
Smaller in size than the Town of Crested Butte (approximately 800 residents compared to 1,500 residents), Mt. Crested Butte is the actual location of the famous resort. Located inside the Gunnison National Forest, this picture-perfect town covers an area just over two square miles, and those two square miles are a skier or snowboarder’s paradise.
MT. CRESTED BUTTE
Single Family Homes January through December 2021 2022 % Change Average Sold Price $2,121,756 $2,074,394 -2.2% Average Price per SqFt $583 $713 22.3% Average Days on Market 126 161 27.8% Highest Sold Price $5,700,000 $3,500,000 -38.6% Properties Sold 41 18 -56.1% % Sold Price to List Price 97.0% 96.8% -0.2% All Properties January through December 2021 2022 % Change Average Sold Price $806,582 $842,195 4.4% Average Price per SqFt $547 $680 24.2% Average Days on Market 324 106 -67.3% Highest Sold Price $5,700,000 $5,500,000 -3.5% Properties Sold 271 157 -42.1% % Sold Price to List Price 97.1% 98.4% 1.3% Condominiums, Townhomes, Duplexes and Triplexes January through December 2021 2022 % Change Average Sold Price $573,731 $632,532 10.2% Average Price per SqFt $541 $675 24.7% Average Days on Market 150 81 -46.0% Highest Sold Price $2,750,000 $3,700,000 34.5% Properties Sold 176 126 -28.4% % Sold Price to List Price 98.5% 99.2% 0.7% Residential / Commercial Lots January through December 2021 2022 % Change Average Sold Price $571,037 $1,168,192 104.6% Average Price per Acre $646,210 $1,414,225 118.8% Average Days on Market 1058 273 -74.2% Highest Sold Price $3,200,000 $5,500,000 71.9% Properties Sold 53 13 -75.5% % Sold Price to List Price 93.4% 97.9% 4.8%
24.2%
38.0%
The average days on market in Crested Butte South decreased by 38.0% January through December 2022 compared to that of 2021.
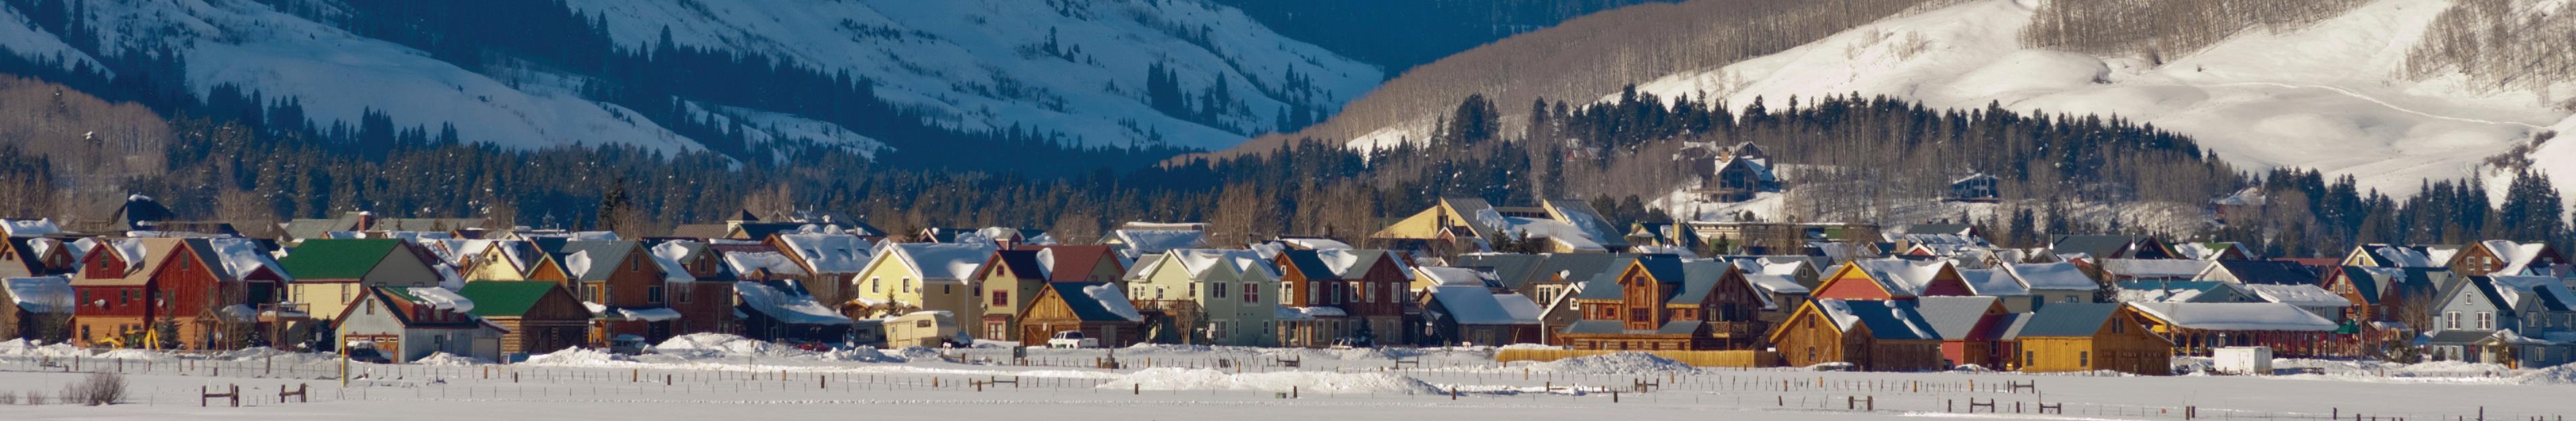
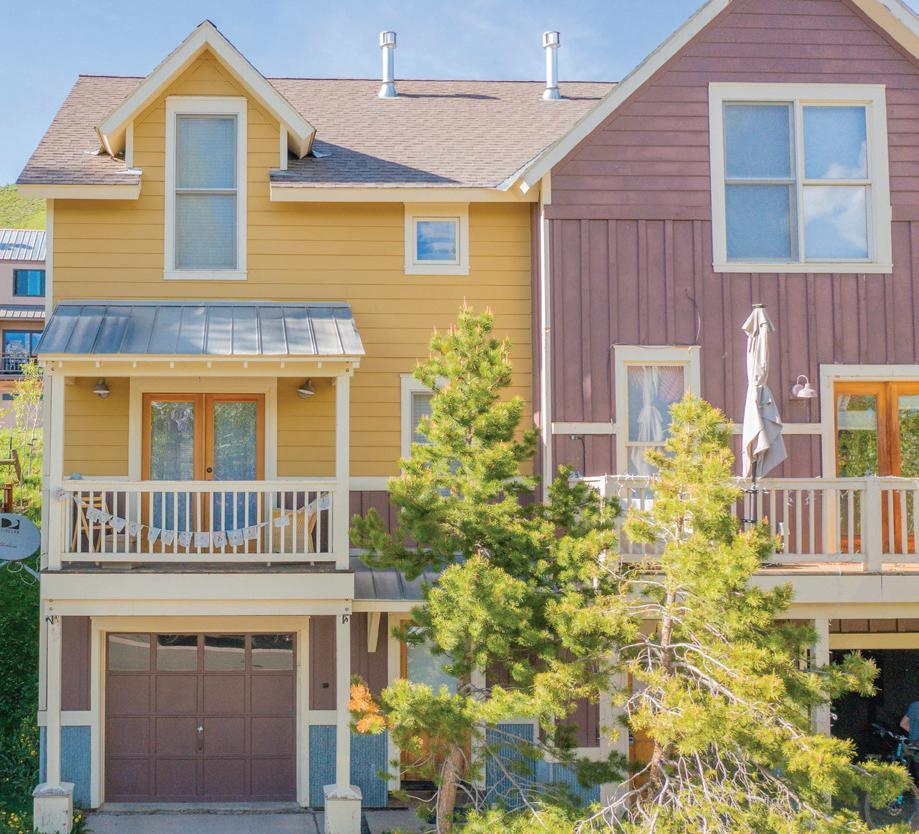
For those who like the area of Crested Butte but perhaps want to shy away from the resort area or the large open rural spaces, Crested Butte South is a subdivision located eight miles south of the town center. This area offers more for those who prefer a suburban setting, yet want to enjoy the clean air and breathtaking vistas of Crested Butte.
CRESTED BUTTE SOUTH
All Properties January through December 2021 2022 % Change Average Sold Price $483,770 $778,579 60.9% Average Price per SqFt $428 $610 42.5% Average Days on Market 179 111 -38.0% Highest Sold Price $1,530,000 $1,647,500 7.7% Properties Sold 99 46 -53.5% % Sold Price to List Price 99.2% 98.0% -1.2% Single Family Homes January through December 2021 2022 % Change Average Sold Price $1,035,864 $1,236,118 19.3% Average Price per SqFt $447 $658 47.3% Average Days on Market 78 76 -2.6% Highest Sold Price $1,530,000 $1,647,500 7.7% Properties Sold 26 14 -46.2% % Sold Price to List Price 100.3% 97.0% -3.2% Condominiums, Townhomes, Duplexes and Triplexes January through December 2021 2022 % Change Average Sold Price $625,000 $876,375 40.2% Average Price per SqFt $433 $568 31.3% Average Days on Market 74 107 44.6% Highest Sold Price $890,000 $1,200,000 34.8% Properties Sold 14 16 14.3% % Sold Price to List Price 99.2% 99.7% 0.5% Residential / Commercial Lots January through December 2021 2022 % Change Average Sold Price $180,887 $280,437 55.0% Average Price per Acre $457,304 $735,812 60.9% Average Days on Market 250 145 -42.0% Highest Sold Price $570,000 $480,000 -15.8% Properties Sold 55 16 -70.9% % Sold Price to List Price 97.3% 96.9% -0.5%
31.6%
The highest sold price in Rural Crested Butte increased by 31.6% January through December 2022 compared to that of 2021.
30.4%
The average price per square foot for condominiums, townhomes, duplexes and triplexes in Rural Crested Butte increased by 30.4% January through December 2022 compared to that of 2021.
RURAL CRESTED BUTTE Condominiums, Townhomes, Duplexes and Triplexes January through December 2021 2022 % Change Average Sold Price $839,385 $865,648 3.1% Average Price per SqFt $530 $691 30.4% Average Days on Market 126 216 71.4% Highest Sold Price $2,410,000 $2,675,000 11.0% Properties Sold 35 27 -22.9% % Sold Price to List Price 100.2% 98.7% -1.5% All Properties January through December 2021 2022 % Change Average Sold Price $999,708 $1,315,355 31.6% Average Price per SqFt $627 $729 16.3% Average Days on Market 209 209 0.0% Highest Sold Price $5,625,000 $7,400,000 31.6% Properties Sold 213 109 -48.8% % Sold Price to List Price 96.7% 96.8% 0.0% Single Family Homes January through December 2021 2022 % Change Average Sold Price $2,173,177 $2,621,138 20.6% Average Price per SqFt $703 $770.95 9.6% Average Days on Market 152 115 -24.3% Highest Sold Price $5,625,000 $7,400,000 31.6% Properties Sold 53 34 -35.8% % Sold Price to List Price 96.2% 96.7% 0.5% Residential / Commercial Lots January through December 2021 2022 % Change Average Sold Price $540,910 $641,989 18.7% Average Price per Acre $462,360 $795,809 72.1% Average Days on Market 257 275 7.0% Highest Sold Price $4,300,000 $1,815,000 -57.8% Properties Sold 123 47 -61.8% % Sold Price to List Price 96.1% 95.5% -0.6%
The average sold price in the City of Gunnison increased by 35.2% January through December 2022 compared to that of 2021.
CITY OF GUNNISON
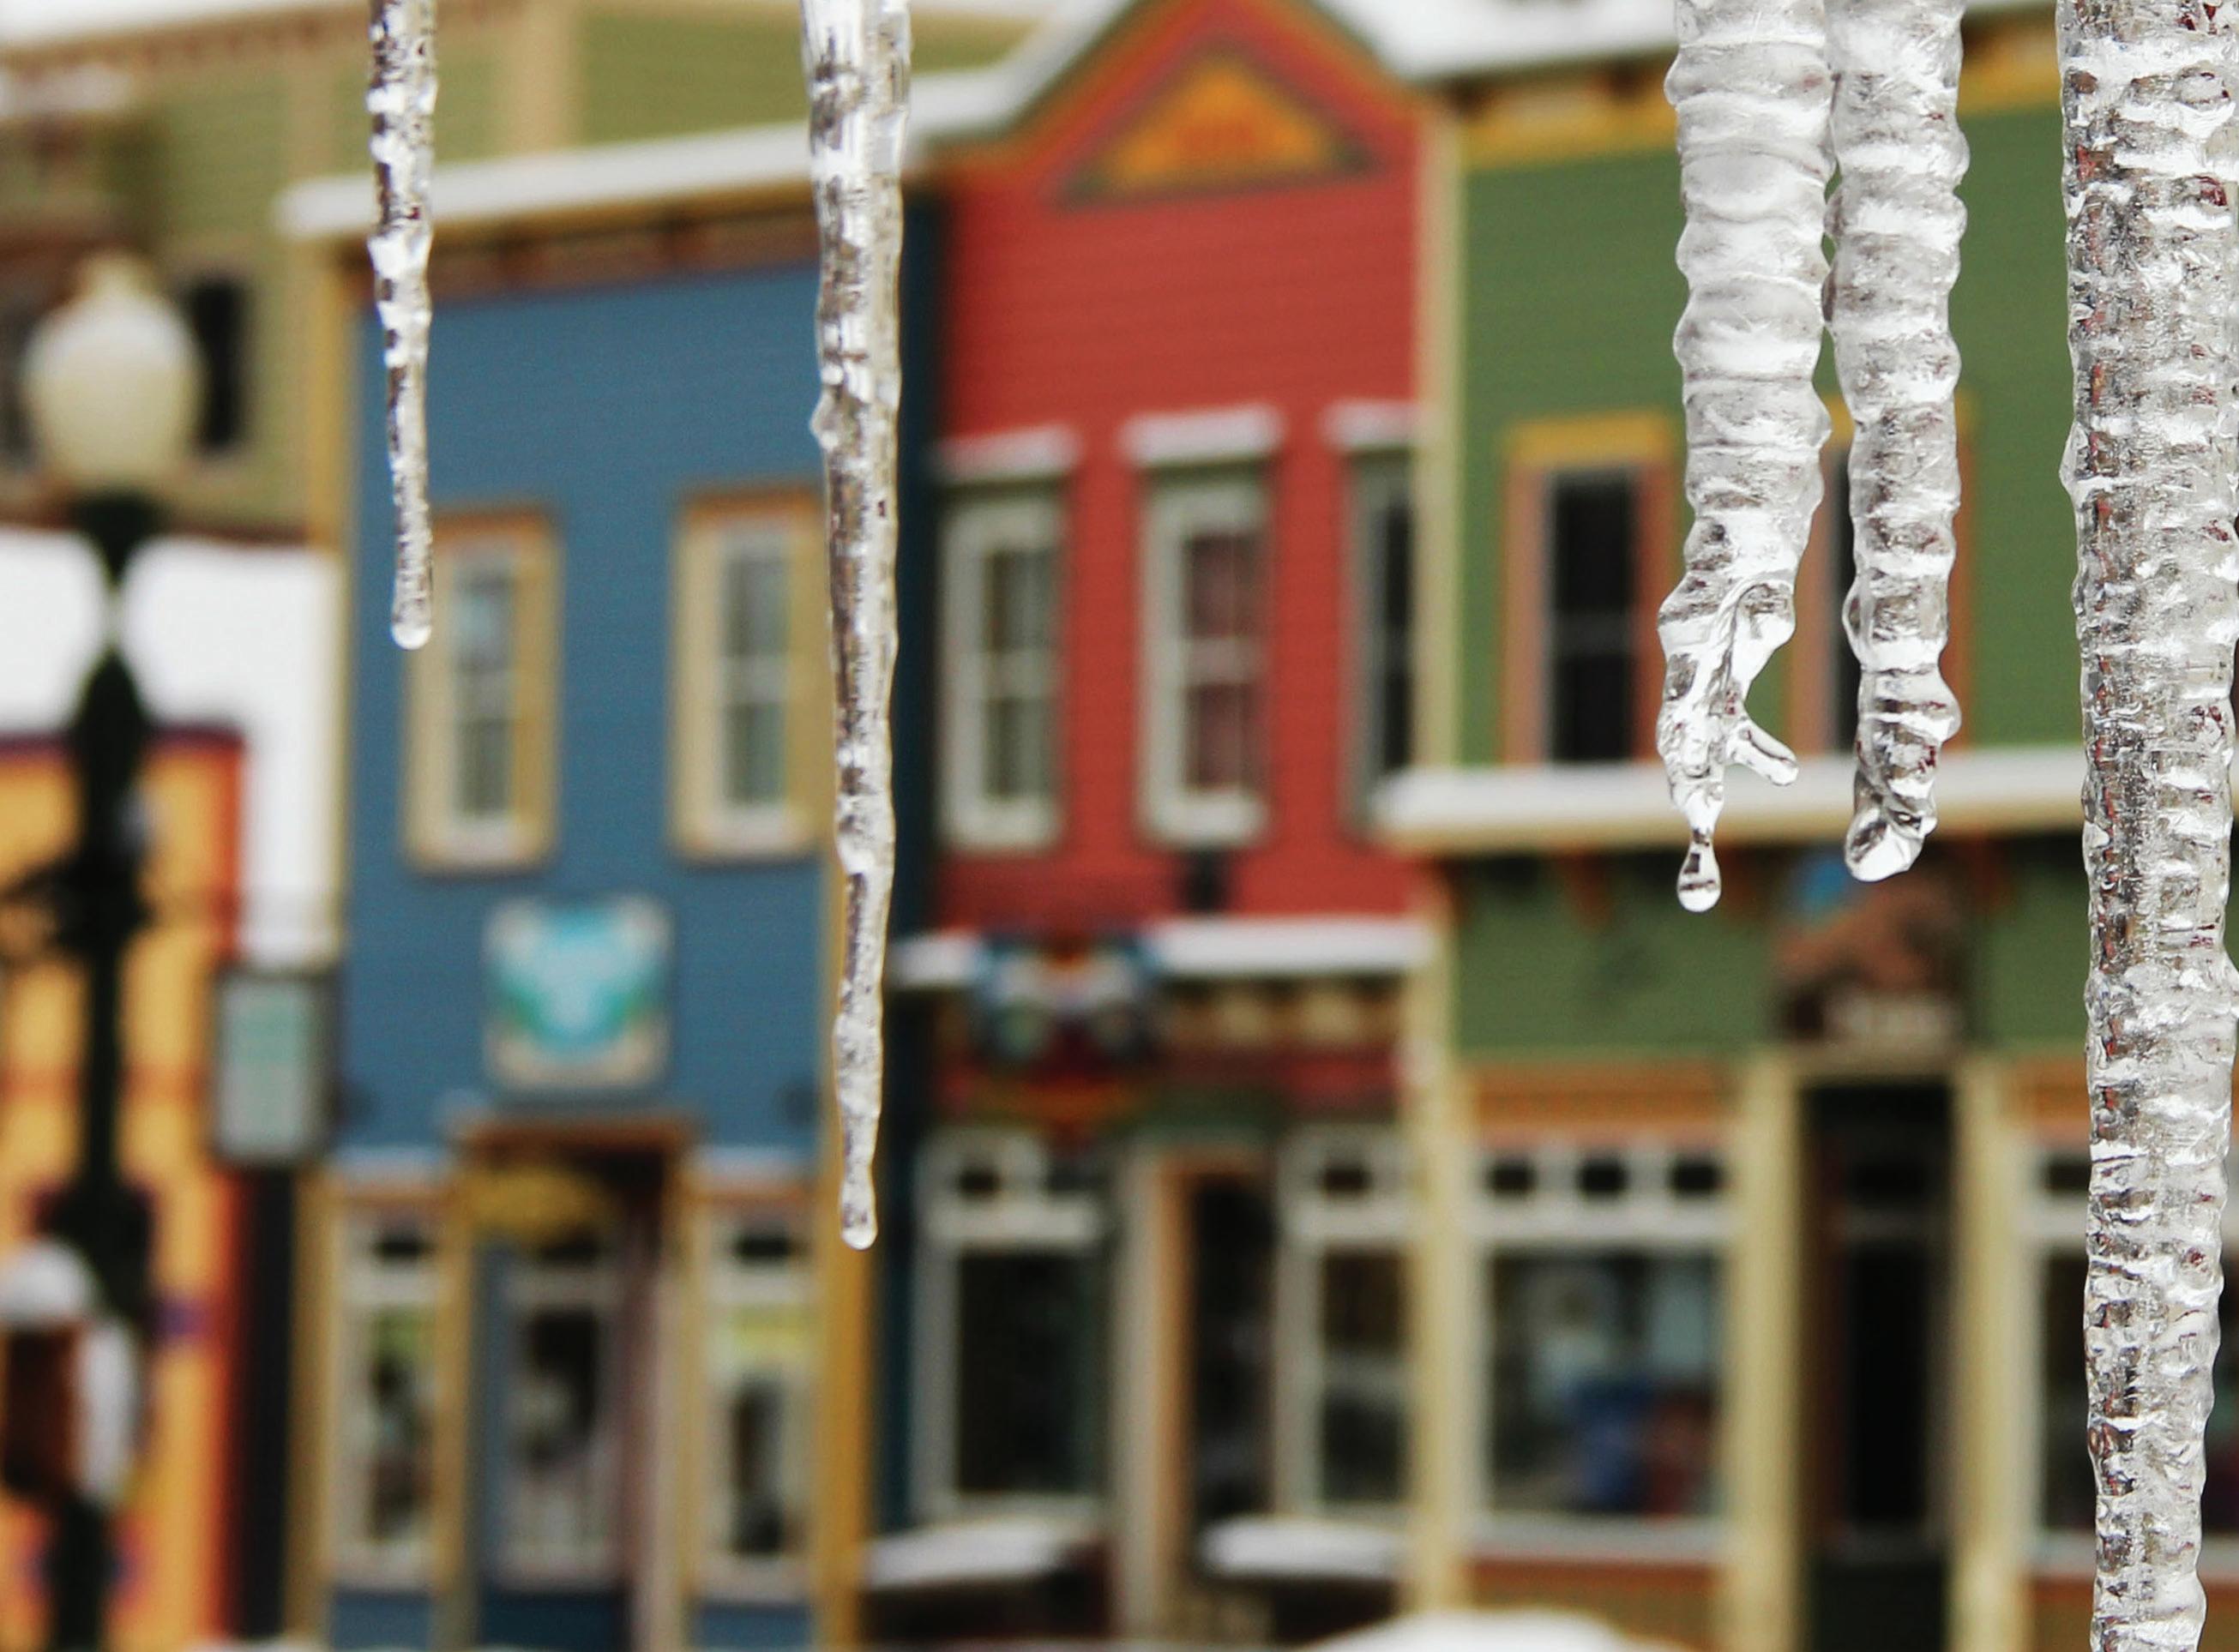
For those who enjoy all that Gunnison County has to offer in the way of skiing and wide-open spaces but still prefer the idea of being in a proper town, the City of Gunnison is an attractive option. The City of Gunnison prides itself on having an Old West heritage feel while still providing the modern comforts of life.
52.1%
The average days on market for residential/ commercial lots in the City of Gunnison decreased by 52.1% January through December 2022 compared to that of 2021.
All Properties January through December 2021 2022 % Change Average Sold Price $401,249 $542,419 35.2% Average Price per SqFt $274 $325 18.6% Average Days on Market 124 77 -37.9% Highest Sold Price $1,850,000 $5,600,000 202.7% Properties Sold 167 121 -27.5% % Sold Price to List Price 97.9% 96.3% -1.6% Single Family Homes January through December 2021 2022 % Change Average Sold Price $500,486 $522,649 4.4% Average Price per SqFt $297 $361 21.6% Average Days on Market 78 74 -5.1% Highest Sold Price $1,125,000 $875,000 -22.2% Properties Sold 68 40 -41.2% % Sold Price to List Price 97.8% 97.1% -0.7% Condominiums, Townhomes, Duplexes and Triplexes January through December 2021 2022 % Change Average Sold Price $315,368 $442,374 40.3% Average Price per SqFt $308 $354 15.2% Average Days on Market 77 65 -15.6% Highest Sold Price $750,000 $650,000 -13.3% Properties Sold 64 61 -4.7% % Sold Price to List Price 99.8% 99.5% -0.3% Residential / Commercial Lots January through December 2021 2022 % Change Average Sold Price $288,300 $1,191,166 313.2% Average Price per Acre $859,929 $1,039,443 20.9% Average Days on Market 340 163 -52.1% Highest Sold Price $550,000 $3,250,000 490.9% Properties Sold 5 3 -40.0% % Sold Price to List Price 94.5% 93.5% -1.1%
35.2%
22.6%
The average price per square foot in Almont & Rural Gunnison increased by 22.6% January through December 2022 compared to that of 2021.
The unincorporated community of Almont was originally named Fisher for the founding family but was then changed to honor a famous racehorse of the late 19th century. In its early history, Almont served as a depot for the various nearby mines to store ore that would later be sent to the larger neighboring town of Gunnison. In modern times, the community and the surrounding rural landscape are popular with visitors and nature lovers with vacation homes.
48.6%
The average price per acre for residential and commercial lots in Almont & Rural Gunnison increased by 48.6% January through December 2022 compared to that of 2021.
ALMONT & RURAL GUNNISON
All Properties January through December 2021 2022 % Change Average Sold Price $570,130 $698,803 22.6% Average Price per SqFt $314 $385 22.6% Average Days on Market 208 153 -26.4% Highest Sold Price $10,000,000 $9,400,000 -6.0% Properties Sold 197 99 -49.7% % Sold Price to List Price 95.6% 95.2% -0.4% Single Family Homes January through December 2021 2022 % Change Average Sold Price $766,696 $793,142 3.4% Average Price per SqFt $352 $356 1.1% Average Days on Market 111 118 6.3% Highest Sold Price $3,100,000 $3,100,000 0.0% Properties Sold 78 45 -42.3% % Sold Price to List Price 97.7% 95.6% -2.2% Condominiums, Townhomes, Duplexes and Triplexes January through December 2021 2022 % Change Average Sold Price $406,366 $450,500 10.9% Average Price per SqFt $281 $336 19.7% Average Days on Market 122 42 -65.6% Highest Sold Price $855,000 $549,000 -35.8% Properties Sold 15 3 -80.0% % Sold Price to List Price 99.9% 101.8% 1.9% Residential / Commercial Lots January through December 2021 2022 % Change Average Sold Price $272,973 $358,099 31.2% Average Price per Acre $73,098 $108,608 48.6% Average Days on Market 345 211 -38.8% Highest Sold Price $1,800,000 $2,600,000 44.4% Properties Sold 80 37 -53.8% % Sold Price to List Price 94.0% 89.7% -4.6%
04 07 28 NATIONAL PARKS MOUNTAIN RANGES SKI AREAS & RESORTS
WHY COLORADO?
COLORADO? AVG DAYS OF SUNSHINE ANNUALY CRAFT BREWERIES 300 350+
MICRO MARKET REPORT | Crested Butte JANUARY - DECEMBER 2022 • COLORADOMICROREPORTS.COM


