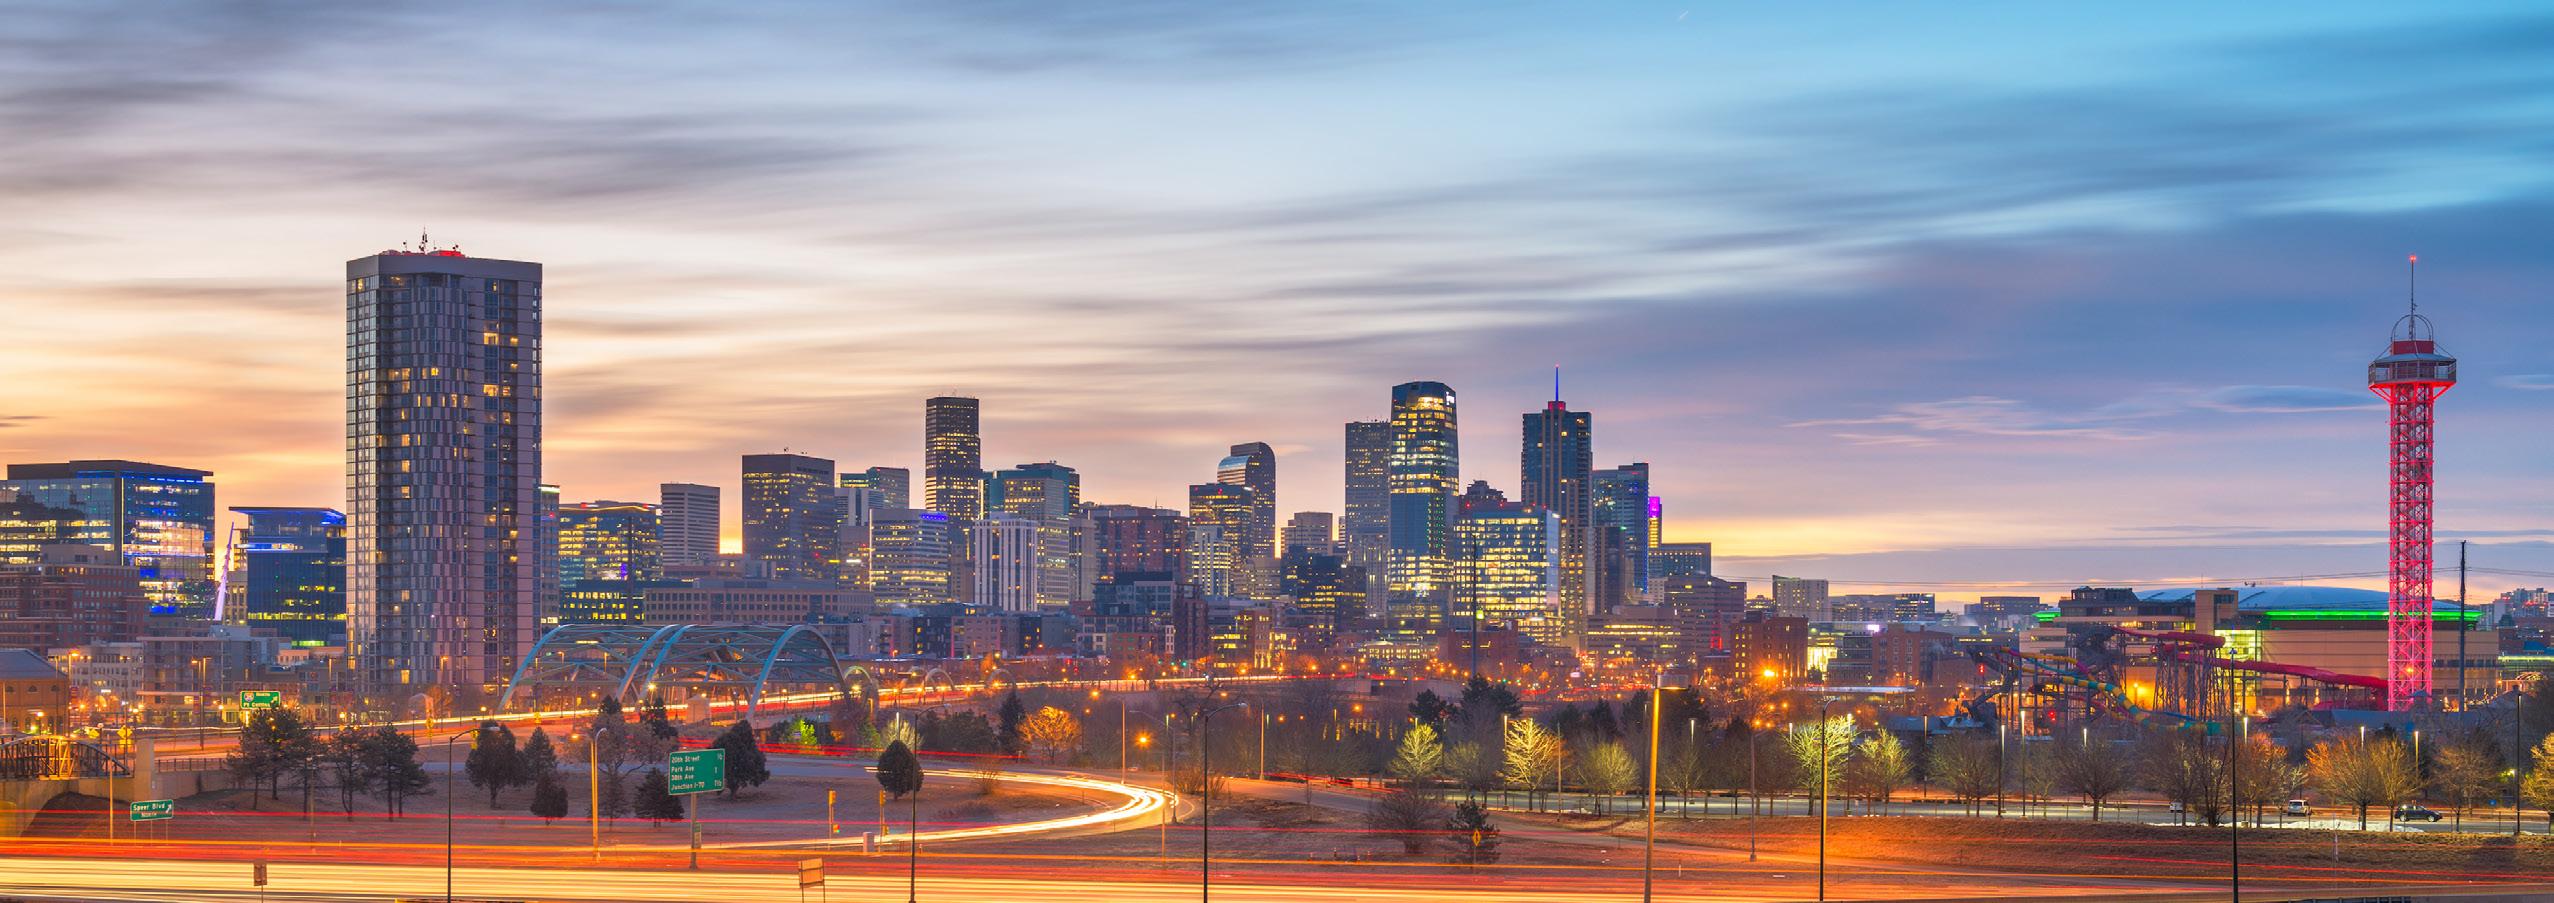
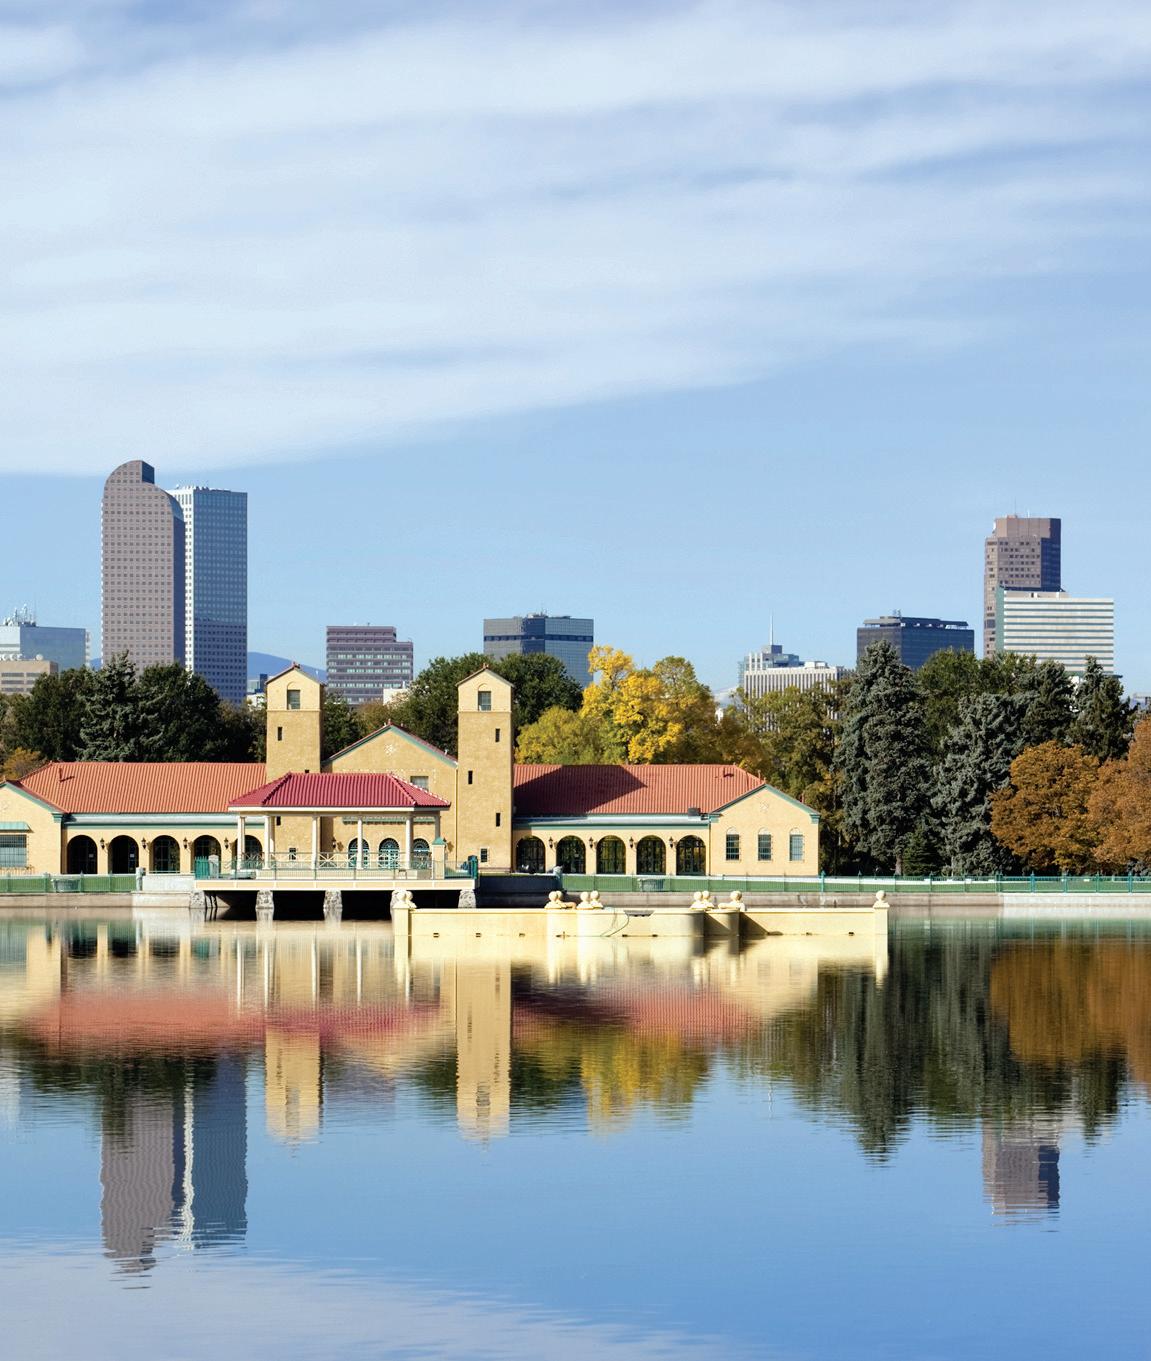
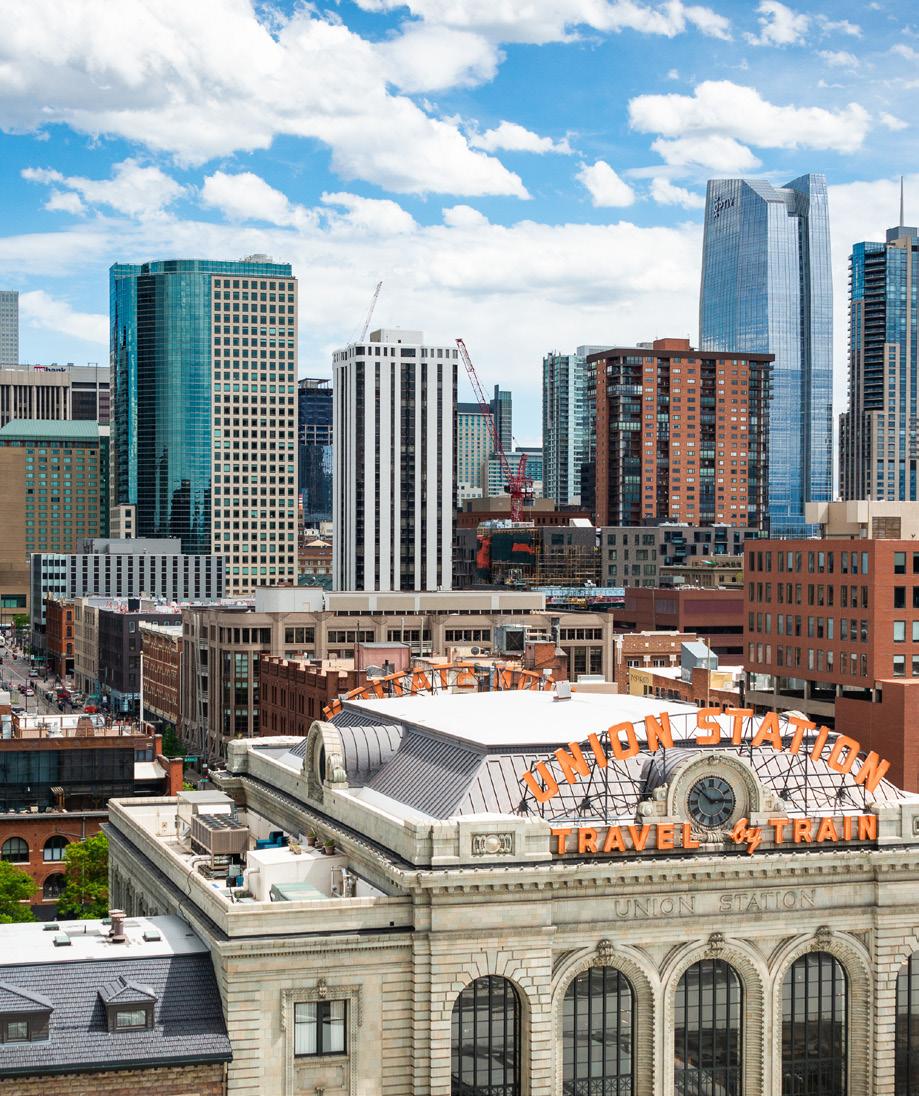
DENVER METRO

QUARTER 1 2023 Micro Market Report
2233 South Madison Street
4190 Preserve Parkway
MARKET UPDATE
Greater Denver’s real estate market is starting off 2023 on a positive note and outperforming many conservative expectations. The number of homes sold across the sixcounty Denver Metro area decreased in comparison to 2022. Through March of this year, there have been 8,830 homes sold—down 20.8% from 2022. However, low inventory coupled with continued buyer demand resulted in housing prices remaining strong and a decrease in the days on market. After a slow end of 2022, momentum is certainly building in Denver’s real estate market.
While rising interest rates mean that buyers have less purchasing power and sellers have come down ever so slightly on pricing, limited inventory and high demand still give sellers a lot of control in this market. During the first quarter of the year, the average price for a singlefamily home in Denver Metro is $720,904—down 3.3% from 2022. Looking at attached homes, the average price through Q1 was $464,351—a 0.7% decrease.
Denver Metro’s individual neighborhoods vary in market trends, as there are many distinctions even within this small geographic region. We are seeing a wide variance in buyer demand for certain neighborhoods, subdivisions, and even buildings. In the first quarter of 2023, Cherry Creek North saw a 29.8% average sales price increase compared to 2022, and the Observatory Park saw a 7.8% decrease for the same time period.
We recognize each locality is unique and no two regions respond to market shifts the same way. To aid in presenting an accurate picture of each of the areas that make up Denver Metro, LIV Sotheby’s International Realty is proud to present our Micro Market Report, representing the metrics of many key and beloved neighborhoods.
The Denver Metro real estate market is making its way back to its regularly observed seasonal buying and selling trends. As this year progresses, this high-demand market will continue to create opportunities for both buyers and sellers to create the life they love.
Counties: Adams, Arapahoe, Broomfield, Denver, Douglas, Jefferson
coloradomicroreports.com Based on Information from REColorado for the period January 1st, 2023 - March 31th, 2023. This representation is based in whole or in part on data supplied by REColorado. REColorado does not guarantee nor is in any way responsible for its accuracy. Data maintained by REColorado may not reflect all real estate activity in the market. January through March 2022 2023 % Change New Listings 13,380 11,111 -17.0% Sold Listings (All Properties) 11,148 8,830 -20.8% Sold Listings (Single Family) 7,488 6,197 -17.2% Sold Listings (Attached) 3,527 2,633 -25.3% Average Days on Market 14 42 200.0% Average Sold Price (Single Family) $745,716 $720,904 -3.3% Average Sold Price (Attached) $467,706 $464,351 -0.7% % Sold Price to Original List Price 103.5% 98.1% -5.2% Total Dollar Volume Sold $7,298,869,109 $5,690,076,350 -22.0%
Denver Metro
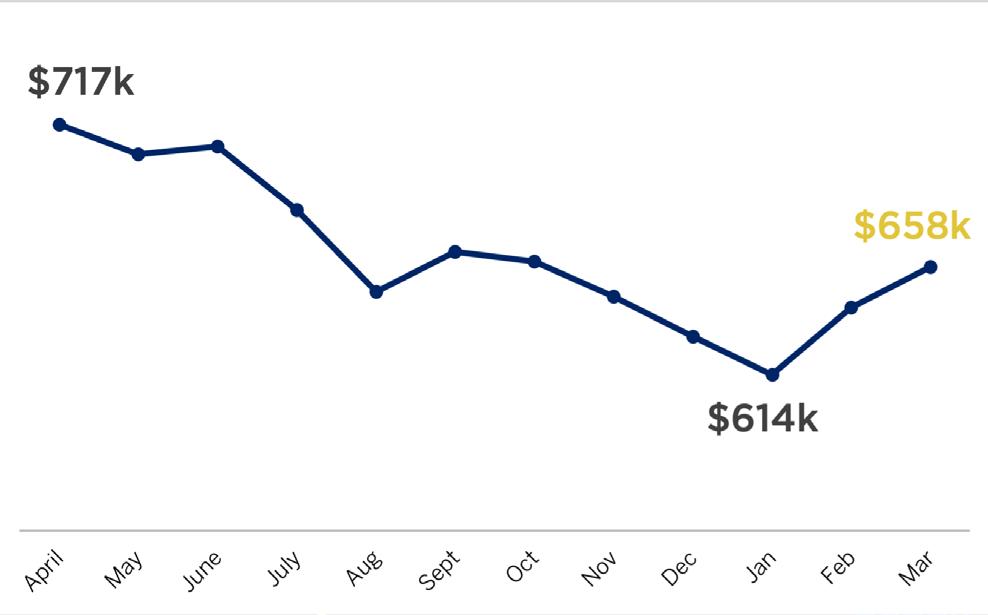
Average Sales Price (All Properties)

MICRO MARKET REPORT | Denver Metro JANUARY - MARCH 2023 • COLORADOMICROREPORTS.COM livsothebysrealty.com
Baker
Belmar
Berkeley
Bonnie Brae / Belcaro
Bow Mar / Bow Mar South
Capitol Hill 7. Central Park 8. Cheesman Park 9. Cherry Creek East / South 10. Cherry Creek North 11. Cherry Hills Village 12. City Park 13. City Park South 14. Columbine Valley 15. Congress Park 16. Cory-Merrill 17. Country Club 18. Crestmoor Park 19. Denver (City) 20. Downtown Denver 21. Golden Triangle 22. Greenwood Village East 23. Greenwood Village West 24. Hale Mayfair 25. Heritage Greens 26. Highlands 27. Hilltop 28. Homestead 29. Jefferson Park 30. Ken Caryl North Ranch 31. Ken Caryl Valley 32. Lakewood 33. LoHi 34. Lowry 35. Montclair 36. Observatory Park 37. Park Hill 38. Platt Park 39. Polo Reserve 40. RiNo 41. Saddle Rock Golf Club 42. Sloan’s Lake 43. Southern Hills 44. Southglenn 45. Southmoor Park 46. Sunnyside 47. Tallyn’s Reach 48. Uptown 49. Washington Park East 50. Washington Park West 19 1 3 5 46 8 15 14 37 12 9 35 21 17 13 43 11 27 32 33 41 38 30 22 20 4 2 36 34 23 7 44 18 26 16 29 24 31 28 25 40 39 42 47 48 49 50 10 6 45 51
DENVER METRO NEIGHBORHOODS 1.
2.
3.
4.
5.
6.
City of Denver
Baker, which was designated a historic district by the city of Denver in 2000, is lined with 19th-century brick houses and charming local restaurants and businesses.
22.4%
The average home sale price in Belmar decreased by 22.4% in the first quarter of 2023 compared to that of 2022.
Boundaries: 6th Avenue to Mississippi; South Platte River to Broadway
Boundaries: Kentucky to Alameda; Wadsworth to Pierce
DENVER (CITY) BAKER BELMAR
January through March 2022 2023 % Change Average Price $586,583 $455,000 -22.4% Average Price Per Square Foot $381 $345 -9.5% Average Days on Market 11 31 181.8% Highest Price $1,195,000 $645,000 -46.0% Properties Sold 6 6 0.0% % Sold Price to List Price 106.0% 96.6% -8.9% January through March 2022 2023 % Change Average Price $679,243 $699,893 3.0% Average Price Per Square Foot $484 $467 -3.6% Average Days on Market 17 38 123.5% Highest Price $9,000,000 $5,700,000 -36.7% Properties Sold 3,054 2,147 -29.7% % Sold Price to List Price 104.2% 96.7% -7.2%
January through March 2022 2023 % Change Average Price $690,721 $552,214 -20.1% Average Price Per Square Foot $541 $553 2.2% Average Days on Market 21 39 85.7% Highest Price $1,227,500 $801,500 -34.7% Properties Sold 24 14 -41.7% % Sold Price to List Price 105.7% 97.0% -8.2%
Boundaries:
Designed to resemble a Scottish village, Bonnie Brae/Belcaro features winding tree-lined streets, a circular central park, and a collection of small shops.
33.3%
The number of properties sold in Bow Mar/Bow Mar South increased by 33.3% in the first quarter of 2023 compared to that of 2022.
Boundaries: W 38th Ave to I-70; Sheridan to Federal Boundaries: West Quincy Avenue to West Bowles Avenue January through March 2022 2023 % Change Average Price $2,033,333 $1,615,000 -20.6% Average Price Per Square Foot $705 $658 -6.7% Average Days on Market 4 15 275.0% Highest Price $2,350,000 $2,050,000 -12.8% Properties Sold 3 4 33.3% % Sold Price to List Price 111.9% 97.1% -13.2% January through March 2022 2023 % Change Average Price $902,842 $1,041,112 15.3% Average Price Per Square Foot $700 $684 -2.3% Average Days on Market 13 32 146.2% Highest Price $2,565,000 $2,075,000 -19.1% Properties Sold 26 19 -26.9% % Sold Price to List Price 109.7% 96.2% -12.3% Boundaries: Mississippi to Cherry Creek Drive South; University to Colorado January through March 2022 2023 % Change Average Price $2,085,559 $2,092,104 0.3% Average Price Per Square Foot $851 $760 -10.8% Average Days on Market 9 27 200.0% Highest Price $5,500,000 $4,100,000 -25.5% Properties Sold 14 9 -35.7% % Sold Price to List Price 106.8% 94.9% -11.2% BOW MAR/BOW MAR SOUTH BONNIE BRAE/BELCARO BERKELEY
The number of properties sold in Central Park increased by 50.0% in the first quarter of 2023 compared to that of 2022.
CAPITOL HILL Boundaries: Broadway to Downing; 6th Avenue to Colfax CENTRAL PARK CHEESMAN PARK Boundaries: York to Downing; Colfax to 8th Avenue January through March 2022 2023 % Change Average Price $577,936 $565,553 -2.1% Average Price Per Square Foot $475 $471 -0.9% Average Days on Market 18 39 116.7% Highest Price $3,250,000 $1,975,000 -39.2% Properties Sold 38 29 -23.7% % Sold Price to List Price 101.7% 94.6% -6.9% January through March 2022 2023 % Change Average Price $466,161 $506,356 8.6% Average Price Per Square Foot $430 $443 3.2% Average Days on Market 14 48 242.9% Highest Price $4,600,000 $1,853,603 -59.7% Properties Sold 100 51 -49.0% % Sold Price to List Price 103.1% 95.1% -7.8% Boundaries: Quebec to Havana; Montview to 64th January through March 2022 2023 % Change Average Price $997,185 $947,741 -5.0% Average Price Per Square Foot $446 $426 -4.5% Average Days on Market 10 52 420.0% Highest Price $1,650,000 $1,837,500 11.4% Properties Sold 54 81 50.0% % Sold Price to List Price 106.2% 96.4% -9.2%
50.0%
Cherry Creek East/South is an affluent residential district with a vibrant shopping scene. Overlooking the creek itself, Cherry Creek Mall has department stores, highend fashion boutiques, and eclectic eateries.
75.0%
The number of properties sold in Cherry Hills Village (under one acre) increased by 75.0% in the first quarter of 2023 compared to that of 2022.
Boundaries: University to Colorado; Alameda to 1st Avenue January through March 2022 2023 % Change Average Price $2,832,113 $2,915,357 2.9% Average Price Per Square Foot $720 $723 0.4% Average Days on Market 4 35 775.0% Highest Price $7,100,000 $5,225,000 -26.4% Properties Sold 8 14 75.0% % Sold Price to List Price 112.5% 103.4% -8.1% January through March 2022 2023 % Change Average Price $808,826 $1,116,217 38.0% Average Price Per Square Foot $471 $444 -5.7% Average Days on Market 26 46 76.9% Highest Price $1,850,000 $4,250,000 129.7% Properties Sold 22 23 4.5% % Sold Price to List Price 102.4% 96.7% -5.6% Boundaries: York to Colorado; 1st Avenue to 6th Avenue January through March 2022 2023 % Change Average Price $1,811,882 $2,352,145 29.8% Average Price Per Square Foot $764 $794 3.9% Average Days on Market 32 24 -25.0% Highest Price $9,000,000 $5,700,000 -36.7% Properties Sold 35 26 -25.7% % Sold Price to List Price 100.3% 96.7% -3.5% CHERRY HILLS VILLAGE CHERRY CREEK NORTH CHERRY CREEK EAST/SOUTH
(Under One Acre) Boundaries: Hampden to Belleview; Clarkson to Happy Canyon Road and Charlou
(Over One Acre) Boundaries: Hampden to Belleview; Clarkson to Happy Canyon Road and Charlou
20.0%
The average number of days on market in City Park decreased by 20.0% in the first quarter of 2023 compared to that of 2022.
Boundaries: Downing to York; 18th to Martin Luther King
Boundaries: York to Colorado; Colfax to 17th
CHERRY HILLS VILLAGE CITY PARK CITY PARK SOUTH
January through March 2022 2023 % Change Average Price $1,092,500 $983,500 -10.0% Average Price Per Square Foot $586 $775 32.1% Average Days on Market 4 64 1500.0% Highest Price $1,225,000 $1,105,000 -9.8% Properties Sold 2 2 0.0% % Sold Price to List Price 107.5% 96.8% -9.9% January through March 2022 2023 % Change Average Price $4,080,769 $4,862,944 19.2% Average Price Per Square Foot $766 $855 11.5% Average Days on Market 46 53 15.2% Highest Price $9,000,000 $8,000,000 -11.1% Properties Sold 13 9 -30.8% % Sold Price to List Price 97.5% 94.8% -2.8%
January through March 2022 2023 % Change Average Price $754,762 $863,293 14.4% Average Price Per Square Foot $531 $478 -10.1% Average Days on Market 20 16 -20.0% Highest Price $1,310,000 $1,650,000 26.0% Properties Sold 21 15 -28.6% % Sold Price to List Price 102.7% 93.9% -8.5%
200.0%
The number of properties sold in Columbine Valley increased by 200.0% in the first quarter of 2023 compared to that of 2022.
Named after John J. Cory and Louise A. Merrill, two influential Denver educators, Cory-Merrill is a popular area for residents looking for a laid-back, family-friendly neighborhood.
Boundaries: South Polo Ridge Drive to West Bowles; Platte Canyon Road to South Platte River Boundaries: South University Blvd to South Colorado Blvd; 1-25 to East Mississippi Ave January through March 2022 2023 % Change Average Price $1,237,250 $1,366,944 10.5% Average Price Per Square Foot $700 $612 -12.5% Average Days on Market 18 42 133.3% Highest Price $3,190,000 $2,750,000 -13.8% Properties Sold 27 18 -33.3% % Sold Price to List Price 102.0% 92.1% -9.7% January through March 2022 2023 % Change Average Price $1,990,000 $1,809,204 -9.1% Average Price Per Square Foot $474 $513 8.2% Average Days on Market 4 33 725.0% Highest Price $2,925,000 $2,400,000 -17.9% Properties Sold 3 9 200.0% % Sold Price to List Price 103.9% 95.9% -7.7% Boundaries: York to Colorado; 6th Avenue to Colfax January through March 2022 2023 % Change Average Price $754,555 $947,445 25.6% Average Price Per Square Foot $527 $598 13.6% Average Days on Market 14 21 50.0% Highest Price $1,736,000 $4,000,000 130.4% Properties Sold 40 32 -20.0% % Sold Price to List Price 104.6% 98.6% -5.7% CORYMERRILL CONGRESS PARK COLUMBINE VALLEY
63.2%
The average number of days on market in Country Club decreased by 63.2% in the first quarter of 2023 compared to that of 2022.
33.3%
The average home sale price in Crestmoor Park increased by 33.3% in the first quarter of 2023 compared to that of 2022.
(Attached Dwellings) Boundaries: Downtown Denver MLS Area
COUNTRY CLUB
University to Downing 1st - 4th; Race to University 4th - 6th CRESTMOOR PARK DOWNTOWN DENVER January through March 2022 2023 % Change Average Price $748,603 $667,152 -10.9% Average Price Per Square Foot $556 $554 -0.3% Average Days on Market 56 51 -8.9% Highest Price $4,100,000 $1,810,000 -55.9% Properties Sold 154 84 -45.5% % Sold Price to List Price 99.0% 96.2% -2.8% January through March 2022 2023 % Change Average Price $1,808,750 $2,124,144 17.4% Average Price Per Square Foot $729 $741 1.7% Average Days on Market 19 7 -63.2% Highest Price $2,150,000 $2,350,000 9.3% Properties Sold 4 2 -50.0% % Sold Price to List Price 91.1% 90.6% -0.5%
Holly to Monaco; Bayaud to 6th Avenue January through March 2022 2023 % Change Average Price $2,263,100 $3,017,000 33.3% Average Price Per Square Foot $682 $742 8.8% Average Days on Market 7 10 42.9% Highest Price $3,895,000 $4,851,000 24.5% Properties Sold 5 2 -60.0% % Sold Price to List Price 109.8% 96.9% -11.7%
Boundaries:
Boundaries:
Greenwood Village East contains nationally recognized business parks, like the Denver Tech Center, a variety of delicious restaurants, and the popular Fiddler’s Green Amphitheater.
3.2%
The average price per square foot in Greenwood Village West (under one acre) increased by 3.2% in the first quarter of 2023 compared to that of 2022.
Boundaries: North Speer Blvd to Broadway; Colfax to 7th January through March 2022 2023 % Change Average Price $2,746,992 $2,430,455 -11.5% Average Price Per Square Foot $618 $637 3.2% Average Days on Market 17 17 0.0% Highest Price $6,725,000 $3,500,000 -48.0% Properties Sold 12 11 -8.3% % Sold Price to List Price 104.0% 99.2% -4.6% January through March 2022 2023 % Change Average Price $614,314 $598,857 -2.5% Average Price Per Square Foot $431 $423 -1.9% Average Days on Market 43 51 18.6% Highest Price $994,500 $940,000 -5.5% Properties Sold 23 7 -69.6% % Sold Price to List Price 100.9% 97.9% -3.0% Boundaries: I-25 to Havana; Belleview to Orchard January through March 2022 2023 % Change Average Price $1,670,200 $1,496,666 -10.4% Average Price Per Square Foot $548 $580 5.8% Average Days on Market 7 20 185.7% Highest Price $2,200,000 $2,025,000 -8.0% Properties Sold 5 3 -40.0% % Sold Price to List Price 106.0% 99.1% -6.5% GREENWOOD VILLAGE WEST GREENWOOD VILLAGE EAST GOLDEN TRIANGLE
(Under One Acre) Boundaries: Orchard to Belleview; Clarkson to I-25
97.9%
The highest sale price in Greenwood Village West (over one acre) increased by 97.9% in the first quarter of 2023 compared to that of 2022.
Hale Mayfair is a mature neighborhood located in East Denver with close proximity to both Rose Hospital and National Jewish Hospital. Here you will find a variety of large Victorian homes surrounded by many restaurants and cafes.
11.3%
The highest sale price in Heritage Greens increased by 11.3% in the first quarter of 2023 compared to that of 2022.
GREENWOOD VILLAGE WEST HALE MAYFAIR HERITAGE GREENS Boundaries: Dry Creek to County Line; Colorado Blvd to Holly January through March 2022 2023 % Change Average Price $1,420,750 $1,362,500 -4.1% Average Price Per Square Foot $501 $452 -9.8% Average Days on Market 3 16 433.3% Highest Price $1,651,000 $1,837,500 11.3% Properties Sold 4 3 -25.0% % Sold Price to List Price 111.9% 100.4% -10.3% January through March 2022 2023 % Change Average Price $2,400,000 $2,800,000 16.7% Average Price Per Square Foot $697 $602 -13.5% Average Days on Market 2 39 1850.0% Highest Price $2,400,000 $4,750,000 97.9% Properties Sold 1 3 200.0% % Sold Price to List Price 104.4% 92.1% -11.8% Boundaries: Colorado to Holly; 6th to Colfax January through March 2022 2023 % Change Average Price $838,249 $737,583 -12.0% Average Price Per Square Foot $654 $638 -2.5% Average Days on Market 3 51 1600.0% Highest Price $1,494,000 $895,000 -40.1% Properties Sold 15 12 -20.0% % Sold Price to List Price 107.9% 94.4% -12.5% (Over One Acre) Boundaries: Orchard to Belleview; Clarkson to I-25
Boundaries: Colorado to Quebec; Arapahoe to Dry Creek
86.4%
The average number of days on market in Highlands increased by 86.4% in the first quarter of 2023 compared to that of 2022.
2.2%
The average sale price in Homestead decreased by 2.2% in the first quarter of 2023 compared to that of 2022.
Boundaries: W 38th Avenue to Speer Blvd; S Platte River to Federal Blvd January through March 2022 2023 % Change Average Price $783,334 $766,063 -2.2% Average Price Per Square Foot $437 $431 -1.4% Average Days on Market 14 52 271.4% Highest Price $2,044,116 $1,503,000 -26.5% Properties Sold 21 16 -23.8% % Sold Price to List Price 106.4% 94.3% -11.4% January through March 2022 2023 % Change Average Price $922,903 $904,673 -2.0% Average Price Per Square Foot $648 $628 -3.0% Average Days on Market 22 41 86.4% Highest Price $2,775,000 $1,825,000 -34.2% Properties Sold 39 33 -15.4% % Sold Price to List Price 106.7% 94.1% -11.8% Boundaries: Alameda to 6th; Colorado to Holly January through March 2022 2023 % Change Average Price $2,181,447 $1,912,525 -12.3% Average Price Per Square Foot $707 $567 -19.8% Average Days on Market 6 46 666.7% Highest Price $4,000,000 $4,200,000 5.0% Properties Sold 15 10 -33.3% % Sold Price to List Price 106.6% 91.0% -14.6% HOMESTEAD HILLTOP HIGHLANDS
With both new residential and commercial developments, Jefferson Park offers a mix of both young professionals and families.
Federal Blvd to S Platte River; South of 29th Ave & Speer Blvd, North of Mile High Stadium
14.8%
The highest home sale price in Ken Caryl Valley increased by 14.8% in the first quarter of 2023 compared to that of 2022.
Red Fox Lane to North Ranch Road; Golden Eagle Road to Blue Grouse Ridge Road
JEFFERSON PARK KEN CARYL NORTH RANCH KEN CARYL VALLEY Boundaries:
Carly Ave January through March 2022 2023 % Change Average Price $1,295,538 $1,290,813 -0.4% Average Price Per Square Foot $469 $455 -3.1% Average Days on Market 4 30 650.0% Highest Price $1,900,000 $2,181,500 14.8% Properties Sold 13 8 -38.5% % Sold Price to List Price 109.8% 97.3% -11.3% January through March 2022 2023 % Change Average Price $662,700 $711,843 7.4% Average Price Per Square Foot $576 $529 -8.2% Average Days on Market 12 53 341.7% Highest Price $1,002,000 $975,000 -2.7% Properties Sold 24 7 -70.8% % Sold Price to List Price 105.2% 97.6% -7.2% Boundaries:
January through March 2022 2023 % Change Average Price $1,938,750 $1,750,000 -9.7% Average Price Per Square Foot $423 $473 11.8% Average Days on Market 9 0 -100.0% Highest Price $2,127,500 $1,900,000 -10.7% Properties Sold 2 2 0.0% % Sold Price to List Price 100.7% 100.0% -0.7%
Tamarade Drive to Manor House Road; Mountain High Court to West Ken
Boundaries:
The Lower Highlands, LoHi for short, is an area admired for its hip restaurants, renovated bungalows, and an ice cream shop in a giant milk can. A hot spot for entertainment, retail shops, and
it is
6.4%
The average home sale price in Lowry increased by 6.4% in the first quarter of 2023 compared to that of 2022.
Boundaries: City of Lakewood January through March 2022 2023 % Change Average Price $1,193,182 $1,269,143 6.4% Average Price Per Square Foot $432 $425 -1.6% Average Days on Market 8 20 150.0% Highest Price $2,600,000 $2,700,000 3.8% Properties Sold 11 7 -36.4% % Sold Price to List Price 105.2% 98.4% -6.5% January through March 2022 2023 % Change Average Price $691,526 $687,236 -0.6% Average Price Per Square Foot $455 $415 -9.0% Average Days on Market 9 40 344.4% Highest Price $2,800,000 $2,000,000 -28.6% Properties Sold 300 258 -14.0% % Sold Price to List Price 106.6% 97.3% -8.8% Boundaries: W 38th Avenue to I-25; Speer Blvd to Zuni Street January through March 2022 2023 % Change Average Price $992,536 $1,011,218 1.9% Average Price Per Square Foot $602 $658 9.3% Average Days on Market 26 35 34.6% Highest Price $2,775,000 $1,825,000 -34.2% Properties Sold 28 24 -14.3% % Sold Price to List Price 105.2% 95.5% -9.2% LOWRY LOHI LAKEWOOD Boundaries: Quebec to Unita; Alameda to 11th
bars,
well-known as one of the most inclusive neighborhoods in all of Denver.
12.3%
The highest sale price in Observatory Park increased by 12.3% in the first quarter of 2023 compared to that of 2022.
MONTCLAIR OBSERVATORY PARK PARK HILL Boundaries: Colfax to 26th; Colorado to Quebec January through March 2022 2023 % Change Average Price $979,825 $1,098,959 12.2% Average Price Per Square Foot $677 $684 1.0% Average Days on Market 9 27 200.0% Highest Price $2,300,000 $2,171,000 -5.6% Properties Sold 45 27 -40.0% % Sold Price to List Price 108.8% 97.7% -10.1% January through March 2022 2023 % Change Average Price $1,053,096 $914,419 -13.2% Average Price Per Square Foot $608 $623 2.6% Average Days on Market 6 43 616.7% Highest Price $2,430,000 $2,000,000 -17.7% Properties Sold 23 14 -39.1% % Sold Price to List Price 102.6% 95.1% -7.3% Boundaries: University
Boundaries: Holly to Quebec; 6th to Colfax
to Colorado; Evans to Yale
January through March 2022 2023 % Change Average Price $2,238,045 $2,063,173 -7.8% Average Price Per Square Foot $686 $634 -7.6% Average Days on Market 22 55 150.0% Highest Price $3,500,000 $3,931,934 12.3% Properties Sold 13 12 -7.7% % Sold Price to List Price 103.1% 91.9% -10.9%
Polo Reserve is a luxury, gated community located in Littleton. The name “Polo Reserve” comes from the polo field and
49.0%
The highest home sale price in RiNo increased by 49.0% in the first quarter of 2023 compared to that of 2022.
Boundaries: Broadway to Downing; Louisiana to Evans January through March 2022 2023 % Change Average Price $544,500 $516,191 -5.2% Average Price Per Square Foot $518 $479 -7.3% Average Days on Market 33 18 -45.5% Highest Price $604,000 $900,000 49.0% Properties Sold 6 11 83.3% % Sold Price to List Price 100.2% 97.4% -2.8% January through March 2022 2023 % Change Average Price $1,081,835 $885,889 -18.1% Average Price Per Square Foot $724 $694 -4.2% Average Days on Market 12 47 291.7% Highest Price $2,450,000 $1,450,000 -40.8% Properties Sold 23 9 -60.9% % Sold Price to List Price 107.8% 92.3% -14.4% Boundaries: North of Mineral; South of Arabian Place; West of the S Platte River; East of S. Platte Canyon Road January through March 2022 2023 % Change Average Price - -Average Price Per Square Foot - -Average Days on Market - -Highest Price - -Properties Sold No Sales No Sales% Sold Price to List Price - -RINO POLO RESERVE PLATT PARK Boundaries: I-25 to York St; South of I-70; North of Park Ave; East of Lawrence St to 40th Avenue
equestrian
center within the community.
27.7%
The average price per square foot in Southern Hills increased by 27.7% in the first quarter of 2023 compared to that of 2022.
The charming and entertaining Streets of Southglenn are one of the best spots in the Denver Metro area. Located in Centennial, Southglenn brings an urban feel out to the suburbs.
SLOAN’S LAKE Boundaries: Colfax to 29th; Sheridan to Federal SOUTHERN HILLS SOUTHGLENN Boundaries: Colorado to University; Arapahoe to Dry Creek January through March 2022 2023 % Change Average Price $683,500 $641,500 -6.1% Average Price Per Square Foot $343 $404 17.6% Average Days on Market 12 87 625.0% Highest Price $850,000 $730,000 -14.1% Properties Sold 10 8 -20.0% % Sold Price to List Price 104.6% 91.1% -12.9% January through March 2022 2023 % Change Average Price $1,088,508 $1,127,913 3.6% Average Price Per Square Foot $672 $652 -3.1% Average Days on Market 8 23 187.5% Highest Price $2,100,000 $2,300,000 9.5% Properties Sold 18 23 27.8% % Sold Price to List Price 101.5% 98.2% -3.2% Boundaries: University to Colorado; Yale to Hampden January through March 2022 2023 % Change Average Price $1,393,750 $1,701,250 22.1% Average Price Per Square Foot $590 $753 27.7% Average Days on Market 3 30 900.0% Highest Price $2,525,000 $3,700,000 46.5% Properties Sold 4 8 100.0% % Sold Price to List Price 105.3% 96.5% -8.4%
77.8%
The average number of days on market in Southmoor Park increased by 77.8% in the first quarter of 2023 compared to that of 2022.
3.9%
The average price per square foot in Tallyn’s Reach decreased by 3.9% in the first quarter of 2023 compared to that of 2022.
January through March 2022 2023 % Change Average Price $843,625 $776,273 -8.0% Average Price Per Square Foot $301 $289 -3.9% Average Days on Market 16 35 118.8% Highest Price $1,300,000 $1,005,000 -22.7% Properties Sold 22 11 -50.0% % Sold Price to List Price 107.8% 96.9% -10.2% January through March 2022 2023 % Change Average Price $926,898 $790,750 -14.7% Average Price Per Square Foot $391 $358 -8.5% Average Days on Market 27 48 77.8% Highest Price $1,140,000 $990,000 -13.2% Properties Sold 8 8 0.0% % Sold Price to List Price 99.2% 94.1% -5.2% Boundaries: Federal Blvd to Inca St; W 38th Ave to I-70 January through March 2022 2023 % Change Average Price $767,838 $986,611 28.5% Average Price Per Square Foot $636 $624 -1.8% Average Days on Market 11 40 263.6% Highest Price $1,545,900 $2,007,975 29.9% Properties Sold 57 39 -31.6% % Sold Price to List Price 106.9% 97.7% -8.7% TALLYN’S REACH SUNNYSIDE SOUTHMOOR PARK Boundaries: North of E Dry Creek; South of Smoky Hill; West of S Powhaton; East of E-470
East of Downtown and just north of Capitol Hill rests
Denver’s Uptown—a vibrant urban area prized for its sports bars, black box theaters, and delightful mix of traditional and inventive culinary fare lining 17th Avenue, aptly named “Restaurant Row.”
42.5%
The highest home sale price in Washington Park East increased by 42.5% in the first quarter of 2023 compared to that of 2022.
Boundaries: North of Colfax, East of Broadway, South of 20th, 20th & Park to 19th; West of
UPTOWN
WASHINGTON PARK EAST WASHINGTON PARK WEST
January through March 2022 2023 % Change Average Price $1,133,054 $1,040,405 -8.2% Average Price Per Square Foot $721 $647 -10.3% Average Days on Market 9 20 122.2% Highest Price $2,635,000 $2,550,000 -3.2% Properties Sold 32 21 -34.4% % Sold Price to List Price 109.4% 97.2% -11.2% January through March 2022 2023 % Change Average Price $627,808 $515,253 -17.9% Average Price Per Square Foot $497 $426 -14.3% Average Days on Market 21 43 104.8% Highest Price $1,400,000 $780,000 -44.3% Properties Sold 44 16 -63.6% % Sold Price to List Price 104.2% 95.5% -8.3% Boundaries: Louisiana to Ellsworth, Downing to University January through March 2022 2023 % Change Average Price $2,009,286 $2,212,760 10.1% Average Price Per Square Foot $903 $812 -10.2% Average Days on Market 16 48 200.0% Highest Price $3,615,000 $5,150,000 42.5% Properties Sold 25 25 0.0% % Sold Price to List Price 104.7% 95.3% -9.0%
Josephine
Boundaries: Louisiana to Ellsworth; Broadway to Downing
7.7%
The price per square foot in the area of West Highlands increased by 7.7% in the first quarter of 2023 compared to that of 2022.
Boundaries: 38th Avenue; Federal to Sheridan January through March 2022 2023 % Change Average Price $992,943 $973,561 -2.0% Average Price Per Square Foot $695 $749 7.7% Average Days on Market 9 27 200.0% Highest Price $2,322,000 $1,860,000 -19.9% Properties Sold 46 22 -52.2% % Sold Price to List Price 108.1% 100.0% -7.5%
WEST HIGHLANDS
for new horizons 303.893.3200 | livsothebysrealty.com
The definition of paradise depends on your point of view. Find a home that makes each day more extraordinary than the last with LIV Sotheby’s International Realty.

MICRO MARKET REPORT | Denver Metro JANUARY - MARCH 2023 • COLORADOMICROREPORTS.COM
