Micro Market Report


QUARTER 3 2022
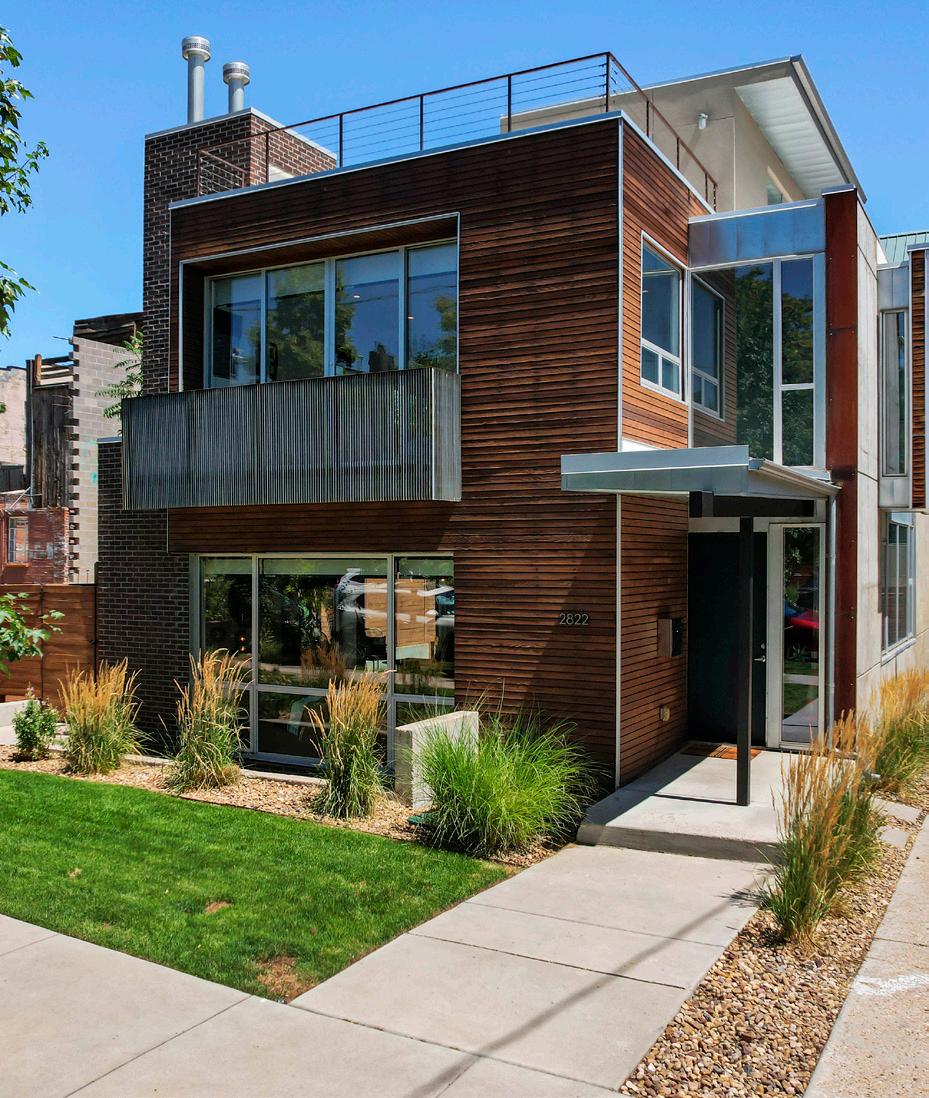
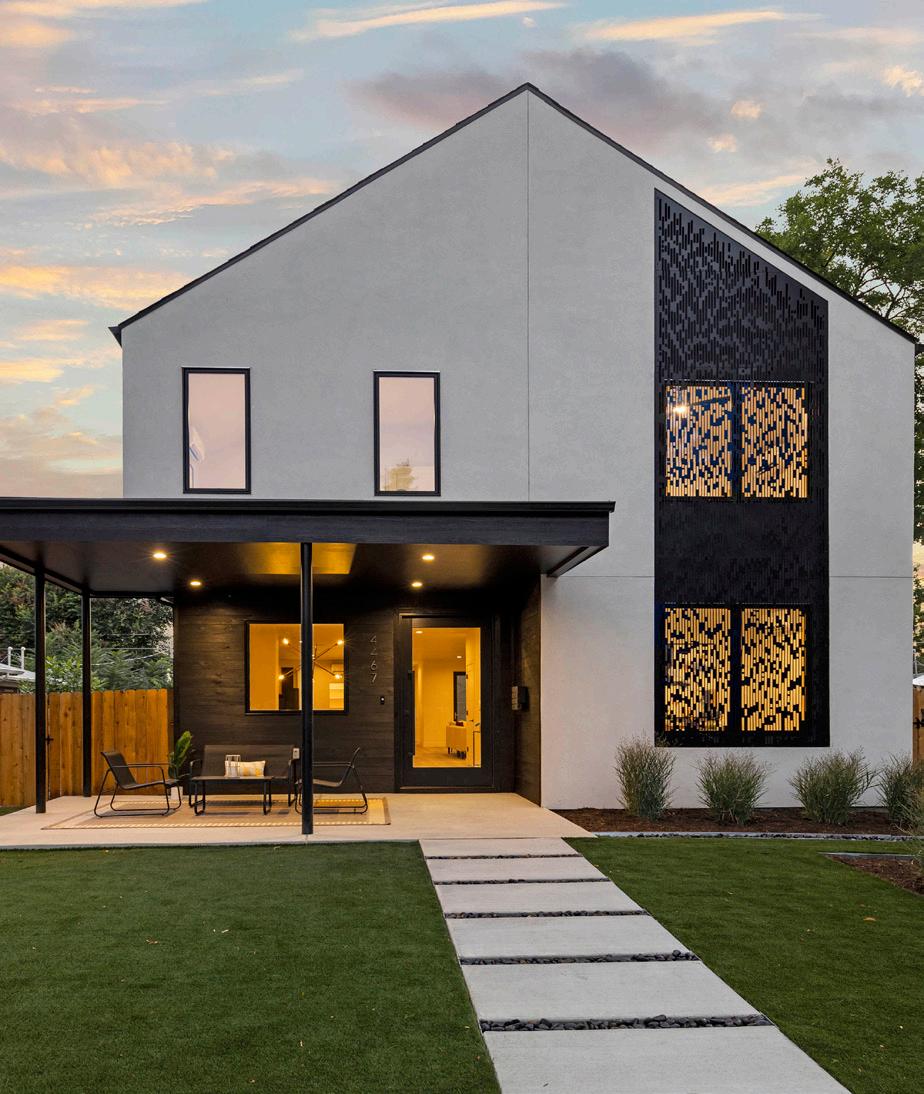
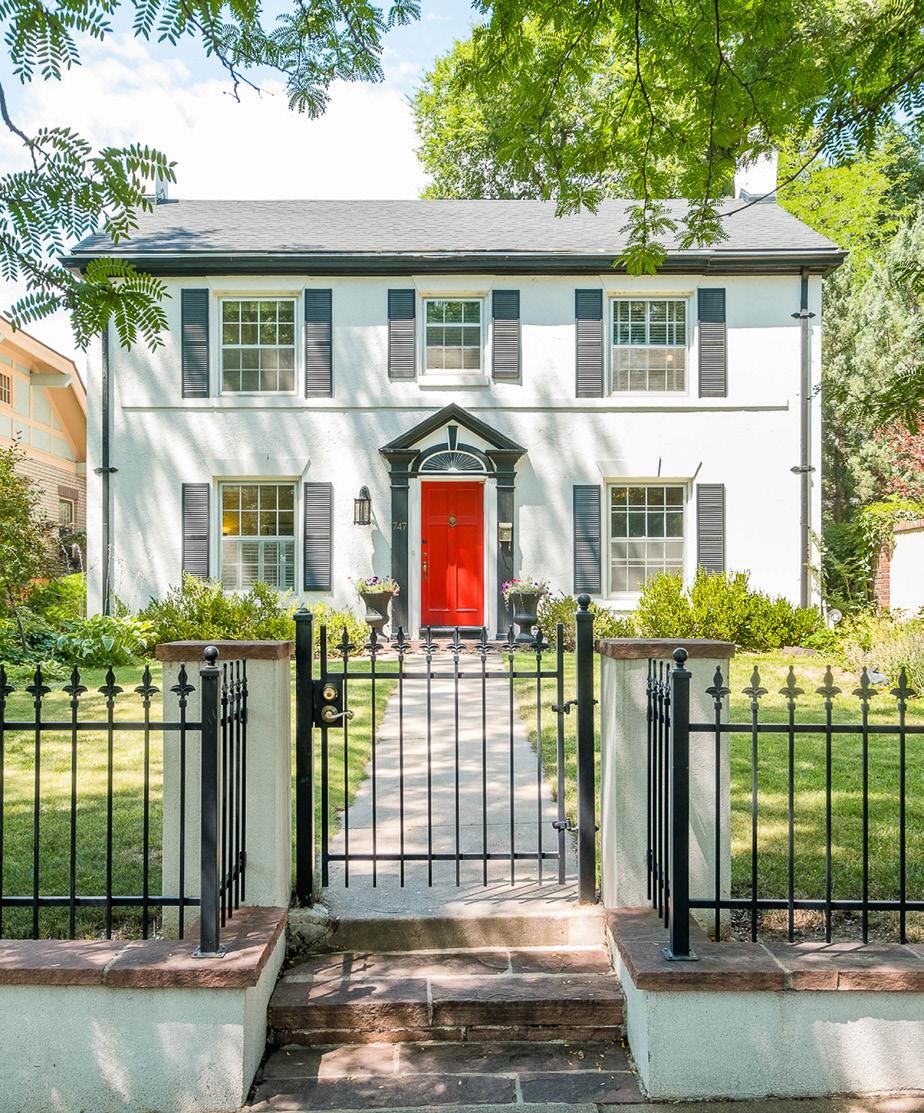
727 N Washington Street 4467 Winona Court DENVER METRO

This year, the real estate market is showing strong signs of normalizations that will bring back some balance to the previously vastly uneven playing field. As typical seasonal trends begin to reemerge, buyers will have increased opportunity to find the Denver Metro home of their dreams. Even with the sales volume decreasing slightly, Denver Metro’s market remains strong with exciting real estate activity. Denver Metro boasts some of the best entertainment options, business opportunities, and outdoor access in the country and for those reasons and many more, this city and its surrounding communities will continue to be a popular choice for homebuyers and sellers.
LIV Sotheby’s International Realty produced a Q3 Micro Market Report comparing real estate data through September of this year compared to the same frame in 2021, the number of homes sold across the six-county Denver Metro area decreased slightly in comparison to the exponential growth that the market was experiencing over the past two years. Through September of this year, there have been 40,125 homes sold – down 15% from the same time frame in 2021.
Despite the small decrease in property sales, home values in the area are still appreciating, incentivizing sellers to list their homes on the market and in turn creating additional inventory for buyers to choose from. Through the third quarter of the year, the average price for a single-family home in Denver Metro rose by 13.2% - bringing the average home price to $771,713. Looking at attached homes, the average price through Q3 was $478,643 – an 11.7% increase.
Several specific neighborhoods within Denver Metro also saw similar upward trends in the number of listings sold, appreciating home prices, and other key market metrics. For example, Bow Mar/Bow Mar South saw a 111.1% increase in the number of listings sold and appreciated by 7.1% to reach an average price of $2,313,553. The downtown condominium market saw the highest number of homes sold out of Denver’s diverse selection of neighborhoods. There were 453 units sold through September of this year.
Average prices have been on the rise in many neighborhoods across Denver Metro. In Wash Park East, home prices increased by 21%, reaching an average sale price of $2,069,946. Other areas neighborhoods such as Lakewood and Baker also saw home prices appreciate, growing by 15.1% and 12.1% respectively. Denver’s historic Capitol Hill neighborhood offered the most affordability during Q3, with properties selling for an average price of $454,764.
Sustained demand for Denver Metro homes paired with the challenges of limited inventory continues to accelerate the speed of the market. The city of Denver saw homes spending 54.1% less time on the market through September of this year compared to the same time frame in 2021 – averaging just 17 days on the market for local homes. Homebuyers looking to take their time finding the perfect home may prefer to shop in the Greenwood Village West neighborhood where homes on more than an acre of land are selling within an average of 53 days.
The Denver Metro home market is making its way back to its regularly observed seasonal buying and selling trends. As this year progresses and this high-demand market will continue to create opportunities for both buyers and sellers to create the life they love.

New Listings 53,132 50,204 -5.5%
Sold Listings (All Properties) 47,213 40,125 -15.0%
Sold Listings (Single Family) 32,362 27,581 -14.8%
Sold Listings (Attached) 14,851 12,544 -15.5%
Average Days on Market 14 13 -7.1%
Average Sold Price (Single Family) $681,872 $771,713 13.2%
Average Sold Price (Attached) $428,567 $478,643 11.7%
% Sold Price to Original List Price 102.4% 101.2% -1.2%
Total Dollar Volume Sold $28,431,366,961 $27,288,716,031 -4.0%
Counties: Adams, Arapahoe, Broomfield, Denver, Douglas, Jefferson
Baker, which was designated a historic district by the city of Denver in 2000, is lined with 19th-century brick houses and charming local restaurants and businesses.
The average number of days on market in Belmar decreased by 16.7% January through September 2022 compared to that of 2021.
2022 % Change
Average Price $638,395 $722,091 13.1%
Average Price Per Square Foot $424 $499 17.8%
Average Days on Market 37 17 -54.1%
Highest Price $9,000,000 $9,000,000 0.0%
Properties Sold 12,869 10,696 -16.9%
% Sold Price to List Price 100.7% 104.4% 3.7%
Boundaries: City of Denver
January through September
2022 % Change
Average Price $599,461 $672,169 12.1%
Average Price Per Square Foot $466 $537 15.3%
Average Days on Market 17 13 -23.5%
Highest Price $1,185,000 $1,260,000 6.3%
Properties Sold 111 91 -18.0%
% Sold Price to List Price 103.8% 103.4% -0.4%
Boundaries: 6th Avenue to Mississippi; South Platte River to Broadway
Average Price $449,482 $518,670 15.4%
Average Price Per Square Foot $338 $386 14.3%
Average Days on Market 24 20 -16.7%
Highest Price $683,000 $1,195,000 75.0%
Properties Sold 35 31 -11.4%
% Sold Price to List Price 100.5% 101.6% 1.1%
Boundaries: Kentucky to Alameda; Wadsworth to Pierce
Average Price
Average Price Per
Average
Highest Price
%
through
Average Price $1,649,027
Average Price Per Square Foot
Average Days on Market
19.4%
-31.3%
Highest Price $5,000,000 $7,000,000 40.0%
Sold
% Sold Price to
Price
Average Price
Average Price Per
Average Days
Highest Price
%
-22.6%
103.8% 0.2%
Designed to resemble a Scottish village, Bonnie Brae/Belcaro features winding tree-lined streets, a circular central park, and a collection of small shops.
The number of properties sold in Bow Mar/Bow Mar South increased by 111.1% January through September 2022 compared to that of 2021.
The highest sale price in Central Park increased by 36.7% January through September 2022 compared to that of 2021.
2022 % Change
Average Price $404,034 $454,764 12.6%
Average Price Per Square Foot $402 $450 12.0%
Average Days on Market 27 14 -48.1%
Highest Price $2,295,000 $4,600,000 100.4%
Properties Sold
298 -27.5%
% Sold Price to List Price 99.2% 102.1% 2.9%
Boundaries: Broadway to Downing; 6th Avenue to Colfax
January through September
% Change
Average Price $892,056 $1,054,192 18.2%
Average Price Per Square Foot $384 $455 18.5%
Average Days on Market 8 10 25.0%
Highest Price $1,975,000 $2,700,000 36.7%
Properties Sold 328 304 -7.3%
% Sold Price to List Price 103.5% 103.6% 0.0%
Boundaries: Quebec to Havana; Montview to 64th
2022 % Change
Average Price $636,608 $557,274 -12.5%
Average Price Per Square Foot $440 $483 9.8%
Average Days on Market 41 15 -63.4%
Highest Price $4,900,000 $3,250,000 -33.7%
Properties Sold 181 131 -27.6%
% Sold Price to List Price 99.2% 101.4% 2.2%
Boundaries: York to Downing; Colfax to 8th Avenue
Average Price
Average Price
Average
Highest Price
%
Boundaries:
Average Price
Average Price Per Square
Average Days
Highest Price
%
Price to
Boundaries:
Cherry Creek East/South is an affluent residential district with a vibrant shopping scene. Overlooking the creek itself, Cherry Creek Mall has department stores, highend fashion boutiques, and eclectic eateries.
Average Price
Average Price Per
Average
Highest Price
%
Price
One
The average number of days on market in Cherry Hills Village (under one acre) decreased by 60.0% January through September 2022 compared to that of 2021.
The average number of days on market in City Park decreased by 36.4% January through September 2022 compared to that of 2021.
% Change
Average Price $4,016,793 $4,555,000 13.4%
Average Price Per Square Foot $684 $834 22.0%
Average Days on Market
31 -50.8%
Highest Price $7,850,000 $13,000,000 65.6%
Properties Sold
20 -42.9%
% Sold Price to List Price 101.1% 100.4% -0.8%
(Over One Acre)
Hampden to Belleview; Clarkson to Happy Canyon Road
Charlou
% Change
Average Price $813,501 $822,358 1.1%
Average Price Per Square Foot $500 $555 11.0%
Average Days on Market 22 14 -36.4%
Highest Price $1,850,000 $1,565,100 -15.4%
Properties Sold 87 81 -6.9%
% Sold Price to List Price 102.5% 102.6% 0.1%
Boundaries: Downing to York; 18th to Martin Luther King
% Change
Average Price $809,236 $1,208,694 49.4%
Average Price Per Square Foot $535 $589 10.1%
Average Days on Market 16 3 -81.3%
Highest Price $1,275,000 $1,720,000 34.9%
Properties Sold 15 9 -40.0%
% Sold Price to List Price 101.1% 109.5% 8.3%
Boundaries: York to Colorado; Colfax to 17th
Average Price
Average Price
Average
Highest Price
%
Price
Boundaries:
Average Price
Average Price Per Square
Average Days
Highest Price
%
Price
Average Price
Average Price
Average
Highest
%
The average number of days on market in Columbine Valley decreased by 61.9% January through September 2022 compared to that of 2021.
Named after John J. Cory and Louise A. Merrill, two influential Denver educators, Cory-Merrill is a popular area for residents looking for a laid-back, family-friendly neighborhood.
The average price per square foot in Country Club increased by 10.1% January through September 2022 compared to that of 2021.
The average price per square foot in Crestmoor Park increased by 23.9% January through September 2022 compared to that of 2021.
2022 % Change
Average Price $3,268,665 $2,542,180 -22.2%
Average Price Per Square Foot $751 $827 10.1%
Average Days on Market 71 13 -81.7%
Highest Price $6,075,000 $3,900,000 -35.8%
Properties Sold 22 11 -50.0%
% Sold Price to List Price 97.7% 95.6% -2.1%
Boundaries: University to Downing 1st - 4th; Race to University 4th - 6th
January through September
2022 % Change
Average Price $1,731,091 $2,051,281 18.5%
Average Price Per Square Foot $576 $714 23.9%
Average Days on Market 8 5 -37.5%
Highest Price $3,500,000 $4,250,000 21.4%
Properties Sold 22 16 -27.3%
% Sold Price to List Price 104.2% 107.7% 3.3%
Boundaries: Holly to Monaco; Bayaud to 6th Avenue
2022 % Change
Average Price $770,592 $751,418 -2.5%
Average Price Per Square Foot $589 $585 -0.8%
Average Days on Market 48 40 -16.7%
Highest Price $5,147,600 $4,100,000 -20.4%
Properties Sold 590 453 -23.2%
% Sold Price to List Price 98.3% 99.1% 0.8%
Downtown Denver MLS Area
Average
Average Price
Average
Highest
Average Price
Average Price Per Square
Average Days on
Highest Price
%
Price
Average Price
Average Price
Average
Highest
Greenwood Village East contains nationally recognized business parks, like the Denver Tech Center, a variety of delicious restaurants, and the popular Fiddler’s Green Amphitheater.
The highest priced home in Greenwood Village West (under one acre) increased by 49.4% January through September 2022 compared to that of 2021.
The average price per square foot in Greenwood Village West (over one acre) increased by 20.3% January through September 2022 compared to that of 2021.
January through September 2021 2022 % Change
Average Price $3,410,247 $3,681,708 8.0%
Average Price Per Square Foot $601 $724 20.3%
Average Days on Market 35 53 51.4%
Highest Price $7,428,000 $5,998,000 -19.3%
Properties Sold 15 12 -20.0%
% Sold Price to List Price 96.5% 95.3% -1.2%
(Over One Acre)
Boundaries: Orchard to Belleview; Clarkson to I-25
Hale Mayfair is a mature neighborhood located in East Denver with close proximity to both Rose Hospital and National Jewish Hospital. Here you will find a variety of large Victorian homes surrounded by many restaurants and cafes.
The average home price per square foot in Heritage Greens increased by 21.7% January through September 2022 compared to that of 2021.
2021 2022 % Change
Average Price $811,954 $924,724 13.9%
Average Price Per Square Foot $610 $676 10.8%
Average Days on Market 6 9 50.0%
Highest Price $1,620,000 $2,100,000 29.6%
Properties Sold 89 73 -18.0%
% Sold Price to List Price 104.2% 104.5% 0.3%
Boundaries: Colorado to Holly; 6th to Colfax
2021 2022 % Change
Average Price $1,128,477 $1,333,223 18.1%
Average Price Per Square Foot $362 $441 21.7%
Average Days on Market 5 8 60.0%
Highest Price $1,975,000 $1,333,223 -32.5%
Properties Sold 22 24 9.1%
% Sold Price to List Price 103.1% 106.0% 2.8%
Boundaries: Dry Creek to County Line; Colorado Blvd to Holly
Average
Average
Highest
Average Price
Average Price
Average
Highest Price
%
Average
Average
Average
Highest
The average number of days on market in Highlands decreased by 48.0% January through September 2022 compared to that of 2021.
The average home price in
increased by 19.8%
January through September 2022 compared to that of
Boundaries:
With both new residential and commercial developments, Jefferson Park offers a mix of both young professionals and families.
The average home price in Ken Caryl Valley increased by 26.2% January through September 2022 compared to that of 2021.
January through September 2021 2022 % Change
Average Price $605,313 $795,596 31.4%
Average Price Per Square Foot $474 $557 17.6%
Average Days on Market 32 15 -53.1%
Highest Price $1,345,000 $1,705,000 26.8%
Properties Sold 130 84 -35.4%
% Sold Price to List Price 100.8% 103.1% 2.3%
Boundaries: Federal Blvd to S Platte River; South of 29th Ave & Speer Blvd, North of Mile High Stadium
January through September
2021 2022 % Change
Average Price $1,567,647 $1,772,250 13.1%
Average Price Per Square Foot $408 $447 9.4%
Average Days on Market 8 3 -62.5%
Highest Price $1,920,000 $2,127,500 10.8%
Properties Sold 17 6 -64.7%
% Sold Price to List Price 102.2% 107.0% 4.8%
Boundaries: Red Fox Lane to North Ranch Road; Golden Eagle Road to Blue Grouse Ridge Road
2021 2022 % Change
Average Price $977,858 $1,234,308 26.2%
Average Price Per Square Foot $366 $461 26.2%
Average Days on Market 5 6 20.0%
Highest Price $1,725,000 $2,070,000 20.0%
Properties Sold 49 39 -20.4%
% Sold Price to List Price 101.0% 106.6% 5.5%
Boundaries: Tamarade Drive to Manor House Road; Mountain High Court to West Ken Carly Ave
Average
Average
Highest
Average Price
Average Price Per
Average Days
Highest Price
%
Price
Average Price
Average
Average
Highest
Boundaries:
The Lower Highlands, LoHi for short, is an area admired for its hip restaurants, renovated bungalows, and an ice cream shop in a giant milk can. A hot spot for entertainment, retail shops, and bars, it is well-known as one of the most inclusive neighborhoods in all of Denver.
The average home price in Lowry increased by 27.7% January through September 2022 compared to that of 2021.
The average number of days on market in Observatory Park decreased by 32.3% January through September 2022 compared to that of 2021.
% Change
Average Price $851,359 $1,030,942 21.1%
Average Price Per Square Foot $545 $623 14.2%
Average Days on Market
13 0.0%
Highest Price $1,895,000 $2,430,000 28.2%
Properties Sold
-23.4%
% Sold Price to List Price 101.7% 101.9% 0.2%
Boundaries: Holly to Quebec;
to Colfax
% Change
Average Price $1,886,457 $2,274,114 20.5%
Average Price Per Square Foot $580 $706 21.7%
Average Days on Market 31 21 -32.3%
Highest Price $3,870,000 $5,396,000 39.4%
Properties Sold 76 45 -40.8%
% Sold Price to List Price 99.6% 101.7% 2.0%
Boundaries: University to Colorado; Evans to Yale
Average Price $941,710 $1,065,339 13.1%
Average Price Per Square Foot $600 $699 16.6%
Average Days on Market
12 9.1%
Highest Price $4,000,000 $3,812,500 -4.7%
Properties Sold
176 -1.1%
% Sold Price to List Price 104.7% 105.2% 0.5%
Boundaries: Colfax to 26th; Colorado to Quebec
Average
Average
Highest
Average Price
Average Price Per
Average Days
Highest Price
%
Price
Average
Average
Average
Polo Reserve is a luxury, gated community located in Littleton. The name “Polo Reserve” comes from the polo field and equestrian center within the community.
The average home price in RiNo increased by 36.7% January through September 2022 compared to that of 2021.
Boundaries:
The average price per square foot in Southern Hills increased by 10.5% January through September 2022 compared to that of 2021.
2022 % Change
Average Price $958,663 $1,072,492 11.9%
Average Price Per Square Foot $609 $692 13.6%
Average Days on Market 18 13 -27.8%
Highest Price $2,500,000 $2,500,000 0.0%
Properties Sold 115 104 -9.6%
% Sold Price to List Price 102.7% 101.4% -1.3%
Boundaries: Colfax to 29th; Sheridan to Federal
January through September
2022 % Change
Average Price $1,168,637 $1,257,468 7.6%
Average Price Per Square Foot $569 $629 10.5%
Average Days on Market 8 9 12.5%
Highest Price $2,800,000 $2,525,000 -9.8%
Properties Sold 52 49 -5.8%
% Sold Price to List Price 102.9% 102.0% -0.9%
Boundaries: University to Colorado; Yale to Hampden
The charming and entertaining Streets of Southglenn are one of the best spots in the Denver Metro area. Located in Centennial, Southglenn brings an urban feel out to the suburbs.
2022 % Change
Average Price $621,836 $685,390 10.2%
Average Price Per Square Foot $330 $344 4.3%
Average Days on Market 7 9 28.6%
Highest Price $800,000 $900,000 12.5%
Properties Sold 45 42 -6.7%
% Sold Price to List Price 104.6% 102.4% -2.1%
Boundaries: Colorado to University; Arapahoe to Dry Creek
Average
Highest
Average Price
Average Price
Highest Price
%
Price
Average Price
Average
Average
Highest
The average price per square foot in Southmoor Park increased by 31.2% January through September 2022 compared to that of 2021.
The average home price in Tallyn’s
increased by 18.6% January through September 2022 compared to that of 2021.
East of Downtown and just north of Capitol Hill rests Denver’s Uptown — a vibrant urban area prized for its sports bars, black box theaters, and delightful mix of traditional and inventive culinary fare lining 17th Avenue, aptly named “Restaurant Row.”
The average price per square foot in Washington Park East increased by 22.0% January through September 2022 compared to that of 2021.
January through September 2021 2022 % Change
Average Price $545,472 $609,167 11.7%
Average Price Per Square Foot $430 $499 16.1%
Average Days on Market 29 15 -48.3%
Highest Price $3,100,000 $1,570,000 -49.4%
Properties Sold 181 157 -13.3%
% Sold Price to List Price 99.2% 102.0% 2.9%
Boundaries: North of Colfax, East of Broadway, South of 20th, 20th & Park to 19th; West of Josephine
January through September 2021 2022 % Change
Average Price $1,711,204 $2,069,946 21.0%
Average Price Per Square Foot $742 $905 22.0%
Average Days on Market 22 19 -13.6%
Highest Price $4,375,000 $5,450,000 24.6%
Properties Sold 128 98 -23.4%
% Sold Price to List Price 101.8% 102.7% 0.9%
Boundaries: Louisiana to Ellsworth, Downing to University
2021 2022 % Change
Average Price $913,944 $1,081,879 18.4%
Average Price Per Square Foot $592 $682 15.2%
Average Days on Market 12 12 0.0%
Highest Price $2,505,000 $3,250,000 29.7%
Properties Sold 168 134 -20.2%
% Sold Price to List Price 103.7% 103.1% -0.5%
Boundaries: Louisiana to Ellsworth; Broadway to Downing
January
Average
Average Price
Average
Highest Price
The average home price in the area of West Highlands increased by 20.6% January through September 2022 compared to that of 2021.
The definition of paradise depends on your point of view. Find a home that makes each day more extraordinary than the last with LIV Sotheby’s International Realty.

JANUARY SEPTEMBER 2022 • COLORADOMICROREPORTS.COM