
YEAR-END 2022
6 Sunrise Drive 528 N Steele Street
Micro Market Report
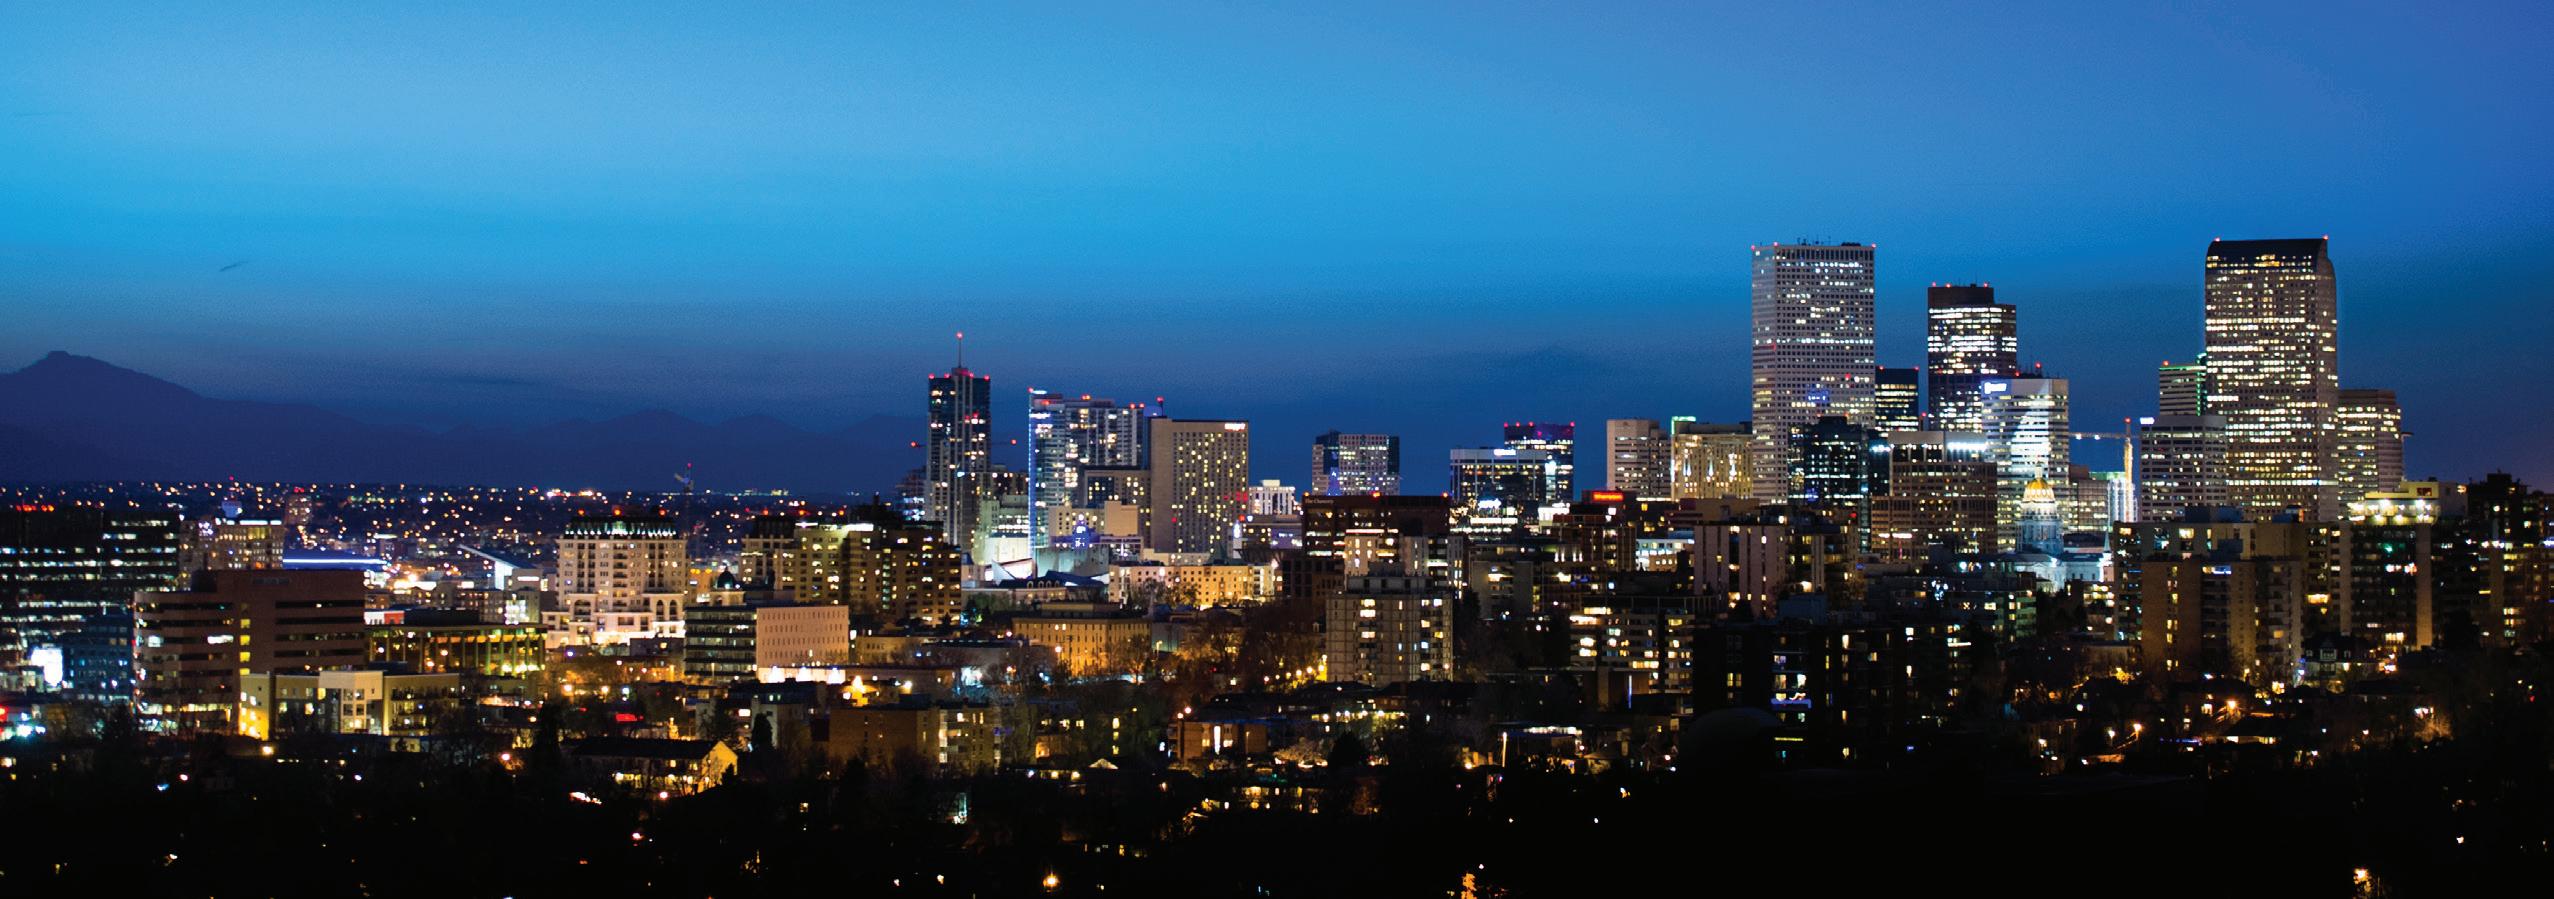
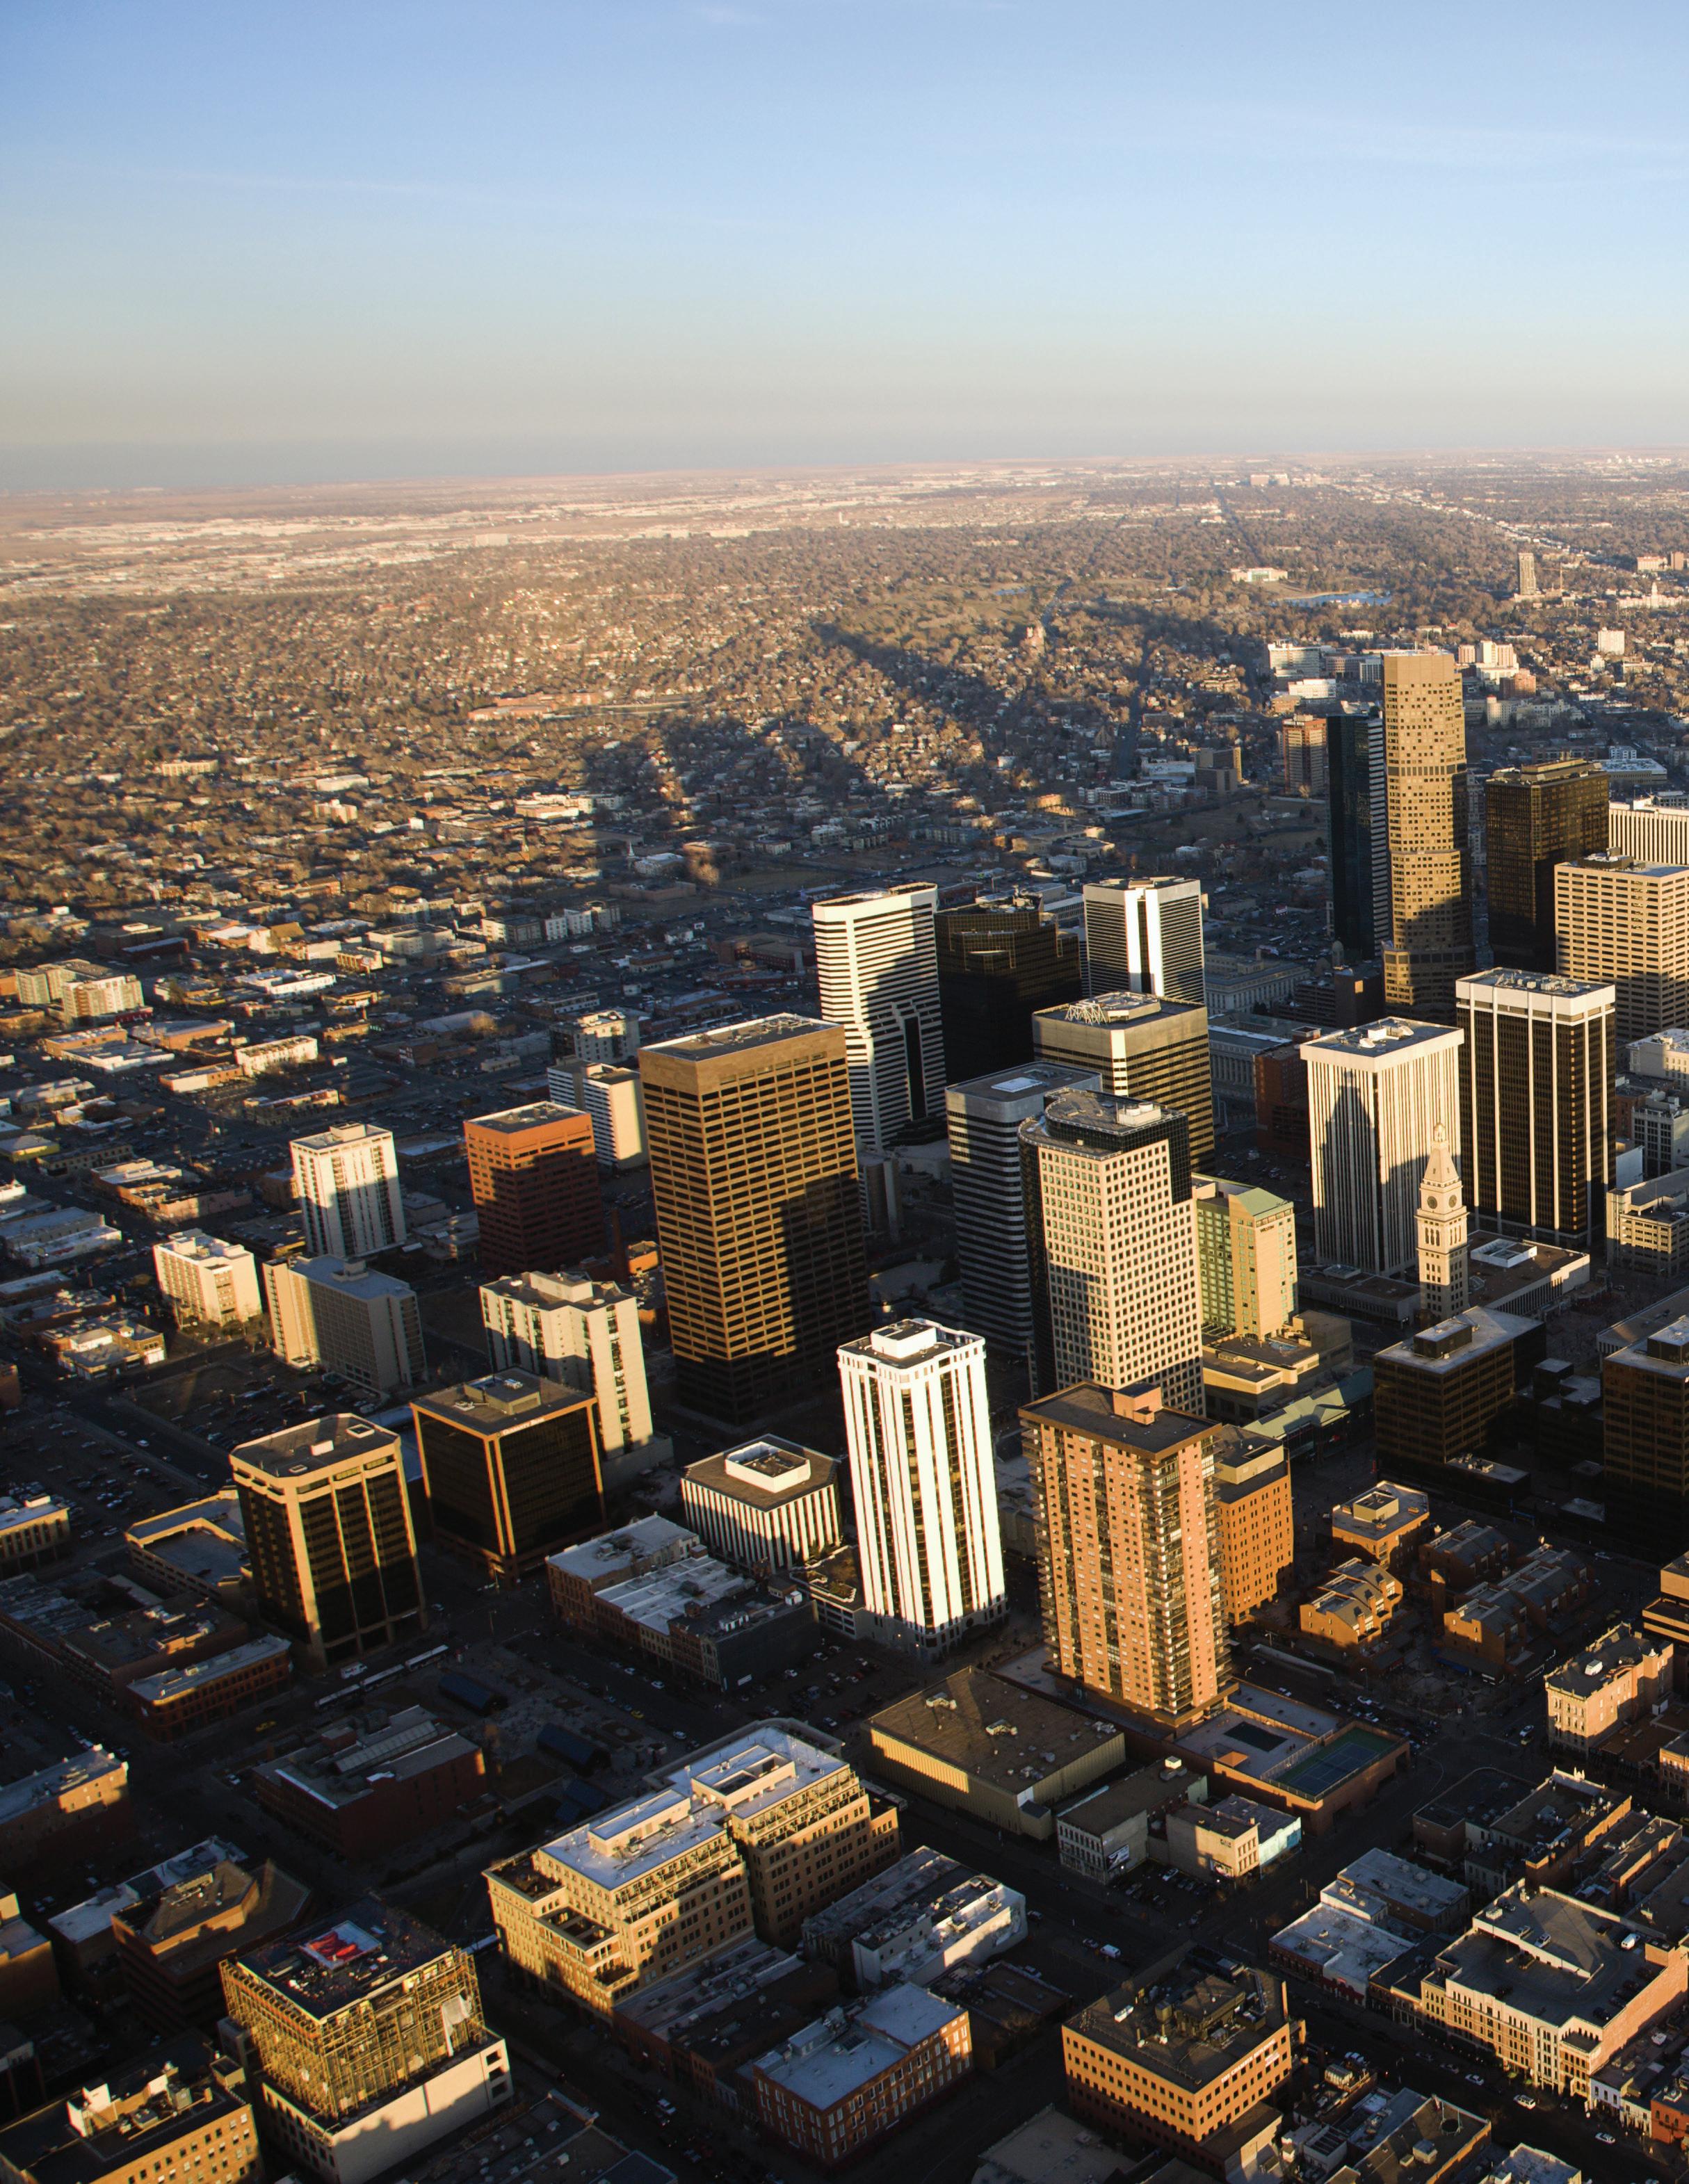
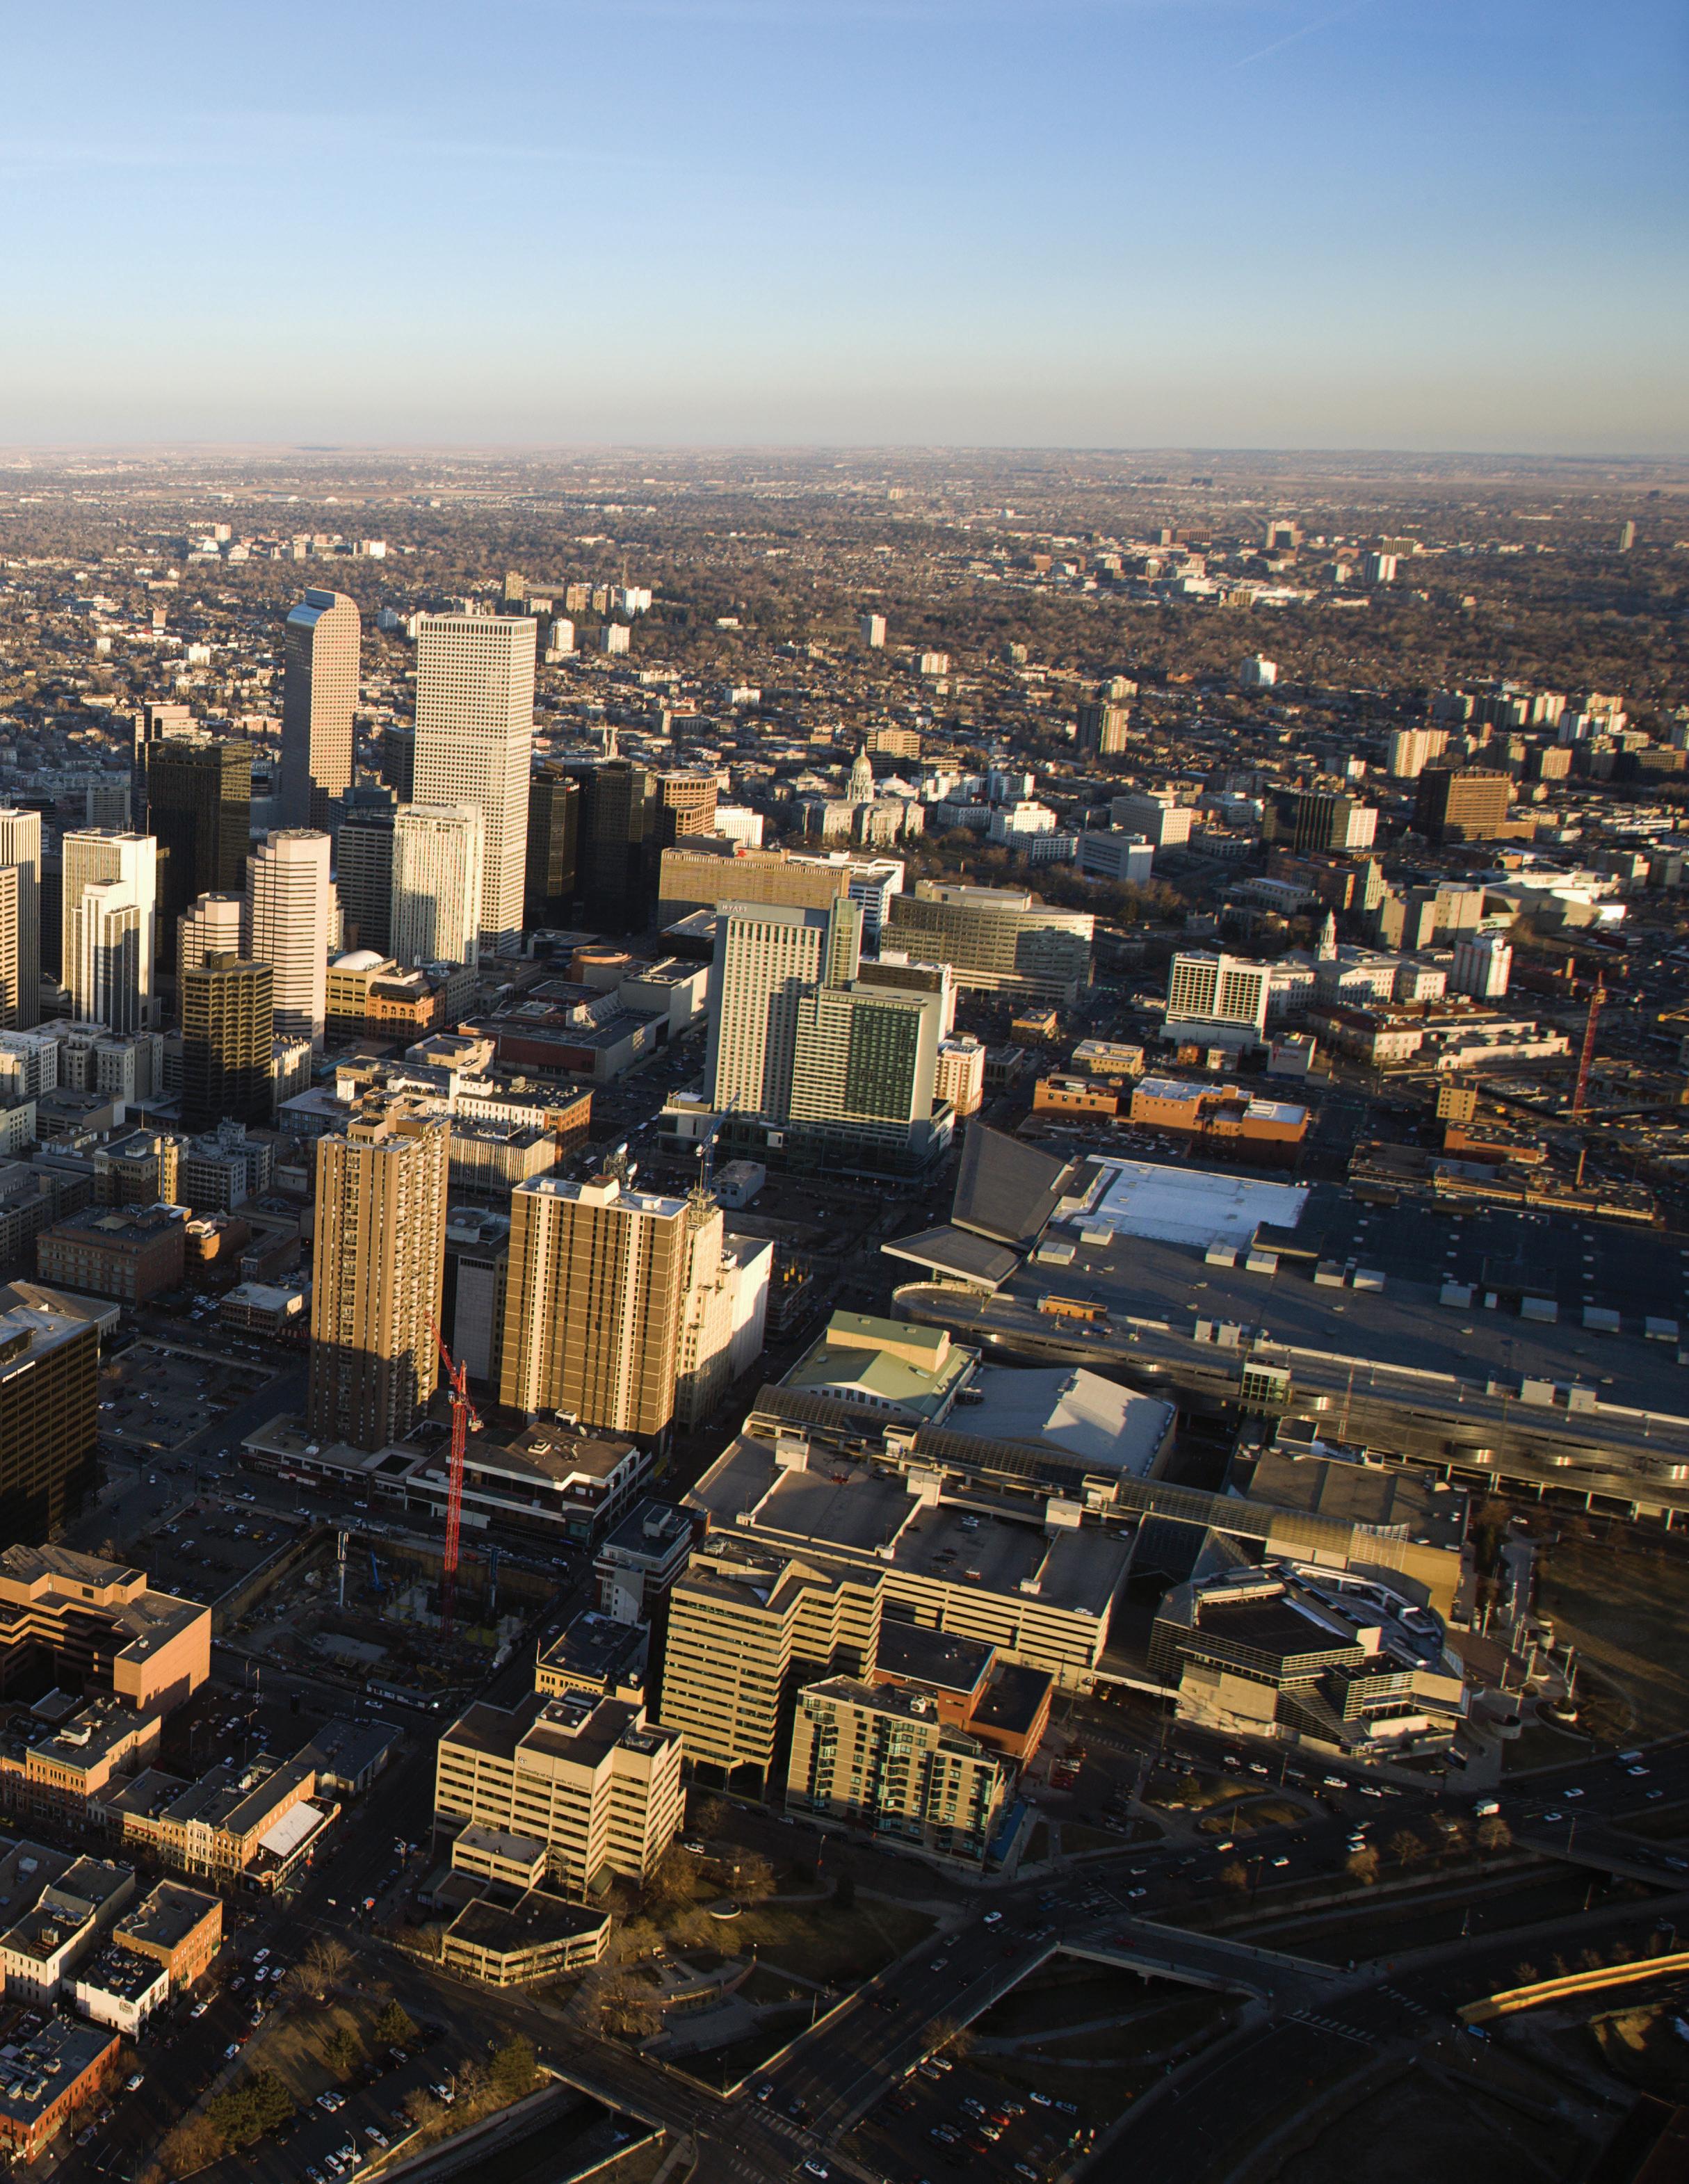
DENVER METRO
2022 is now over and what a year it was. During the last half of 2022, the real estate market showed strong signs of normalizing after the 2021 COVID-driven boom. The first half of the year saw incredibly high buyer demand, and it felt similar to the 2021 market. The market started to shift when mortgage interest rates started to rise. This was intended to tamp down buyer demand, but even with limited inventory in Denver Metro—which saw a decrease of 9.7% for new listings in 2022 compared to 2021—the region still managed to have historically high appreciation, averaging 11.8% for the average price of detached homes.
The media and many “experts” anticipated that home prices would fall in, but that hasn’t been the case in highly sought out areas, including Denver Metro. To further understand the Denver market, one must look at Denver’s micro markets because there are many nuances within
a small geographic region. In 2022, Central Park saw a 15.1% average price increase as compared to 2021, and the Cheesman Park neighborhood saw a 16.1% decrease for the same time period.
We recognize each neighborhood is unique and no two regions respond to market shifts the same way. To present an accurate picture of each of these communities that make up Denver Metro, LIV Sotheby’s International Realty is proud to present our year-end Micro Market Report, representing the metrics of many key and beloved neighborhoods.
The Denver Metro home market is making its way back to its regularly observed seasonal buying and selling trends. This high-demand market will continue to create opportunities for both buyers and sellers to create the life they love.
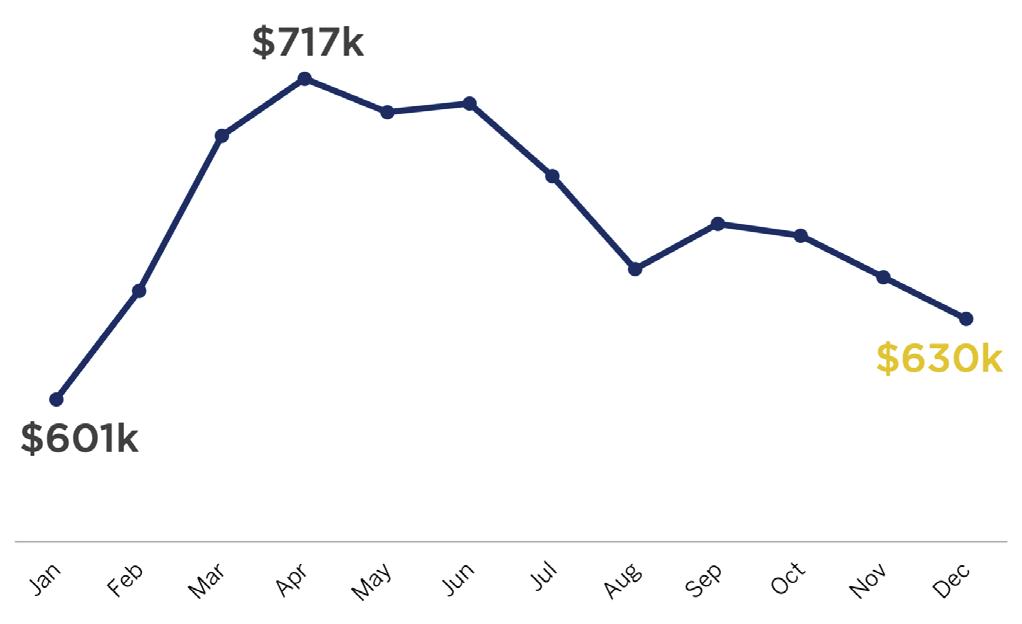
Average Sales Price (All Properties)
Counties: Adams, Arapahoe, Broomfield, Denver, Douglas, Jefferson
coloradomicroreports.com Based on Information from REColorado for the period January 1st, 2022 -December 31th, 2022. This representation is based in whole or in part on data supplied by REColorado. REColorado does not guarantee nor is in any way responsible for its accuracy. Data maintained by REColorado may not reflect all real estate activity in the market. January through December 2021 2022 % Change New Listings 64,522 58,265 -9.7% Sold Listings (All Properties) 61,515 49,444 -19.6% Sold Listings (Single Family) 42,294 34,068 -19.4% Sold Listings (Attached) 19,221 15,376 -20.0% Average Days on Market 14 17 21.4% Average Sold Price (Single Family) $682,489 $763,321 11.8% Average Sold Price (Attached) $428,825 $476,912 11.2% % Sold Price to Original List Price 101.9% 100.0% -1.9% Total Dollar Volume Sold $37,107,652,222 $33,337,816,880 -10.2%
MARKET UPDATE Denver Metro
MICRO MARKET REPORT | Denver Metro JANUARY - DECEMBER 2022 • COLORADOMICROREPORTS.COM livsothebysrealty.com
Baker
Belmar
Berkeley
Bonnie Brae / Belcaro
Bow Mar / Bow Mar South
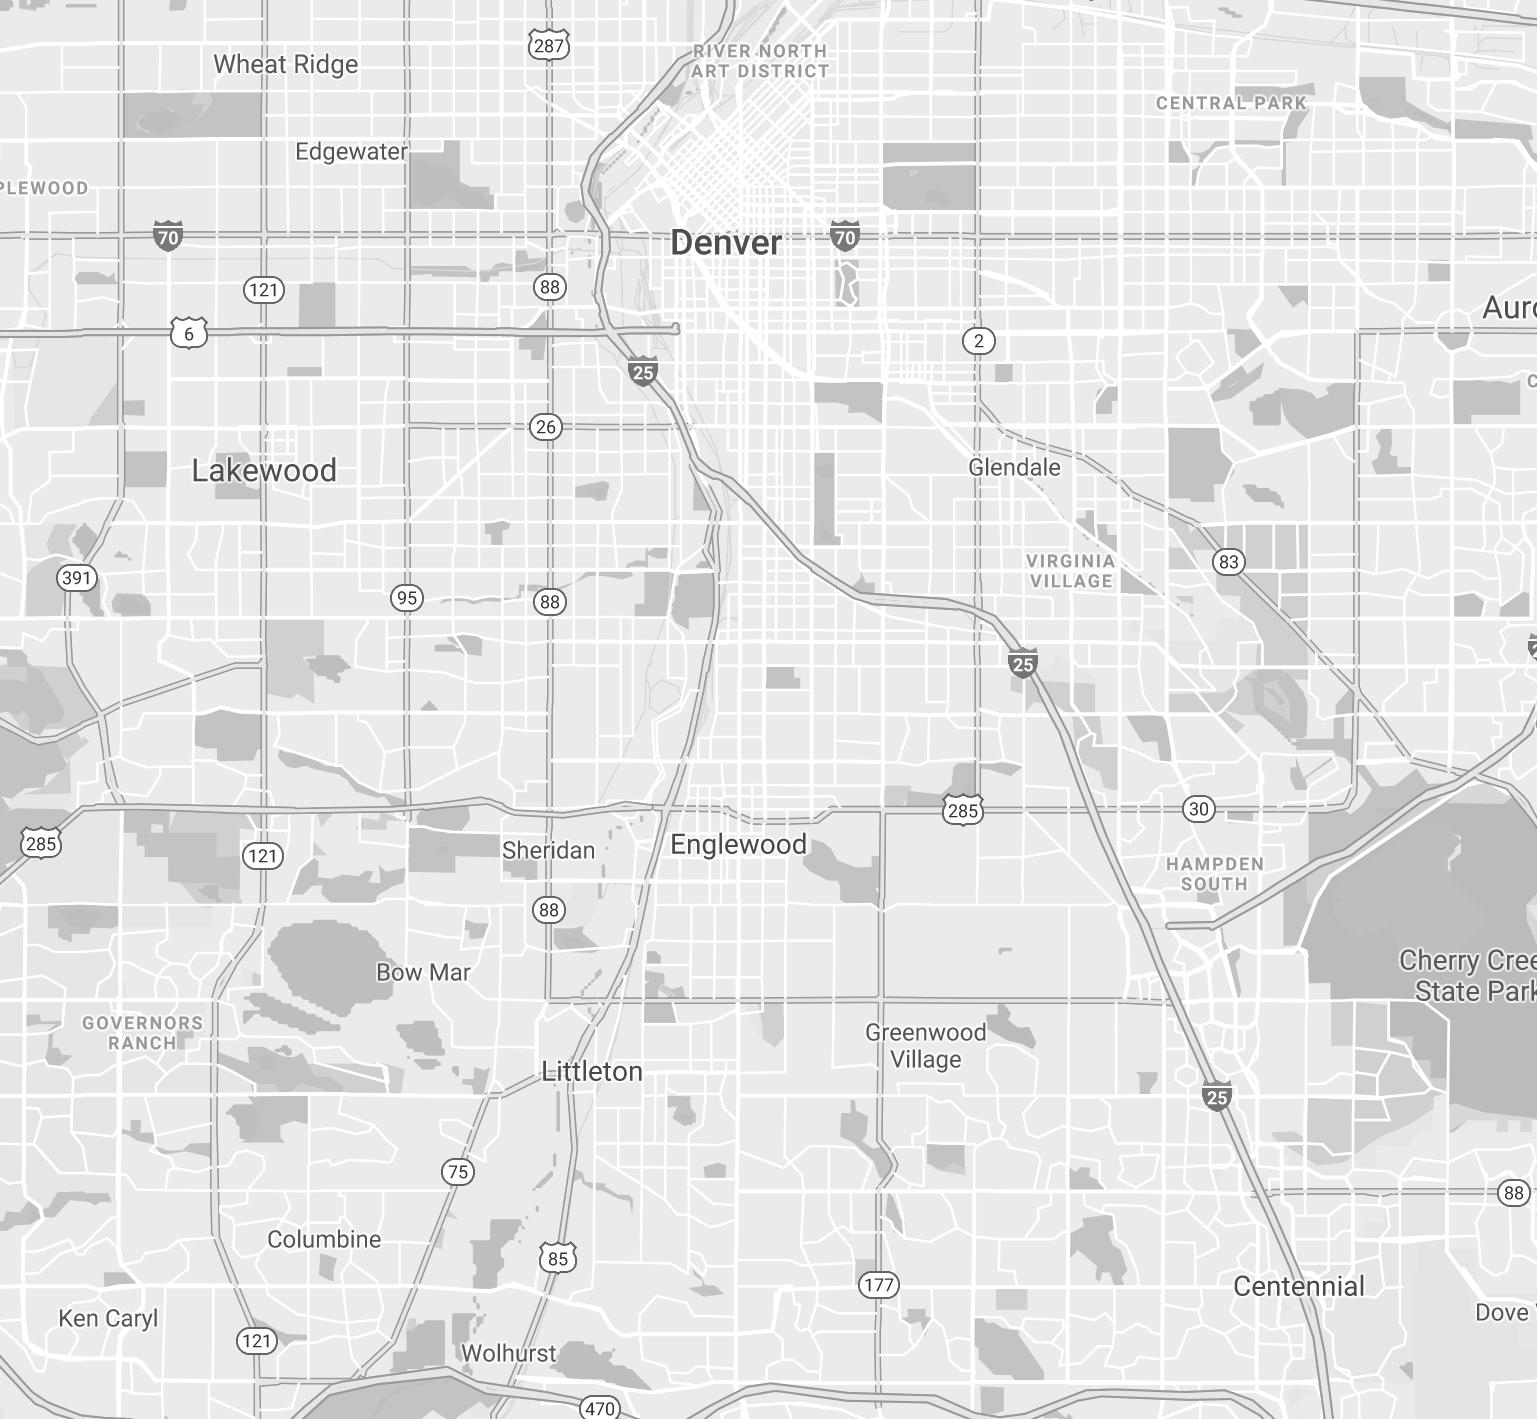
Capitol Hill 7. Central Park 8. Cheesman Park 9. Cherry Creek East / South 10. Cherry Creek North 11. Cherry Hills Village 12. City Park 13. City Park South 14. Columbine Valley 15. Congress Park 16. Cory-Merrill 17. Country Club 18. Crestmoor Park 19. Denver (City) 20. Downtown Denver 21. Golden Triangle 22. Greenwood Village East 23. Greenwood Village West 24. Hale Mayfair 25. Heritage Greens 26. Highlands 27. Hilltop 28. Homestead 29. Jefferson Park 30. Ken Caryl North Ranch 31. Ken Caryl Valley 32. Lakewood 33. LoHi 34. Lowry 35. Montclair 36. Observatory Park 37. Park Hill 38. Platt Park 39. Polo Reserve 40. RiNo 41. Saddle Rock Golf Club 42. Sloan’s Lake 43. Southern Hills 44. Southglenn 45. Southmoor Park 46. Sunnyside 47. Tallyn’s Reach 48. Uptown 49. Washington Park East 50. Washington Park West 19 1 3 5 46 8 15 14 37 12 9 35 21 17 13 43 11 27 32 33 41 38 30 22 20 4 2 36 34 23 7 44 18 26 16 29 24 31 28 25 40 39 42 47 48 49 50 10 6 45 51
DENVER METRO NEIGHBORHOODS 1.
2.
3.
4.
5.
6.
City of Denver
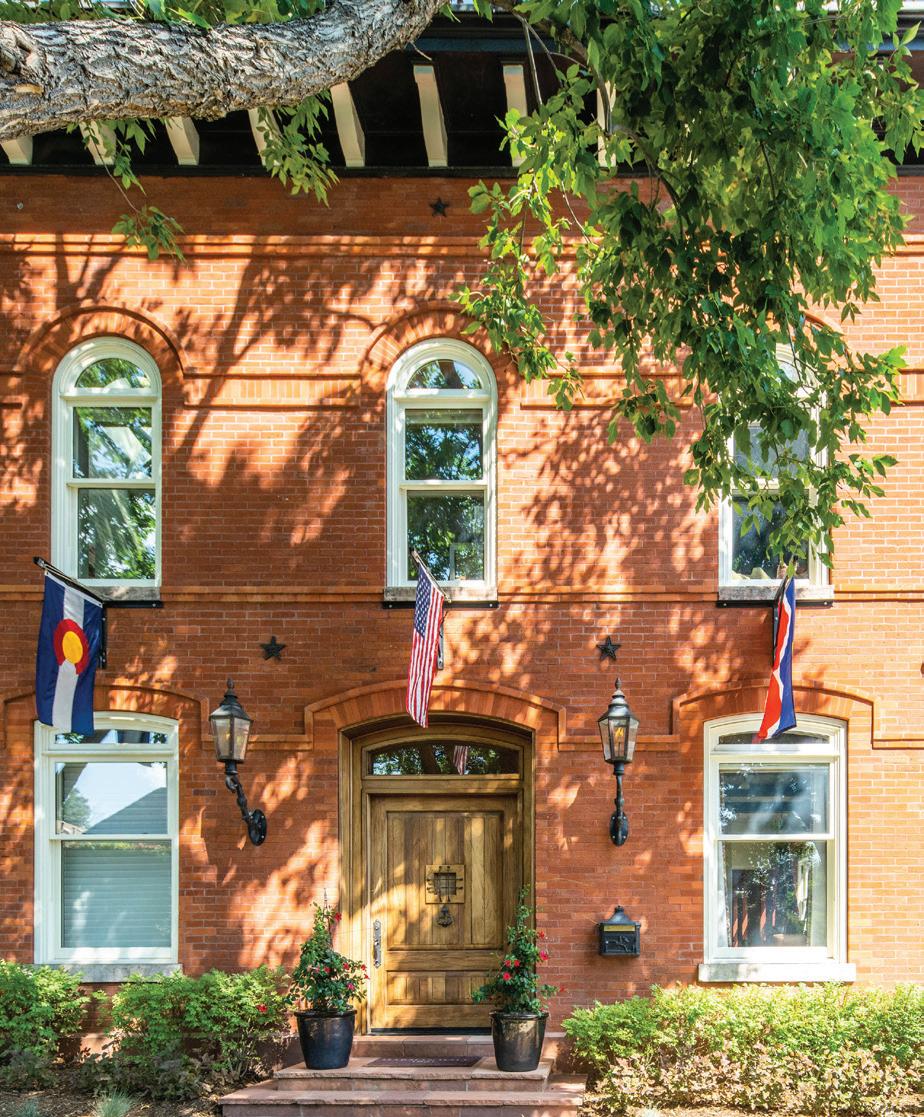
Baker, which was designated a historic district by the city of Denver in 2000, is lined with 19th-century brick houses and charming local restaurants and businesses.
75.0%
The highest home sale price in Belmar increased by 75.0% in 2022 compared to that of 2021.
Boundaries: 6th Avenue to Mississippi; South Platte River to Broadway
DENVER (CITY) BAKER BELMAR
Pierce January through December 2021 2022 % Change Average Price $466,092 $527,480 13.2% Average Price Per Square Foot $334 $379 13.5% Average Days on Market 26 23 -11.5% Highest Price $683,000 $1,195,000 75.0% Properties Sold 41 37 -9.8% % Sold Price to List Price 100.3% 100.5% 0.2% January through December 2021 2022 % Change Average Price $649,553 $724,900 11.6% Average Price Per Square Foot $424 $499 17.7% Average Days on Market 19 18 -5.3% Highest Price $9,000,000 $9,000,000Properties Sold 17,013 12,912 -24.1% % Sold Price to List Price 100.7% 104.4% 3.7%
Boundaries: Kentucky to Alameda; Wadsworth to
January through December 2021 2022 % Change Average Price $595,778 $650,786 9.2% Average Price Per Square Foot $473 $534 12.8% Average Days on Market 17 16 -5.9% Highest Price $1,185,000 $1,260,000 6.3% Properties Sold 155 115 -25.8% % Sold Price to List Price 102.4% 101.4% -1.0%
Boundaries:
Designed to resemble a Scottish village, Bonnie Brae/Belcaro features winding tree-lined streets, a circular central park, and a collection of small shops.
130.0%
The number of properties sold in Bow Mar/Bow Mar South increased by 130.0% in 2022 compared to that of 2021.
Boundaries: W 38th Ave to I-70; Sheridan to Federal Boundaries: West Quincy Avenue to West Bowles Avenue January through December 2021 2022 % Change Average Price $2,043,190 $2,391,065 17.0% Average Price Per Square Foot $617 $757 22.6% Average Days on Market 18 27 50.0% Highest Price $5,400,000 $5,350,000 -0.9% Properties Sold 10 23 130.0% % Sold Price to List Price 99.4% 97.3% -2.1% January through December 2021 2022 % Change Average Price $787,054 $973,754 23.7% Average Price Per Square Foot $622 $709 13.9% Average Days on Market 11 13 18.2% Highest Price $1,780,000 $2,565,000 44.1% Properties Sold 190 140 -26.3% % Sold Price to List Price 103.5% 102.9% -0.6% Boundaries: Mississippi to Cherry Creek Drive South; University to Colorado January through December 2021 2022 % Change Average Price $1,689,595 $2,091,223 23.8% Average Price Per Square Foot $703 $810 15.2% Average Days on Market 14 13 -7.1% Highest Price $5,000,000 $7,000,000 40.0% Properties Sold 88 61 -30.7% % Sold Price to List Price 102.5% 102.0% -0.5% BOW MAR/BOW MAR SOUTH BONNIE BRAE/BELCARO BERKELEY
20.0%
The highest sale price in Central Park increased by 20.0% in 2022 compared to that of 2021.
CAPITOL HILL Boundaries: Broadway to Downing; 6th Avenue to Colfax CENTRAL PARK CHEESMAN PARK Boundaries: York to Downing; Colfax to 8th Avenue January through December 2021 2022 % Change Average Price $653,252 $547,754 -16.1% Average Price Per Square Foot $441 $480 8.7% Average Days on Market 39 16 -59.0% Highest Price $4,900,000 $3,250,000 -33.7% Properties Sold 227 153 -32.6% % Sold Price to List Price 99.0% 100.5% 1.5% January through December 2021 2022 % Change Average Price $421,348 $458,737 8.9% Average Price Per Square Foot $401 $447 11.5% Average Days on Market 27 15 -44.4% Highest Price $6,500,000 $4,600,000 -29.2% Properties Sold 525 340 -35.2% % Sold Price to List Price 98.9% 101.3% 2.4% Boundaries: Quebec to Havana; Montview to 64th January through December 2021 2022 % Change Average Price $903,702 $1,040,429 15.1% Average Price Per Square Foot $386 $451 16.7% Average Days on Market 8 14 75.0% Highest Price $2,250,000 $2,700,000 20.0% Properties Sold 430 378 -12.1% % Sold Price to List Price 103.1% 102.2% -0.9%
Cherry Creek East/South is an affluent residential district with a vibrant shopping scene. Overlooking the creek itself, Cherry Creek Mall has department stores, highend fashion boutiques, and eclectic eateries.
30.8%
The average number of days on market in Cherry Hills Village (under one acre) decreased by 30.8% in 2022 compared to that of 2021.
Boundaries: University to Colorado; Alameda to 1st Avenue January through December 2021 2022 % Change Average Price $2,760,393 $3,009,952 9.0% Average Price Per Square Foot $621 $729 17.4% Average Days on Market 26 18 -30.8% Highest Price $5,000,000 $7,100,000 42.0% Properties Sold 66 44 -33.3% % Sold Price to List Price 99.6% 104.9% 5.3% January through December 2021 2022 % Change Average Price $823,606 $1,166,577 41.6% Average Price Per Square Foot $460 $542 17.8% Average Days on Market 35 24 -31.4% Highest Price $4,725,000 $7,875,000 66.7% Properties Sold 156 103 -34.0% % Sold Price to List Price 98.5% 98.9% 0.5% Boundaries: York to Colorado; 1st Avenue to 6th Avenue January through December 2021 2022 % Change Average Price $1,590,144 $1,889,205 18.8% Average Price Per Square Foot $678 $808 19.1% Average Days on Market 38 18 -52.6% Highest Price $7,625,000 $9,000,000 18.0% Properties Sold 180 150 -16.7% % Sold Price to List Price 97.3% 99.9% 2.7% CHERRY HILLS VILLAGE CHERRY CREEK NORTH CHERRY CREEK EAST/SOUTH
(Under One Acre) Boundaries: Hampden to Belleview; Clarkson to Happy Canyon Road and Charlou
(Over One Acre) Boundaries: Hampden to Belleview; Clarkson to Happy Canyon Road and Charlou 10.0%
The average number of days on market in City Park decreased by 10.0% in 2022 compared to that of 2021.
Boundaries: Downing to York; 18th to Martin Luther King
CHERRY HILLS VILLAGE CITY PARK CITY PARK SOUTH
January through December 2021 2022 % Change Average Price $819,134 $1,193,525 45.7% Average Price Per Square Foot $544 $583 7.3% Average Days on Market 14 5 -64.3% Highest Price $1,275,000 $1,720,000 34.9% Properties Sold 19 10 -47.4% % Sold Price to List Price 103.2% 108.2% 4.8% January through December 2021 2022 % Change Average Price $4,264,858 $4,324,897 1.4% Average Price Per Square Foot $722 $876 21.4% Average Days on Market 71 24 -66.2% Highest Price $15,725,000 $13,000,000 -17.3% Properties Sold 60 29 -51.7% % Sold Price to List Price 98.4% 99.6% 1.3%
Boundaries: York to Colorado; Colfax to 17th
January through December 2021 2022 % Change Average Price $794,793 $842,066 5.9% Average Price Per Square Foot $501 $537 7.1% Average Days on Market 20 18 -10.0% Highest Price $1,850,000 $1,750,000 -5.4% Properties Sold 114 98 -14.0% % Sold Price to List Price 102.3% 101.3% -1.0%
44.4%
The average number of days on market in Columbine Valley decreased by 44.4% in 2022 compared to that of 2021.
Boundaries: South Polo Ridge Drive to West Bowles; Platte Canyon Road to South Platte River Boundaries: South University Blvd to South Colorado Blvd; 1-25 to East Mississippi Ave January through December 2021 2022 % Change Average Price $1,194,850 $1,470,644 23.1% Average Price Per Square Foot $583 $703 20.7% Average Days on Market 18 16 -11.1% Highest Price $2,550,000 $3,730,000 46.3% Properties Sold 156 98 -37.2% % Sold Price to List Price 100.9% 99.7% -1.1% January through December 2021 2022 % Change Average Price $1,724,020 $1,863,392 8.1% Average Price Per Square Foot $498 $537 7.8% Average Days on Market 18 10 -44.4% Highest Price $3,500,000 $3,200,000 -8.6% Properties Sold 37 31 -16.2% % Sold Price to List Price 99.7% 100.0% 0.3% Boundaries: York to Colorado; 6th Avenue to Colfax January through December 2021 2022 % Change Average Price $765,017 $843,979 10.3% Average Price Per Square Foot $537 $583 8.7% Average Days on Market 14 13 -7.1% Highest Price $2,950,000 $2,650,000 -10.2% Properties Sold 245 206 -15.9% % Sold Price to List Price 102.0% 102.3% 0.3% CORYMERRILL CONGRESS PARK COLUMBINE VALLEY
Named after John J. Cory and Louise A. Merrill, two influential Denver educators, Cory-Merrill is a popular area for residents looking for a laid-back, family-friendly neighborhood.
64.6%
The average number of days on market in Country Club decreased by 64.6% in 2022 compared to that of 2021.
16.3%
The average price per square foot in Crestmoor Park increased by 16.3% in 2022 compared to that of 2021.
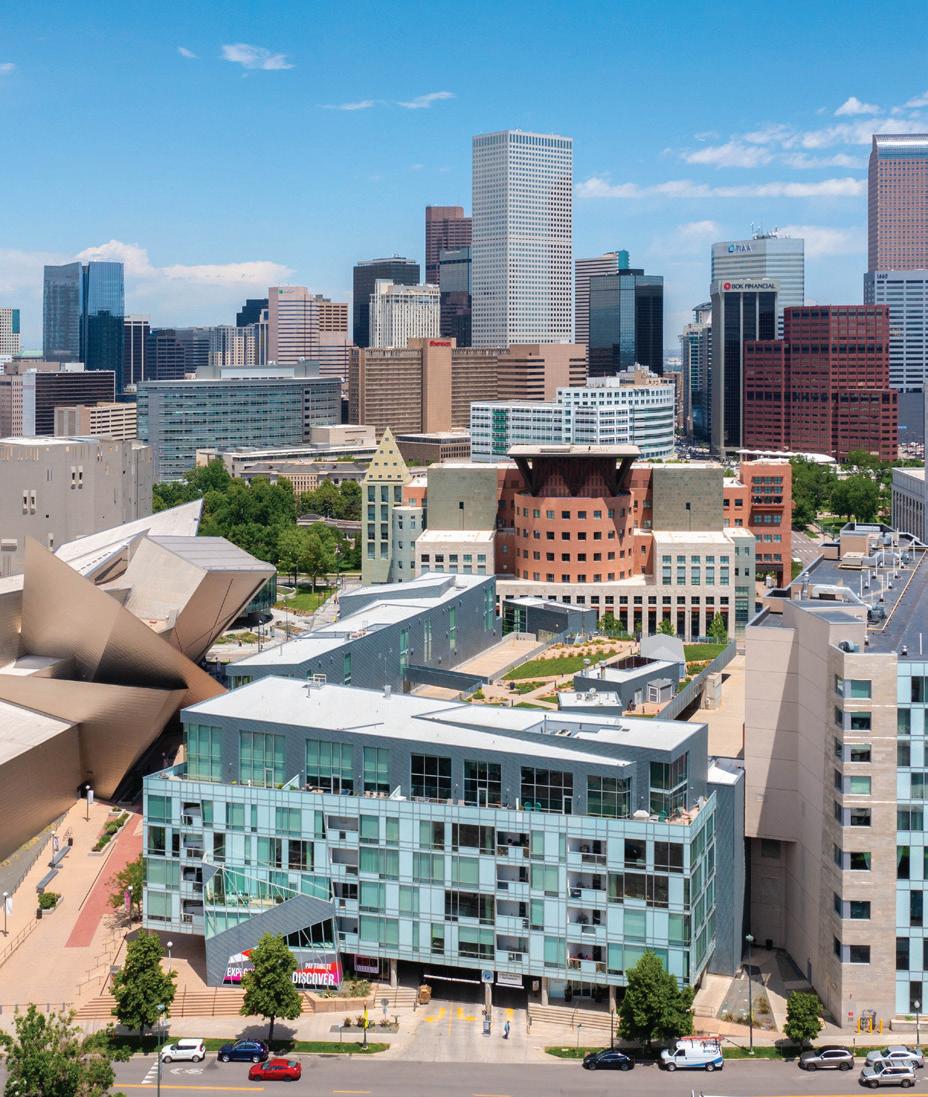
(Attached Dwellings) Boundaries: Downtown Denver MLS Area
COUNTRY CLUB Boundaries: University to Downing 1st - 4th; Race to University 4th - 6th CRESTMOOR PARK DOWNTOWN DENVER January through December 2021 2022 % Change Average Price $752,935 $760,835 1.0% Average Price Per Square Foot $579 $577 -0.4% Average Days on Market 48 42 -12.5% Highest Price $5,250,000 $5,000,000 -4.8% Properties Sold 745 533 -28.5% % Sold Price to List Price 98.2% 98.5% 0.3% January through December 2021 2022 % Change Average Price $3,199,401 $2,550,234 -20.3% Average Price Per Square Foot $759 $820 8.2% Average Days on Market 65 23 -64.6% Highest Price $6,075,000 $5,100,000 -16.0% Properties Sold 24 17 -29.2% % Sold Price to List Price 97.9% 95.6% -2.3% Boundaries: Holly to Monaco; Bayaud to 6th Avenue January through December 2021 2022 % Change Average Price $1,761,761 $1,889,341 7.2% Average Price Per Square Foot $591 $687 16.3% Average Days on Market 15 10 -33.3% Highest Price $3,500,000 $4,250,000 21.4% Properties Sold 25 22 -12.0% % Sold Price to List Price 104.3% 103.0% -1.2%
Greenwood Village East contains nationally recognized business parks, like the Denver Tech Center, a variety of delicious restaurants, and the popular Fiddler’s Green Amphitheater.
49.4%
The highest priced home in Greenwood Village West (under one acre) increased by 49.4% in 2022 compared to that of 2021.
Boundaries: North Speer Blvd to Broadway; Colfax to 7th January through December 2021 2022 % Change Average Price $2,355,648 $2,441,096 3.6% Average Price Per Square Foot $593 $640 7.9% Average Days on Market 19 11 -42.1% Highest Price $4,500,000 $6,725,000 49.4% Properties Sold 59 54 -8.5% % Sold Price to List Price 102.0% 102.1% 0.2% January through December 2021 2022 % Change Average Price $583,687 $671,309 15.0% Average Price Per Square Foot $406 $439 8.0% Average Days on Market 36 28 -22.2% Highest Price $1,175,000 $2,085,887 77.5% Properties Sold 70 59 -15.7% % Sold Price to List Price 97.2% 99.5% 2.4% Boundaries: I-25 to Havana; Belleview to Orchard January through December 2021 2022 % Change Average Price $1,515,565 $1,686,950 11.3% Average Price Per Square Foot $455 $552 21.3% Average Days on Market 20 14 -30.0% Highest Price $2,310,000 $2,575,296 11.5% Properties Sold 41 43 4.9% % Sold Price to List Price 100.1% 103.0% 2.9% GREENWOOD VILLAGE WEST GREENWOOD VILLAGE EAST GOLDEN TRIANGLE
(Under One Acre) Boundaries: Orchard to Belleview; Clarkson to I-25
17.3%
The average price per square foot in Greenwood Village West (over one acre) increased by 17.3% in 2022 compared to that of 2021.
Hale Mayfair is a mature neighborhood located in East Denver with close proximity to both Rose Hospital and National Jewish Hospital. Here you will find a variety of large Victorian homes surrounded by many restaurants and cafes.
21.0%
The average price per square foot in Heritage Greens increased by 21.0% in 2022 compared to that of 2021.
GREENWOOD VILLAGE WEST HALE MAYFAIR HERITAGE GREENS Boundaries: Dry Creek to County Line; Colorado Blvd to Holly January through December 2021 2022 % Change Average Price $1,138,172 $1,338,298 17.6% Average Price Per Square Foot $361 $437 21.0% Average Days on Market 5 7 40.0% Highest Price $1,975,000 $2,255,000 14.2% Properties Sold 27 28 3.7% % Sold Price to List Price 102.4% 105.7% 3.2% January through December 2021 2022 % Change Average Price $3,413,539 $3,584,321 5.0% Average Price Per Square Foot $609 $714 17.3% Average Days on Market 30 51 70.0% Highest Price $7,428,000 $5,998,000 -19.3% Properties Sold 18 14 -22.2% % Sold Price to List Price 96.9% 94.2% -2.8% Boundaries: Colorado to Holly; 6th to Colfax January through December 2021 2022 % Change Average Price $823,538 $921,671 11.9% Average Price Per Square Foot $615 $677 10.0% Average Days on Market 7 13 85.7% Highest Price $1,620,000 $2,100,000 29.6% Properties Sold 124 87 -29.8% % Sold Price to List Price 104.2% 102.7% -1.5% (Over One Acre) Boundaries: Orchard to Belleview; Clarkson to I-25
40.0%
The average number of days on market in Highlands decreased by
in 2022 compared to that of 2021.
18.0%
The average home sale price in Homestead increased by 18.0% in 2022 compared to that of 2021.
Boundaries: W 38th Avenue to Speer Blvd; S Platte River to Federal Blvd January through December 2021 2022 % Change Average Price $690,160 $814,313 18.0% Average Price Per Square Foot $379 $433 14.4% Average Days on Market 7 13 85.7% Highest Price $1,508,000 $2,100,000 39.3% Properties Sold 127 99 -22.0% % Sold Price to List Price 104.2% 102.7% -1.5% January through December 2021 2022 % Change Average Price $800,928 $939,509 17.3% Average Price Per Square Foot $551 $652 18.3% Average Days on Market 25 15 -40.0% Highest Price $5,100,000 $2,775,000 -45.6% Properties Sold 390 248 -36.4% % Sold Price to List Price 100.5% 102.9% 2.4% Boundaries: Alameda to 6th; Colorado to Holly January through December 2021 2022 % Change Average Price $1,852,767 $2,176,659 17.5% Average Price Per Square Foot $591 $717 21.3% Average Days on Market 22 12 -45.5% Highest Price $4,500,000 $8,000,000 77.8% Properties Sold 107 82 -23.4% % Sold Price to List Price 99.6% 100.7% 1.1% HOMESTEAD HILLTOP HIGHLANDS Boundaries: Colorado to Quebec; Arapahoe to Dry Creek
40.0%
With both new residential and commercial developments, Jefferson Park offers a mix of both young professionals and families.
24.7%
The average home sale price in Ken Caryl Valley increased by 24.7% in 2022 compared to that of 2021.
Boundaries: Federal Blvd to S Platte River; South of 29th Ave & Speer Blvd, North of Mile High Stadium
Boundaries: Red Fox Lane to North Ranch Road; Golden Eagle Road to Blue Grouse Ridge Road
JEFFERSON PARK KEN CARYL NORTH RANCH KEN CARYL VALLEY
Carly Ave January through December 2021 2022 % Change Average Price $993,546 $1,238,650 24.7% Average Price Per Square Foot $375 $459 22.4% Average Days on Market 7 10 42.9% Highest Price $1,725,000 $2,070,000 20.0% Properties Sold 66 46 -30.3% % Sold Price to List Price 101.1% 105.0% 3.9% January through December 2021 2022 % Change Average Price $606,716 $787,204 29.7% Average Price Per Square Foot $459 $541 17.7% Average Days on Market 29 18 -37.9% Highest Price $1,345,000 $1,705,000 26.8% Properties Sold 146 101 -30.8% % Sold Price to List Price 100.8% 101.9% 1.1%
Boundaries: Tamarade Drive to Manor House Road; Mountain High Court to West Ken
January through December 2021 2022 % Change Average Price $1,585,238 $1,772,250 11.8% Average Price Per Square Foot $420 $447 6.4% Average Days on Market 7 3 -57.1% Highest Price $2,225,000 $2,127,500 -4.4% Properties Sold 21 6 -71.4% % Sold Price to List Price 102.0% 107.0% 4.9%
The Lower Highlands, LoHi for short, is an area admired for its hip restaurants, renovated bungalows, and an ice cream shop in a giant milk can. A hot spot for entertainment, retail shops, and bars, it is well-known as one of the most inclusive neighborhoods in all of Denver.
20.5%
The average home sale price in Lowry increased by 20.5% in 2022 compared to that of 2021.
Boundaries: City of Lakewood January through December 2021 2022 % Change Average Price $934,747 $1,126,158 20.5% Average Price Per Square Foot $386 $446 15.5% Average Days on Market 11 15 36.4% Highest Price $2,255,000 $1,126,158 -50.1% Properties Sold 62 50 -19.4% % Sold Price to List Price 101.0% 102.4% 1.5% January through December 2021 2022 % Change Average Price $640,973 $717,851 12.0% Average Price Per Square Foot $396 $447 12.8% Average Days on Market 11 15 36.4% Highest Price $3,200,000 $3,000,000 -6.3% Properties Sold 1,723 1,320 -23.4% % Sold Price to List Price 103.1% 101.1% -2.0% Boundaries: W 38th Avenue to I-25; Speer Blvd to Zuni Street January through December 2021 2022 % Change Average Price $798,735 $959,900 20.2% Average Price Per Square Foot $545 $633 16.1% Average Days on Market 27 15 -44.4% Highest Price $4,930,000 $2,775,000 -43.7% Properties Sold 311 183 -41.2% % Sold Price to List Price 100.5% 102.3% 1.9% LOWRY LOHI LAKEWOOD Boundaries: Quebec to Unita; Alameda to 11th
39.4%
The highest sale price in Observatory Park increased by 39.4% in 2022 compared to that of 2021.
MONTCLAIR OBSERVATORY PARK PARK HILL Boundaries: Colfax to 26th; Colorado to Quebec January through December 2021 2022 % Change Average Price $958,385 $1,044,279 9.0% Average Price Per Square Foot $602 $688 14.4% Average Days on Market 11 14 27.3% Highest Price $4,000,000 $3,812,500 -4.7% Properties Sold 239 202 -15.5% % Sold Price to List Price 104.4% 104.0% -0.4% January through December 2021 2022 % Change Average Price $862,702 $1,000,450 16.0% Average Price Per Square Foot $541 $613 13.4% Average Days on Market 13 14 7.7% Highest Price $1,967,500 $2,430,000 23.5% Properties Sold 151 97 -35.8% % Sold Price to List Price 101.4% 101.2% -0.1% Boundaries: University to Colorado; Evans to Yale Boundaries: Holly to Quebec; 6th to Colfax
January through December 2021 2022 % Change Average Price $1,935,139 $2,340,386 20.9% Average Price Per Square Foot $603 $699 16.1% Average Days on Market 29 26 -10.3% Highest Price $3,870,000 $5,396,000 39.4% Properties Sold 94 62 -34.0% % Sold Price to List Price 99.0% 98.3% -0.8%
Polo Reserve is a luxury, gated community located in Littleton. The name “Polo Reserve” comes from the polo field and equestrian center within the community.
33.6%
The average home sale price in RiNo increased by 33.6% in 2022 compared to that of 2021.
Boundaries: Broadway to Downing; Louisiana to Evans January through December 2021 2022 % Change Average Price $532,201 $711,284 33.6% Average Price Per Square Foot $463 $549 18.7% Average Days on Market 24 15 -37.5% Highest Price $1,450,000 $5,750,000 296.6% Properties Sold 98 62 -36.7% % Sold Price to List Price 109.5% 101.5% -7.4% January through December 2021 2022 % Change Average Price $976,253 $1,064,753 9.1% Average Price Per Square Foot $673 $737 9.4% Average Days on Market 10 13 30.0% Highest Price $2,750,000 $2,929,800 6.5% Properties Sold 115 98 -14.8% % Sold Price to List Price 103.3% 103.2% -0.2% Boundaries: North of Mineral; South of Arabian Place; West of the S Platte River; East of S. Platte Canyon Road January through December 2021 2022 % Change Average Price $2,899,375 $2,757,500 -4.9% Average Price Per Square Foot $526 $654 24.2% Average Days on Market 53 8 -84.9% Highest Price $3,925,000 $3,200,000 -18.5% Properties Sold 8 2 -75.0% % Sold Price to List Price 96.4% 97.4% 1.0% RINO POLO RESERVE PLATT PARK Boundaries: I-25 to York St; South of I-70; North of Park Ave; East of Lawrence St to 40th Avenue
25.0%
The average number of days on market in Southern Hills decreased by 25.0% in 2022 compared to that of 2021.
The charming and entertaining Streets of Southglenn are one of the best spots in the Denver Metro area. Located in Centennial, Southglenn brings an urban feel out to the suburbs.
SLOAN’S LAKE Boundaries: Colfax to 29th; Sheridan to Federal SOUTHERN HILLS SOUTHGLENN Boundaries: Colorado to University; Arapahoe to Dry Creek January through December 2021 2022 % Change Average Price $614,866 $671,138 9.2% Average Price Per Square Foot $336 $344 2.3% Average Days on Market 8 16 100.0% Highest Price $795,000 $900,000 13.2% Properties Sold 59 53 -10.2% % Sold Price to List Price 103.7% 100.4% -3.2% January through December 2021 2022 % Change Average Price $934,424 $1,087,144 16.3% Average Price Per Square Foot $612 $691 12.9% Average Days on Market 17 15 -11.8% Highest Price $2,500,000 $3,000,000 20.0% Properties Sold 154 122 -20.8% % Sold Price to List Price 101.5% 100.3% -1.2% Boundaries: University to Colorado; Yale to Hampden January through December 2021 2022 % Change Average Price $1,194,864 $1,259,128 5.4% Average Price Per Square Foot $562 $625 11.3% Average Days on Market 12 9 -25.0% Highest Price $3,500,000 $2,525,000 -27.9% Properties Sold 69 58 -15.9% % Sold Price to List Price 101.5% 101.8% 0.4%
28.2%
The average price per square foot in Southmoor Park increased by 28.2% in 2022 compared to that of 2021.
15.9%
The average home sale price in Tallyn’s Reach increased by 15.9% in 2022 compared to that of 2021.
January through December 2021 2022 % Change Average Price $707,233 $819,836 15.9% Average Price Per Square Foot $275 $315 14.4% Average Days on Market 11 20 81.8% Highest Price $1,400,000 $1,365,000 -2.5% Properties Sold 140 96 -31.4% % Sold Price to List Price 102.4% 101.7% -0.7% January through December 2021 2022 % Change Average Price $803,258 $992,420 23.5% Average Price Per Square Foot $344 $441 28.2% Average Days on Market 19 20 5.3% Highest Price $1,150,000 $1,443,425 25.5% Properties Sold 45 36 -20.0% % Sold Price to List Price 102.8% 102.4% -0.4% Boundaries: Federal Blvd to Inca St; W 38th Ave to I-70 January through December 2021 2022 % Change Average Price $713,661 $898,586 25.9% Average Price Per Square Foot $568 $630 10.8% Average Days on Market 11 12 9.1% Highest Price $1,600,000 $2,550,000 59.4% Properties Sold 296 221 -25.3% % Sold Price to List Price 102.5% 102.3% -0.1% TALLYN’S REACH SUNNYSIDE SOUTHMOOR PARK Boundaries: North of E Dry Creek; South of Smoky Hill; West of S Powhaton; East of E-470
East of Downtown and just north of Capitol Hill rests
Denver’s Uptown—a vibrant urban area prized for its sports bars, black box theaters, and delightful mix of traditional and inventive culinary fare lining 17th Avenue, aptly named “Restaurant Row.”
20.3%
The average home sale price in Washington Park East increased by 20.3% in 2022 compared to that of 2021.
Boundaries: North of Colfax, East of Broadway, South of 20th, 20th & Park to 19th; West of Josephine
UPTOWN
WASHINGTON PARK EAST WASHINGTON PARK WEST
January through December 2021 2022 % Change Average Price $920,477 $1,064,720 15.7% Average Price Per Square Foot $593 $678 14.3% Average Days on Market 13 16 23.1% Highest Price $2,505,000 $3,250,000 29.7% Properties Sold 230 167 -27.4% % Sold Price to List Price 103.1% 101.2% -1.8% January through December 2021 2022 % Change Average Price $542,321 $613,263 13.1% Average Price Per Square Foot $433 $495 14.5% Average Days on Market 29 19 -34.5% Highest Price $3,100,000 $1,750,000 -43.5% Properties Sold 246 183 -25.6% % Sold Price to List Price 99.1% 101.2% 2.2% Boundaries:
to University January through December 2021 2022 % Change Average Price $1,746,744 $2,100,473 20.3% Average Price Per Square Foot $767 $890 16.1% Average Days on Market 23 20 -13.0% Highest Price $4,450,000 $5,450,000 22.5% Properties Sold 164 119 -27.4% % Sold Price to List Price 102.4% 101.3% -1.1%
Boundaries: Louisiana to Ellsworth; Broadway to Downing
Louisiana to Ellsworth, Downing
19.2%
The average home sale price in the area of West Highlands increased by 19.2% in 2022 compared to that of 2021.
Boundaries: 38th Avenue; Federal to Sheridan January through December 2021 2022 % Change Average Price $844,492 $1,006,274 19.2% Average Price Per Square Foot $605 $719 18.8% Average Days on Market 14 12 -14.3% Highest Price $2,950,000 $3,600,000 22.0% Properties Sold 272 206 -24.3% % Sold Price to List Price 102.9% 103.7% 0.7%
WEST HIGHLANDS
for new horizons 303.893.3200 | livsothebysrealty.com
The definition of paradise depends on your point of view. Find a home that makes each day more extraordinary than the last with LIV Sotheby’s International Realty.
MICRO MARKET REPORT | Denver Metro JANUARY - DECEMBER 2022 • COLORADOMICROREPORTS.COM


