MARKET UPDATE
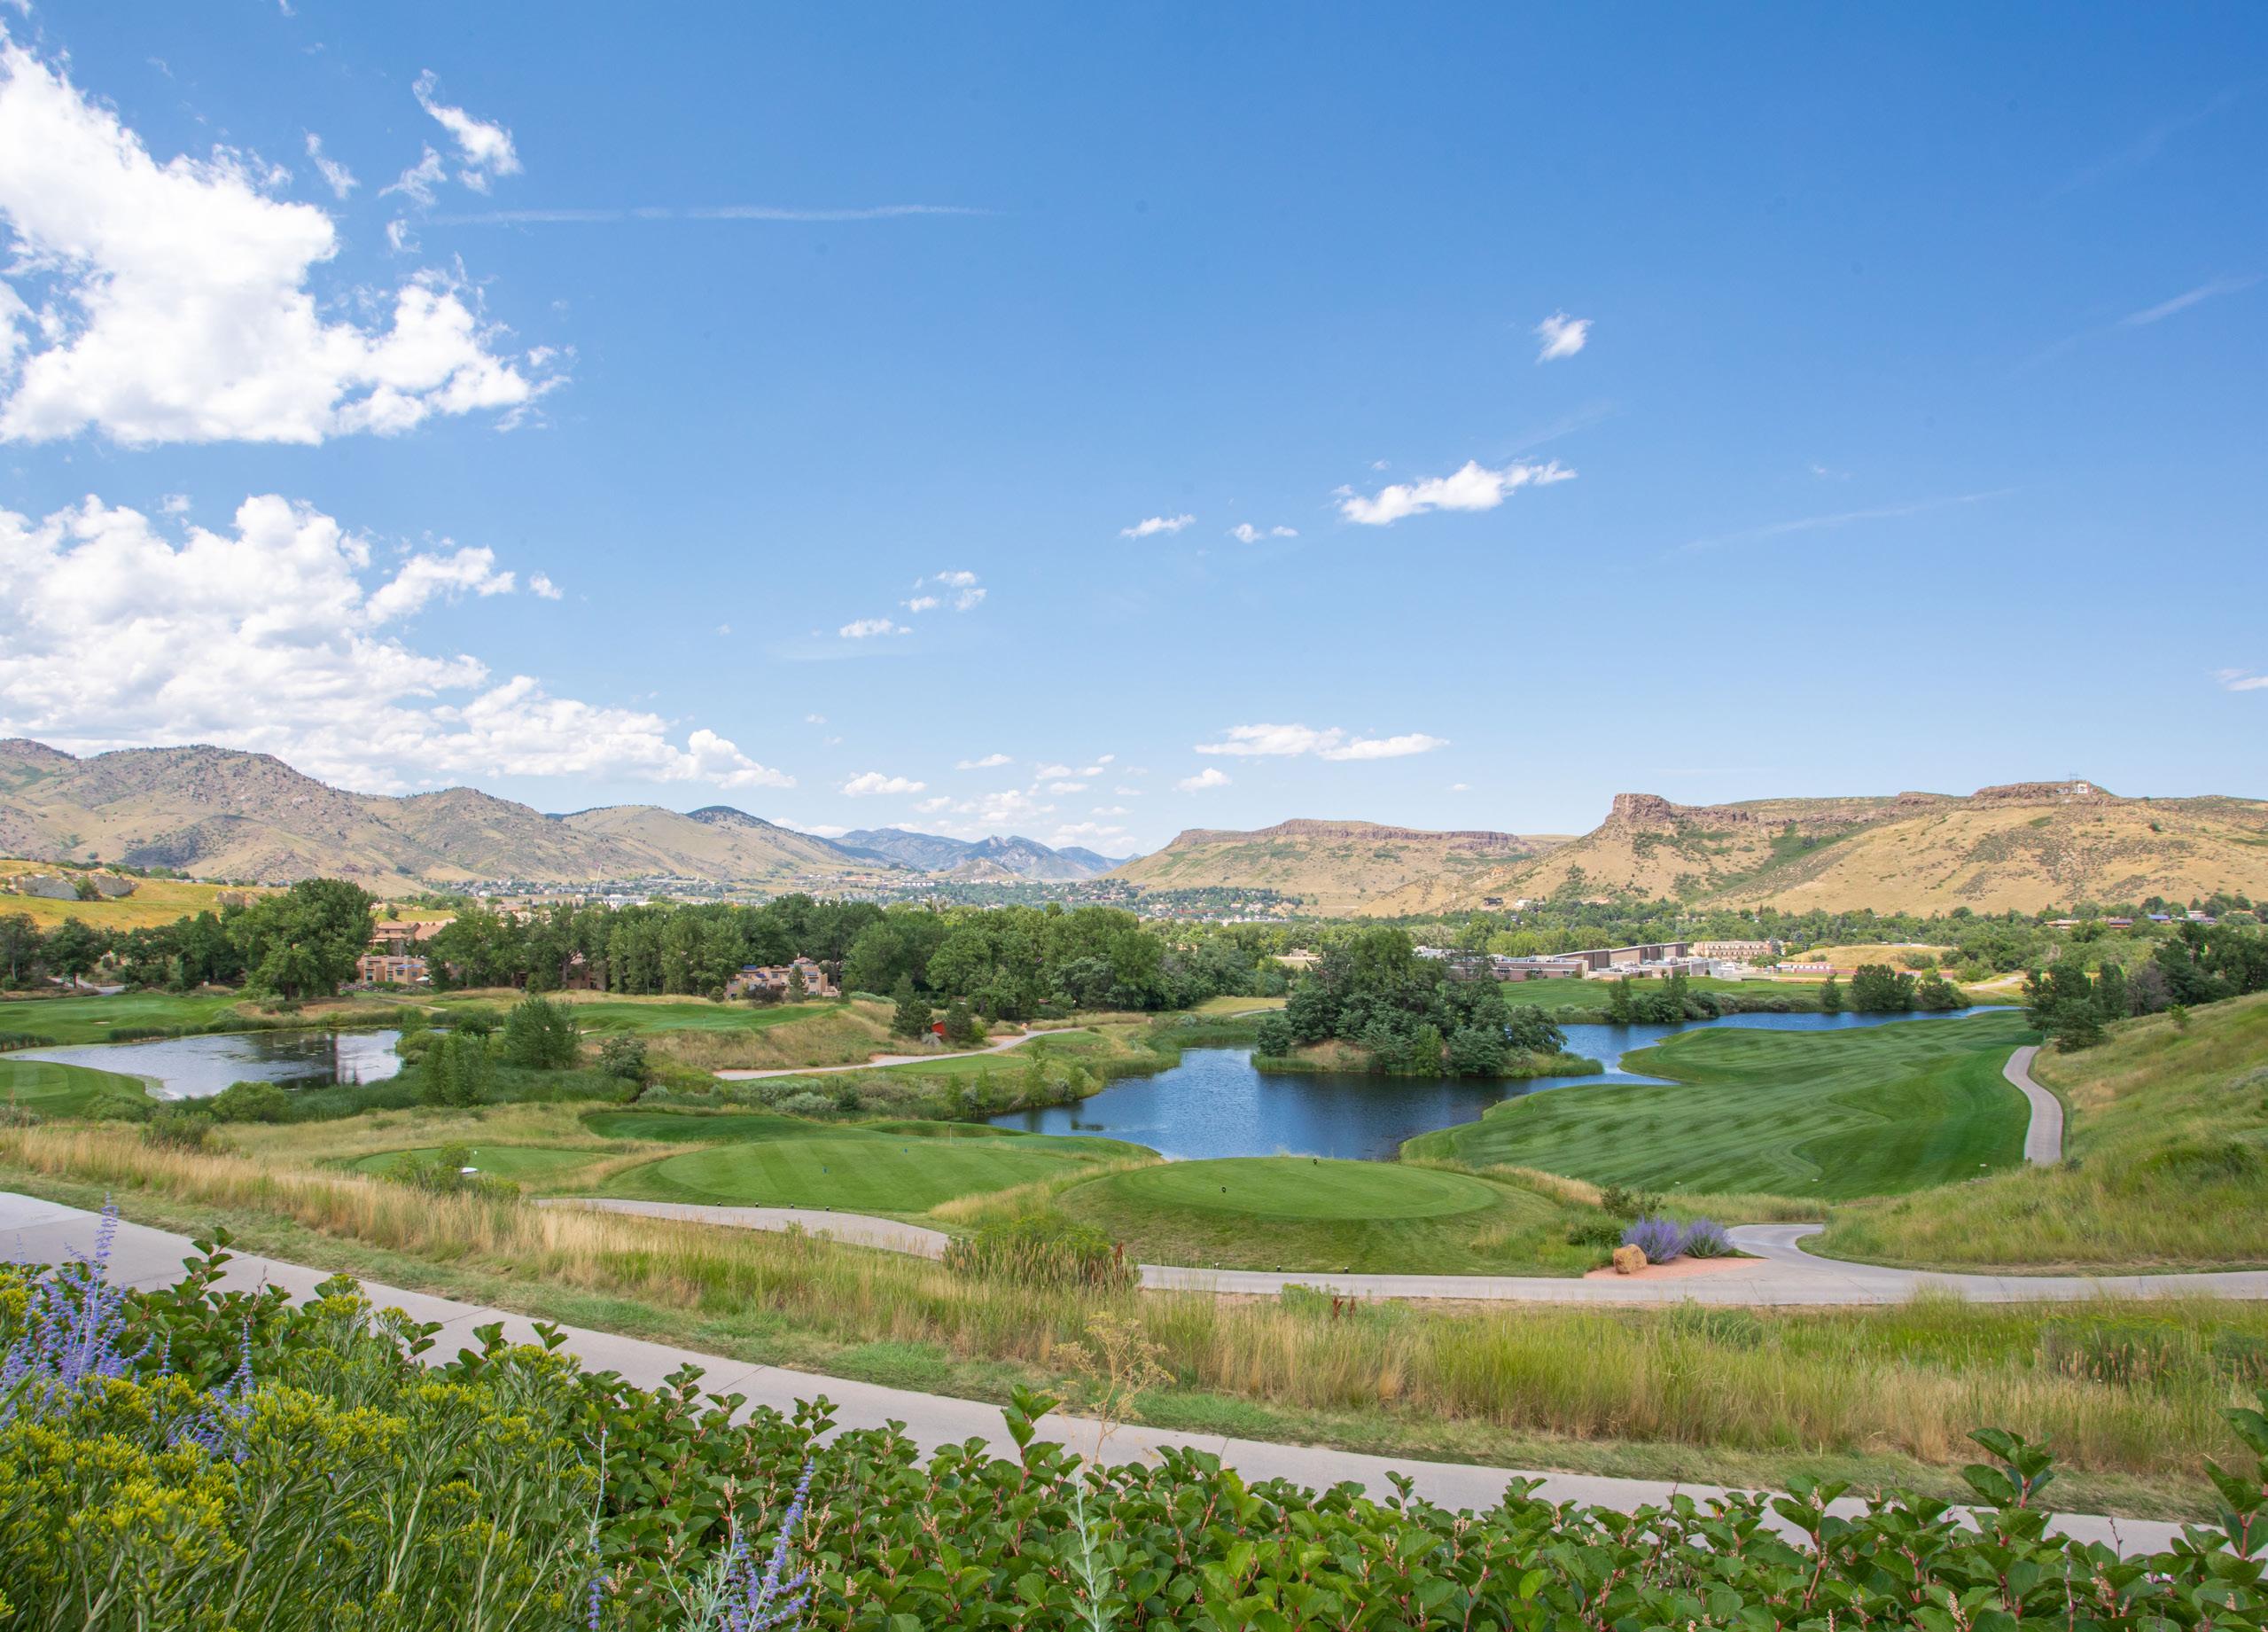
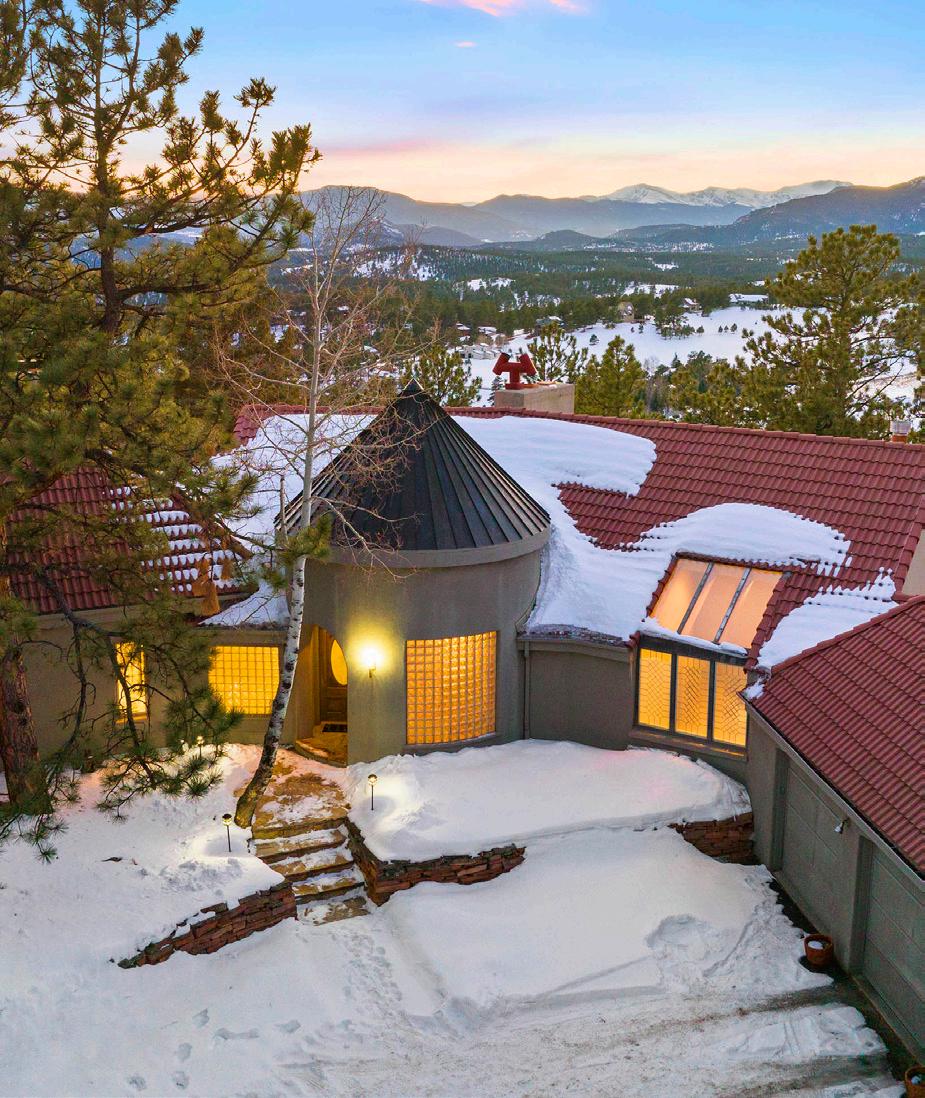
Bridging the Denver and mountain communities, the Foothills benefit from a unique combination of natural beauty, convenience to both urban areas and outdoor recreation, and some of the most amazing communities to call ‘home.’ Situated within the west corridor of Jefferson County, this collection of neighborhoods including beloved areas such as Genesee, Hiwan Hills, and Lookout Mountain, provides more privacy and space than other areas of Denver and gives its residents a taste of mountain living.
The Foothills real estate market is starting off 2023 on a positive note and outperforming many conservative expectations. The number of homes sold throughout Jefferson County decreased in comparison to 2022. Through March of this year, there have been 1,164 homes sold—down 17.5% from 2022. However, low inventory coupled with continued buyer demand resulted in housing prices remaining strong and a decrease in the days on market. After a slow end of 2022, momentum is certainly building in the Foothills real estate market.
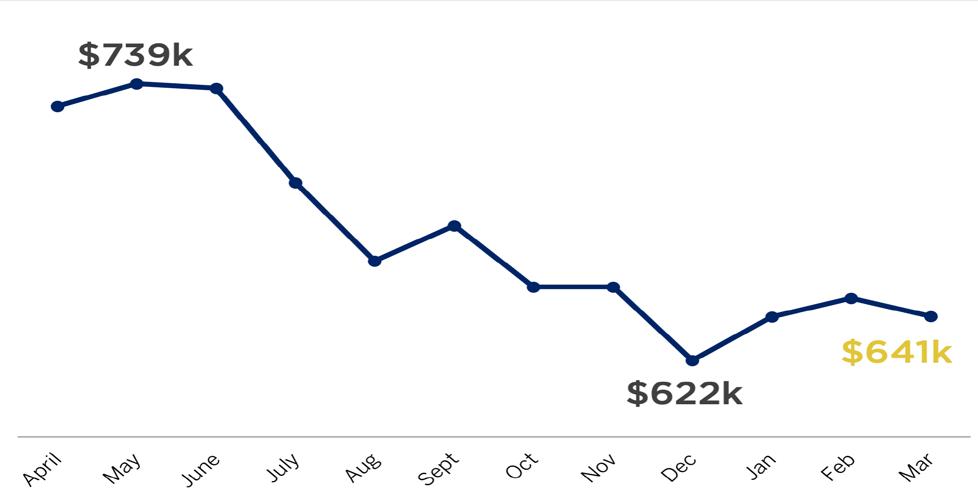
While rising interest rates mean that buyers have less purchasing power and sellers have come down ever so slightly on pricing, limited inventory and high demand still give sellers a lot of control in this market. During the first quarter of the year, the average price for a single-family home in Jefferson County is $729,892—down 6.1% from 2022.
Individual neighborhoods with the Foothills communities vary in market trends, as there are many distinctions even within this small geographic region. We are seeing a wide variance in buyer demand for certain neighborhoods, subdivisions and even buildings. In the first quarter of 2023, Conifer Mountain saw a 7.7% increase in average sales price compared to 2022, and the Evergreen Meadows saw a -22.2% decrease for the same time period.
We recognize each locality is unique and no two regions respond to market shifts the same way. To aid in presenting an accurate picture of each of the areas that make up the Foothills communities, LIV Sotheby’s International Realty is proud to present our Micro-Market Report, representing the metrics of many key and beloved neighborhoods.
Jefferson County
coloradomicroreports.com Based on Information from REColorado for the period January 1st, 2023 - March 31th, 2023. This representation is based in whole or in part on data supplied by REColorado. REColorado does not guarantee nor is in any way responsible for its accuracy. Data maintained by REColorado may not reflect all real estate activity in the market.
January through March 2022 2023 % Change New Listings 2,435 2,046 -16.0% Sold Listings (All Properties) 2,005 1,654 -17.5% Average Price (All Properties) $681,479 $647,206 -5.0% Average Price (Single Family) $777,449 $729,892 -6.1% Average Days on Market 11 38 245.5% % Sold Price to Original List Price 105.2% 98.6% -6.3% Total Dollar Volume Sold $1,366,365,412 $1,070,479,326 -21.7%
Average Sales Price (All Properties)
MICRO MARKET REPORT | Foothills JANUARY - MARCH 2023 • COLORADOMICROREPORTS.COM livsothebysrealty.com
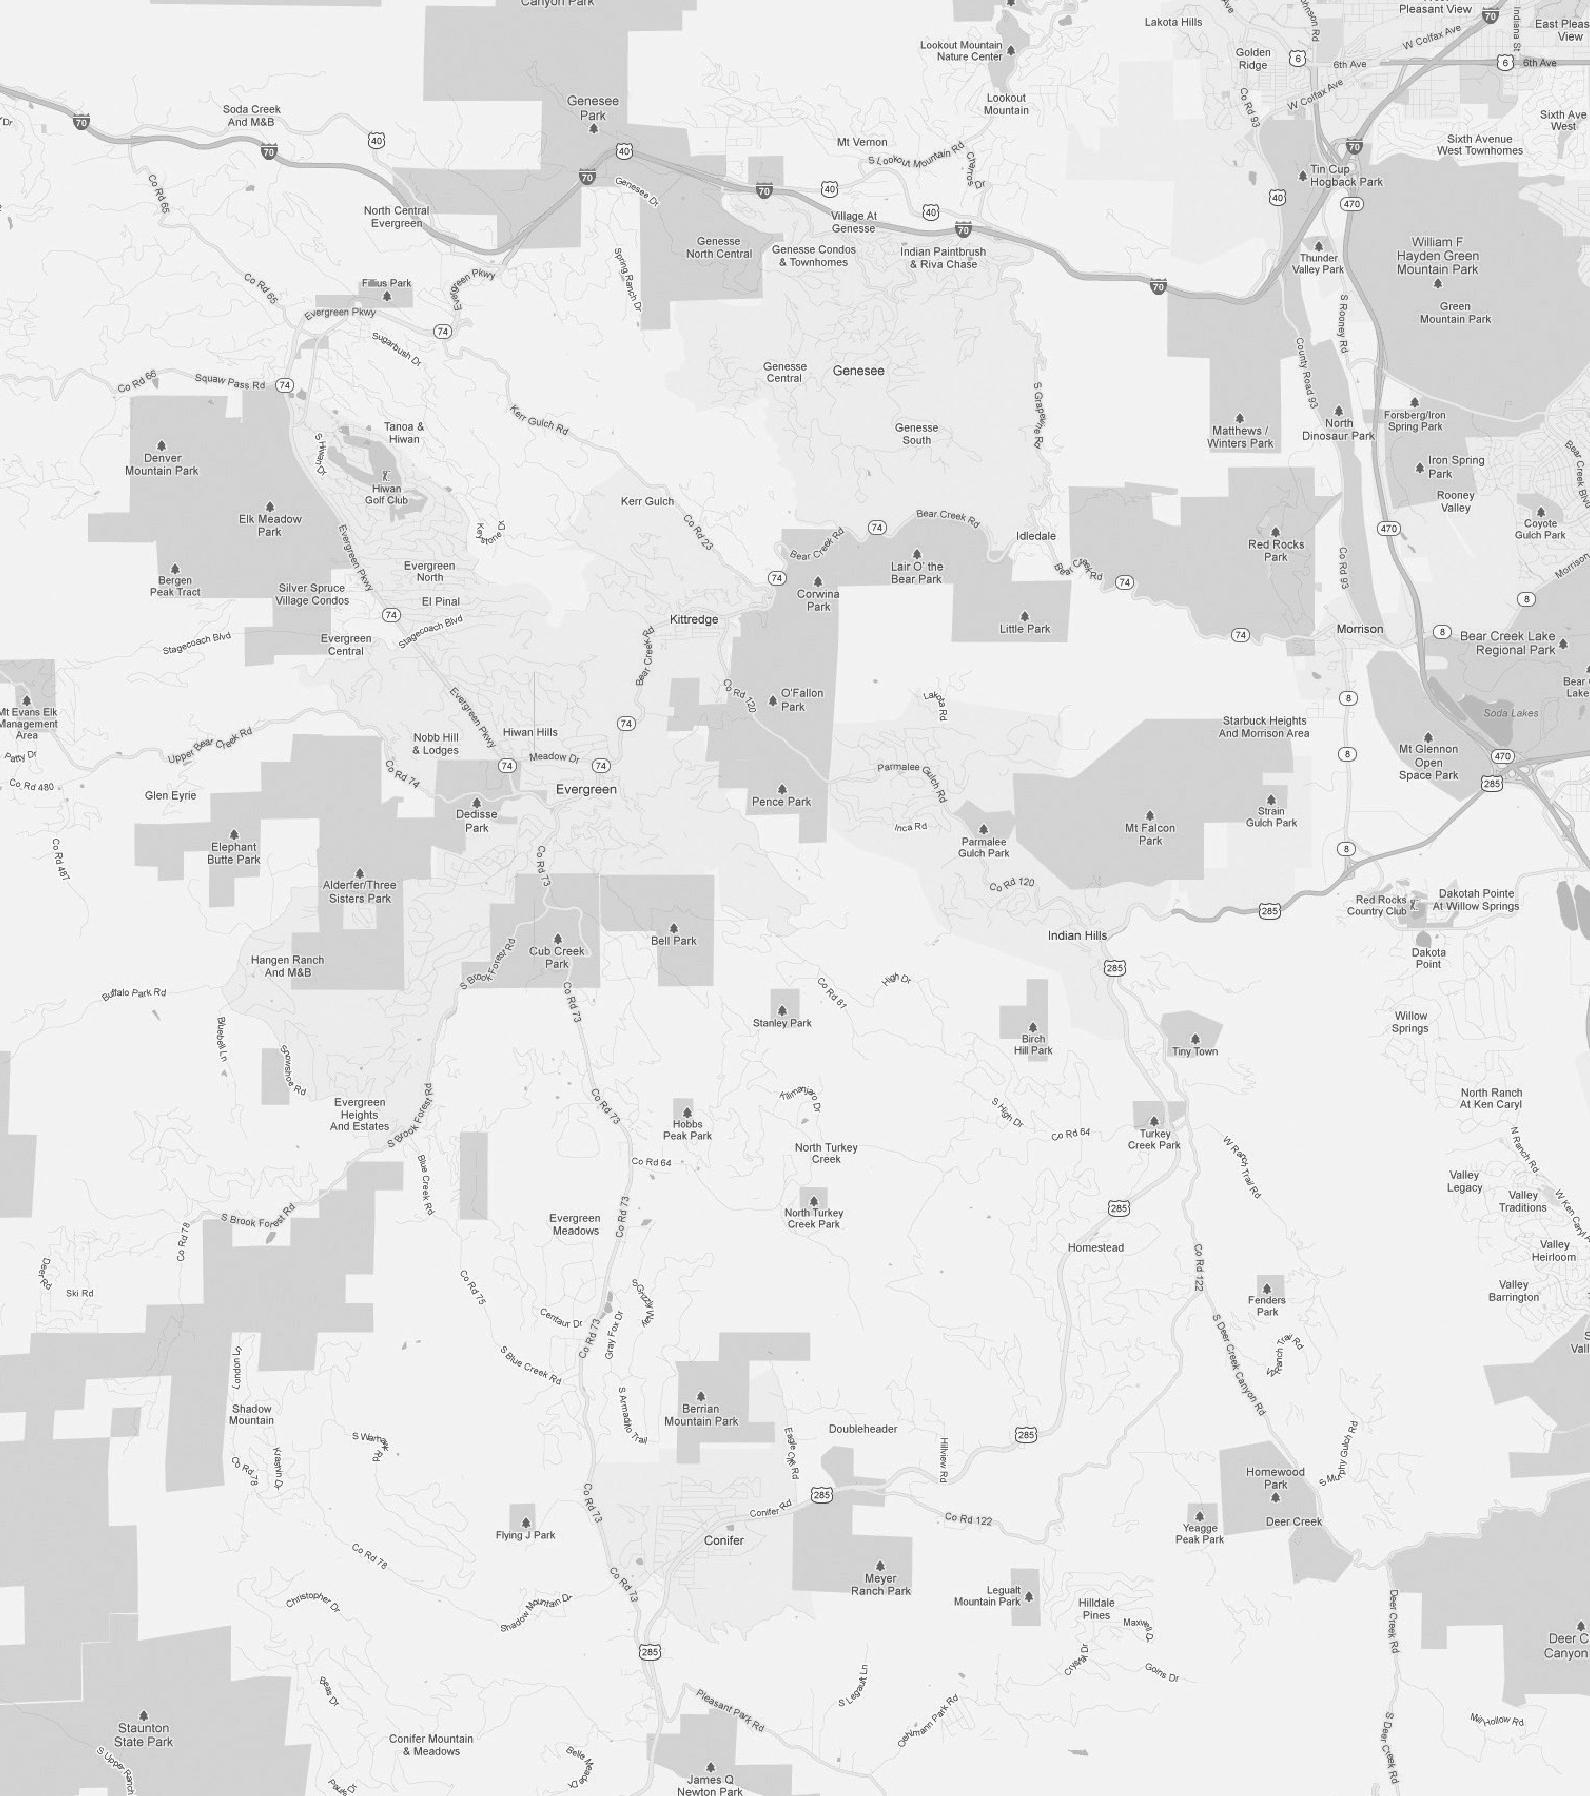
FOOTHILLS NEIGHBORHOODS
1. Bear Mountain
2. Brook Forest
3. Conifer Mountain
4. Evergreen Highlands
5. Evergreen Meadows
6. Evergreen Meadows West
7. Evergreen Park Estates
8. Genesee
9. Hangen Ranch
10. Hiwan Country Club
11. Hiwan Hills
12. Lookout Mountain
13. Mt. Vernon Country Club
14. Ridge at Hiwan
15. Riva Chase
16. Shadow Mountain
17. Soda Creek
18. Spring Ranch
19. Tanoa
5 12 6 8 3 7 4 1 9 2 10 20 11 13 14 15 16 17 19 18
20. Upper Bear Creek
Bear Mountain, perched at 8,629 feet in elevation on the eastern side of Evergreen, provides residents with the quintessential Colorado lifestyle experience. This serene community is located approximately 35 minutes west of Denver.
7.2%
The average price per square foot in Brook Forest increased by 7.2% in the first quarter of 2023 compared to that of 2022.
BEAR MOUNTAIN BROOK FOREST CONIFER MOUNTAIN January through March 2022 2023 % Change Average Price $757,200 $810,250 7.0% Average Price Per Square Foot $317 $277 -12.5% Average Days on Market 9 83 822.2% Highest Price $910,000 $967,000 6.3% Properties Sold 5 4 -20.0% % Sold Price to List Price 101.5% 90.4% -10.9% January through March 2022 2023 % Change Average Price $784,250 $536,000 -31.7% Average Price Per Square Foot $338 $363 7.2% Average Days on Market 12 11 -8.3% Highest Price $1,400,000 $760,000 -45.7% Properties Sold 4 3 -25.0% % Sold Price to List Price 105.6% 95.1% -9.9%
January through March 2022 2023 % Change Average Price $1,112,500 -Average Price Per Square Foot $342 -Average Days on Market 64 -Highest Price $1,225,000 -Properties Sold 2 No Sales% Sold Price to List Price 96.2% - -
Evergreen Highlands is a 230-home community along the front range of the Rocky Mountains. Residents love Evergreen Highlands for the community’s array of amenities, including tennis and volleyball courts, playgrounds, a trout pond, stables, and more.
Evergreen Meadows West is located down the road from Flying J Ranch and Arapahoe National Forest. Just 15 minutes from downtown Evergreen, here you can find quiet home sites on two-plus acres, as well as gorgeous views and a convenient location.
January through March 2022 2023 % Change Average Price
Average Price Per Square Foot
Average Days on Market
Highest Price
Properties Sold No Sales No Sales
% Sold Price to List Price
January through March 2022 2023 % Change Average Price $1,010,000 $704,250 -30.3% Average Price Per Square Foot $365 $268 -26.5% Average Days on Market 5 16 220.0% Highest Price $1,010,000 $888,500 -12.0% Properties Sold 1 2 100.0% % Sold Price to List Price 115.4% 89.0% -22.9% January through March 2022 2023 % Change Average Price $1,296,000 $1,022,400 -21.1% Average Price Per Square Foot $328 $338 3.1% Average Days on Market 3 48 1500.0% Highest Price $1,354,000 $1,250,000 -7.7% Properties Sold 3 5 66.7% % Sold Price to List Price 106.5% 96.2% -9.7% EVERGREEN MEADOWS WEST EVERGREEN MEADOWS EVERGREEN HIGHLANDS
- - -
- - -
- - -
- - -
-
- - -
Evergreen Park Estates is a quiet area with most homesites between one to two acres. This area is located conveniently close to Alderfer/Three Sisters Park and is about 10 minutes to local shopping.
Hangen Ranch is a small neighborhood located in South Evergreen, providing a mix of modern, mountain and old-farm-style homes. With views of Mt. Evans and only minutes from Evergreen Lake, Hangen Ranch is perfect for those looking to enjoy the outdoors.
EVERGREEN PARK ESTATES GENESEE HANGEN
January through March 2022 2023 % Change Average Price - -Average Price Per Square Foot - -Average Days on Market - -Highest Price - -Properties Sold No Sales No Sales% Sold Price to List Price - -January through March 2022 2023 % Change Average Price - -Average Price Per Square Foot - -Average Days on Market - -Highest Price - -Properties Sold No Sales No Sales% Sold Price to List Price - -January through March 2022 2023 % Change Average Price $1,706,020 $1,367,500 -19.8% Average Price Per Square Foot $336 $328 -2.5% Average Days on Market 30 36 20.0% Highest Price $2,369,080 $1,975,000 -16.6% Properties Sold 4 7 75.0% % Sold Price to List Price 98.5% 96.4% -2.2%
RANCH
31.7%
The highest home sale price in Lookout Mountain increased by 31.7% in the first quarter of 2023 compared to that of 2022.
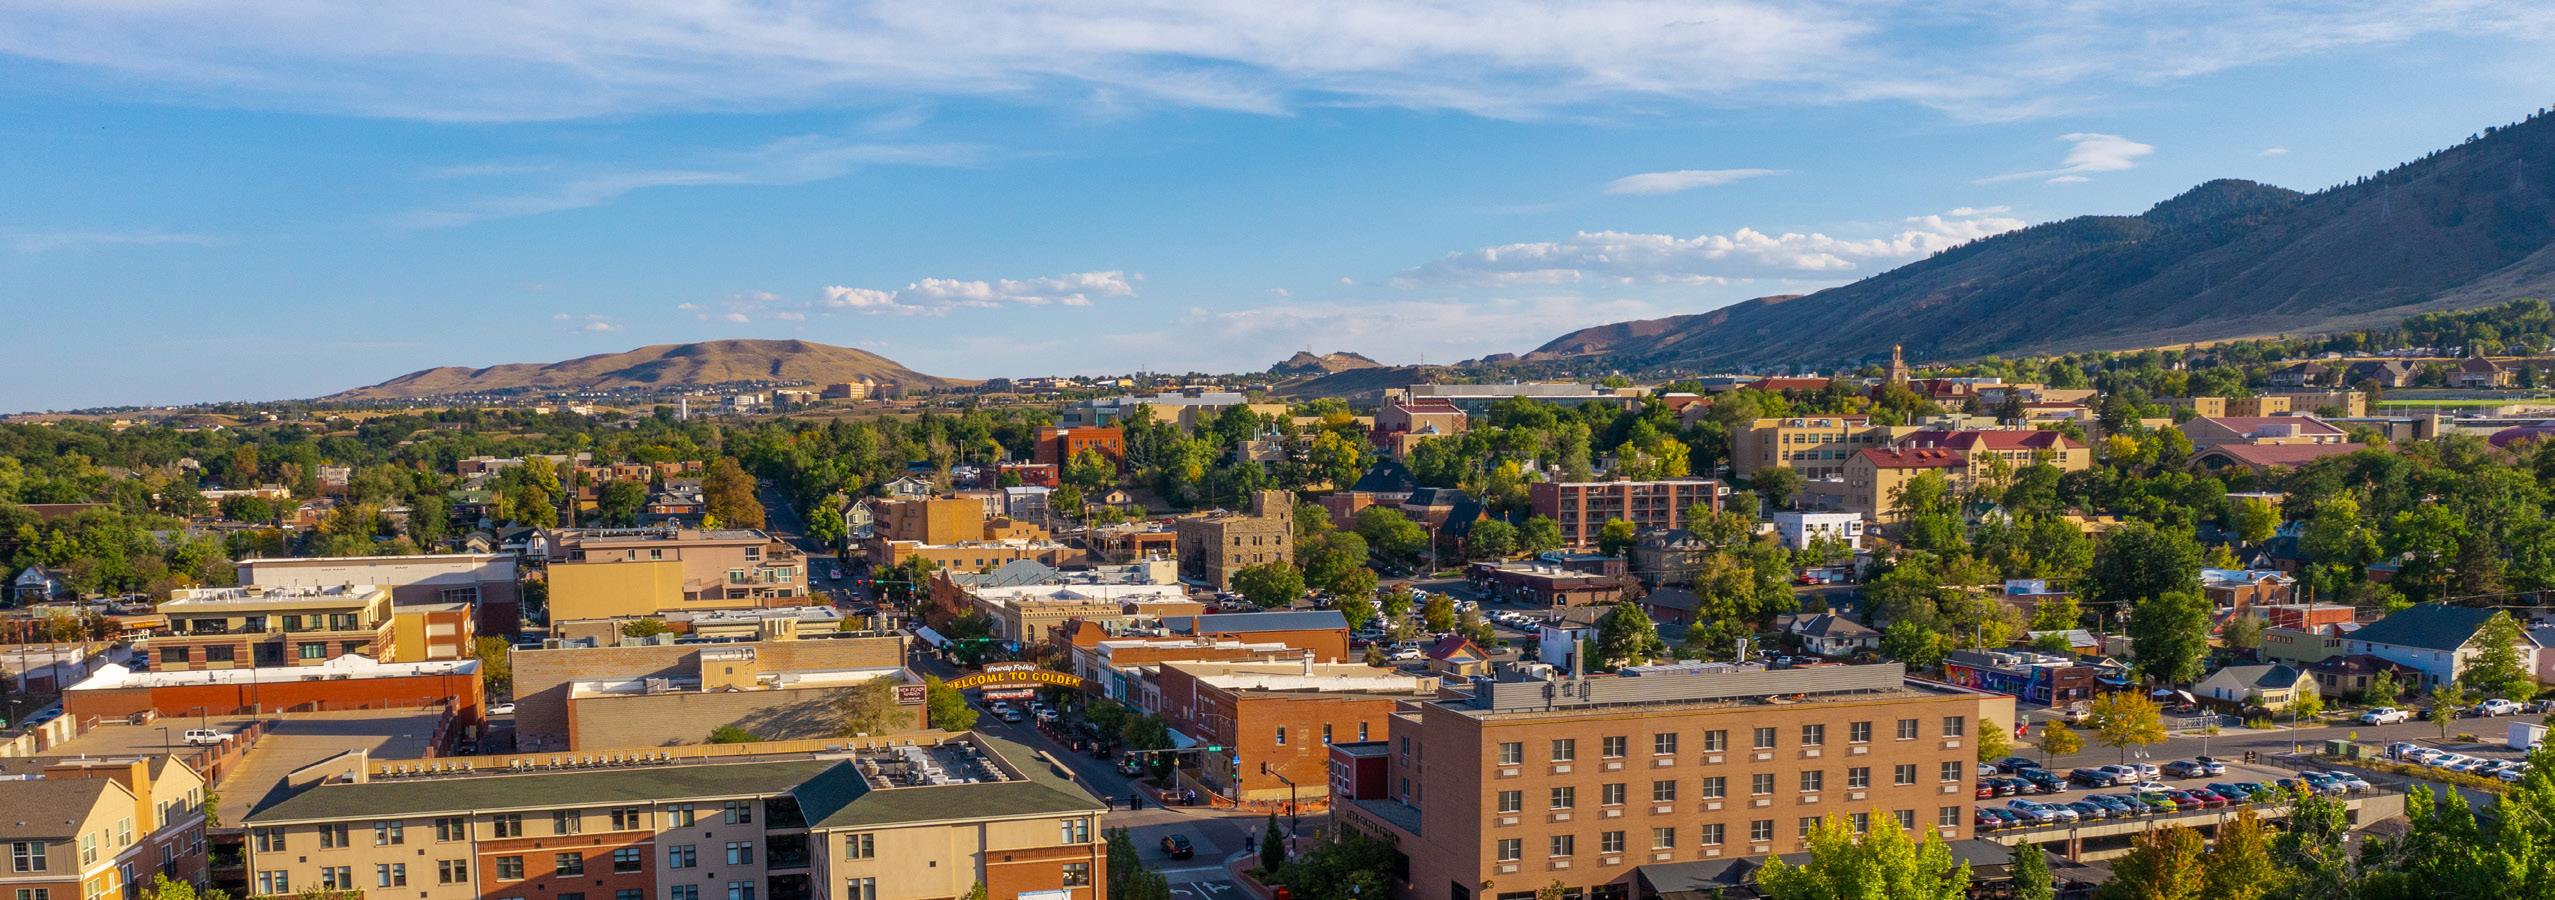
Located in Golden, Lookout Mountain is a 7,377-foot peak providing natural scenery and gorgeous views of both Golden and downtown Denver.
January through March 2022 2023 % Change Average Price $1,015,000 -Average Price Per Square Foot $683
Average Days on Market 3
Highest Price $1,015,000
Properties Sold 1 No Sales% Sold Price to List Price 123.0% -January through March 2022 2023 % Change Average Price $1,319,333 $1,042,500 -21.0% Average Price Per Square Foot $292 $298 2.3% Average Days on Market 5 32 540.0% Highest Price $1,733,000 $1,185,000 -31.6% Properties Sold 3 4 33.3% % Sold Price to List Price 104.4% 96.0% -8.0% January through March 2022 2023 % Change Average Price $964,667 $983,333 1.9% Average Price Per Square Foot $348 $293 -15.9% Average Days on Market 13 47 261.5% Highest Price $1,025,000 $1,350,000 31.7% Properties Sold 3 3 0.0% % Sold Price to List Price 108.3% 94.1% -13.1% LOOKOUT MOUNTAIN HIWAN HILLS HIWAN COUNTRY CLUB
- -
- -
- -
5.7%
The average price per square foot in Ridge at Hiwan increased by 5.7% in the first quarter of 2023 compared to that of 2022.
MT. VERNON COUNTRY CLUB RIDGE AT HIWAN RIVA CHASE January through March 2022 2023 % Change Average Price $1,437,500 $1,670,000 16.2% Average Price Per Square Foot $239 $254 6.5% Average Days on Market 3 105 3400.0% Highest Price $1,510,000 $1,950,000 29.1% Properties Sold 2 2 0.0% % Sold Price to List Price 105.6% 88.4% -16.3% January through March 2022 2023 % Change Average Price $902,500 -Average Price Per Square Foot $547 -Average Days on Market 41 -Highest Price $1,100,000 -Properties Sold 2 No Sales% Sold Price to List Price 104.8% -January through March 2022 2023 % Change Average Price $1,791,000 $1,564,000 -12.7% Average Price Per Square Foot $306 $324 5.7% Average Days on Market 4 35 775.0% Highest Price $2,050,000 $1,725,000 -15.9% Properties Sold 3 3 0.0% % Sold Price to List Price 100.7% 90.4% -10.3%
Shadow Mountain, located in beautiful Conifer, is surrounded by hiking trails and offers residences easy access to Staunton State Park.
59.1%
The average home sale price in Soda Creek increased by 59.1% in the first quarter of 2023 compared to that of 2022.
January through March 2022 2023 % Change Average Price - -Average Price Per Square Foot - -Average Days on Market - -Highest Price - -Properties Sold No Sales No Sales% Sold Price to List Price - -January through March 2022 2023 % Change Average Price $817,500 $1,134,667 38.8% Average Price Per Square Foot $250 $264 5.8% Average Days on Market 2 130 6400.0% Highest Price $960,000 $1,675,000 74.5% Properties Sold 2 3 50.0% % Sold Price to List Price 109.6% 86.1% -21.5% January through March 2022 2023 % Change Average Price $1,285,000 $2,044,692 59.1% Average Price Per Square Foot $203 $385 89.6% Average Days on Market 116 0 -100.0% Highest Price $1,285,000 $2,345,000 82.5% Properties Sold 1 3 200.0% % Sold Price to List Price 85.7% 82.8% -3.4% SPRING RANCH SODA CREEK SHADOW MOUNTAIN
Located in North Evergreen, Tanoa is a gorgeous, masterplanned community with close proximity to local schools and Evergreen’s best amenities, including popular restaurants, retail stores, and Elk Meadow Open Space Park.
TANOA January through March 2022 2023 % Change Average Price - -Average Price Per Square Foot - -Average Days on Market - -Highest Price - -Properties Sold No Sales No Sales% Sold Price to List Price - -January through March 2022 2023 % Change Average Price $3,900,000 $2,900,000 -25.6% Average Price Per Square Foot $450 $441 -2.1% Average Days on Market 4 36 800.0% Highest Price $3,900,000 $2,900,000 -25.6% Properties Sold 1 1 0.0% % Sold Price to List Price 100.0% 100.0% 0.0% UPPER BEAR CREEK
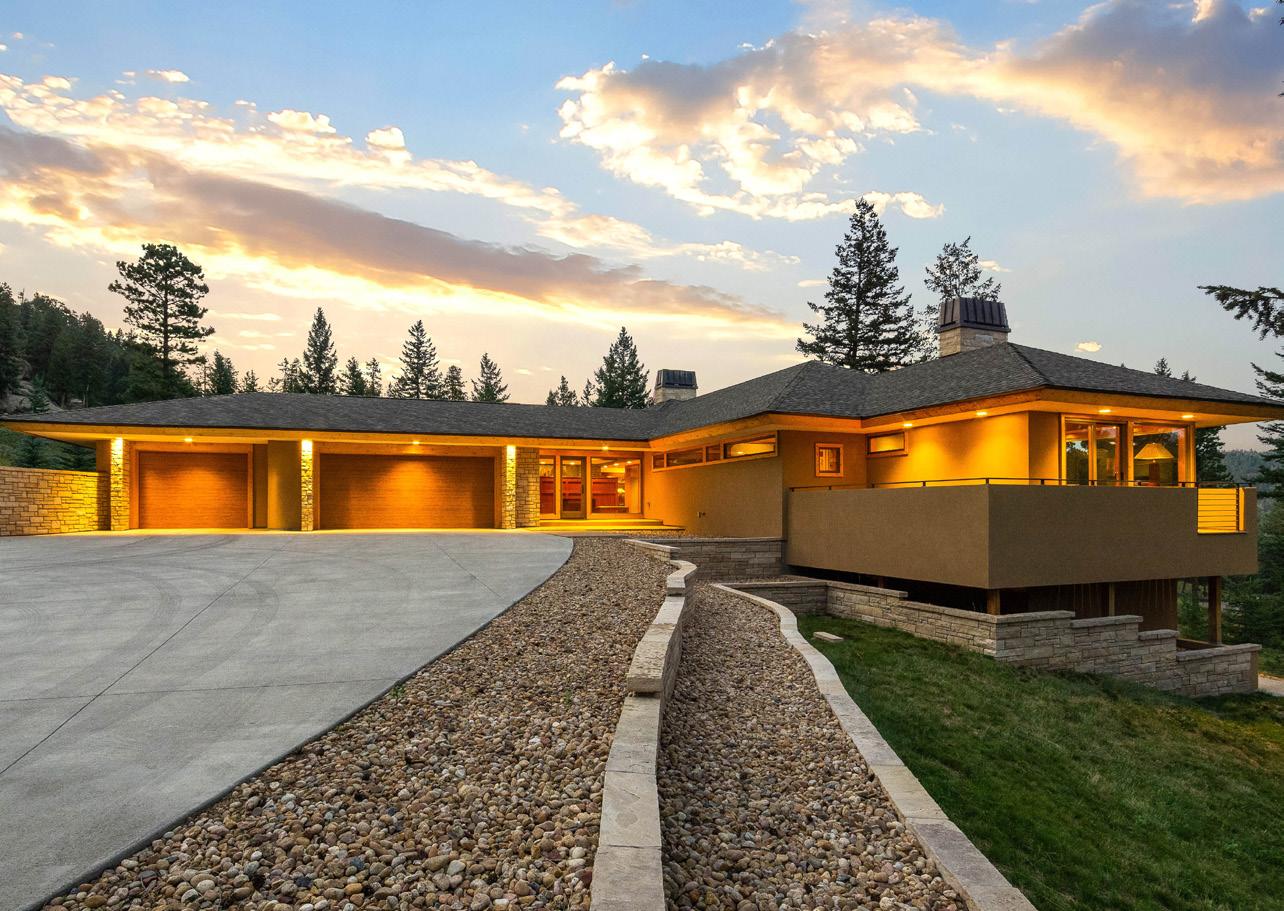
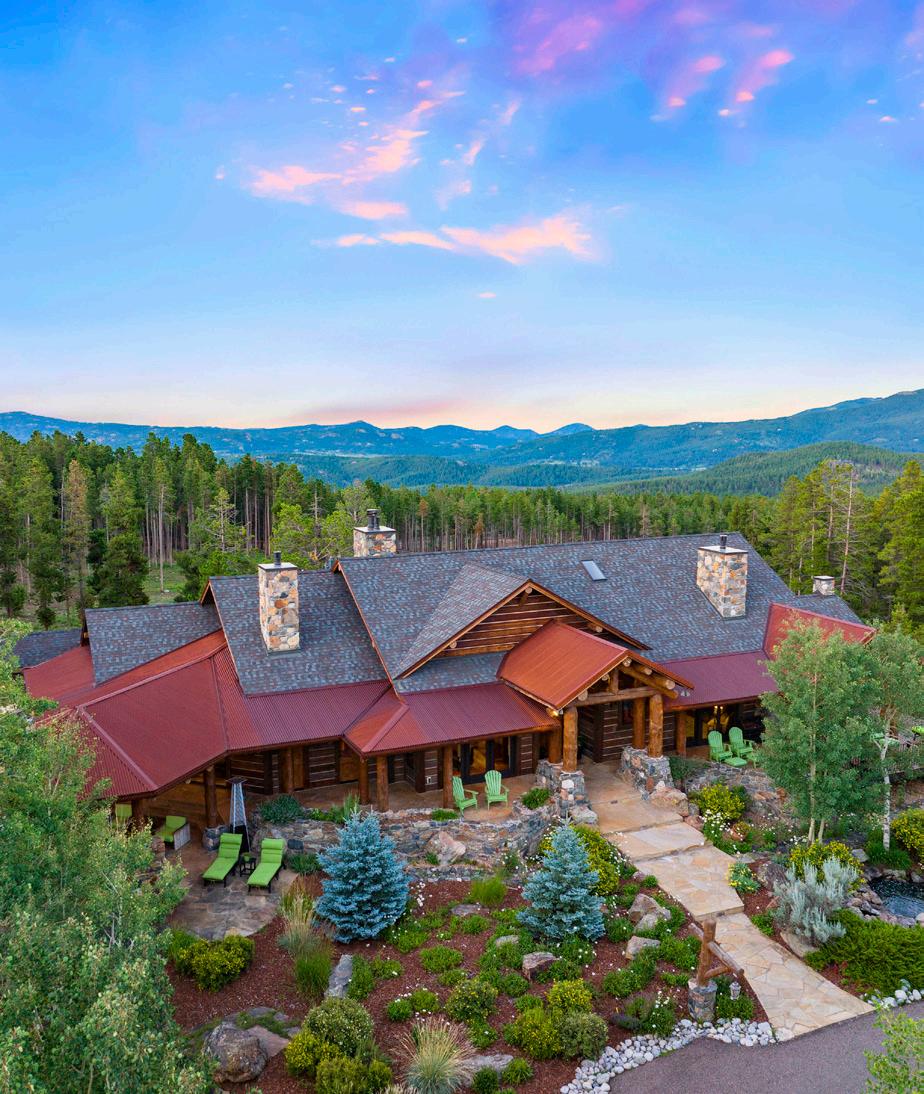
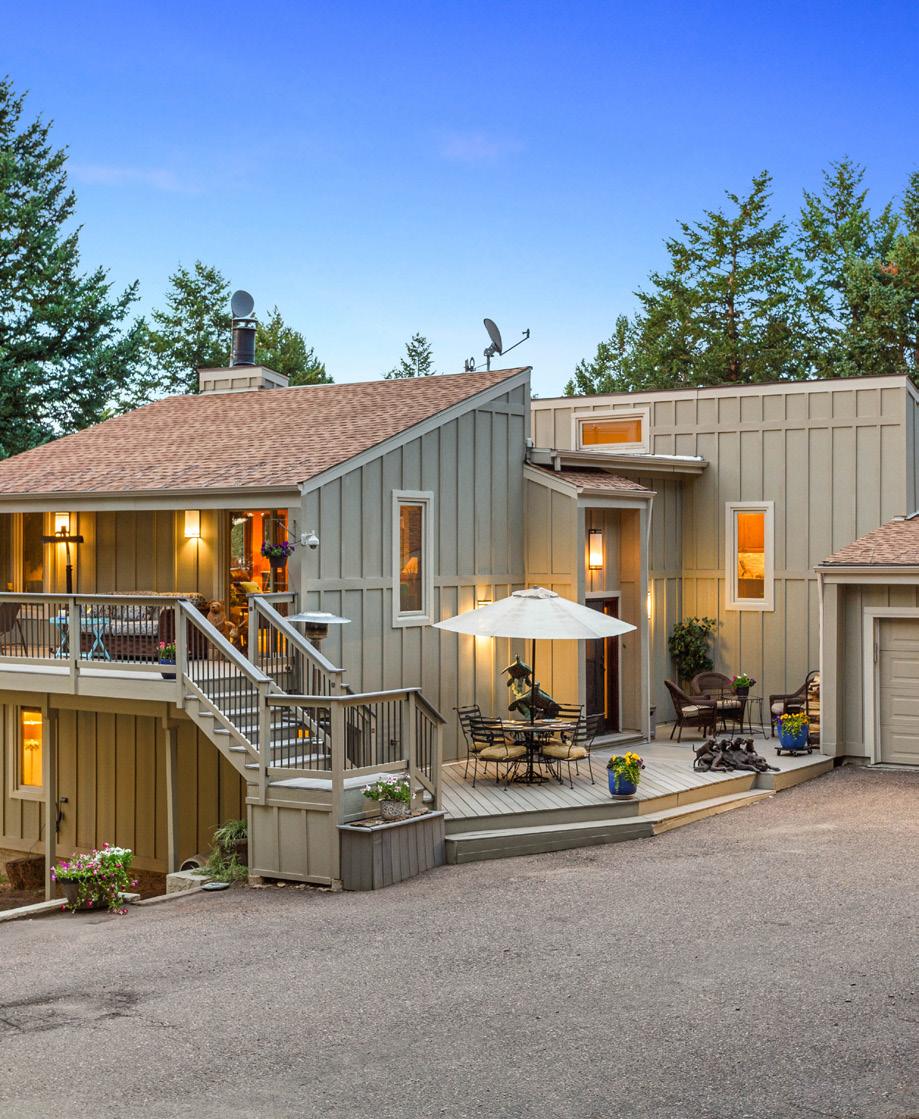
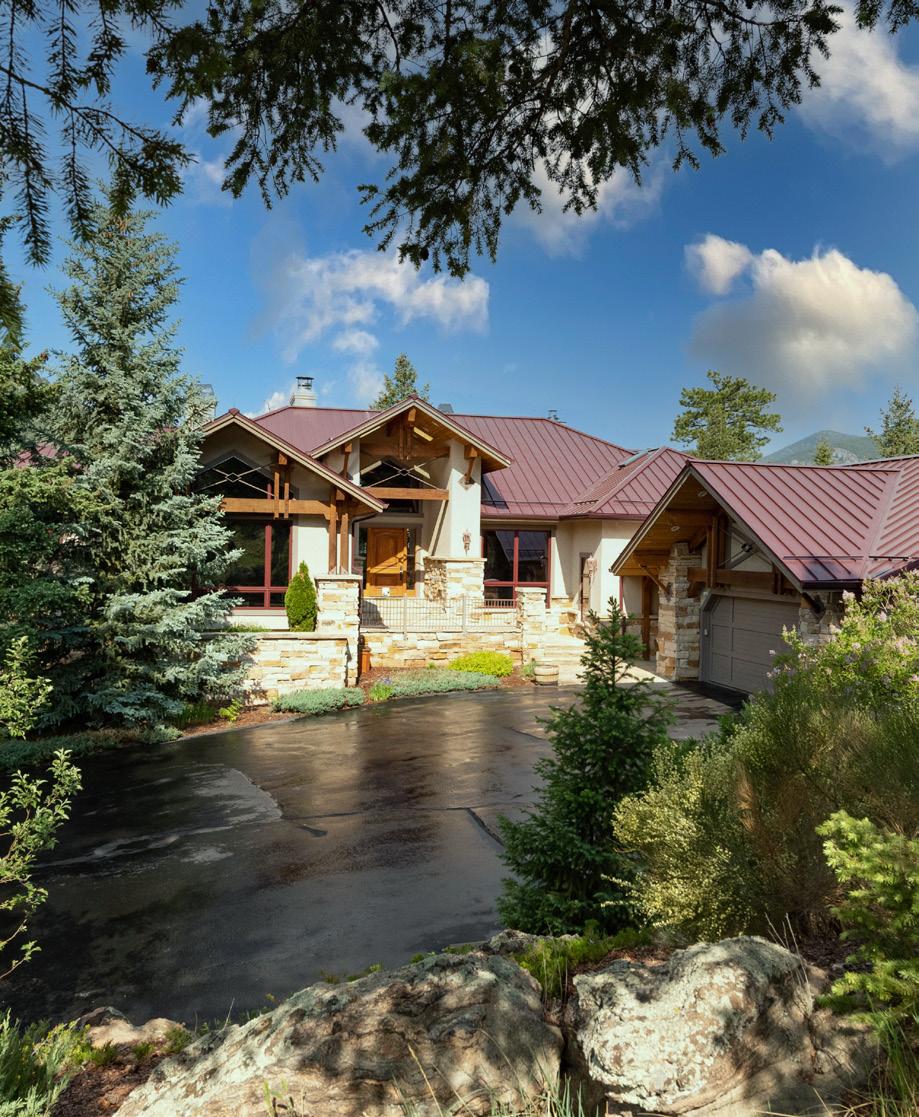
among the trees The definition of paradise depends on your point of view. Find a home that makes each day more extraordinary than the last with LIV Sotheby’s International Realty. 303.674.3200 | livsothebysrealty.com
MICRO MARKET REPORT | Foothills JANUARY - MARCH 2023 • COLORADOMICROREPORTS.COM