Micro Market Report


QUARTER 3 2022
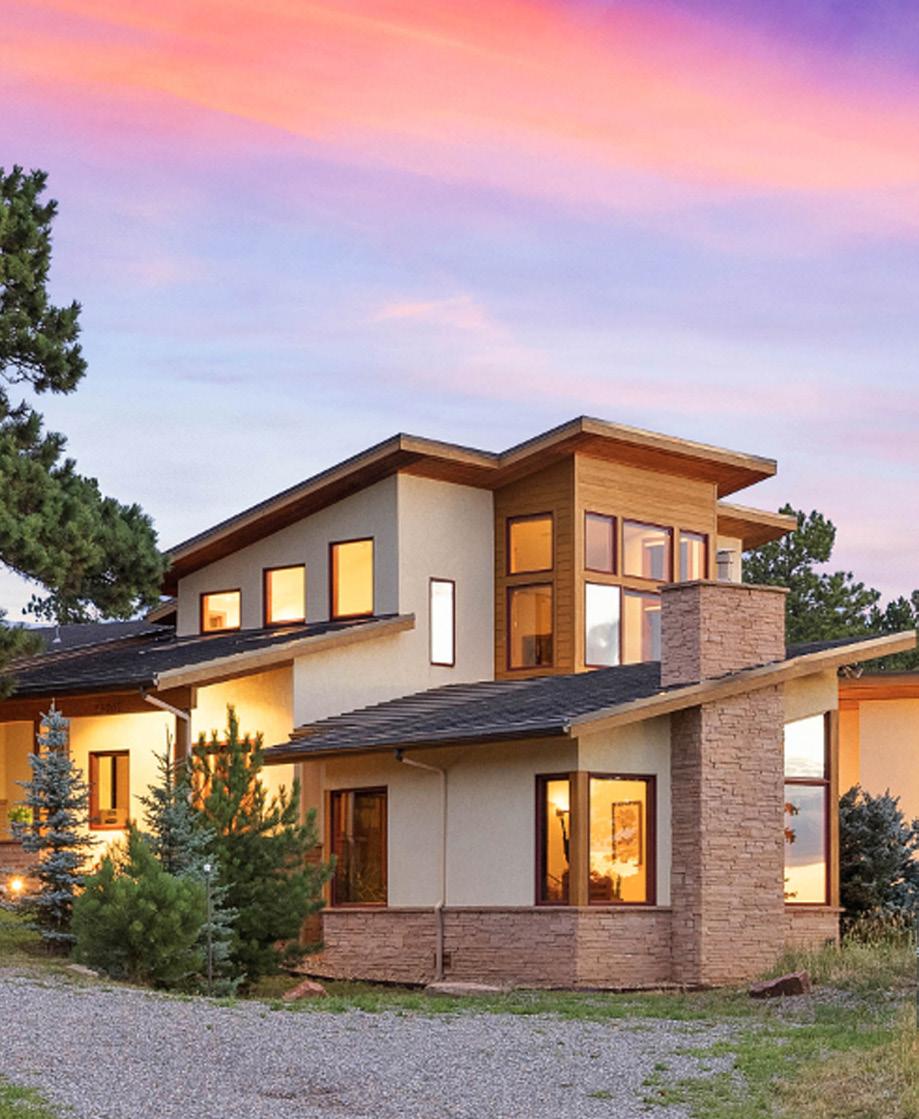
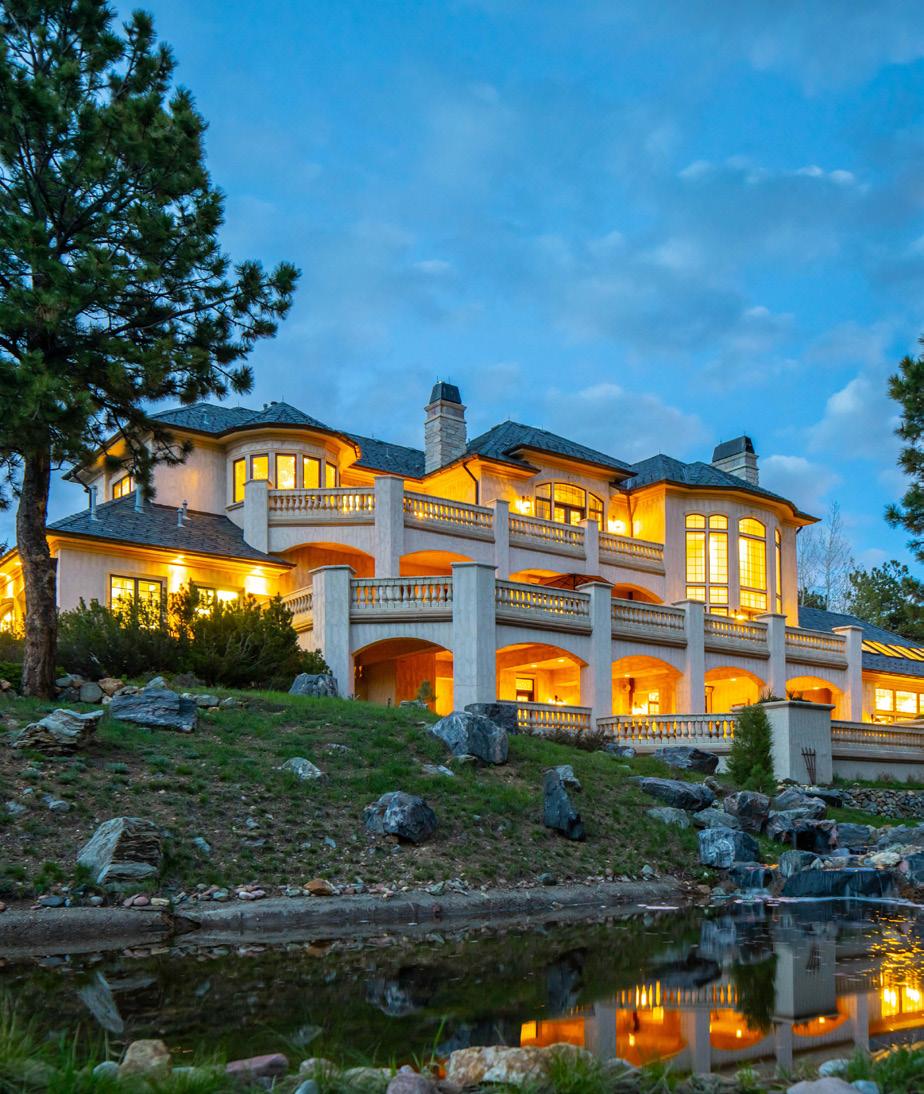
FOOTHILLS 1090 Twisted Pine Road 9141 Mountain Ranch Road

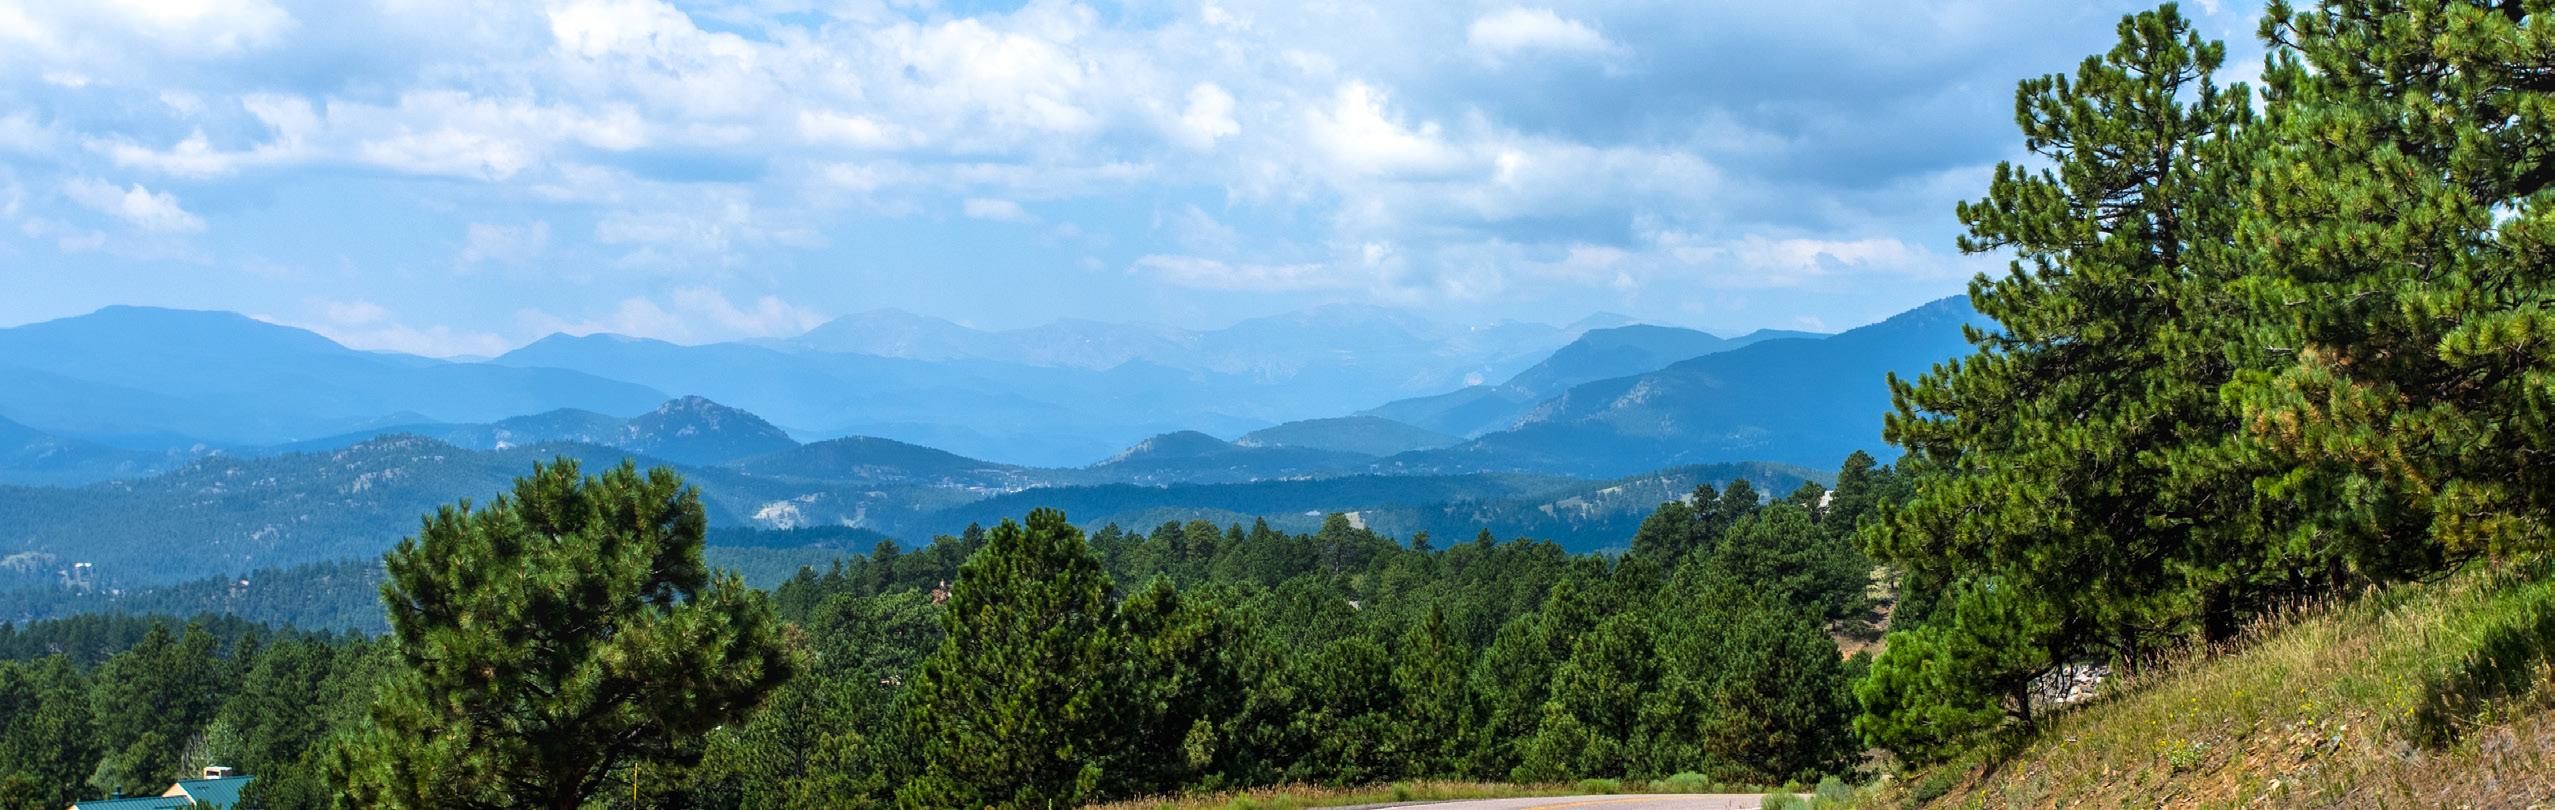
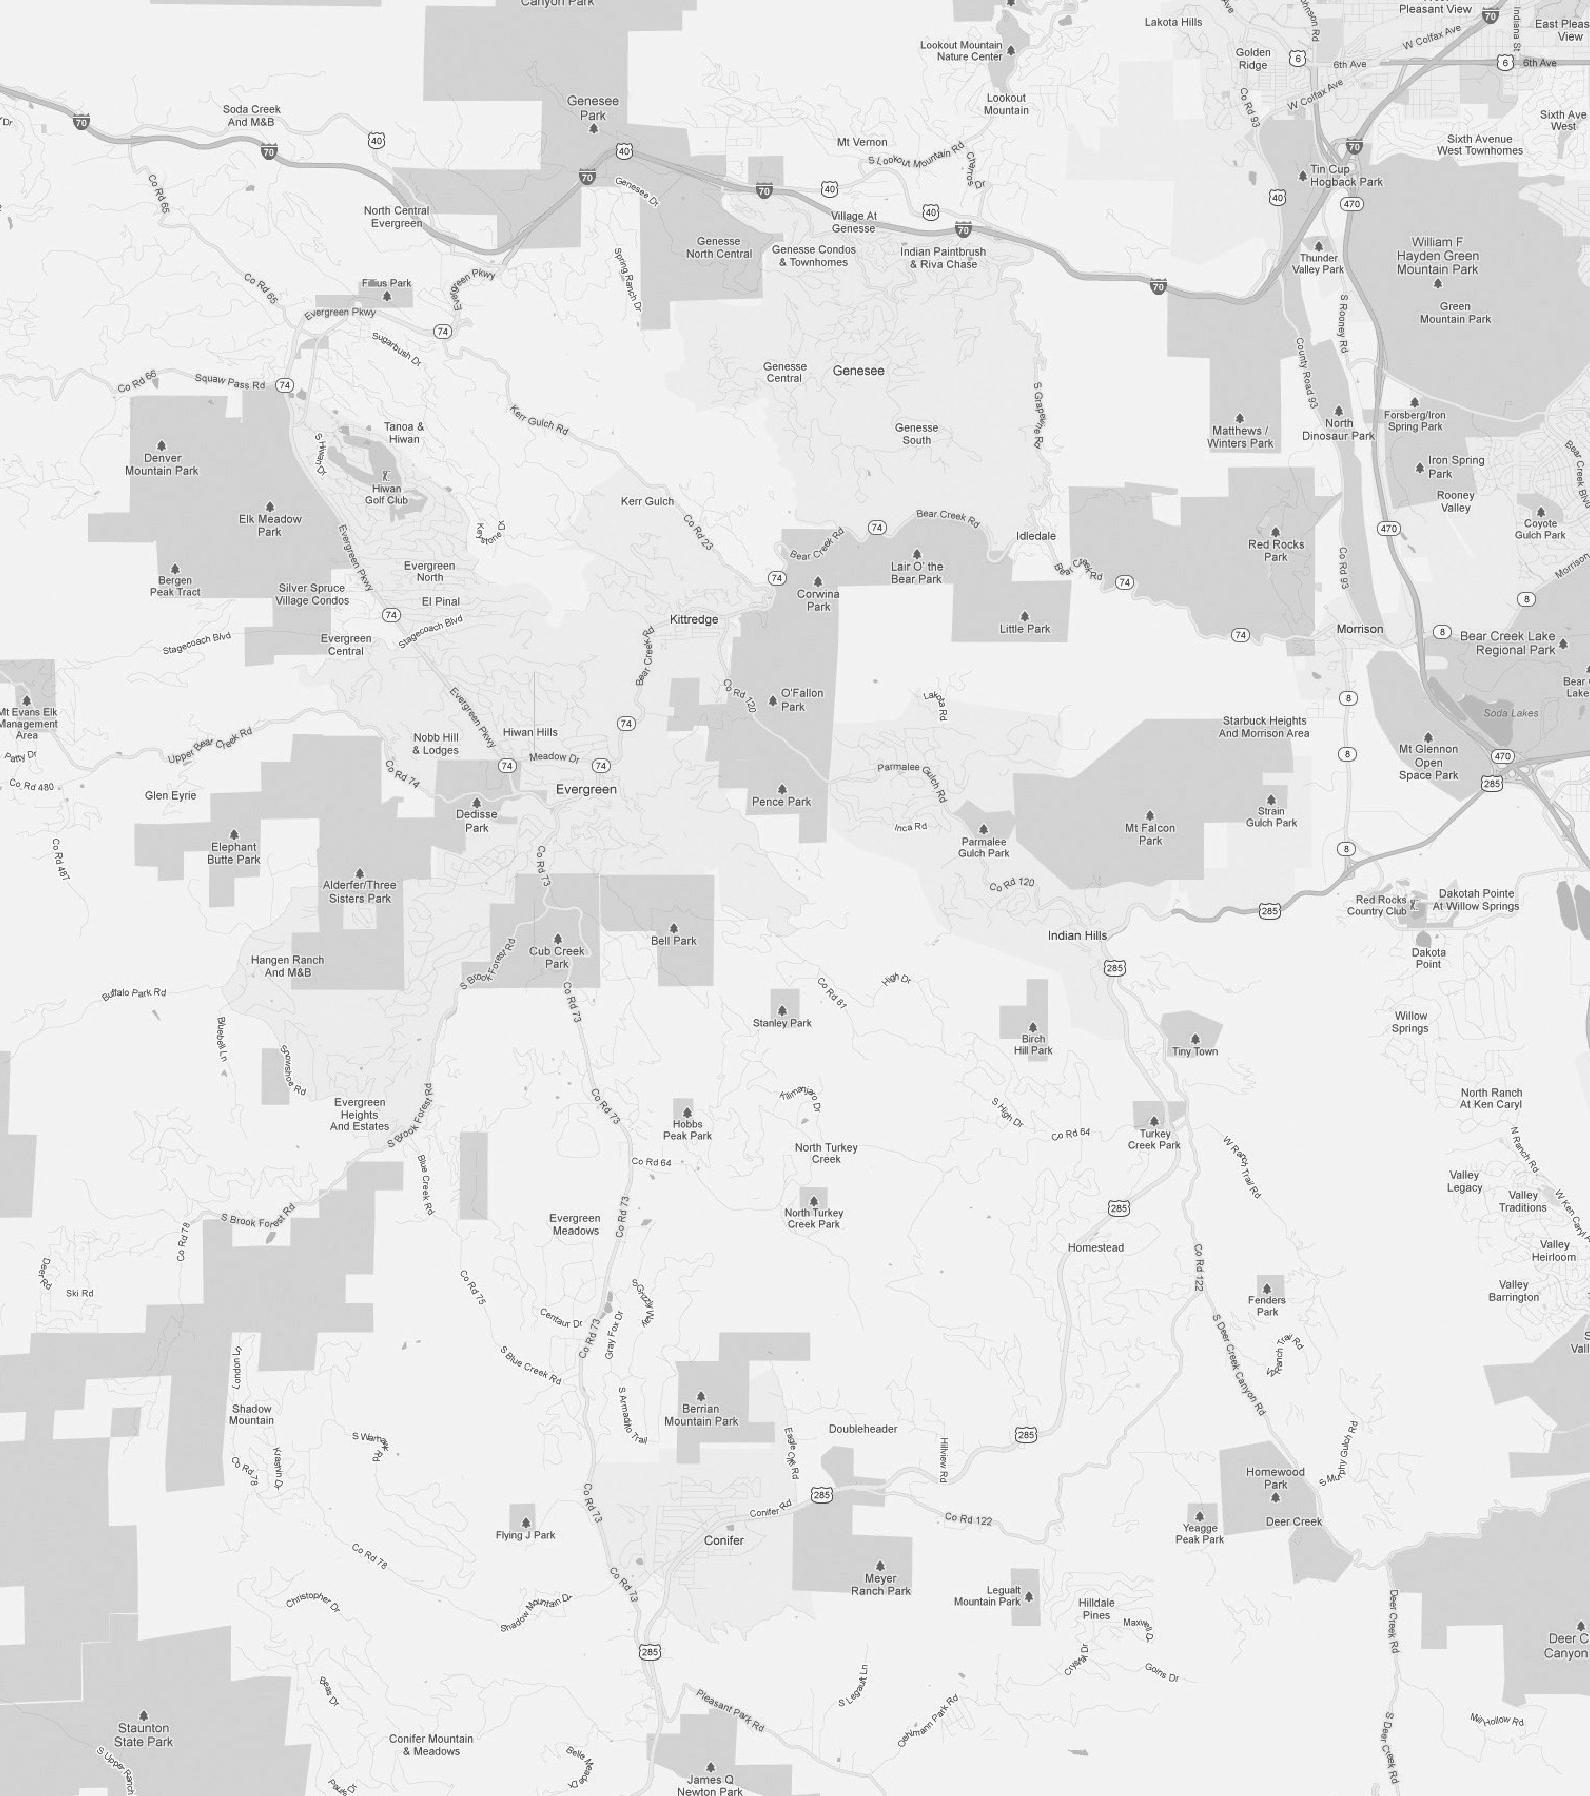
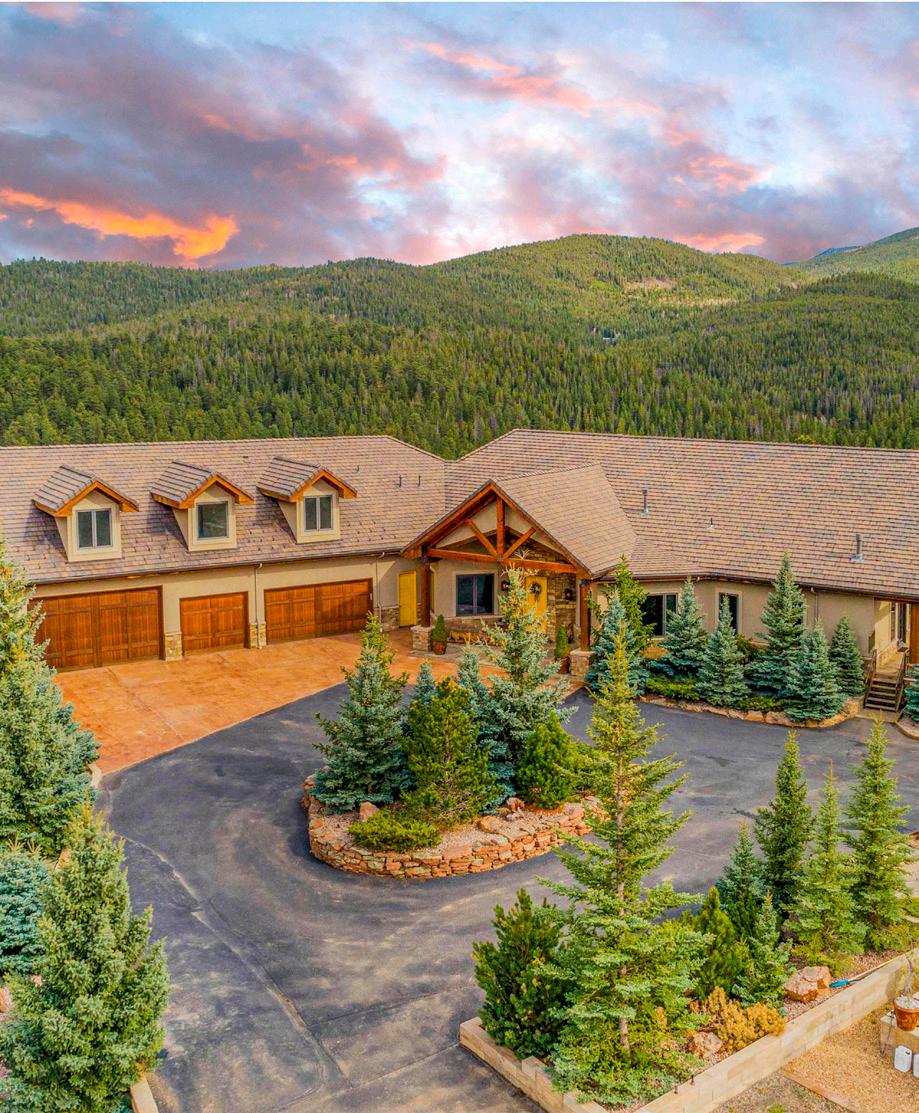
The Foothills is a special community comprised of neighborhoods ranging from quaint to captivating, breathtaking natural beauty, and a balance of amenities and open space that is hard to find anywhere else. Positioned along the west corridor within Jefferson County, this collection of neighborhoods including beloved areas such as Genesee, Hiwan Hills, and Lookout Mountain, offer more seclusion and privacy than neighborhoods close to the city. This treasured community continues to be an area that buyers want to call “home.”
LIV Sotheby’s International Realty produced a Q3 Micro Market Report comparing real estate data from the Foothills from January through September of 2022 compared to the same time frame in 2021. Homes in this area appreciated by 14.1%, increasing the average price for all property types from $617,671 through Q3 of 2021 to $704,787 during Q3 of 2022. This increase in average sale price boosted the total dollar volume sold in Jefferson County by 0.4%, bringing the total to $5,440,250,802.
Overall, the number of homes sold in the Foothills dipped slightly (-5.6%) in comparison to the tremendous growth that was seen during the real estate boom of 2020 and 2021. As the market returns to typical seasonal trends, this small decrease is a sign that while the market is still very active, the rate at which it is growing has slowed – creating more opportunities for buyers and sellers.
Looking at average sale prices of homes, select neighborhoods experienced positive appreciation through September of this year compared to the same period in 2021. In Bear Mountain, home prices rose by 25.7% to reach an average sale price of $1,583,751. Shadow Mountain offered the most affordability to homebuyers through Q3 with the sale price coming
to $736,222. The Soda Creek neighborhood saw the most expensive sale so far this year for the Foothills community. The impressive $4,598,500 sale shows that luxury homes in the area are still in high demand.
While the average time spent on the market for all of Jefferson County was just 13 days, several Foothills neighborhoods experience much quicker market speeds through the first nine months of the year. In Lookout Mountain, homes spent an average of four days on the market. For buyers looking for a more relaxed market, Genesee and Mt. Vernon Country Club homes sold at a more leisurely pace. Homes in these communities remained on the market for 20 and 24 days respectively.
With bountiful natural beauty, captivating vistas, and communities that cater to those looking for a mix of mountain living, luxury lifestyles, and everything in between, the Foothills are a wonderful place to call home.
January through September
New Listings 10,226 9,657 -5.6%
Sold Listings (All Properties) 8,773 7,710 -12.1%
Average Price (All Properties) $617,671 $704,787 14.1%
Average Price (Single Family) $704,441 $805,503 14.3%
Average Days on Market 11 13 18.2%
% Sold Price to Original List Price 103.3% 101.7% -1.5%
Total Dollar Volume Sold $5,418,832,065 $5,440,250,802 0.4%
Based on Information from REColorado for the period January 1st, 2022 - September 30th, 2022. This representation is based in whole or in part on data supplied by REColorado. REColorado does not guarantee nor is in any way responsible for its accuracy. Data maintained by REColorado may not reflect all real estate activity in the market.
Bear Mountain, perched at 8,629 feet in elevation on the eastern side of Evergreen, provides residents with the quintessential Colorado lifestyle experience. This serene community is located approximately 35 minutes west of Denver.
The average home sale price in Brook Forest increased by 20.4% January through September 2022 compared to that of 2021.
2022 % Change
Average Price $1,260,333 $1,583,751 25.7%
Average Price Per Square Foot $339 $420 23.9%
Average Days on Market 34 30 -11.8%
Highest Price $2,825,000 $2,900,000 2.7%
Properties Sold 12 8 -33.3%
% Sold Price to List Price 101.4% 99.1% -2.2%
2022 % Change
Average Price $589,586 $709,928 20.4%
Average Price Per Square Foot $380 $381 0.2%
Average Days on Market 10 11 10.0%
Highest Price $1,050,000 $1,400,000 33.3%
Properties Sold 29 18 -37.9%
% Sold Price to List Price 103.4% 99.6% -3.7%
January through September 2021 2022 % Change
Average Price $774,650 $900,659 16.3%
Average Price Per Square Foot $294 $334 13.6%
Average Days on Market 9 6 -33.3%
Highest Price $1,360,000 $1,260,000 -7.4%
Properties Sold 16 17 6.3%
% Sold Price to List Price 104.6% 104.2% -0.3%
Average
Average
The average number of days on market in Evergreen Highlands decreased by 28.6% January through September 2022 compared to that of 2021.
Evergreen Meadows West is located down the road from Flying J Ranch and Arapahoe National Forest. Just 15 minutes from downtown Evergreen, here you can find quiet home sites on two-plus acres, as well as gorgeous views and a convenient location.
Evergreen Park Estates is a quiet area with most homesites between one to two acres. This area is located conveniently close to Alderfer/Three Sisters Park and is about 10 minutes to local shopping.
The average home sale price in Hangen Ranch increased by 27.8% January through September 2022 compared to that of 2021.
2022 % Change
Average Price $730,500 $1,077,980 47.6%
Average Price Per Square Foot $345 $389 12.7%
Average Days on Market 8 37 362.5%
Highest Price $860,000 $1,088,980 26.6%
Properties Sold 8 5 -37.5%
% Sold Price to List Price 107.8% 106.5% -1.2%
2022 % Change
Average Price $1,305,247 $1,603,608 22.9%
Average Price Per Square Foot $317 $353 11.5%
Average Days on Market 14 20 42.9%
Highest Price $2,200,000 $2,655,000 20.7%
Properties Sold 41 24 -41.5%
% Sold Price to List Price 101.8% 98.2% -3.5%
2021 2022 % Change
Average Price $1,506,181 $1,925,000 27.8%
Average Price Per Square Foot $415 $497 19.8%
Average Days on Market 11 15 36.4%
Highest Price $1,922,222 $2,125,000 10.5%
Properties Sold 4 3 -25.0%
% Sold Price to List Price 103.3% 102.1% -1.2%
Average Price
Average Price Per
Average Days
Highest Price
Price to
Average Price $974,134
Average Price Per Square Foot
Days on Market
Highest Price $1,386,850
Sold
% Sold Price to List Price
Average Price
Average Price Per
Average Days
Highest Price
Price to
-1.7%
Hiwan Hills is a community located near the heart of Evergreen. Here you can find a mix of older homes and remodels on private, one+ acre lots. Hiwan Hills is known for having beautiful views and natural landscape, with some home sites featuring stunning views of Mt. Evans.
The average number of days on market in Lookout Mountain decreased by 82.6% in the first half of 2022 compared to that of 2021.
January through September

The average price per square foot in Ridge at Hiwan increased by 16.2% January through September 2022 compared to that of 2021.
% Change
Average Price $857,050 $863,750 0.8%
Average Price Per Square Foot $274 $400 45.9%
Average Days on Market
24 140.0%
Highest Price $1,044,500 $1,100,000 5.3%
Properties Sold
0.0%
% Sold Price to List Price 102.5% 101.4% -1.1%
January through September
% Change
Average Price $1,507,148 $1,676,562 11.2%
Average Price Per Square Foot $287 $334 16.2%
Average Days on Market
17 88.9%
Highest Price $2,600,000 $2,050,000 -21.2%
Properties Sold 21 20 -4.8%
% Sold Price to List Price 103.0% 98.7% -4.2%
% Change
Average Price $1,455,000 $1,356,667 -6.8%
Average Price Per Square Foot $218 $272 25.1%
Average Days on Market
4 -96.4%
Highest Price $1,850,000 $1,510,000 -18.4%
Properties Sold
3 0.0%
% Sold Price to List Price 97.8% 104.2% 6.5%
Average Price
Average Price Per Square Foot
Average Days on Market
Highest Price
Sold
% Sold Price to List Price
January through
Average Price $2,003,693 $2,337,611
Average Price Per Square Foot $349
Average Days on Market
2.9%
-3.1%
Highest Price $4,775,150 $4,598,500 -3.7%
Sold
% Sold Price to List Price 96.0%
-43.8%
0.5%
Shadow Mountain, located in beautiful Conifer, is surrounded by hiking trails and offers residences easy access to Staunton State Park.
The average home price in Soda Creek increased by 16.7% January through September 2022 compared to that of 2021.
Average Price $2,130,000
Average Price Per Square Foot
Average Days on Market
Highest Price
% Sold Price to
Price
-41.7%
-75.0%
Located in North Evergreen, Tanoa is a gorgeous, masterplanned community with close proximity to local schools and Evergreen’s best amenities, including popular restaurants, retail stores, and Elk Meadow Open Space Park.
Average Price $1,094,000 $1,120,000 2.4%
Average Price Per Square Foot $260 $298 14.7%
Average Days on Market 13 4 -69.2%
Highest Price $1,600,000 $1,120,000 -30.0%
Properties Sold 5 1 -80.0%
% Sold Price to List Price 102.5% 106.7% 4.0%
Average Price $1,516,250 $2,365,817 56.0%
Average Price Per Square Foot $392 $416 6.0%
Average Days on Market 33 10 -69.7%
Highest Price $2,970,000 $3,900,000 31.3%
Properties Sold 8 6 -25.0%
% Sold Price to List Price 97.9% 98.1% 0.2%
January through September 2021 2022 % Change
MICRO MARKET REPORT | Foothills
JANUARY SEPTEMBER 2022 • COLORADOMICROREPORTS.COM