Micro Market Report
YEAR-END 2022
FOOTHILLS
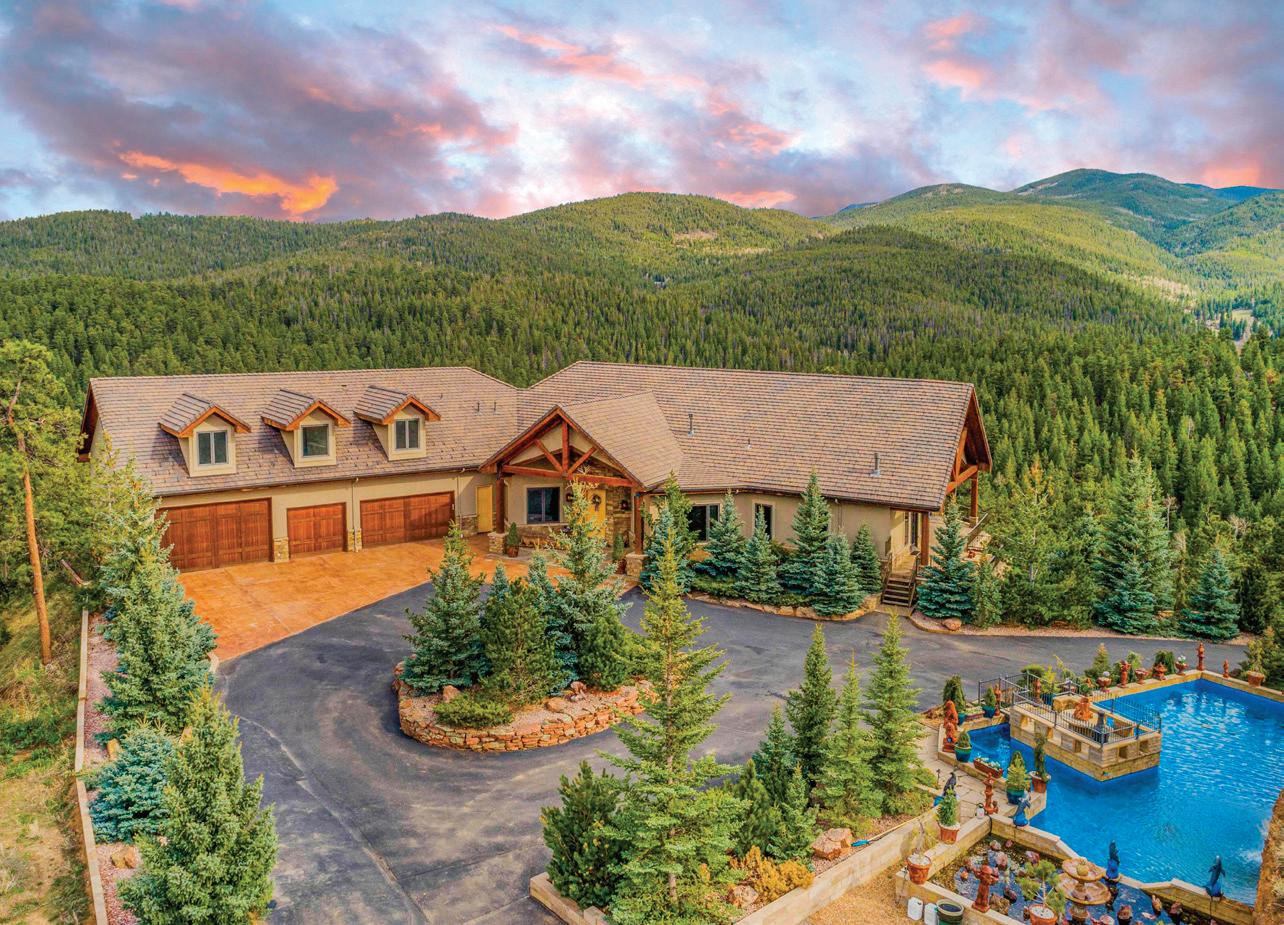
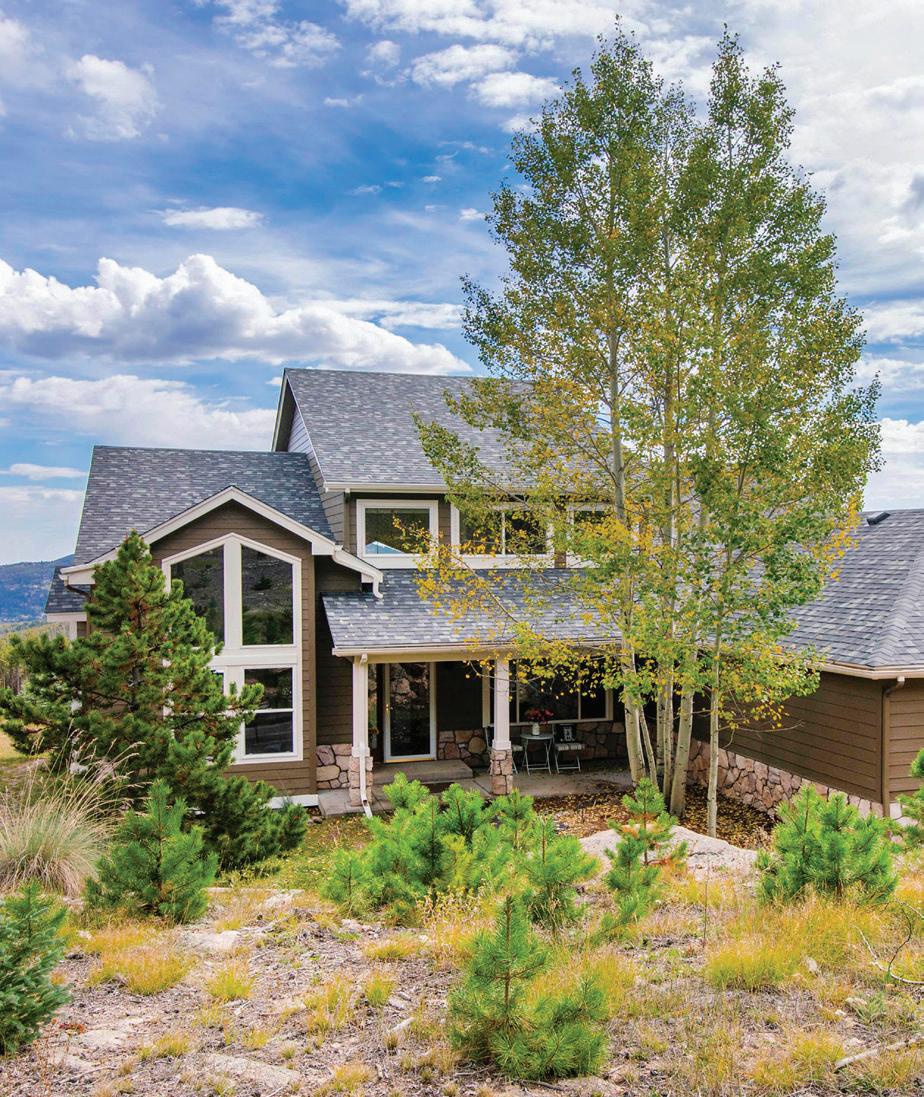
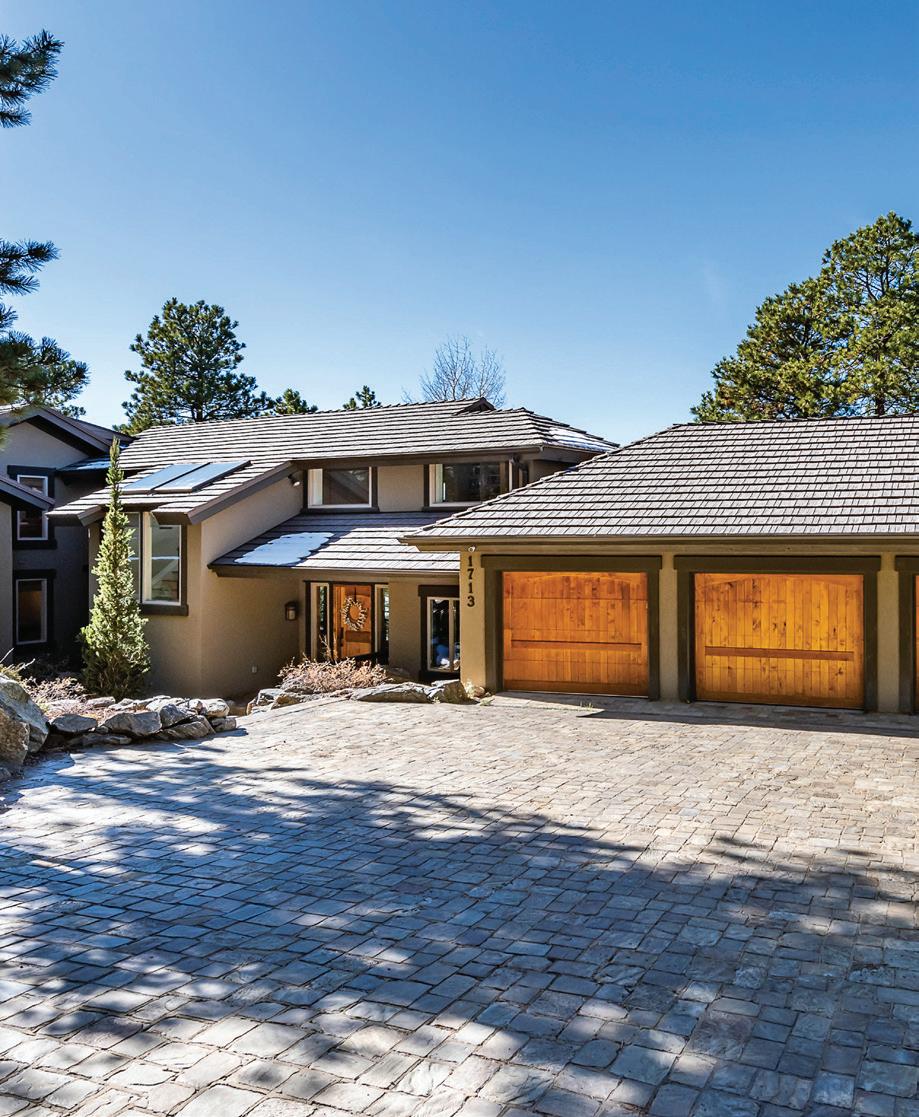
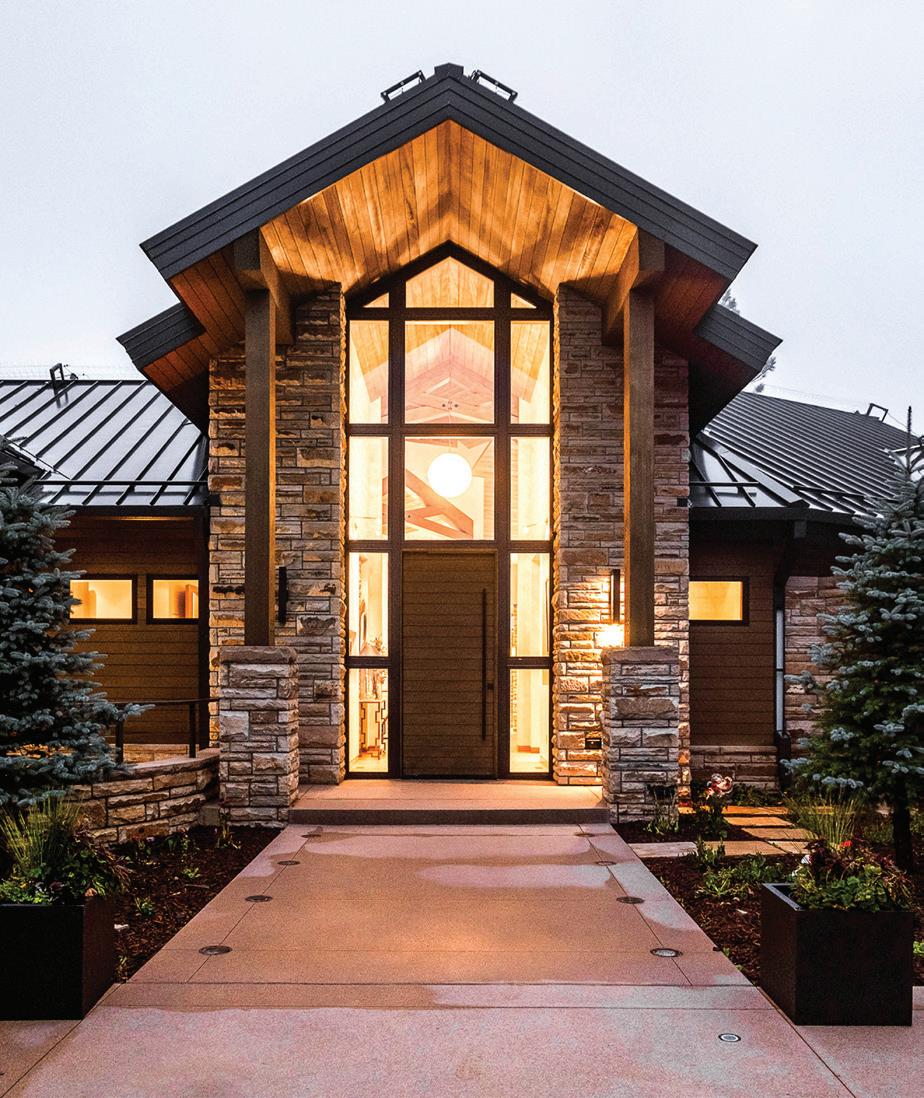
4128 Wild Flower Court
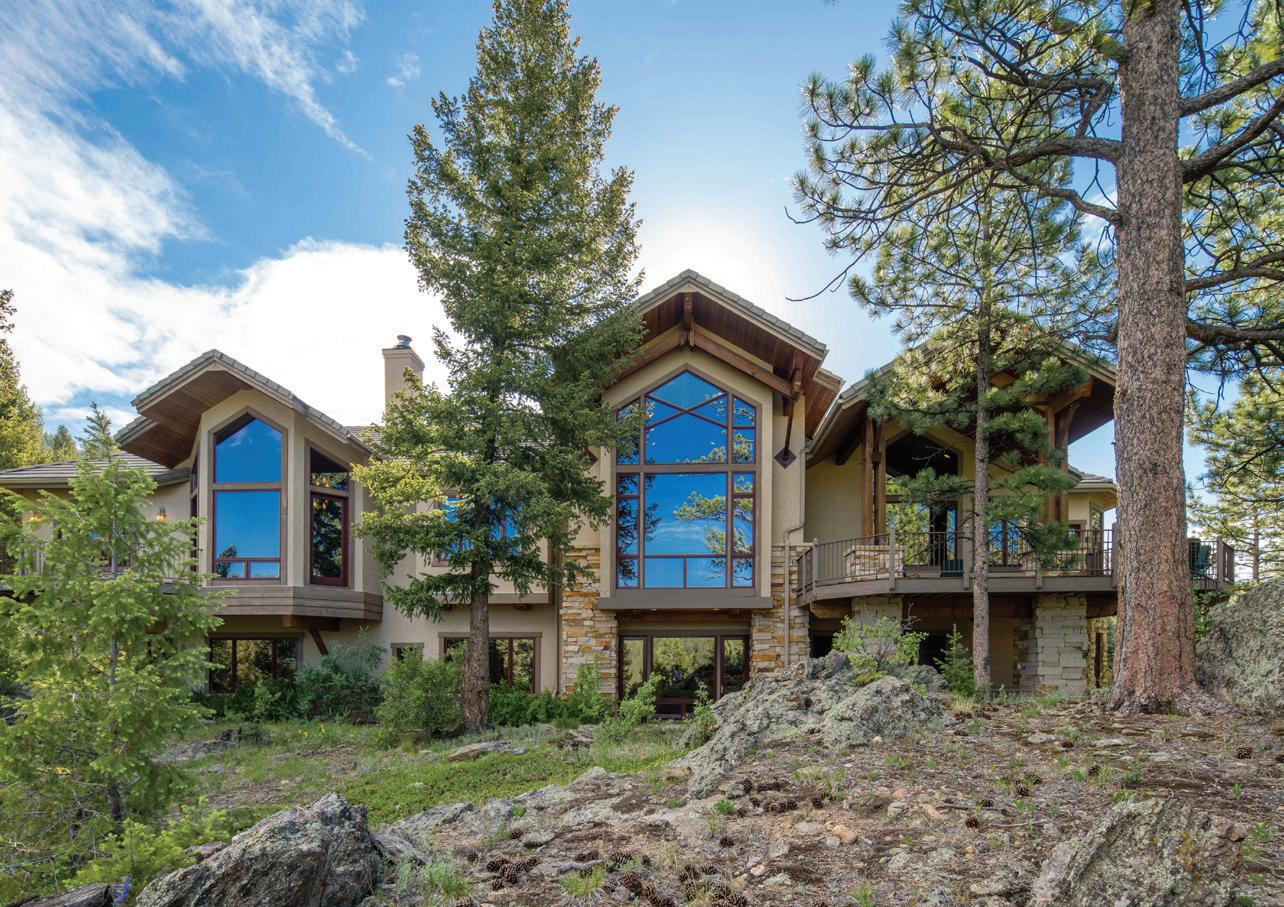
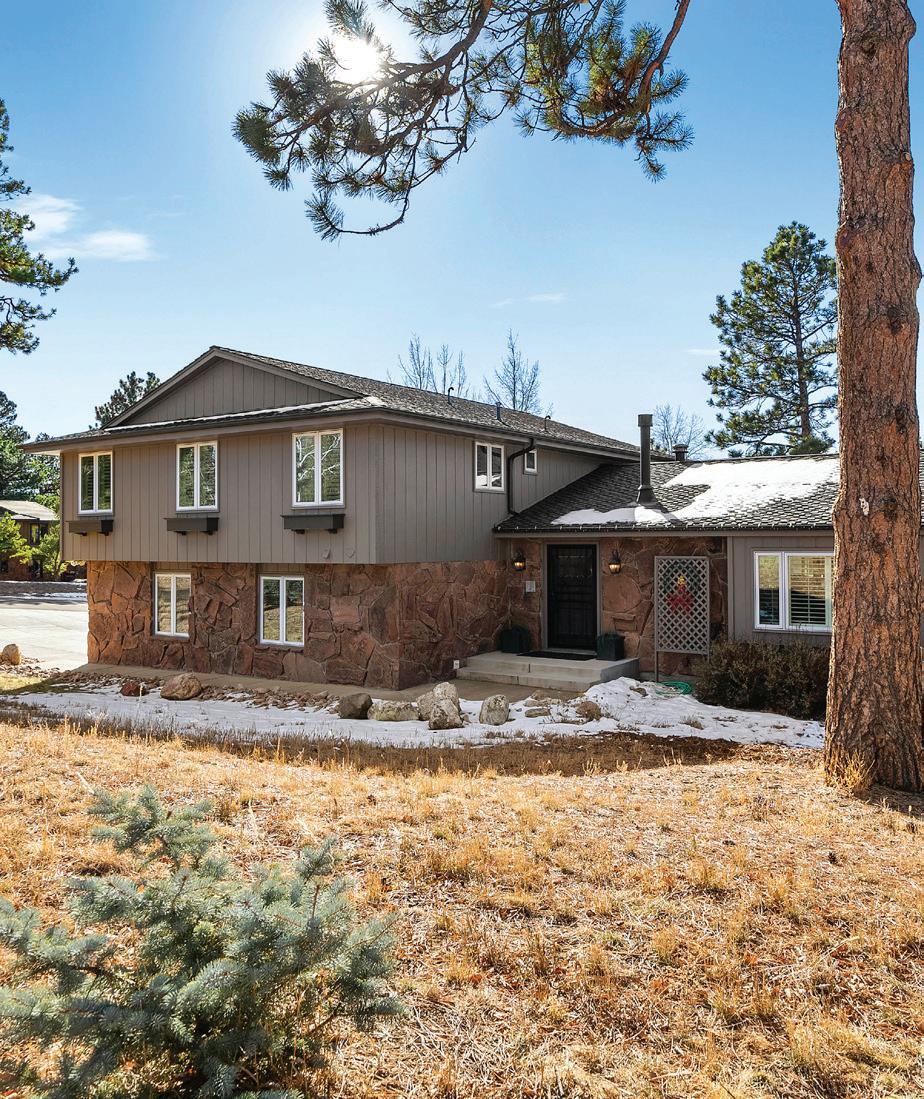
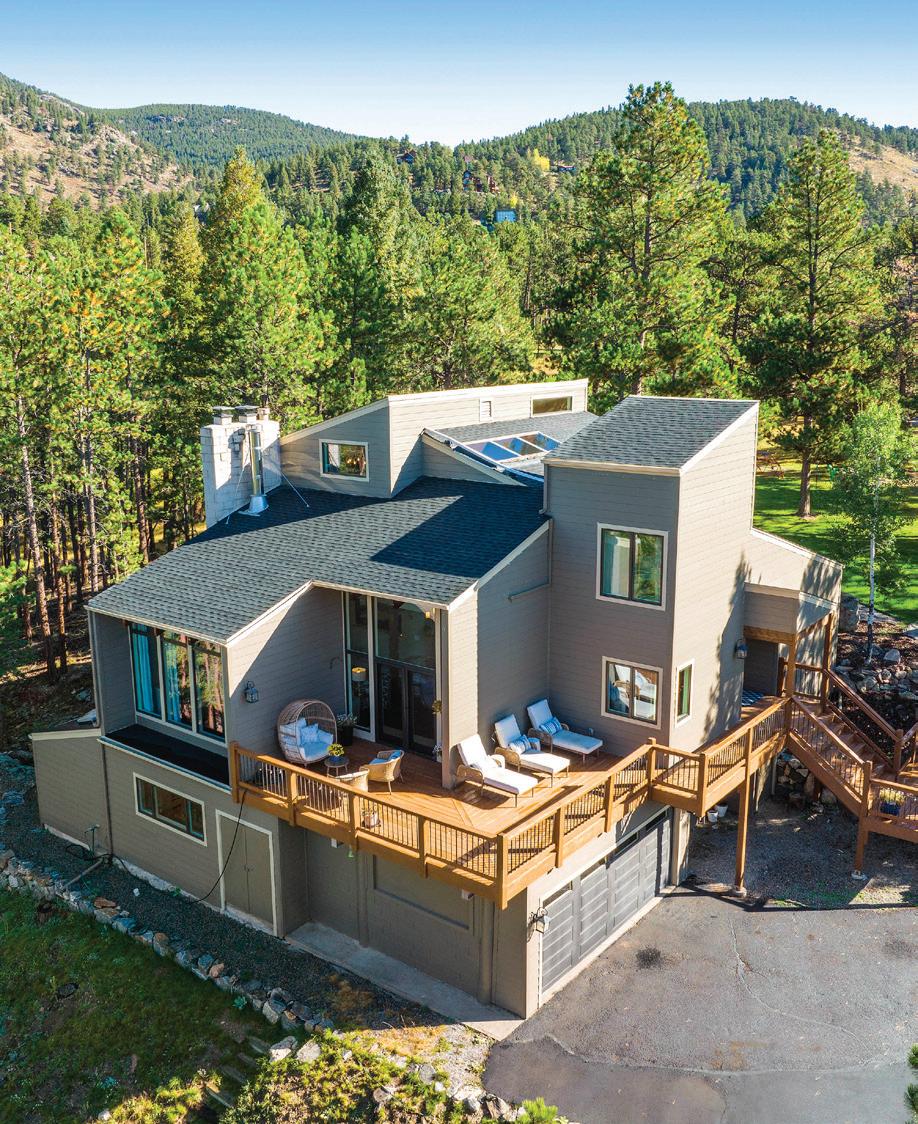
577 Bear Meadow Trail
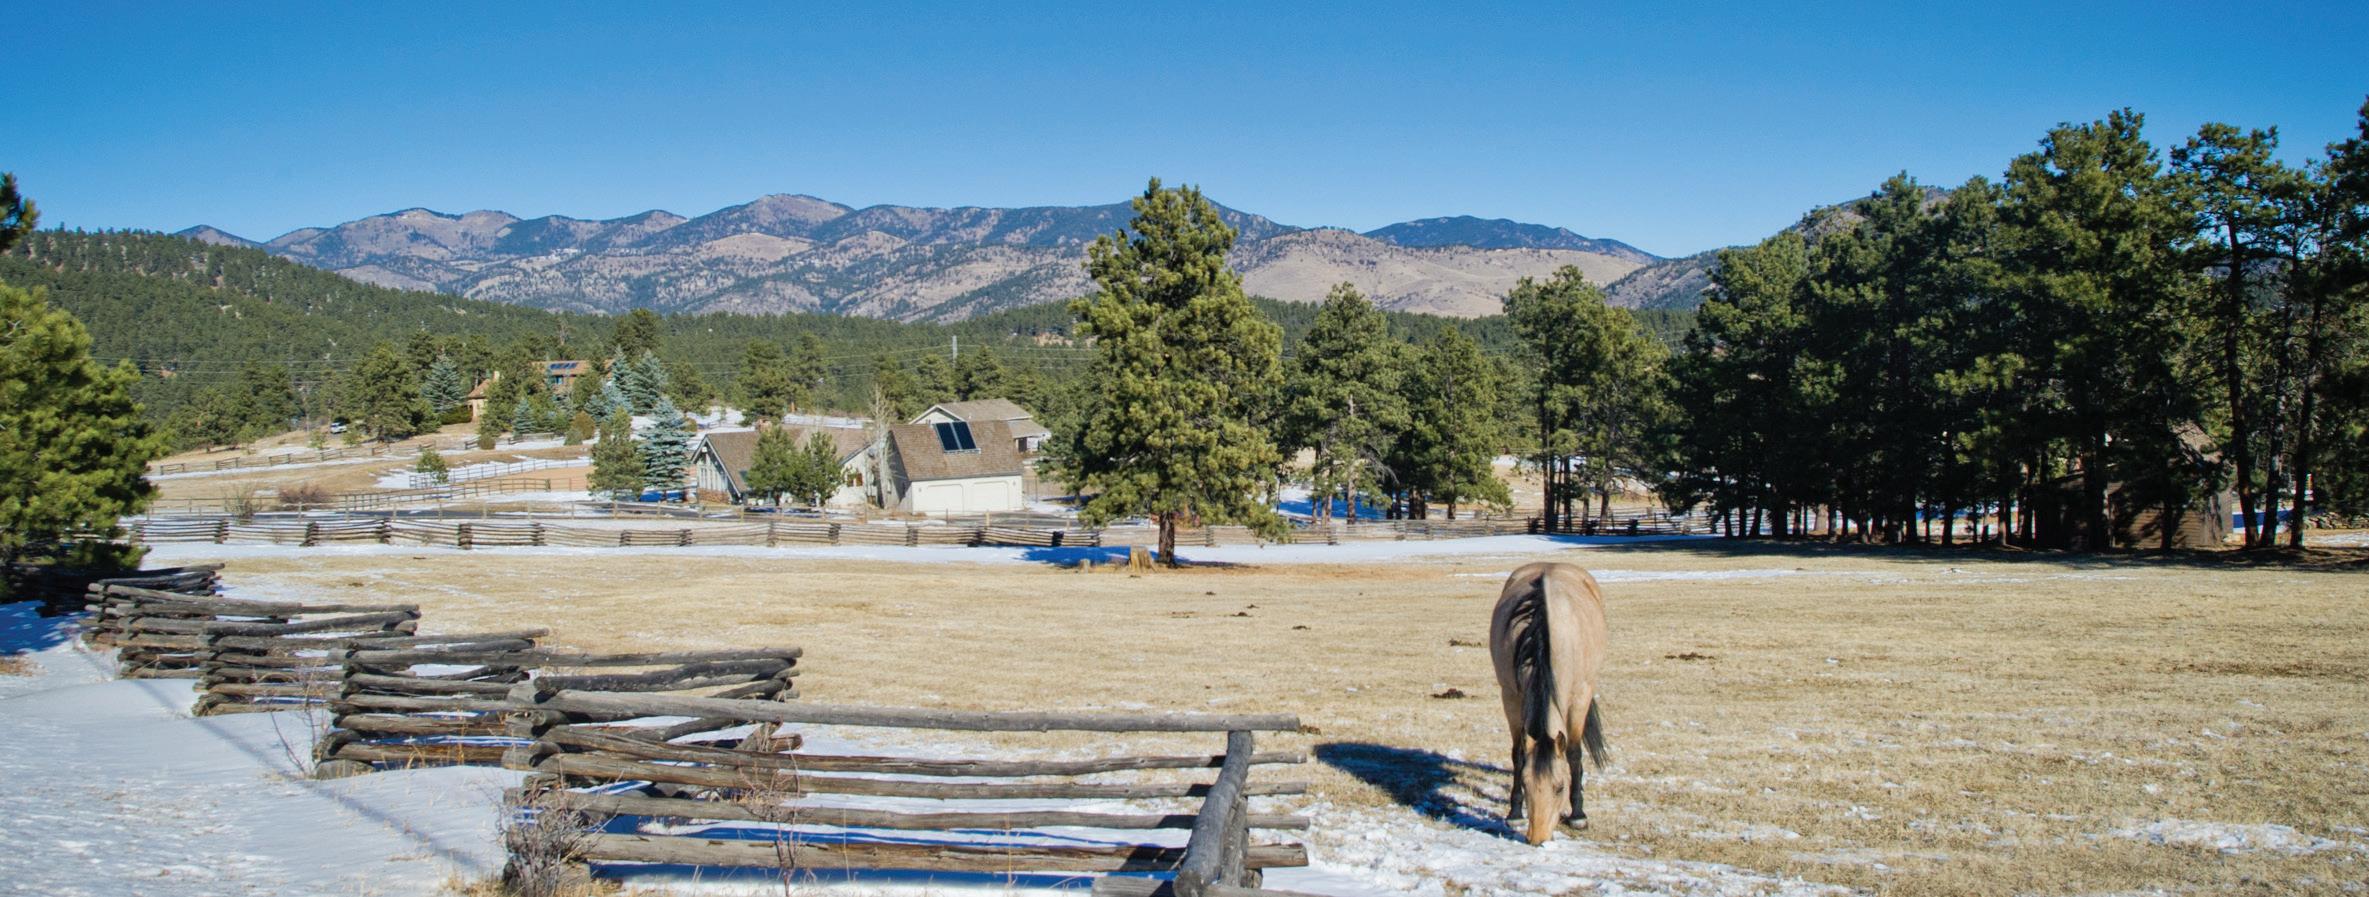
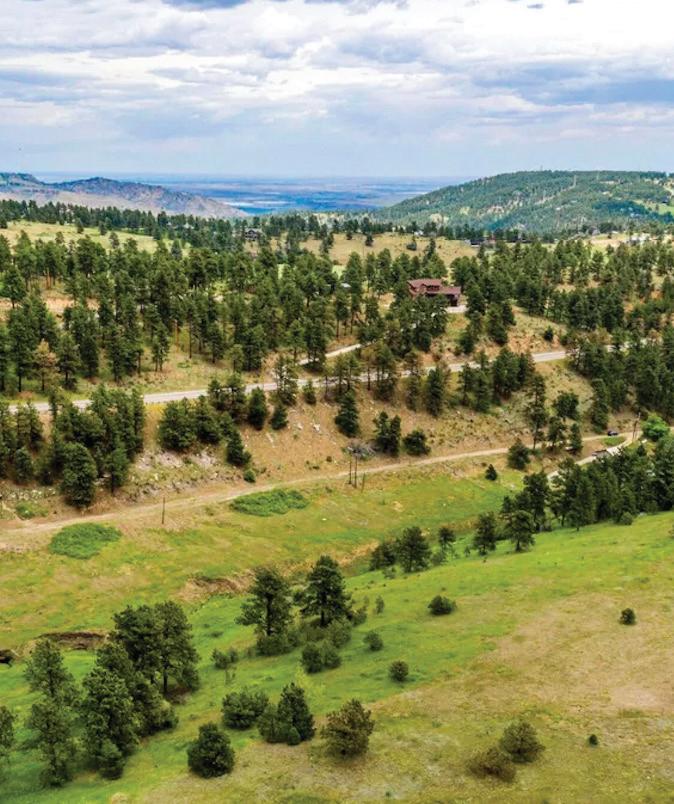
Bridging the Denver and mountain communities, the Foothills benefit from a unique combination of natural beauty, convenience to both urban areas and outdoor recreation, and some of the most amazing communitites to call ‘home.’ Situated within the west corridor of Jefferson County, this collection of neighborhoods including beloved areas such as Genesee, Hiwan Hills, and Lookout Mountain, provides more privacy and space than other areas of Denver and gives its residents a taste of mountain living.
2022 is now over and what a year it was. During the last half of 2022, the real estate market showed strong signs of normalizing after the 2021 COVIDdriven boom. The first half of the year saw incredibly high buyer demand, and it felt similiar to the 2021 market. The market started to shift when mortgage interest rates started to rise. This was intended
to tamp down buyer demand, but because of limited inventory in Jefferson County—which saw a decrease of 9.7% in new listings in 2022 compared to 2021— they still managed to have historically high appreciation averaging 12.0% for the average price of detached homes.
We recognize each locality is unique and no two regions respond to market shifts the same way. To present an accurate picture of each of the areas that make up the Foothills communities, LIV Sotheby’s International Realty is proud to present our year-end Micro Market Report, representing the metrics of many key and beloved neighborhoods.
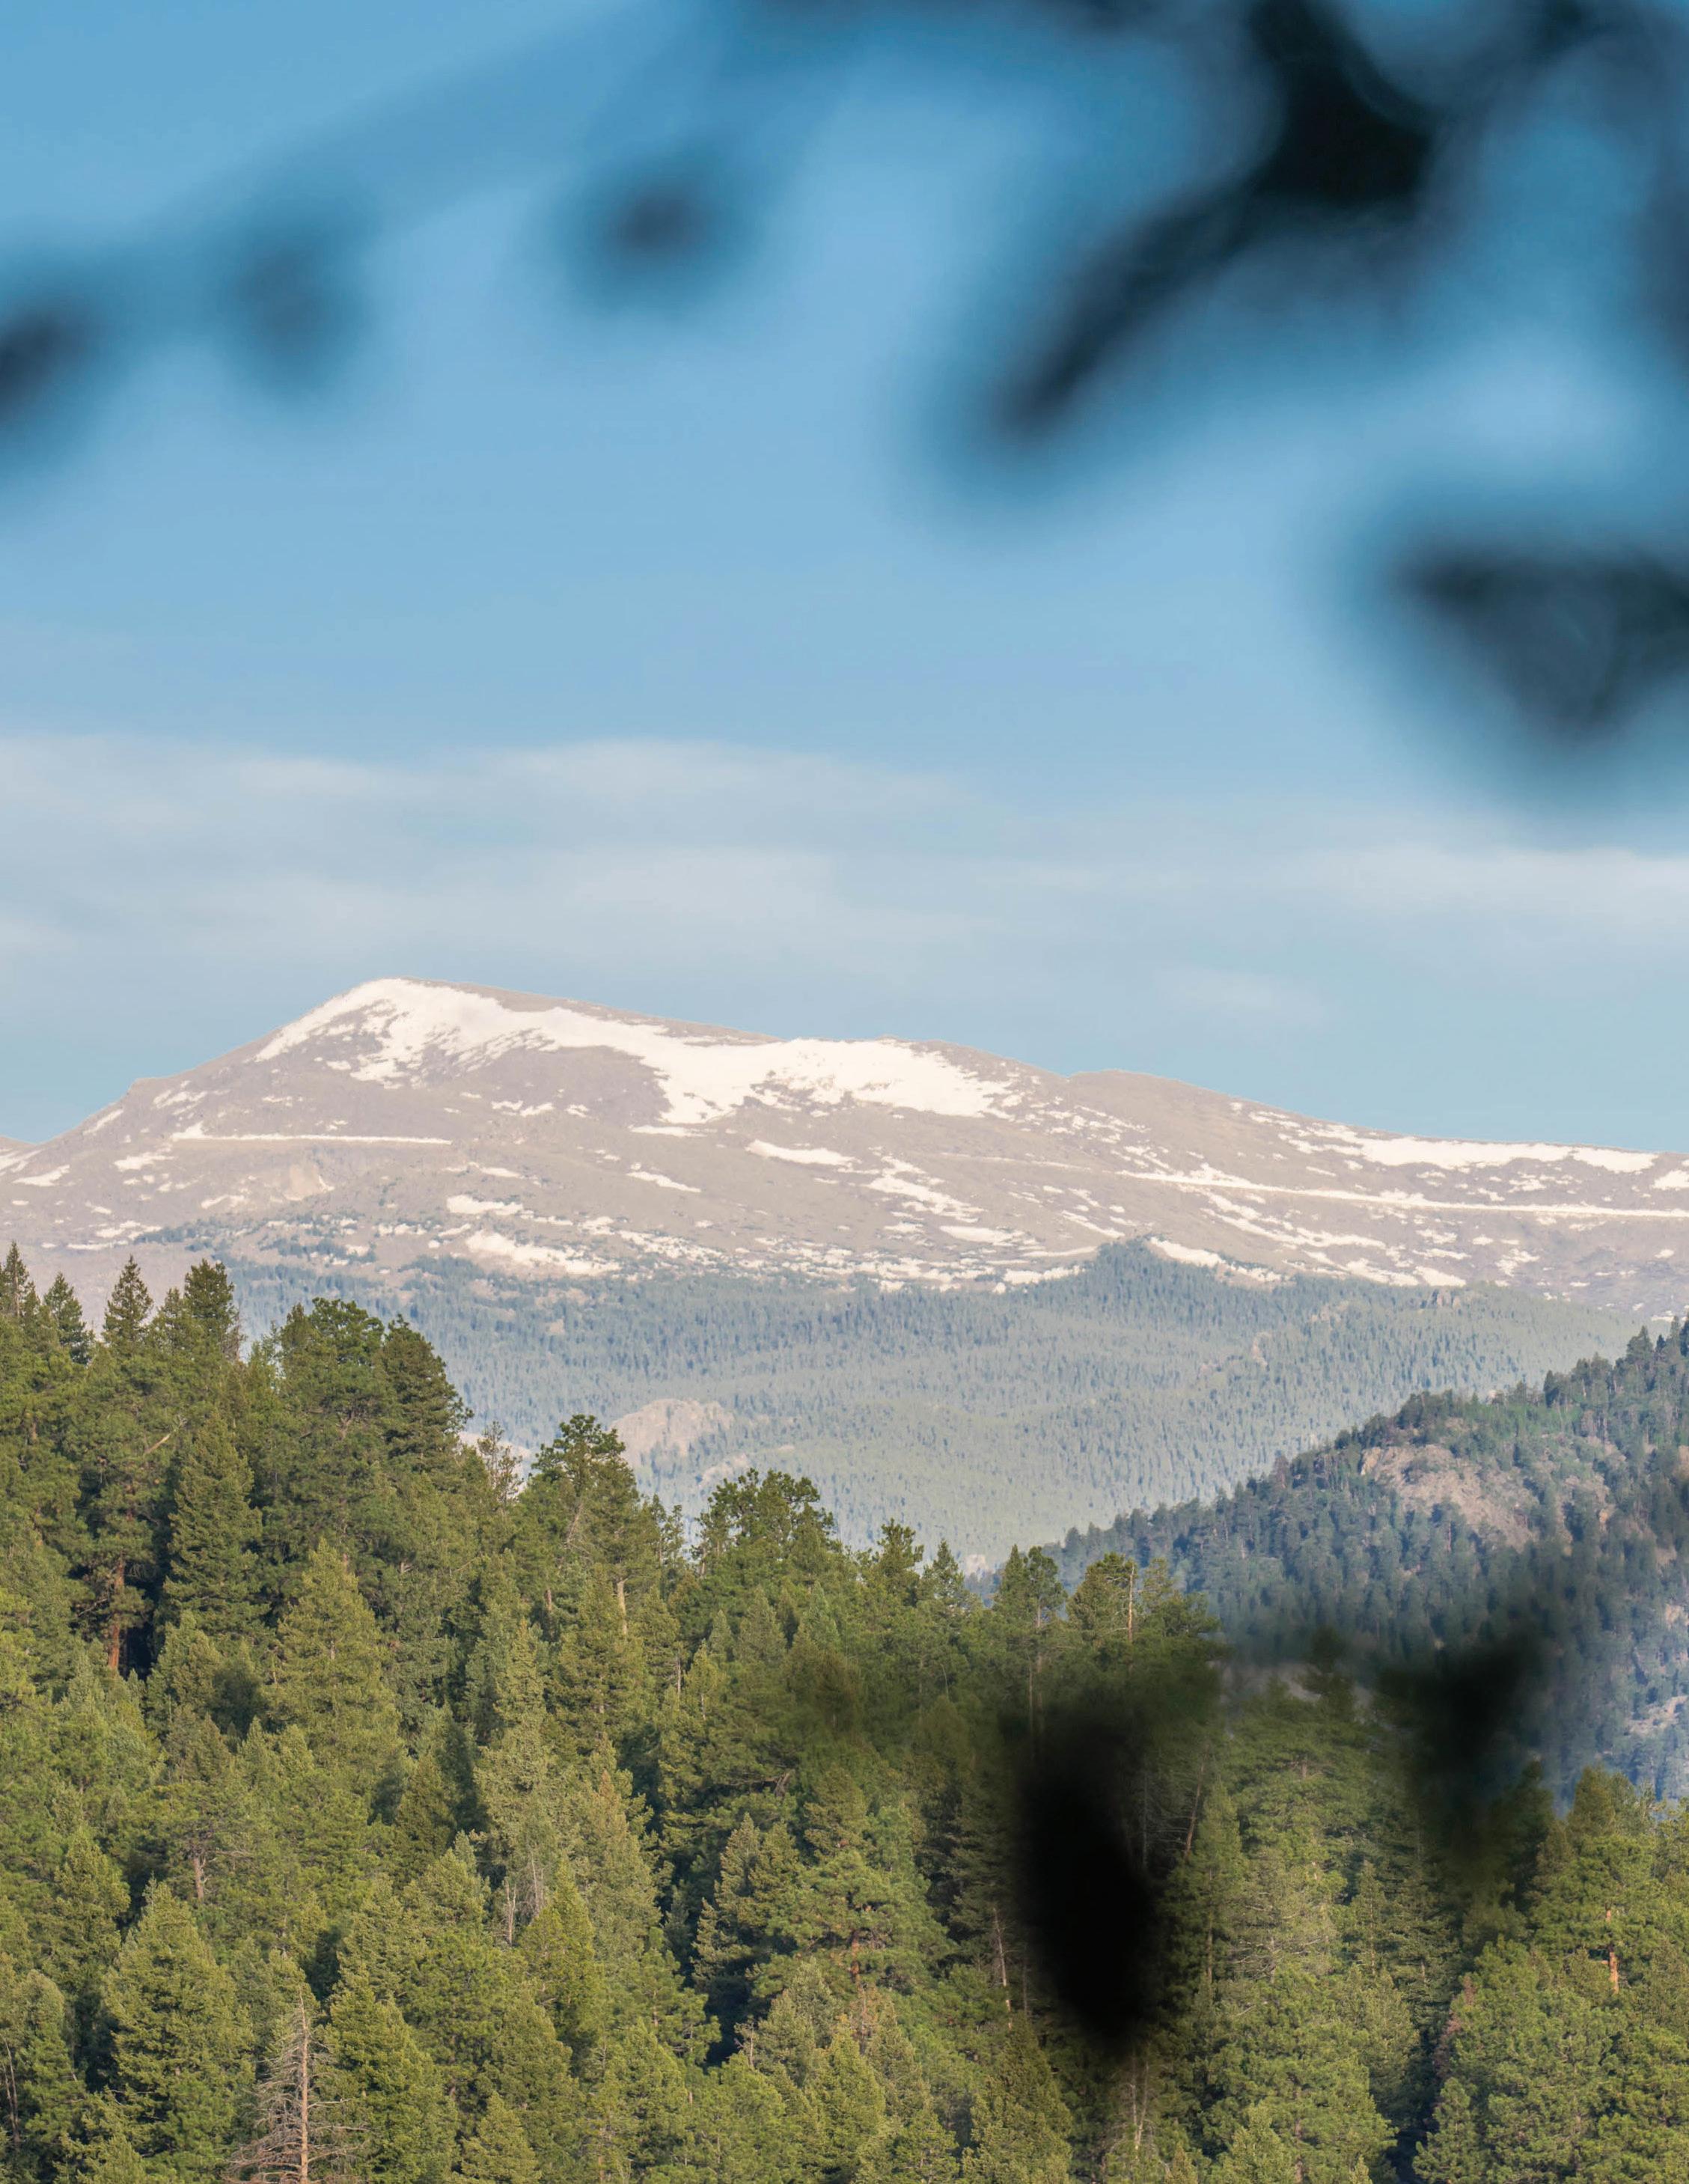
With bountiful natural beauty, captivating vistas, and communities that cater to those looking for a mix of mountain living, luxury lifestyles, and everything in between, the Foothills are a wonderful place to call home.
Jefferson County
coloradomicroreports.com Based on Information from REColorado for the period January 1st, 2022 - December 31th, 2022. This representation is based in whole or in part on data supplied by REColorado. REColorado does not guarantee nor is in any way responsible for its accuracy. Data maintained by REColorado may not reflect all real estate activity in the market.
January through December 2021 2022 % Change New Listings 12,358 11,159 -9.7% Sold Listings (All Properties) 11,852 9,547 -19.4% Average Price (All Properties) $621,815 $693,143 11.5% Average Price (Single Family) $706,647 $791,786 12.0% Average Days on Market 12 16 33.3% % Sold Price to Original List Price 102.4% 100.1% -2.2% Total Dollar Volume Sold $7,369,751,311 $6,617,426,955 -10.2%
MARKET UPDATE Foothills
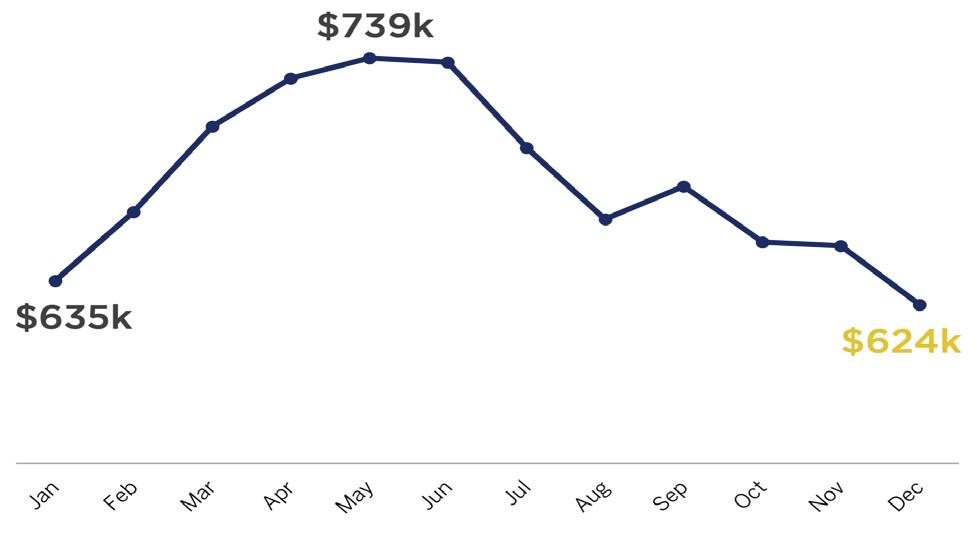
Average Sales Price (All Properties)
MICRO MARKET REPORT | Foothills JANUARY - DECEMBER 2022 • COLORADOMICROREPORTS.COM livsothebysrealty.com
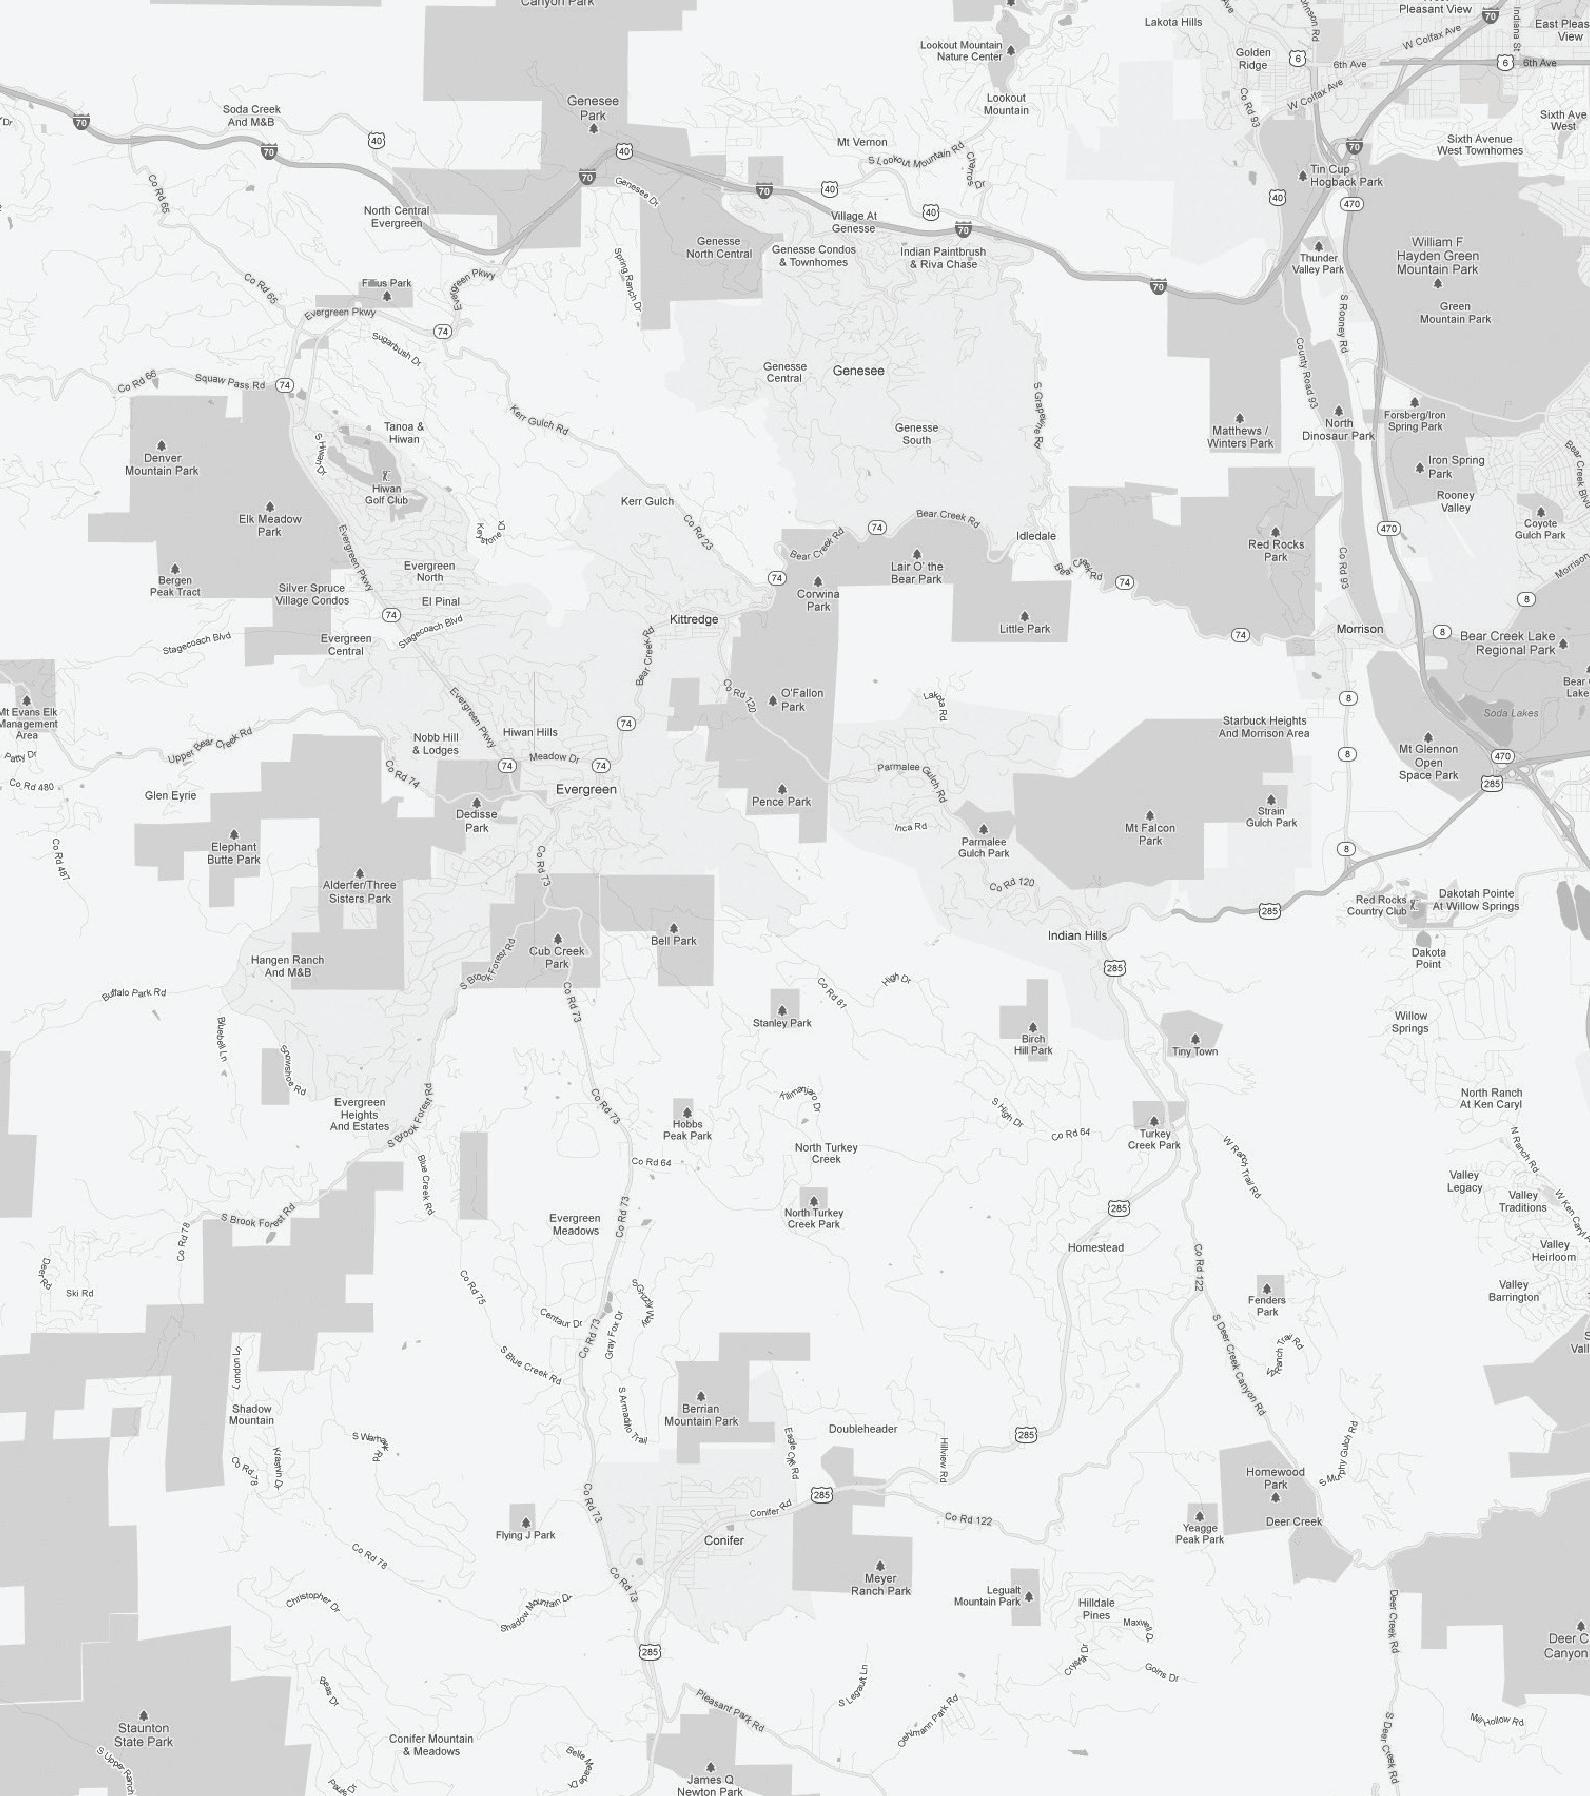
FOOTHILLS NEIGHBORHOODS
1. Bear Mountain
2. Brook Forest
3. Conifer Mountain
4. Evergreen Highlands
5. Evergreen Meadows
6. Evergreen Meadows West
7. Evergreen Park Estates
8. Genesee
9. Hangen Ranch
10. Hiwan Country Club
11. Hiwan Hills
12. Lookout Mountain
13. Mt. Vernon Country Club
14. Ridge at Hiwan
15. Riva Chase
16. Shadow Mountain
17. Soda Creek
18. Spring Ranch
19. Tanoa
5 12 6 8 3 7 4 1 9 2 10 20 11 13 14 15 16 17 19 18
20. Upper Bear Creek
Bear Mountain, perched at 8,629 feet in elevation on the eastern side of Evergreen, provides residents with the quintessential Colorado lifestyle experience. This serene community is located approximately 35 minutes west of Denver.
33.3%
The highest home sale price in Brook Forest increased by 33.3% in 2022 compared to that of 2021.
BEAR MOUNTAIN BROOK FOREST CONIFER MOUNTAIN January through December 2021 2022 % Change Average Price $819,819 $845,282 3.1% Average Price Per Square Foot $292 $318 9.2% Average Days on Market 11 12 9.1% Highest Price $1,400,000 $1,260,000 -10.0% Properties Sold 27 22 -18.5% % Sold Price to List Price 103.0% 101.5% -1.4% January through December 2021 2022 % Change Average Price $596,548 $668,321 12.0% Average Price Per Square Foot $368 $377 2.3% Average Days on Market 12 13 8.3% Highest Price $1,050,000 $1,400,000 33.3% Properties Sold 40 24 -40.0% % Sold Price to List Price 101.9% 98.2% -3.6%
January through December 2021 2022 % Change Average Price $1,312,266 $1,584,501 20.7% Average Price Per Square Foot $342 $412 20.7% Average Days on Market 29 30 3.4% Highest Price $2,825,000 $2,900,000 2.7% Properties Sold 15 10 -33.3% % Sold Price to List Price 101.4% 98.1% -3.3%
42.9%
The average number of days on market in Evergreen Highlands decreased by 42.9% in 2022 compared to that of 2021.
Evergreen Meadows West is located down the road from Flying J Ranch and Arapahoe National Forest. Just 15 minutes from downtown Evergreen, here you can find quiet home sites on two-plus acres, as well as gorgeous views and a convenient location.
January through December 2021 2022 % Change Average Price $870,410 $990,833 13.8% Average Price Per Square Foot $302 $347 15.1% Average Days on Market 13 16 23.1% Highest Price $1,220,000 $1,400,000 14.8% Properties Sold 10 6 -40.0% % Sold Price to List Price 102.6% 102.1% -0.6% January through December 2021 2022 % Change Average Price $968,404 $977,800 1.0% Average Price Per Square Foot $326 $348 6.9% Average Days on Market 7 4 -42.9% Highest Price $1,350,000 $1,210,000 -10.4% Properties Sold 17 5 -70.6% % Sold Price to List Price 104.7% 107.4% 2.6% January through December 2021 2022 % Change Average Price $977,013 $1,169,000 19.7% Average Price Per Square Foot $277 $350 26.4% Average Days on Market 18 15 -16.7% Highest Price $1,400,000 $2,400,000 71.4% Properties Sold 31 20 -35.5% % Sold Price to List Price 100.1% 100.6% 0.5% EVERGREEN MEADOWS WEST EVERGREEN MEADOWS EVERGREEN HIGHLANDS
Evergreen Park Estates is a quiet area with most homesites between one to two acres. This area is located conveniently close to Alderfer/Three Sisters Park and is about 10 minutes to local shopping.
61.5%
The average home sale price in Hangen Ranch increased by 61.5% in 2022 compared to that of 2021.
EVERGREEN
GENESEE HANGEN
January through December 2021 2022 % Change Average Price $1,257,370 $2,031,250 61.5% Average Price Per Square Foot $356 $481 35.2% Average Days on Market 24 19 -20.8% Highest Price $1,922,222 $2,350,000 22.3% Properties Sold 6 4 -33.3% % Sold Price to List Price 98.2% 111.4% 13.4% January through December 2021 2022 % Change Average Price $755,400 $1,079,738 42.9% Average Price Per Square Foot $335 $411 22.6% Average Days on Market 8 36 350.0% Highest Price $1,105,000 $1,600,000 44.8% Properties Sold 10 8 -20.0% % Sold Price to List Price 105.2% 102.8% -2.3% January through December 2021 2022 % Change Average Price $1,323,067 $1,582,123 19.6% Average Price Per Square Foot $317 $350 10.3% Average Days on Market 16 25 56.3% Highest Price $2,384,000 $2,655,000 11.4% Properties Sold 47 29 -38.3% % Sold Price to List Price 101.7% 96.2% -5.4%
PARK ESTATES
RANCH
Hiwan Hills is a community located near the heart of Evergreen. Here you can find a mix of older homes and remodels on private, one+ acre lots. Hiwan Hills is known for having beautiful views and natural landscape, with some home sites featuring stunning views of Mt. Evans.
40.9%
The average number of days on market in Lookout Mountain decreased by 40.9% in 2022 compared to that of 2021.
January through December 2021 2022 % Change Average Price $1,195,167 $1,193,571 -0.1% Average Price Per Square Foot $322 $396 22.9% Average Days on Market 22 13 -40.9% Highest Price $1,915,000 $1,750,000 -8.6% Properties Sold 12 7 -41.7% % Sold Price to List Price 102.9% 103.0% 0.2% January through December 2021 2022 % Change Average Price $1,176,733 $1,320,679 12.2% Average Price Per Square Foot $278 $336 21.0% Average Days on Market 18 13 -27.8% Highest Price $2,675,000 $1,900,000 -29.0% Properties Sold 18 16 -11.1% % Sold Price to List Price 100.1% 103.1% 3.0% January through December 2021 2022 % Change Average Price $958,119 $1,102,764 15.1% Average Price Per Square Foot $315 $355 12.7% Average Days on Market 6 11 83.3% Highest Price $1,386,850 $1,785,000 28.7% Properties Sold 18 21 16.7% % Sold Price to List Price 106.5% 103.9% -2.5% LOOKOUT MOUNTAIN HIWAN HILLS HIWAN COUNTRY CLUB
16.1%
The average price per square foot in Ridge at Hiwan increased by 16.1% in 2022 compared to that of 2021.
MT. VERNON COUNTRY CLUB RIDGE AT HIWAN RIVA CHASE January through December 2021 2022 % Change Average Price $1,346,324 $1,432,120 6.4% Average Price Per Square Foot $277 $293 5.5% Average Days on Market 90 15 -83.3% Highest Price $1,850,000 $2,095,600 13.3% Properties Sold 8 5 -37.5% % Sold Price to List Price 96.5% 98.2% 1.8% January through December 2021 2022 % Change Average Price $801,600 $872,500 8.8% Average Price Per Square Foot $272 $383 41.1% Average Days on Market 30 26 -13.3% Highest Price $1,044,500 $1,100,000 5.3% Properties Sold 7 5 -28.6% % Sold Price to List Price 98.6% 99.5% 0.9% January through December 2021 2022 % Change Average Price $1,477,514 $1,672,329 13.2% Average Price Per Square Foot $290 $337 16.1% Average Days on Market 8 16 100.0% Highest Price $2,600,000 $2,050,000 -21.2% Properties Sold 25 22 -12.0% % Sold Price to List Price 102.3% 99.0% -3.2%
Shadow Mountain, located in beautiful Conifer, is surrounded by hiking trails and offers residences easy access to Staunton State Park.
17.6%
The average home sale price in Soda Creek increased by 17.6% in 2022 compared to that of 2021.
January through December 2021 2022 % Change Average Price $2,084,000 $2,125,000 2.0% Average Price Per Square Foot $328 $371 12.9% Average Days on Market 21 111 428.6% Highest Price $2,495,000 $2,200,000 -11.8% Properties Sold 5 2 -60.0% % Sold Price to List Price 95.1% 85.4% -10.2% January through December 2021 2022 % Change Average Price $688,123 $736,222 7.0% Average Price Per Square Foot $353 $396 12.0% Average Days on Market 15 4 -73.3% Highest Price $1,240,000 $1,005,000 -19.0% Properties Sold 14 9 -35.7% % Sold Price to List Price 101.1% 105.8% 4.7% January through December 2021 2022 % Change Average Price $2,049,829 $2,409,875 17.6% Average Price Per Square Foot $356 $359 0.9% Average Days on Market 33 35 6.1% Highest Price $4,775,150 $4,598,500 -3.7% Properties Sold 19 12 -36.8% % Sold Price to List Price 95.1% 96.8% 1.8% SPRING RANCH SODA CREEK SHADOW MOUNTAIN
Located in North Evergreen, Tanoa is a gorgeous, masterplanned community with close proximity to local schools and Evergreen’s best amenities, including popular restaurants, retail stores, and Elk Meadow Open Space Park.
TANOA January through December 2021 2022 % Change Average Price $1,094,000 $1,125,000 2.8% Average Price Per Square Foot $260 $265 1.7% Average Days on Market 13 32 146.2% Highest Price $1,600,000 $1,320,000 -17.5% Properties Sold 5 3 -40.0% % Sold Price to List Price 102.5% 102.6% 0.1% January through December 2021 2022 % Change Average Price $1,437,778 $2,135,129 48.5% Average Price Per Square Foot $392 $400 2.1% Average Days on Market 29 21 -27.6% Highest Price $2,970,000 $3,900,000 31.3% Properties Sold 9 7 -22.2% % Sold Price to List Price 98.6% 95.4% -3.3% UPPER BEAR CREEK
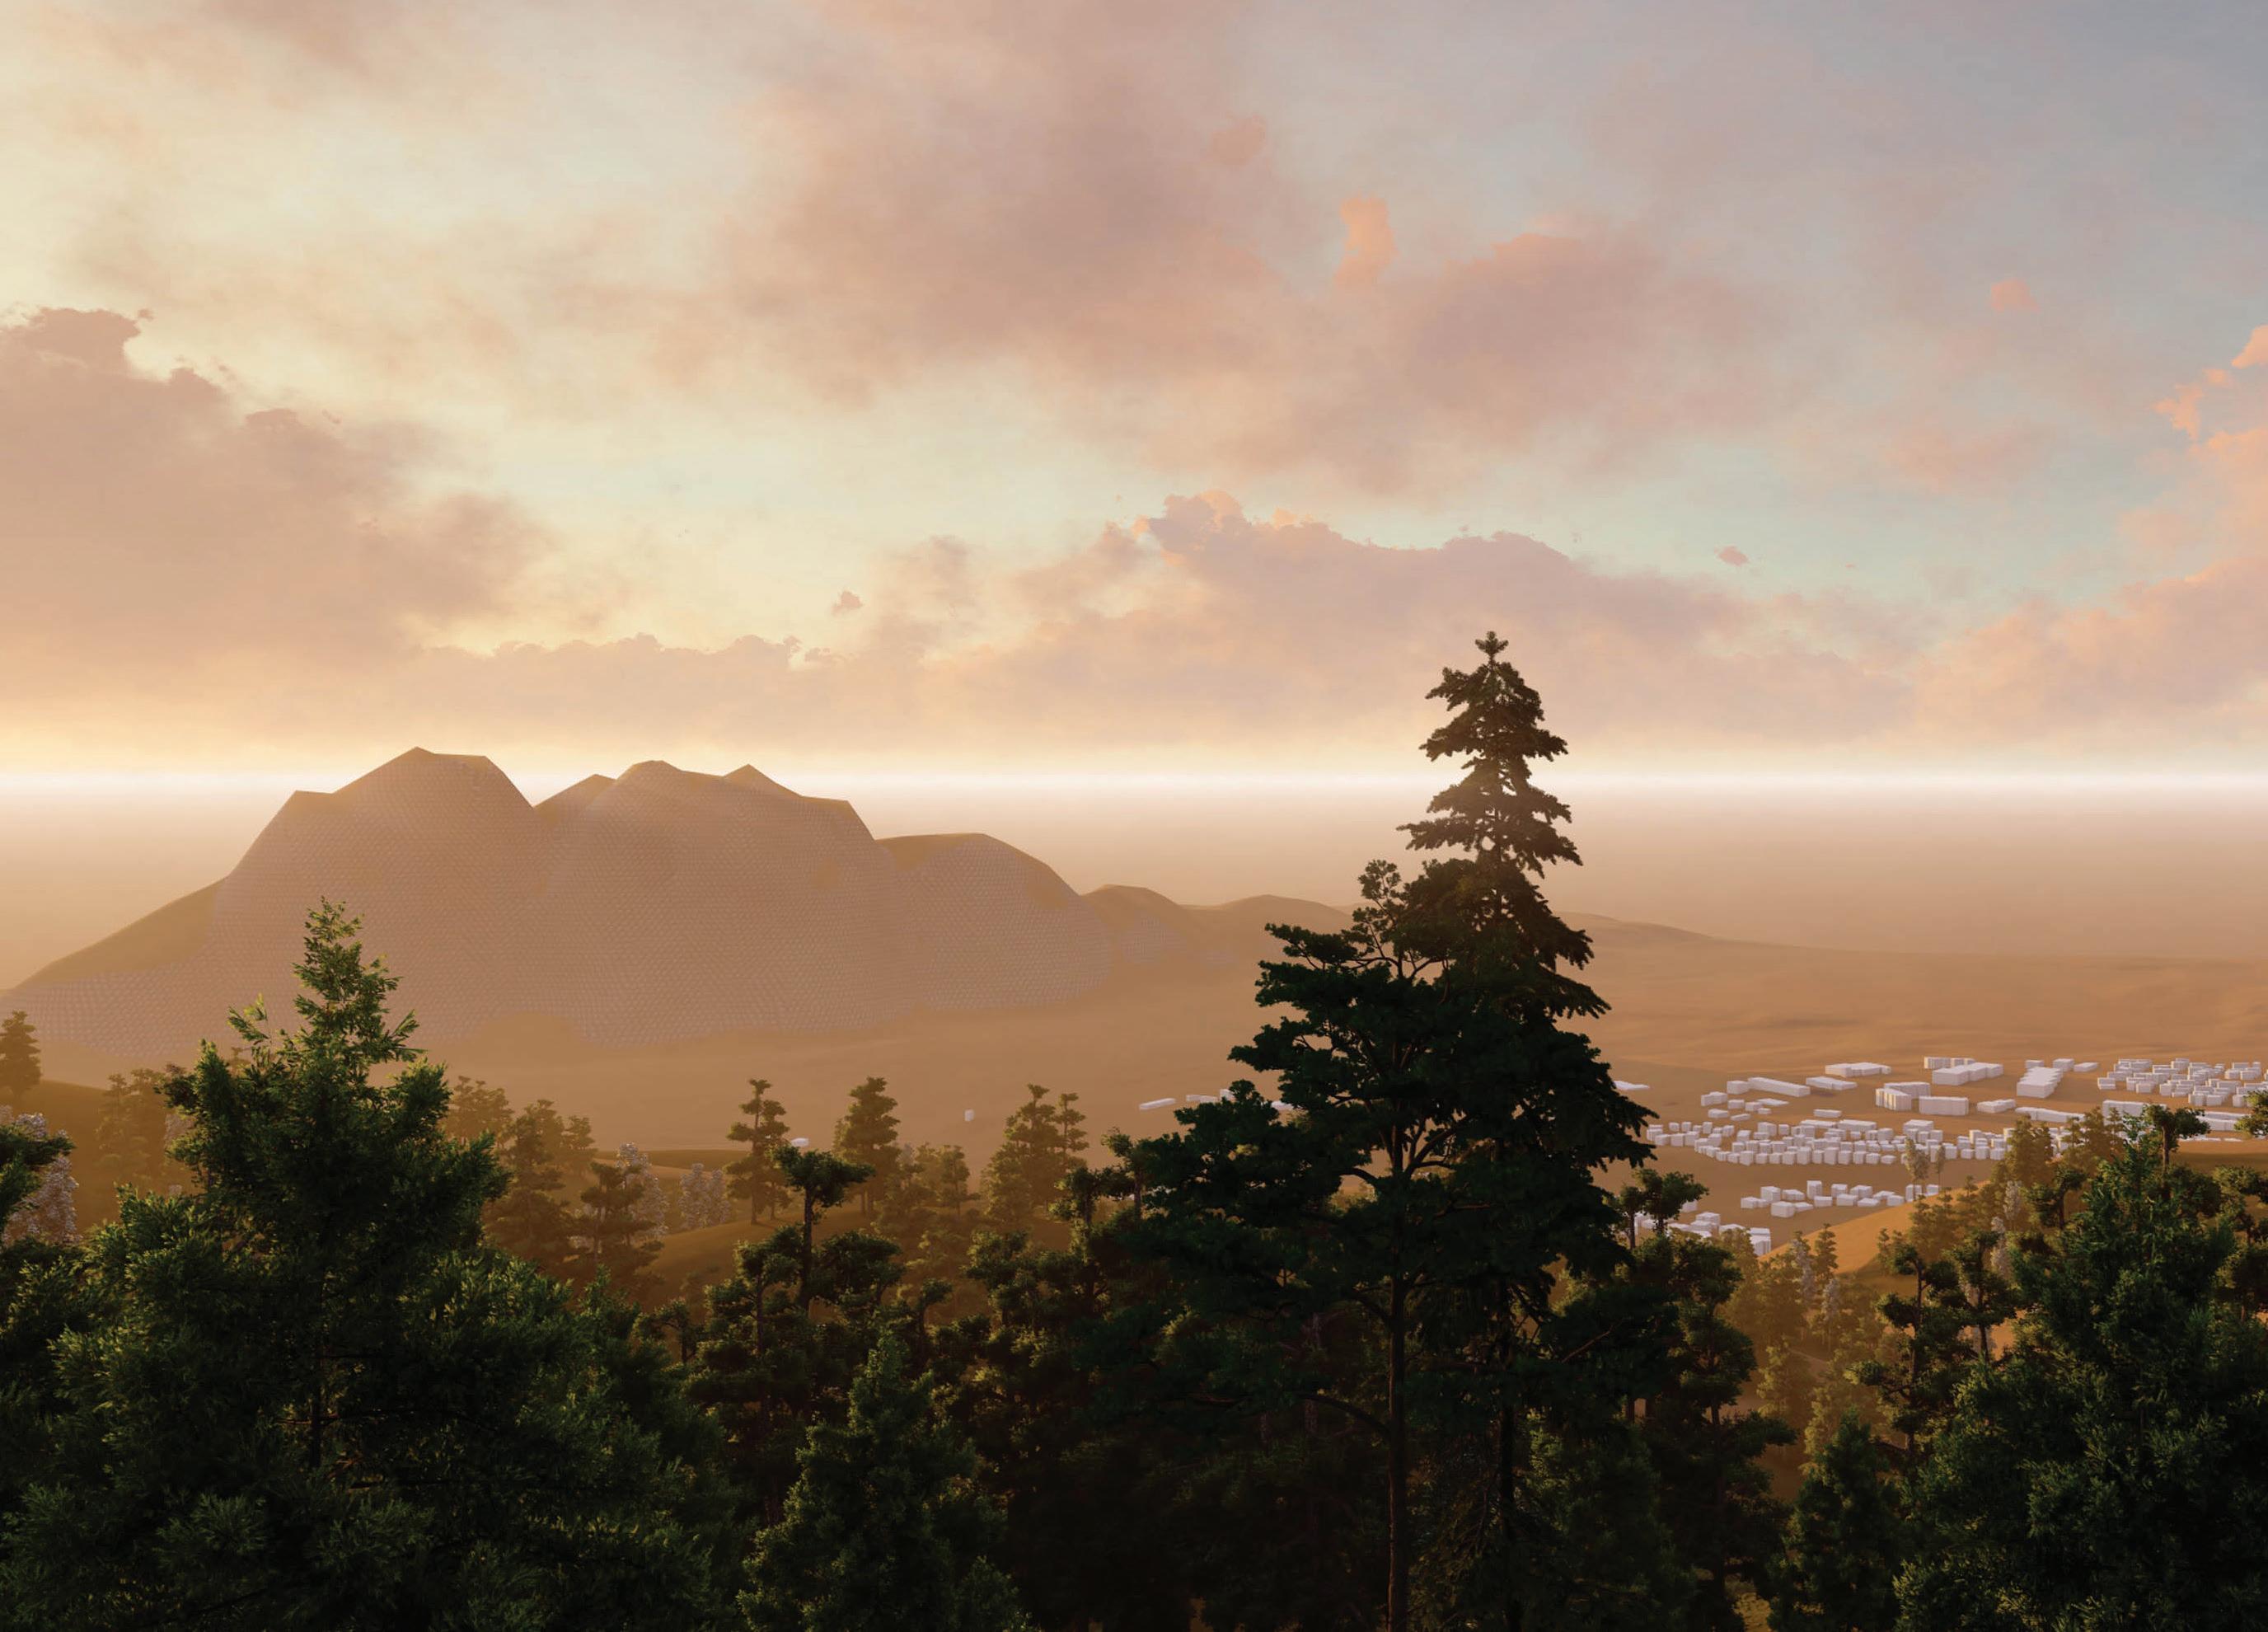
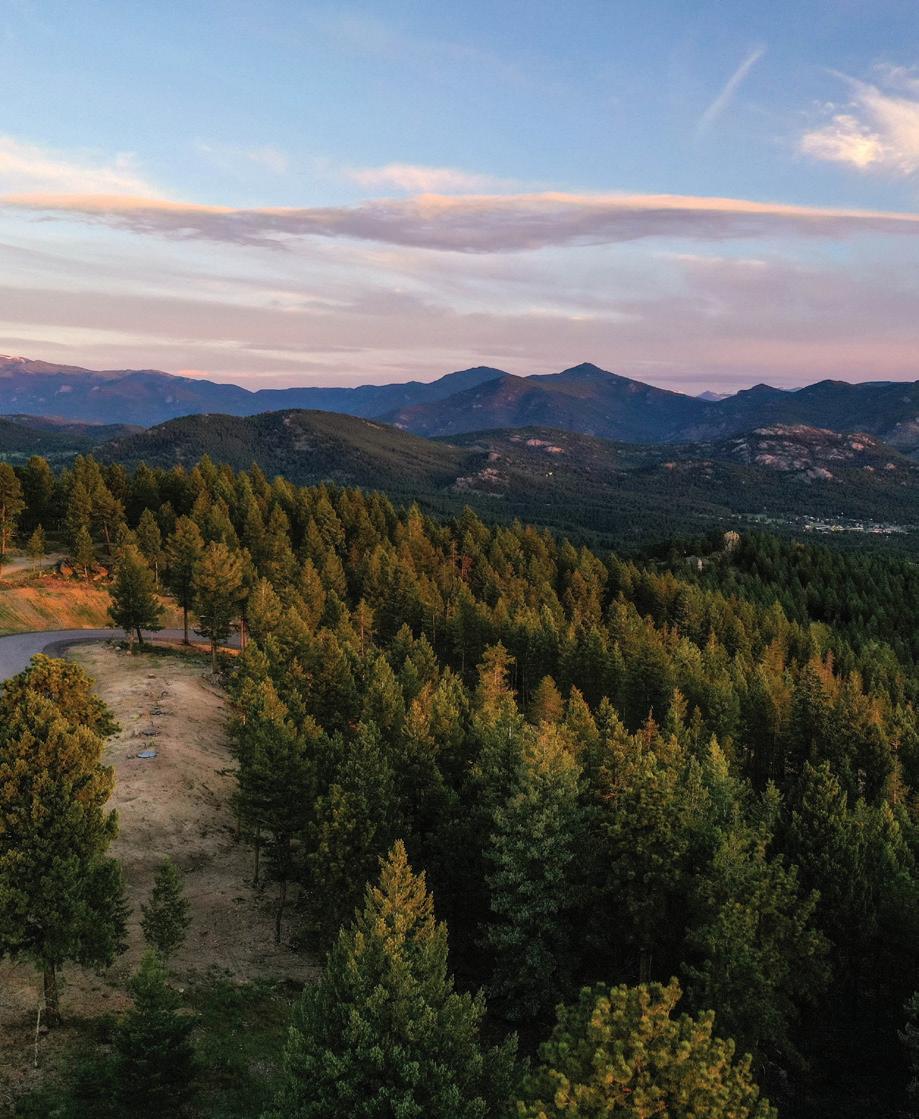
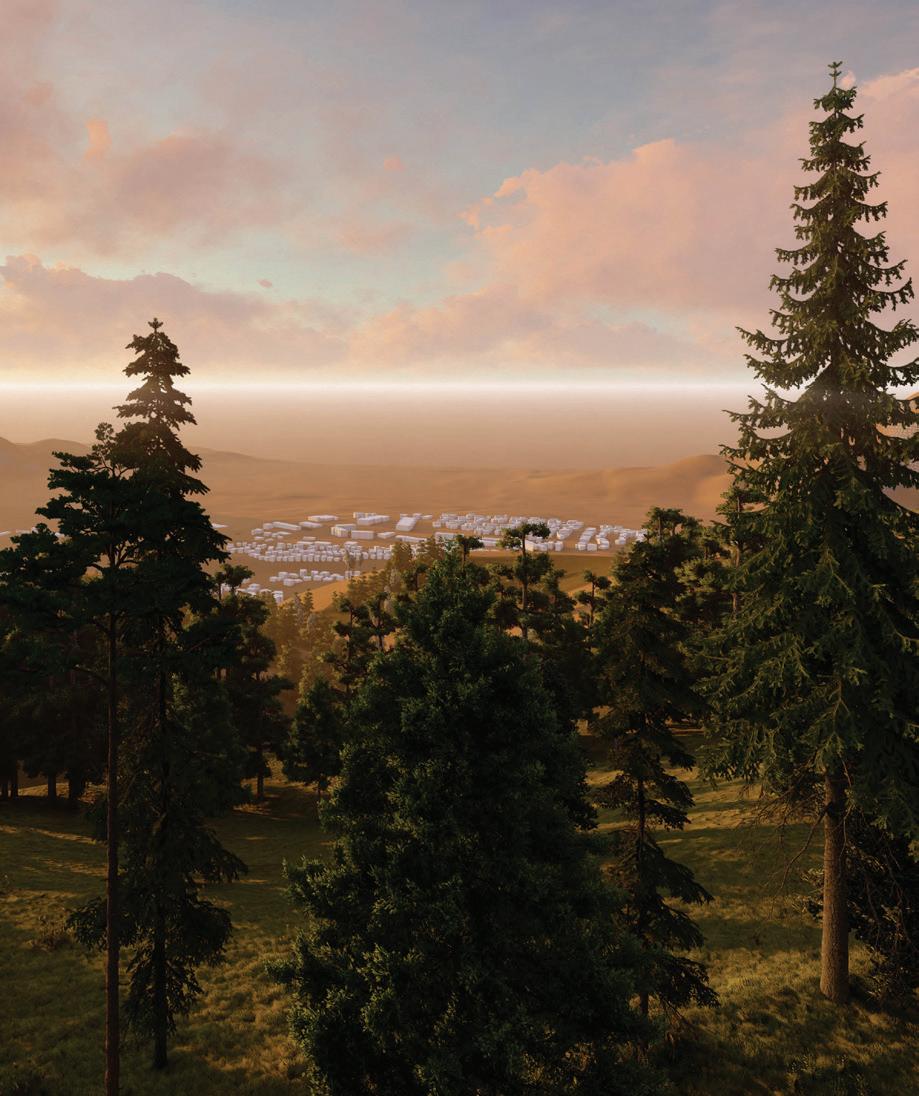
among the trees The definition of paradise depends on your point of view. Find a home that makes each day more extraordinary than the last with LIV Sotheby’s International Realty. 303.674.3200 | livsothebysrealty.com
MICRO MARKET REPORT | Foothills JANUARY - DECEMBER 2022 • COLORADOMICROREPORTS.COM


