
Luxury Report
COLORADO’S LUXURY MARKETS
Welcome
COLORADO’S LUXURY MARKETS
LIV Sotheby’s International Realty aims to provide you the information you need to make an informed real estate decision, and our quarterly Luxury Report is a tool you can use to do just that. Measuring the performance in some of Colorado’s most popular communities for single-family homes, we include homes sold above $1 million in Denver Metro, Colorado Springs, Boulder, and Grand County. Homes selling above $2 million in Summit County and Crested Butte are included as are properties sold above $3 million in Vail Valley and Telluride.
Proving nothing compares to the luxury real estate market, in the first half of 2023 the Denver Metro area saw an average sale price of $1,310,500, while average sale price across the five Colorado Resort markets is $3,217,800. Lack of inventory has been a notable factor in the market with 67% of Sotheby’s International Realty agents seeing low or very low inventory. Despite the changes in year-over-year statistics from 2022, the overall outlook of the luxury market is aiming to improve to a position of strength again.
2 | livsothebysrealty.com
Q2
6.81%
30-year fixed rate mortgage as of 7/20/23
6.11%
15-year fixed rate mortgage as of 7/20/23
Source: Weekly data from Freddie Mac’s Primary Mortgage Market Survey
Nationwide Inventory Snapshot
Real Estate agents from across Sotheby’s International Realty weighed in on the inventory situation in their regions
Source: Sotheby’s International Realty Luxury Outlook 2023 Agent Survey
33%
28% Low Very Low Moderate High
5% 34%
January - June 2023 | 3
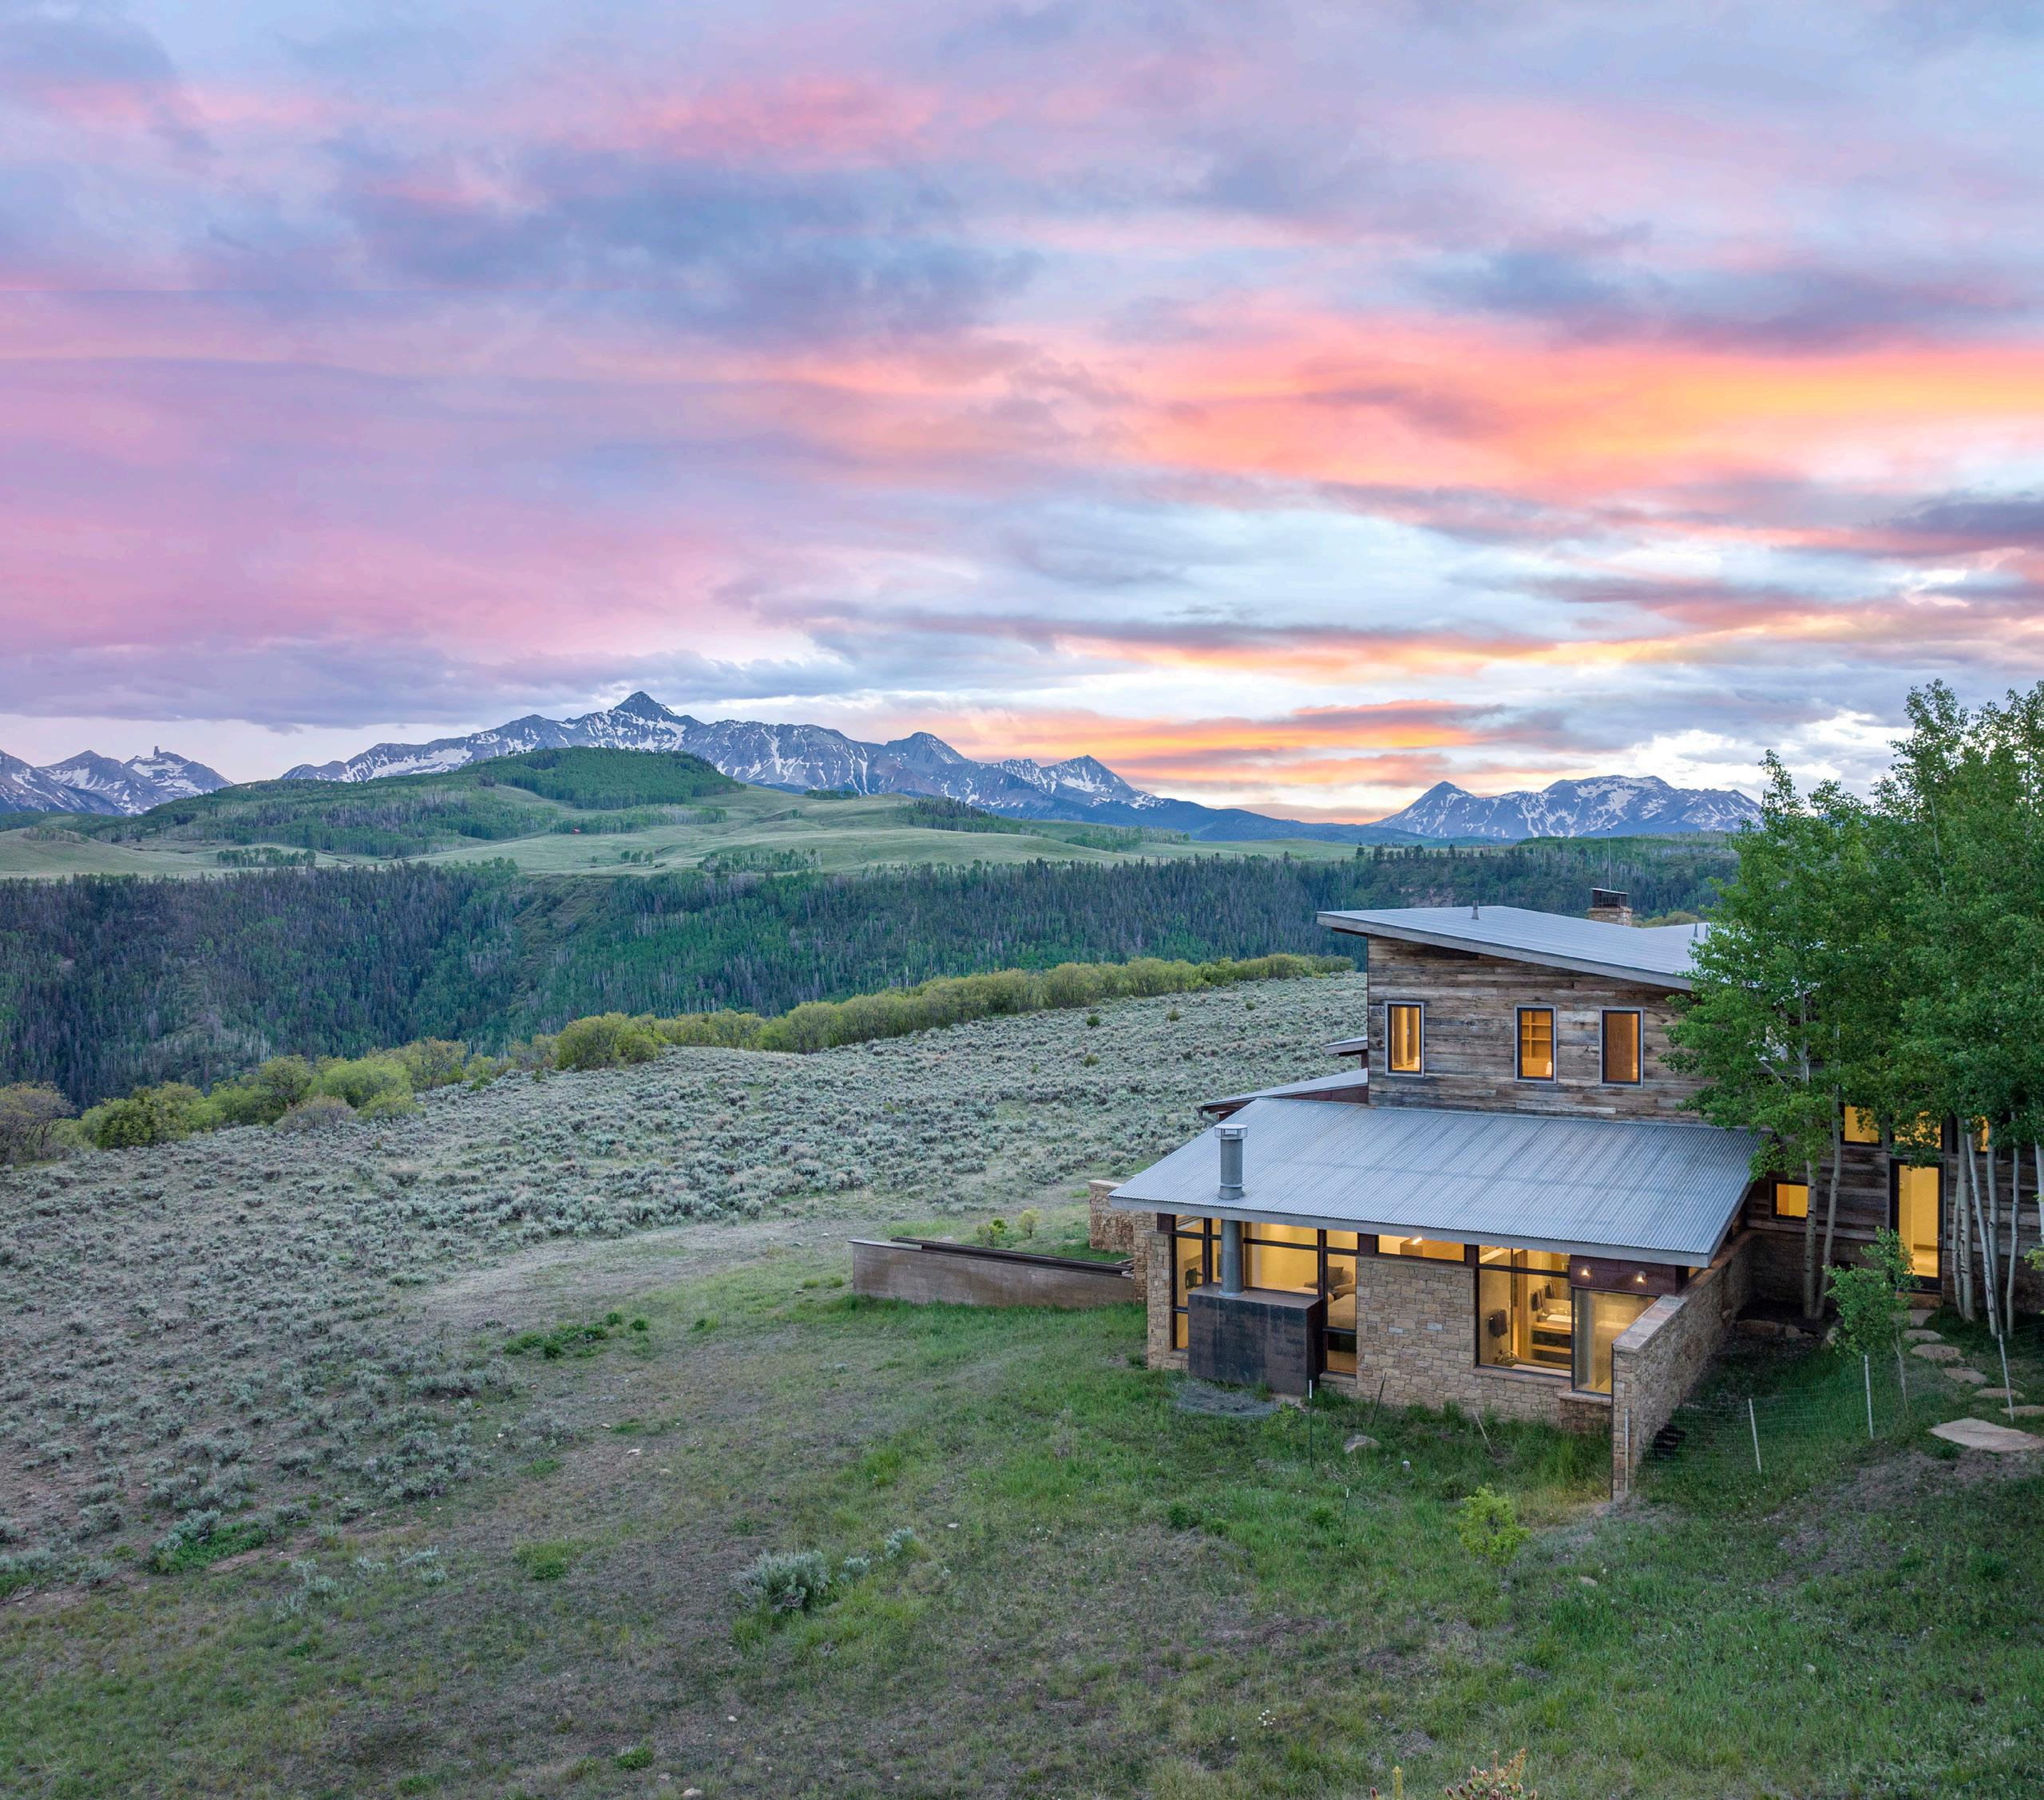
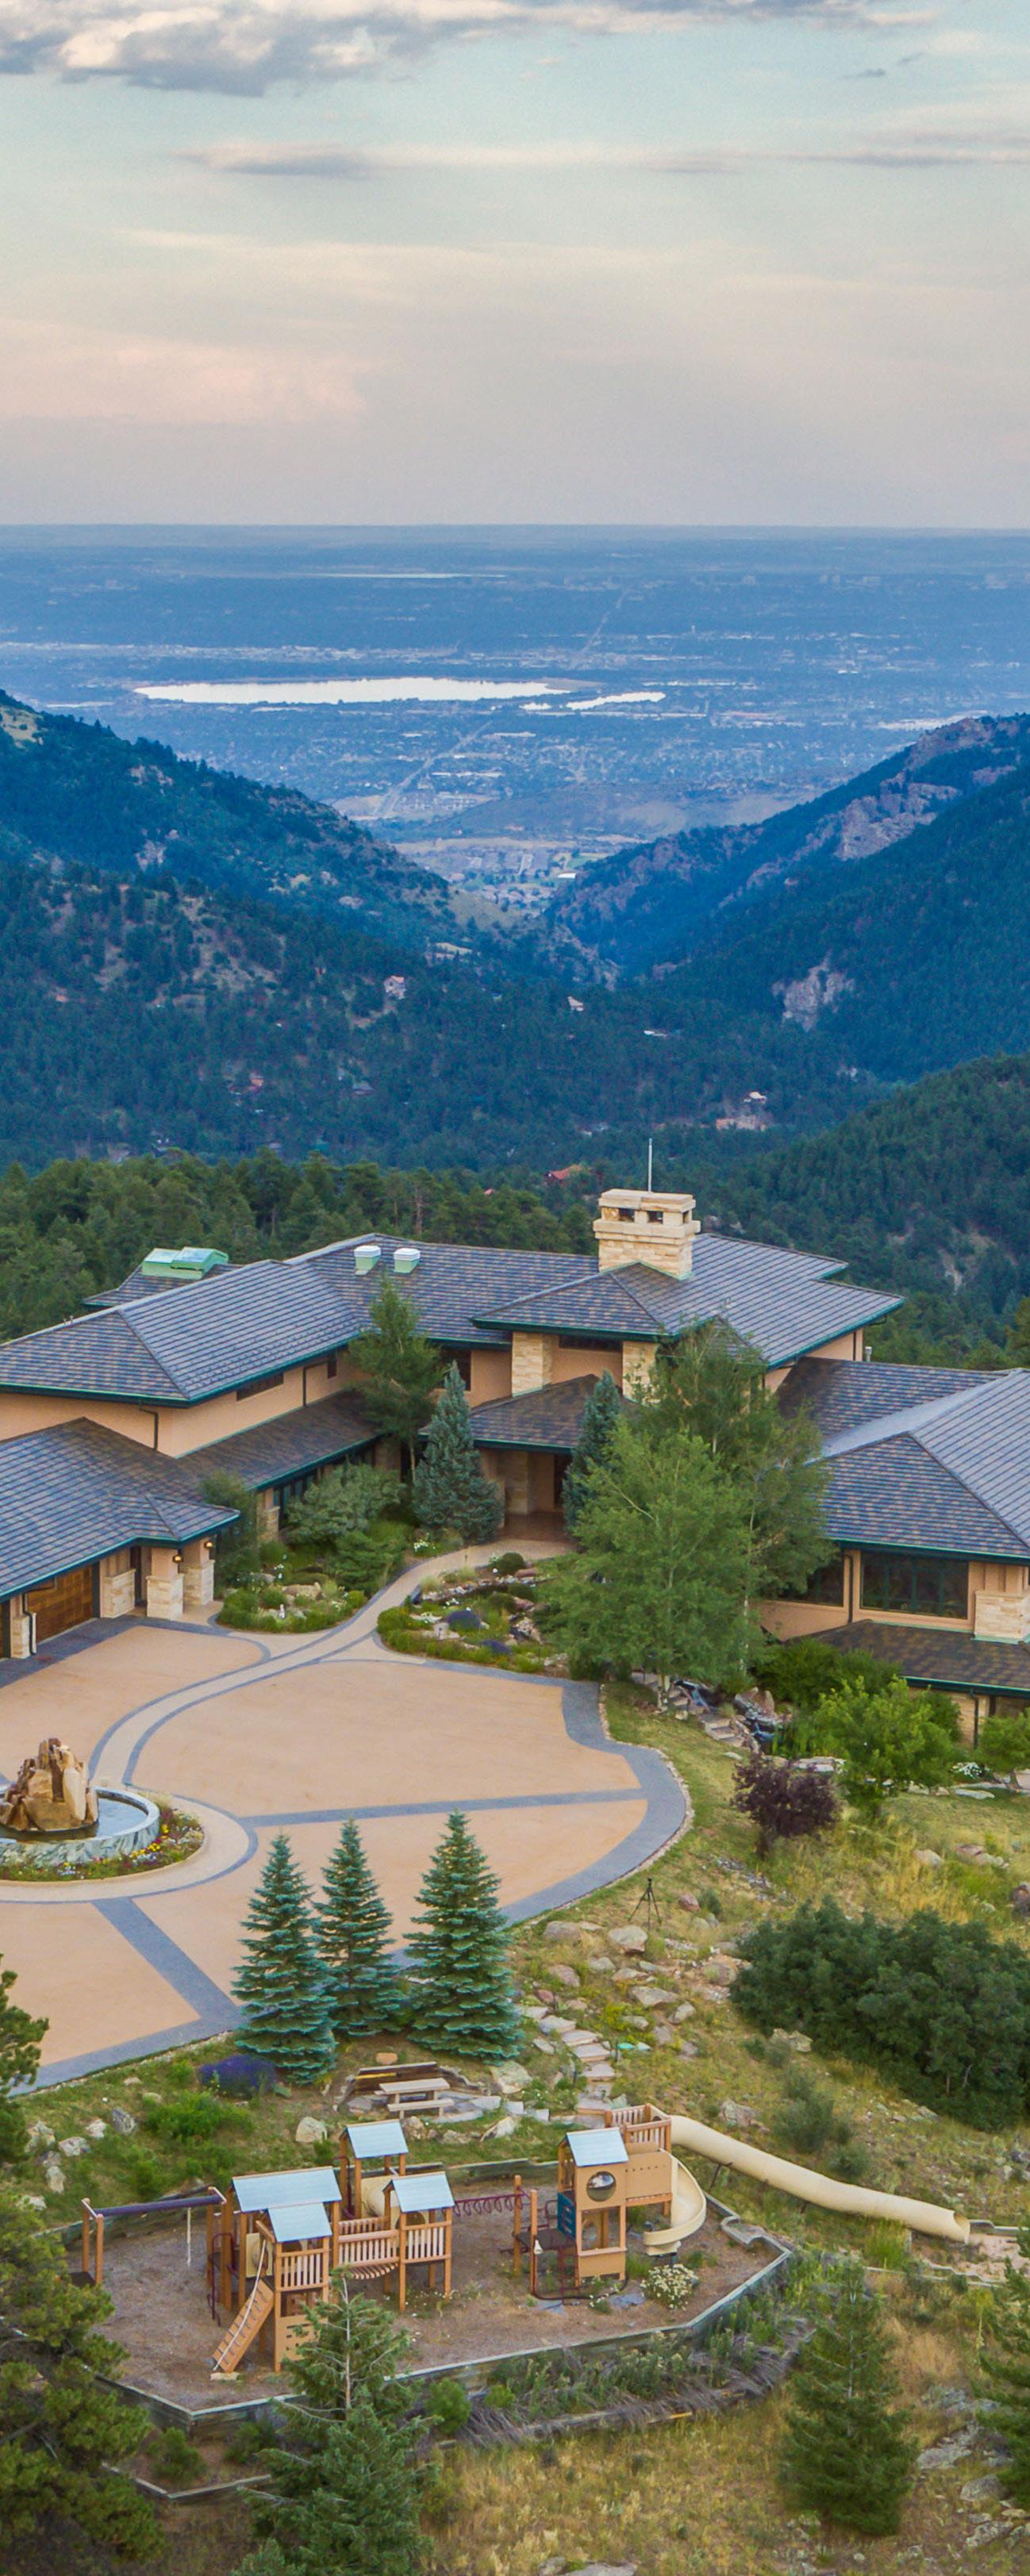
Colorado’s Front Range
Luxury homes are selling in the Front Range, although it may be taking slightly longer than it did two years ago. In the first half of 2023, luxury homes in this area stayed on the market for an average of 51 days, up 60.4% from the same time last year. Those looking for the best of Colorado living are still able to find it, with higher interest rates having little effect on this market sector. The list to sold price in the first half of the year was 99%, down 5.9% for the same time last year.
AT A GLANCE
YTD 2022 vs 2023 % Change
Median Sold Price -1.3%
$1,310,500
YTD 2022 vs 2023 % Change
3,837 Properties Sold - 36.3%
YTD 2022 vs 2023 % Change
51 Average Days on Market 60.4%
YTD 2022 vs 2023 % Change
$387 Average Price per Sq. Ft. - 0.6% 99.0% List Price to Sold Price - 5.9%
YTD 2022 vs 2023 % Change
January - June 2023 | 5
on sales $1,000,000+ sales from REColorado, IRES and PPAR (Powered by LiveBy). This representation is based in whole or in part on data supplied from REColorado, IRES and PPAR on July 5, 2023. REColorado, IRES and PPAR do not guarantee nor is in any way responsible for its accuracy. Data maintained by REColorado, IRES and PPAR may not reflect all real estate activity in the market.
Based
Denver Metro
Median Sold Price
$1,340,550
2,103 Properties Sold
43 Average Days on Market
Highest Sold Price
$9,250,000
January - June 2023 | 7 City of Denver 797 $1,388,000 38 Broomfield 53 $1,275,000 21 Commerce City 1 $1,860,000 48 Englewood 10 $1,147,750 53 Littleton 19 $1,200,000 25 Aurora 34 $1,125,000 45 Centennial 70 $1,275,000 29 Greenwood Village 60 $1,925,000 24 Cherry Hills Village 42 $3,650,000 66 Thornton 2 $1,050,000 62 Westminster 18 $1,294,300 55 Properties Sold Median Sold Price Average Days on Market
Based on all residential sales above $1,000,000 in the counties of Adams, Arapahoe, Denver, Douglas, Broomfield, and Jefferson.
South Metro
Median Sold Price
$1,300,000
465 Properties Sold
59 Average Days on Market
Highest Sold Price
$5,950,000
January - June 2023 | 9 Highlands Ranch 89 $1,338,500 46 Lone Tree 34 $1,262,500 120 Parker 16 $1,101,000 40 Castle Rock 32 $1,200,750 39 Castle Pines 56 $1,300,000 20 Sedalia 6 $2,054,375 2 Franktown 1 $1,450,000 90 Larkspur 14 $1,179,000 176 Properties Sold Median Sold Price Average Days on Market Based on all residential sales above $1,000,000 in Douglas County
West Metro & Foothills
Median Sold Price
$1,285,000
437 Properties Sold
35 Average Days on Market
Highest Sold Price
$4,700,000
January - June 2023 | 11 Arvada 52 $1,100,000 19 Lakewood 63 $1,203,000 30 Wheat Ridge 16 $1,339,500 18 Evergreen 18 $1,325,000 12 Morrison 7 $1,067,800 4 Golden 33 $1,320,000 16 Conifer 22 $1,286,625 120 Properties Sold Median Sold Price Average Days on Market Based on all residential sales above $1,000,000 in Jefferson County
Boulder & Northern Colorado

Median Sold Price
$1,393,725
795 Properties Sold
39 Average Days on Market
Highest Sold Price
$16,000,000
January - June 2023 | 13 City of Boulder 248 $1,619,000 60 Longmont 30 $1,247,500 50 Louisville 33 $1,252,000 55 Niwot 15 $1,950,000 105 Erie 25 $1,200,000 45 Lafayette 32 $1,197,500 33 Superior 19 $1,220,663 59 Fort Collins 45 $1,275,000 55 Loveland 14 $1,155,091 51 Berthoud 14 $1,862,500 70 Windsor 27 $1,215,000 53 Timnath 25 $1,365,000 43 Properties Sold Median Sold Price Average Days on Market
Based on all residential sales above $1,000,000 in Boulder County, Fort Collins, Loveland, Berthoud, Windsor, and Timnath.
Colorado Springs
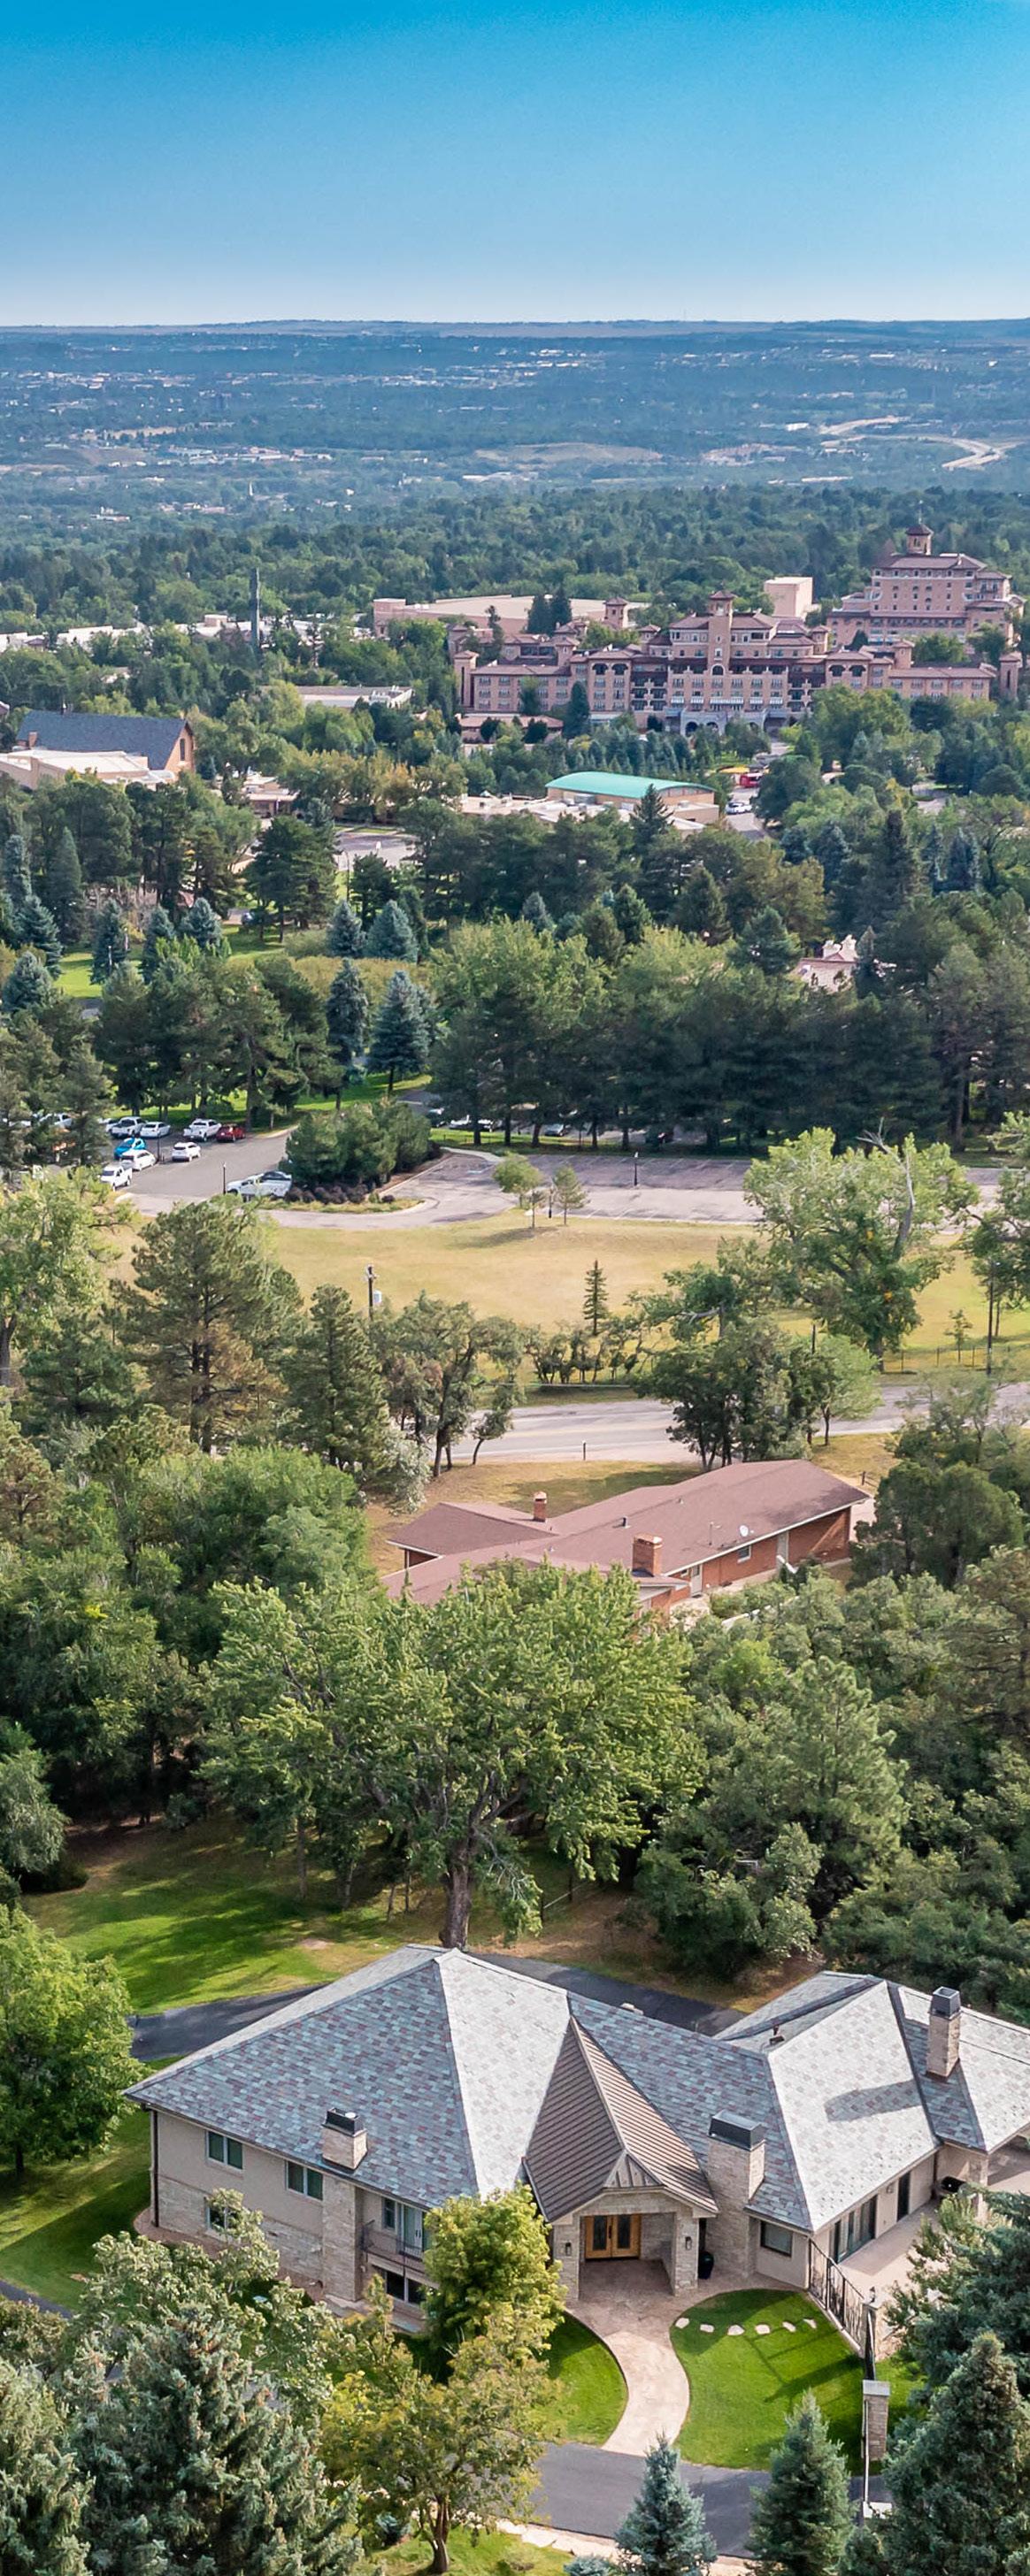
Median Sold Price
$1,333,556
254 Properties Sold
61 Average Days on Market
Highest Sold Price
$4,250,000
January - June 2023 | 15 Black Forest 61 $1,343,184 47 Broadmoor 42 $1,488,238 49 Flying Horse 17 $1,184,094 81 Monument 38 $1,269,532 74 Properties Sold Median Sold Price Average Days on Market Based on all residential sales $1,000,000+
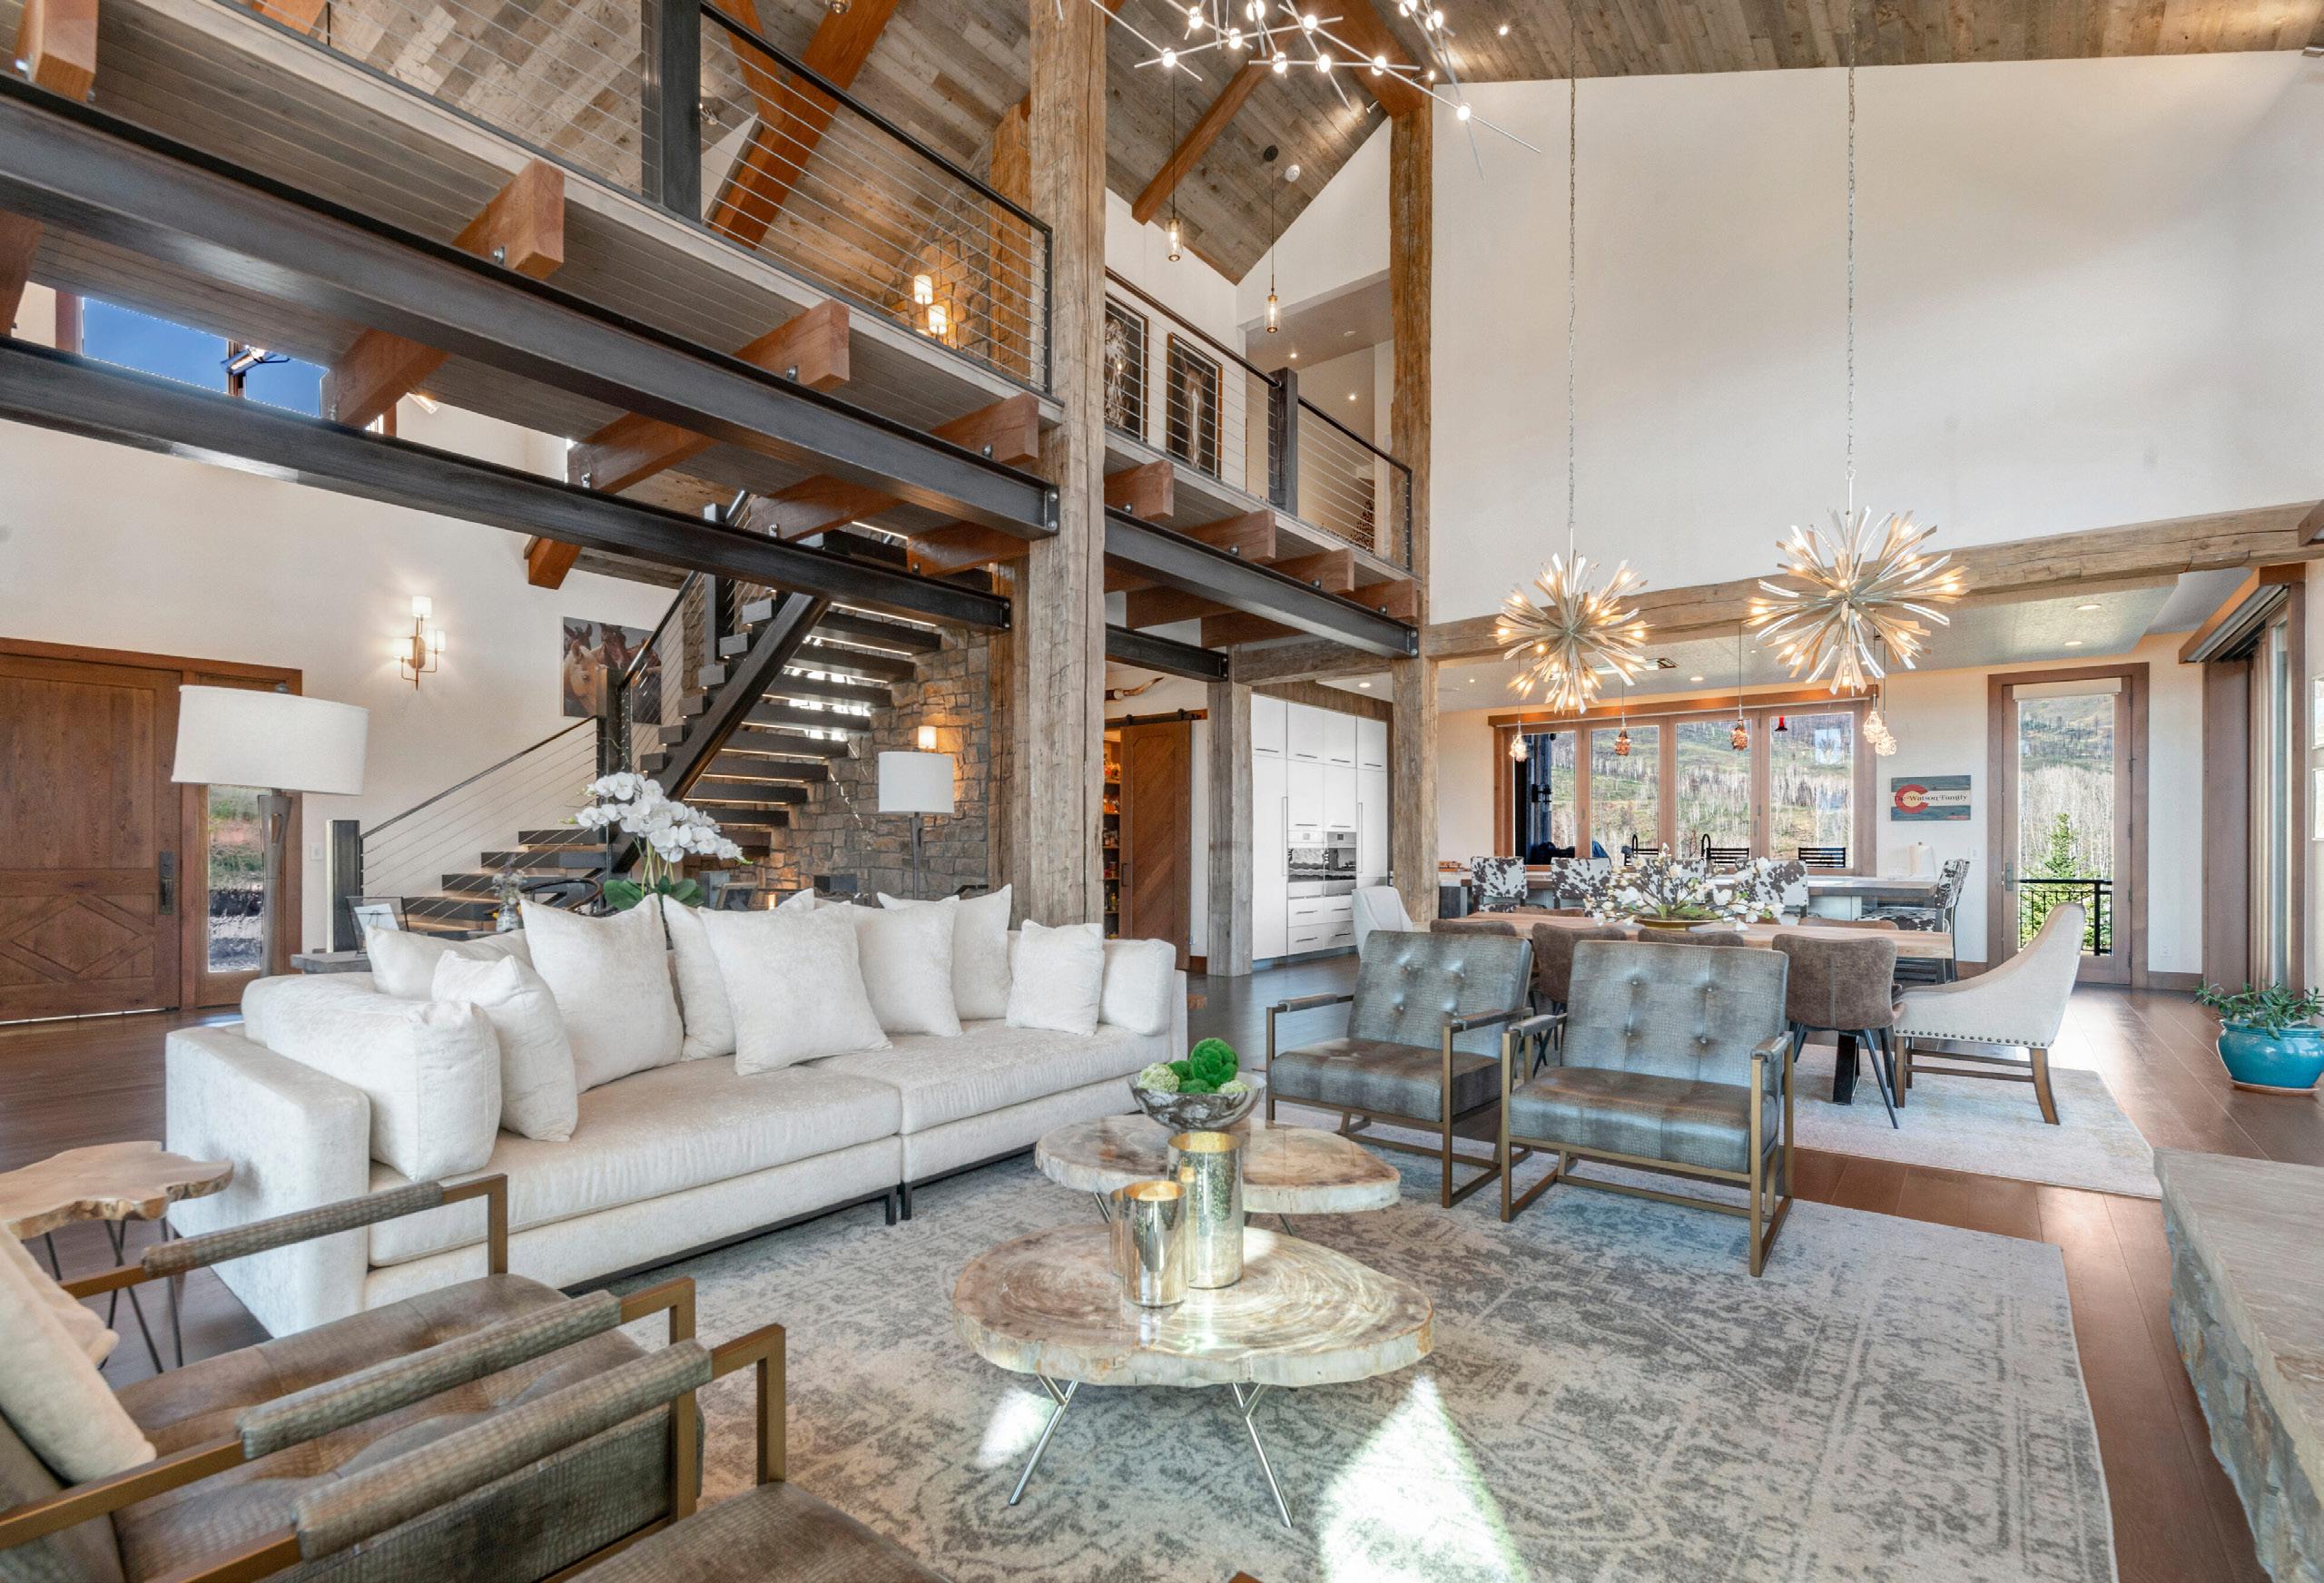
Colorado Resorts
During the first half of 2023, the resort markets had 263 properties sold, which is down 44.5% from the same time last year. However, the average price per square foot was $1,081 only down 0.6% from the same time a year ago, indicating that demand and low inventory are keeping home prices steady in our Colorado Resort markets. A slight slowdown in the market is apparent with 106 average days on market, an 11.3% increase from 2022. The low inventory and cooled demand are indicating a more balanced market as we head into Q3.
AT A GLANCE
YTD 2022 vs 2023 % Change
Median Sold Price - 5.4%
$3,217,800
YTD 2022 vs 2023 % Change
263 Properties Sold - 44.5%
106 Average Days on Market 11.3%
YTD 2022 vs 2023 % Change
YTD 2022 vs 2023 % Change
$1,081 Average Price per Sq. Ft. - 0.6%
YTD 2022 vs 2023 % Change
97.0% List Price to Sold Price - 2.5%
January - June 2023 | 17
Based on $1,000,000+ sales for Grand County. Based on MLS Information from Grand County, Summit County, Telluride, Vail Valley, and Crested Butte (Powered by LiveBy). This data pertains to all residential properties between January 1st, 2023 - June 30th, 2023. This representation is based in whole or in part on data supplied by various Colorado resort MLS services. We do not guarantee nor are responsible for the accuracy of this data.
Grand County

Median Sold Price
$1,350,000
55 Properties Sold
75 Average Days on Market
Highest Sold Price
$2,895,000
January - June 2023 | 19 Fraser 11 $1,799,000 278 Granby 8 $1,428,112 100 Grand Lake 1 $1,295,000 340 Tabernash 6 $1,050,000 106 Winter Park 9 $1,827,500 275 Properties Sold Median Sold Price Average Days on Market Based on $1,000,000+ sales for Grand County (Powered by LiveBy). Based on Information from Grand County’s Board of Realtors. This representation is based in whole or in part on data supplied by the Grand County Board of Realtors on July 5, 2023. The Grand County Board of Realtors does not guarantee nor is in any way responsible for its accuracy. Data maintained by the Grand County Board of Realtors may not reflect all real estate activity in the market
Summit County
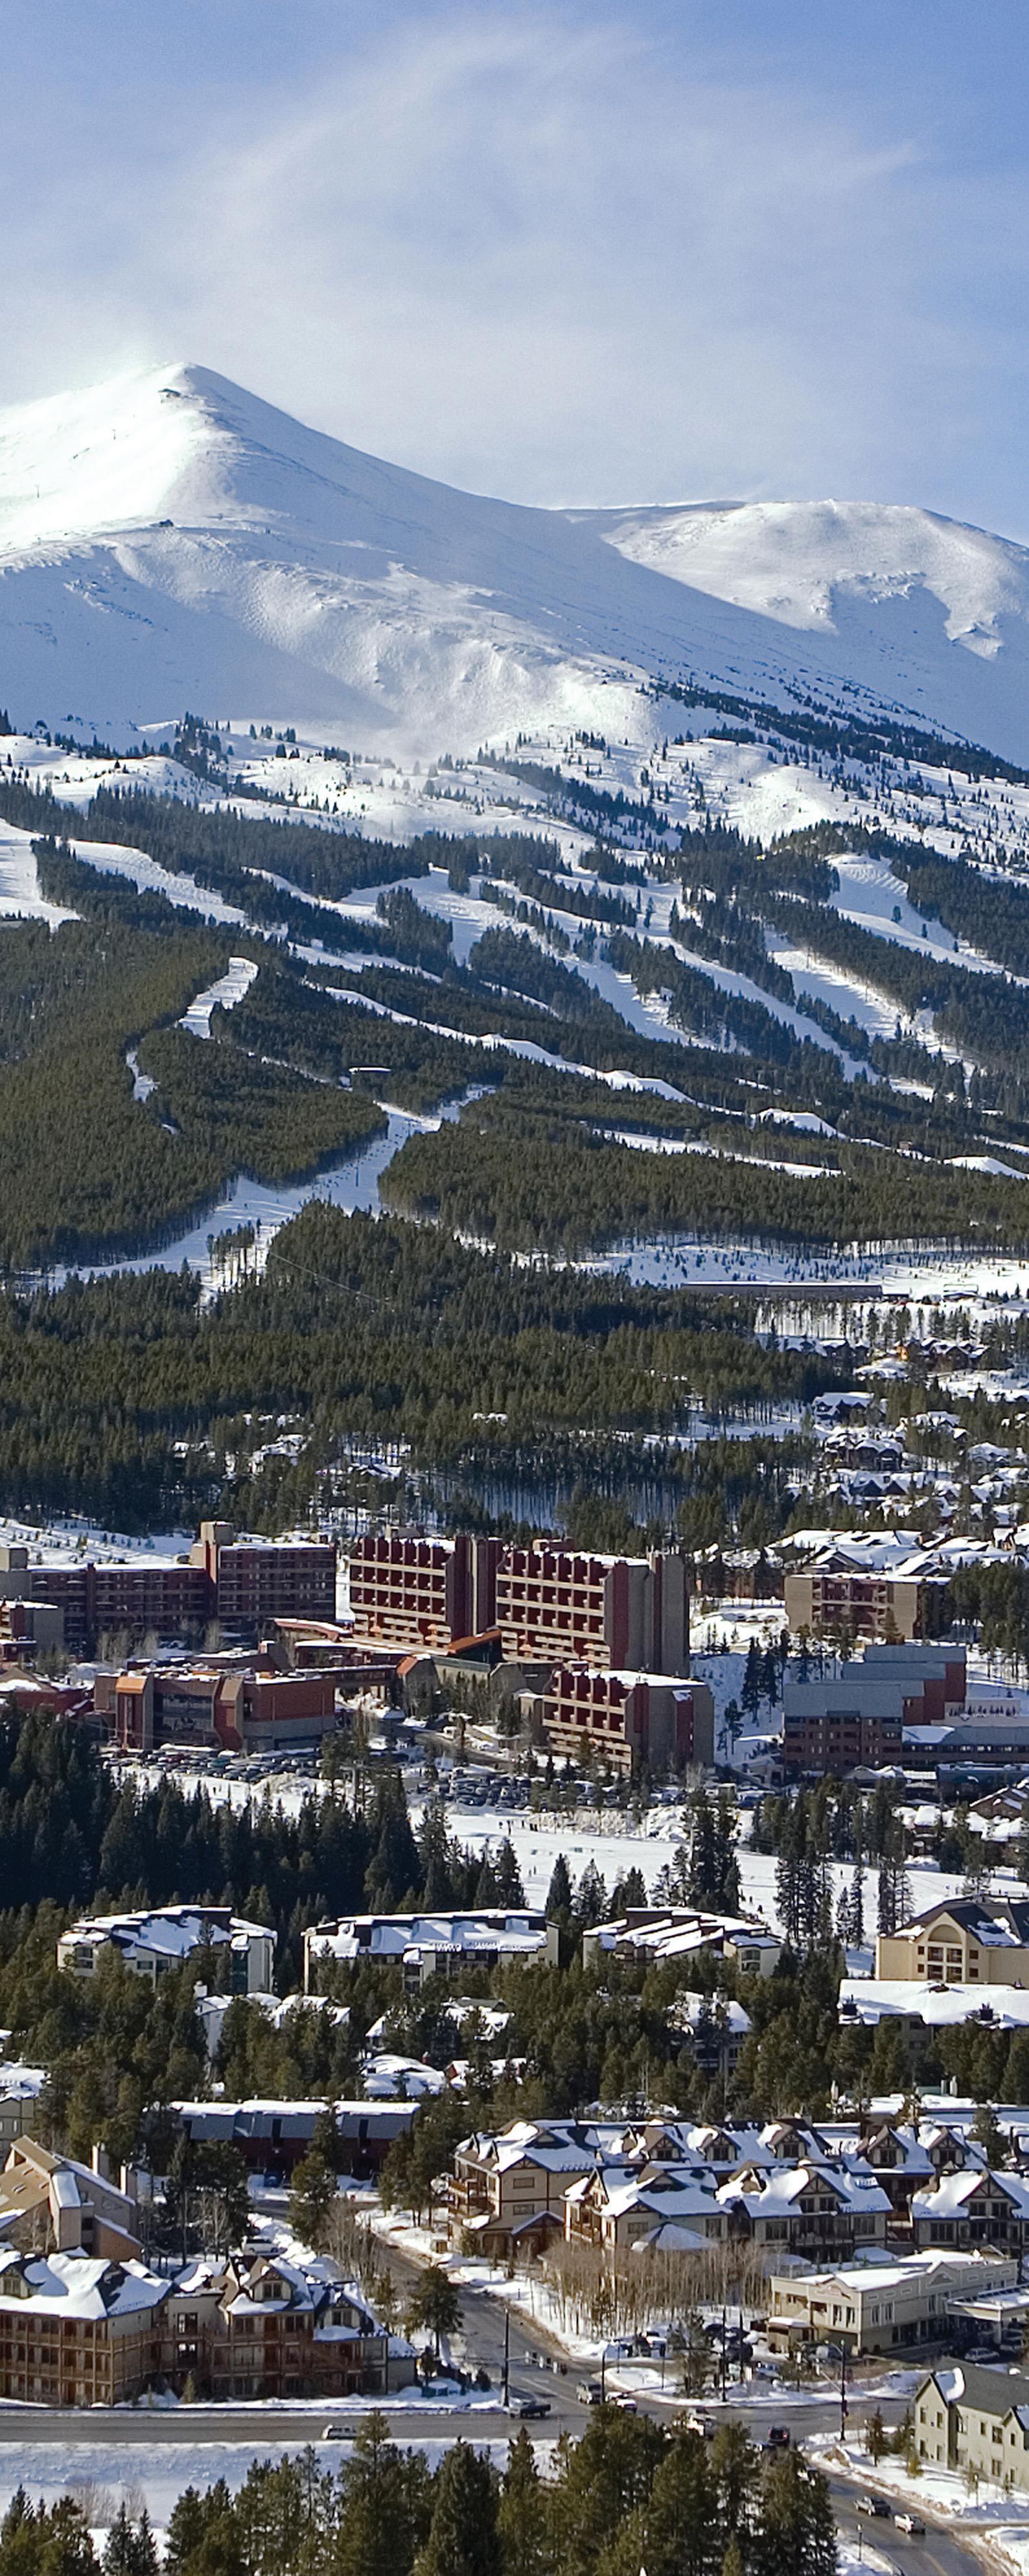
Median Sold Price
$2,650,000
71 Properties Sold
83 Average Days on Market
Highest Sold Price
$6,000,000
January - June 2023 | 21 Breckenridge 29 $2,623,719 97 Copper Mountain 1 $3,500,000 68 Keystone 7 $2,700,000 93 Properties Sold Median Sold Price Average Days on Market Based on $2,000,000+ sales for Summit County (Powered by LiveBy). Based on Information from Summit County’s Board of Realtors. This representation is based in whole or in part on data supplied by the Summit County Board of Realtors on July 5, 2023. The Summit County Board of Realtors does not guarantee nor is in any way responsible for its accuracy. Data maintained by the Summit County Board of Realtors may not reflect all real estate activity in the market
Crested Butte
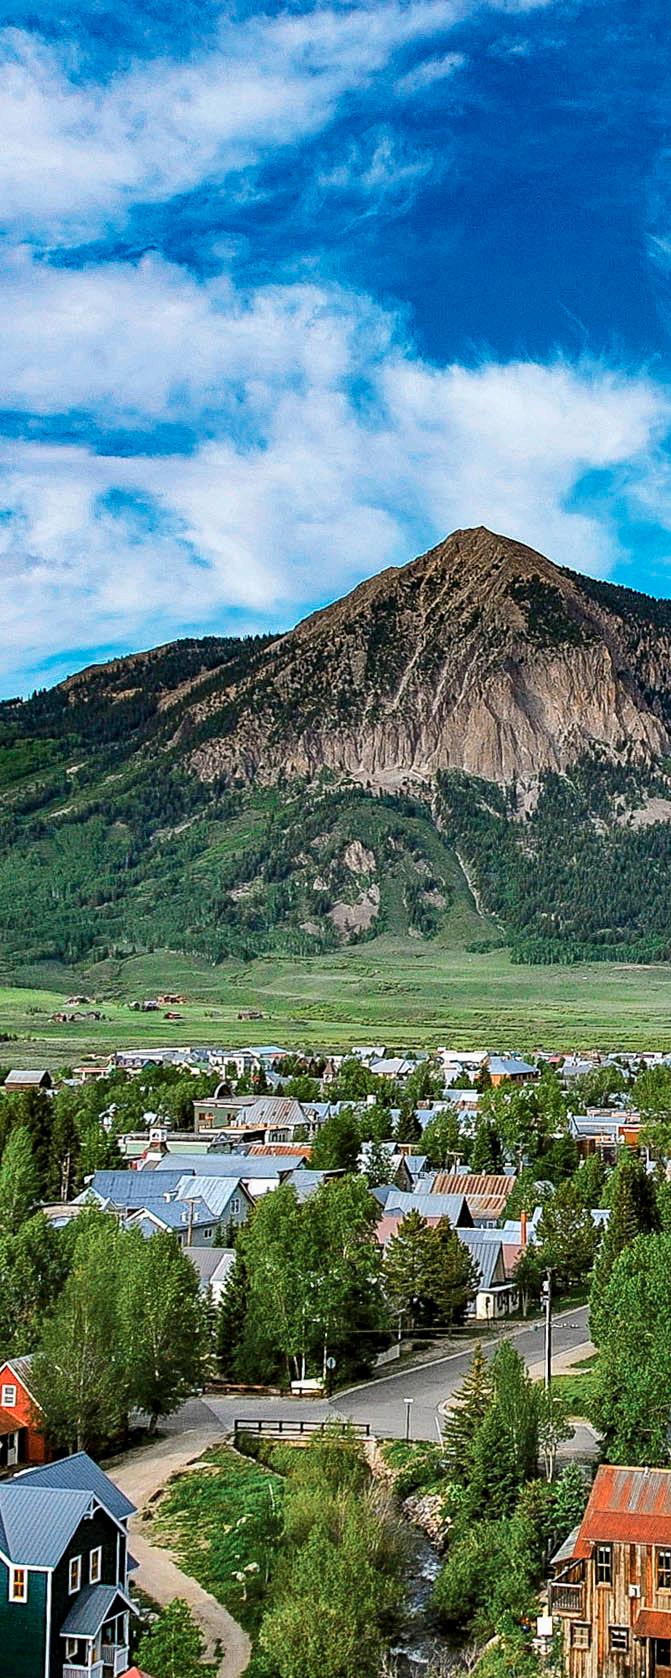
Median Sold Price
$2,537,500
8 Properties Sold
140 Average Days on Market
Highest Sold Price
$8,500,000
January - June 2023 | 23 Town of Crested Butte 1 $2,450,000 57 Mt. Crested Butte 3 $2,500,000 135 Rural Crested Butte 3 $4,200,000 204 Properties Sold Median Sold Price Average Days on Market
Based on all residential sales over $2,000,000 between January 1st, 2023 - June 30th, 2023. Based on data from the Gunnison – Crested Butte Association of REALTORS® MLS, Colorado Real Estate Network (CREN) (Powered by LiveBy). Verify with a local REALTOR®. All information is deemed reliable but not guaranteed. Data maintained by CREN MLS may not reflect all real estate activity in the market.
Vail Valley
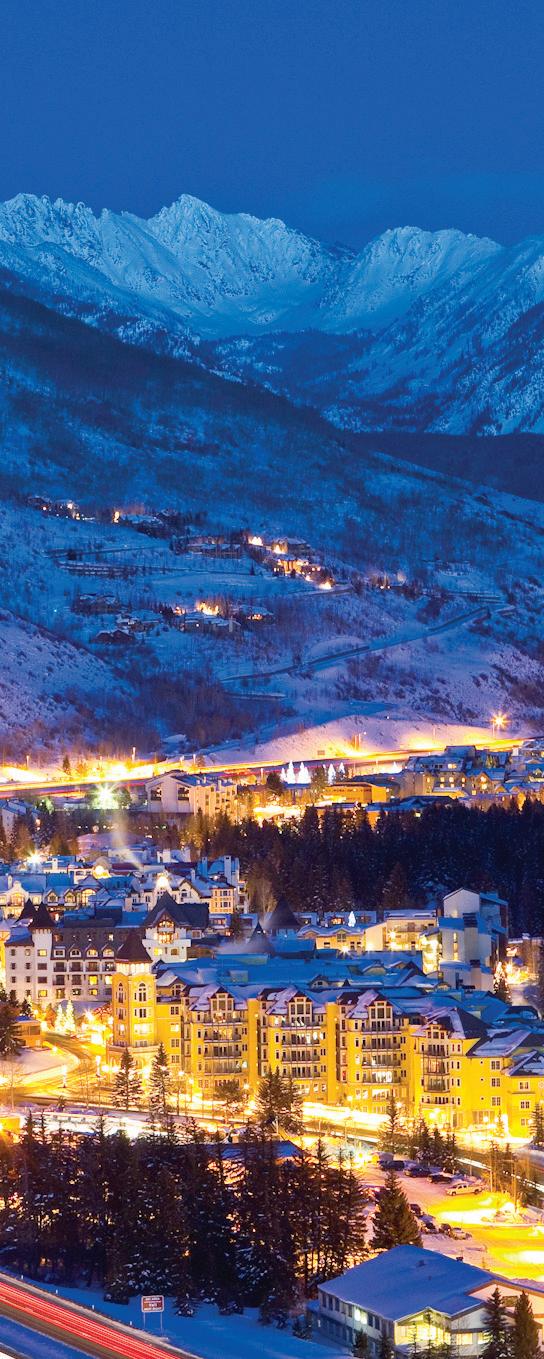
Median Sold Price
$4,201,500
88 Properties Sold
104 Average Days on Market
Highest Sold Price
$20,500,000
January - June 2023 | 25 Arrowhead 8 $3,662,500 110 Bachelor Gulch 10 $4,775,000 39 Beaver Creek 15 $5,000,000 139 Town of Vail 20 $4,300,000 56 Vail Village 14 $5,800,000 55 Lionshead 6 $3,997,500 60 Vail Golf Course 2 $5,065,000 2 Mountain Star 1 $6,750,000 278 Properties Sold Median Sold Price Average Days on Market Based on all residential sales over $2,000,000 between January 1st, 2023 - June 30th, 2023. Based on Information from Vail Board of Realtors® (Powered by LiveBy). This representation is based in whole or in part on data supplied by Vail Board of Realtors®. Vail Board of Realtors® does not guarantee nor is in any way responsible for its accuracy. Data maintained by Vail Board of Realtors® may not reflect all real estate activity in the market.
Telluride

Median Sold Price
$5,250,000
43 Properties Sold
169 Average Days on Market
Highest Sold Price
$13,400,000
January - June 2023 | 27 Town of Telluride 16 $5,807,500 195 Mountain Village 27 $5,150,000 154 *Surrounding Mesas 3 $3,925,000 201 Properties Sold Median Sold Price Average Days on Market Based on $3,000,000+ sales in Telluride and Mountain Village, all residential properties. Based on Information from the Telluride Association of Realtors ®. This representation is based in whole or in part on data supplied by the Telluride Association of Realtors ® on July 5, 2023. The Telluride Association of Realtors ® does not guarantee nor is in any way responsible for its accuracy. Data maintained by the Telluride Association of Realtors ® may not reflect all real estate activity in the market. *Deep
Creek Mesa, Hastings Mesa, Iron Springs/Horsefly Mesa, Specie Mesa, Sunshine Mesa, Turkey Creek Mesa, Wilson Mesa
Inspiring people to LIV the life they love.
© 2023 LIV Sotheby’s International Realty. All Rights Reserved. LIV Sotheby’s International Realty® is a registered trademark and used with permission. Each Sotheby’s International Realty office is independently owned and operated, except those operated by Sotheby’s International Realty, Inc. This material is based upon information which we consider reliable but because it has been supplied by third parties, we cannot represent that it is accurate or complete and it should not be relied upon as such. If your property is listed with a real estate broker, please disregard. It is not our intention to solicit the offerings of other real estate brokers. We are happy to work with them and cooperate fully. Equal Housing Opportunity.