Luxury Report


1 QUARTER 3 2022
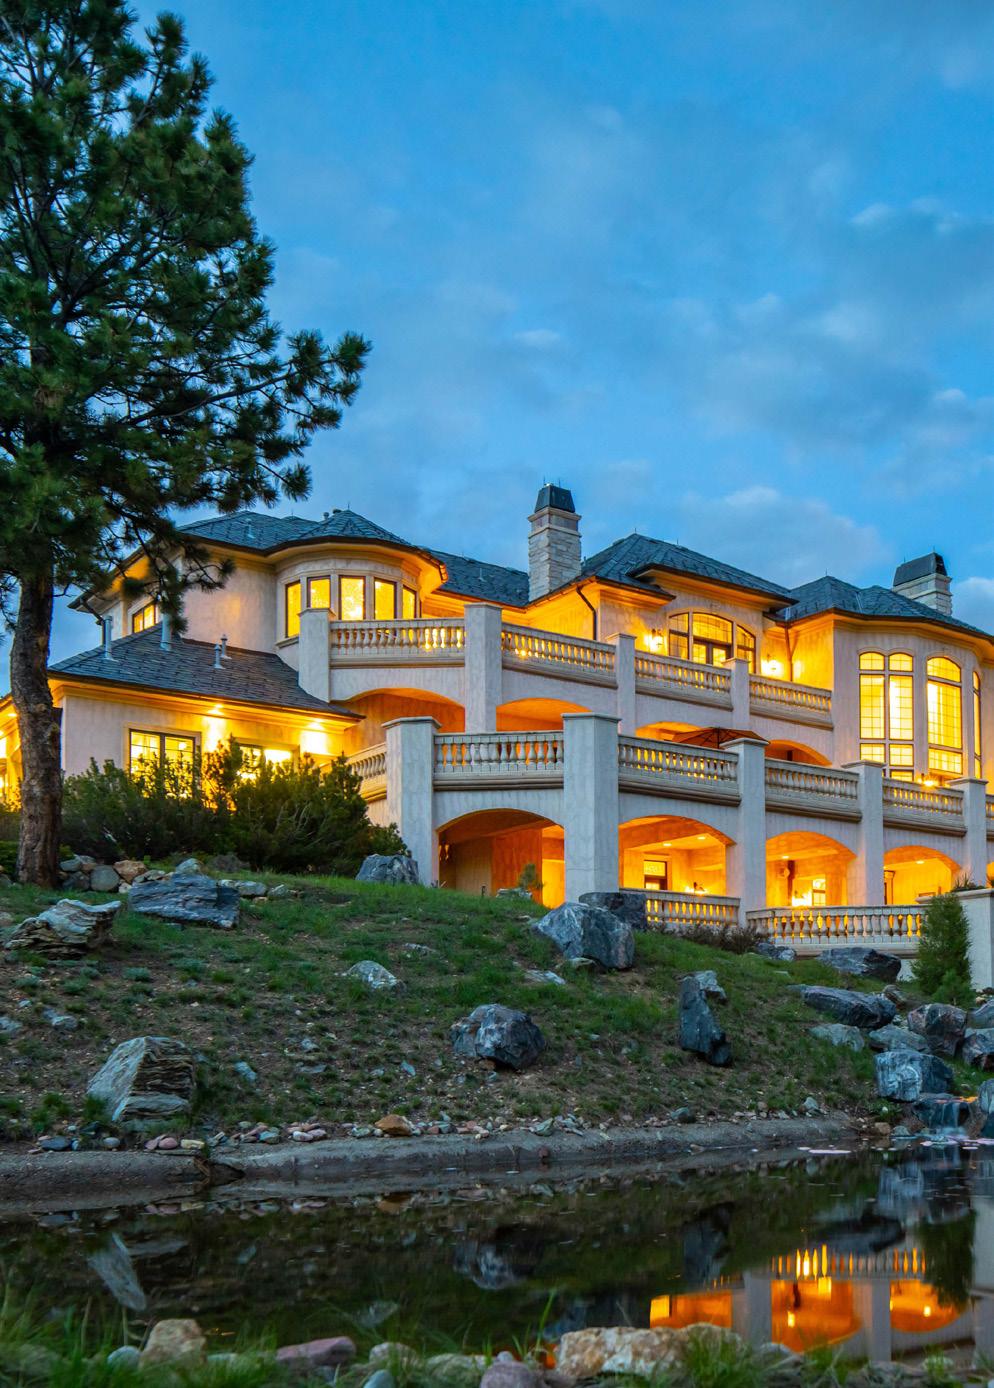
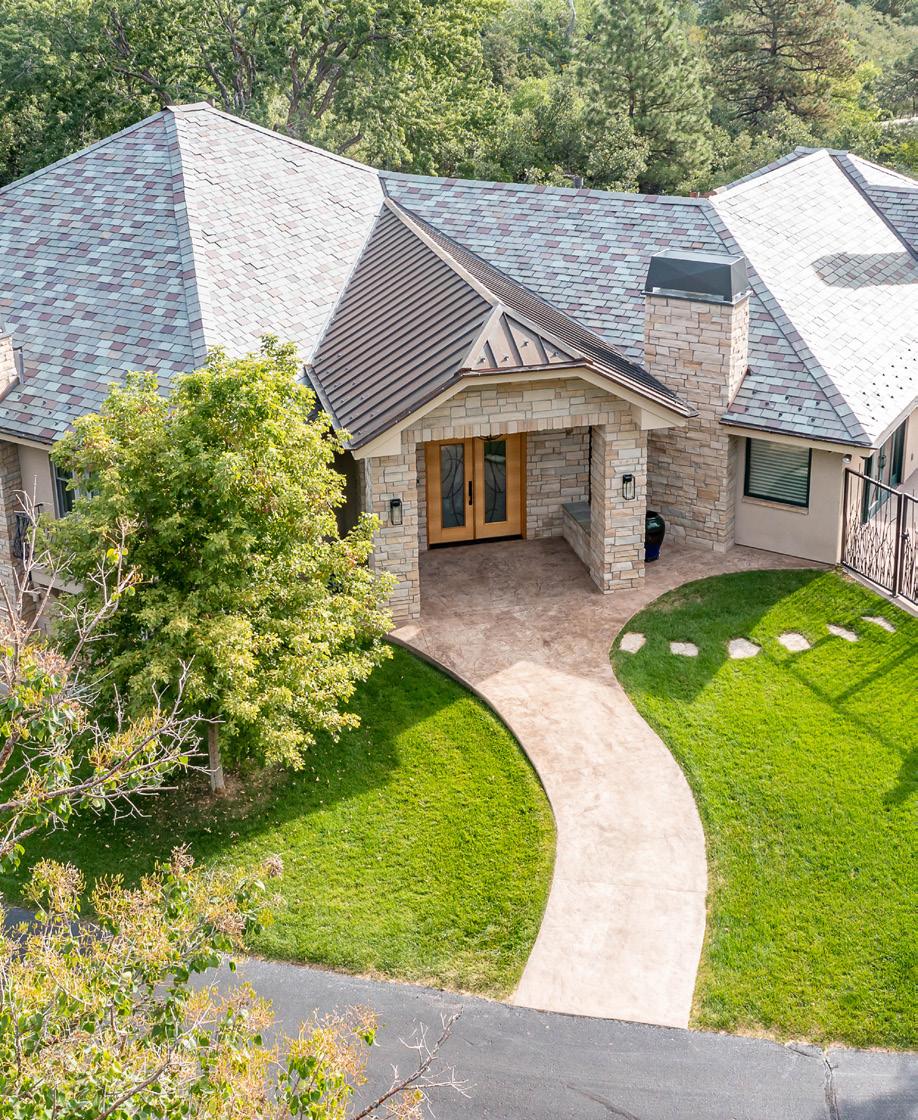
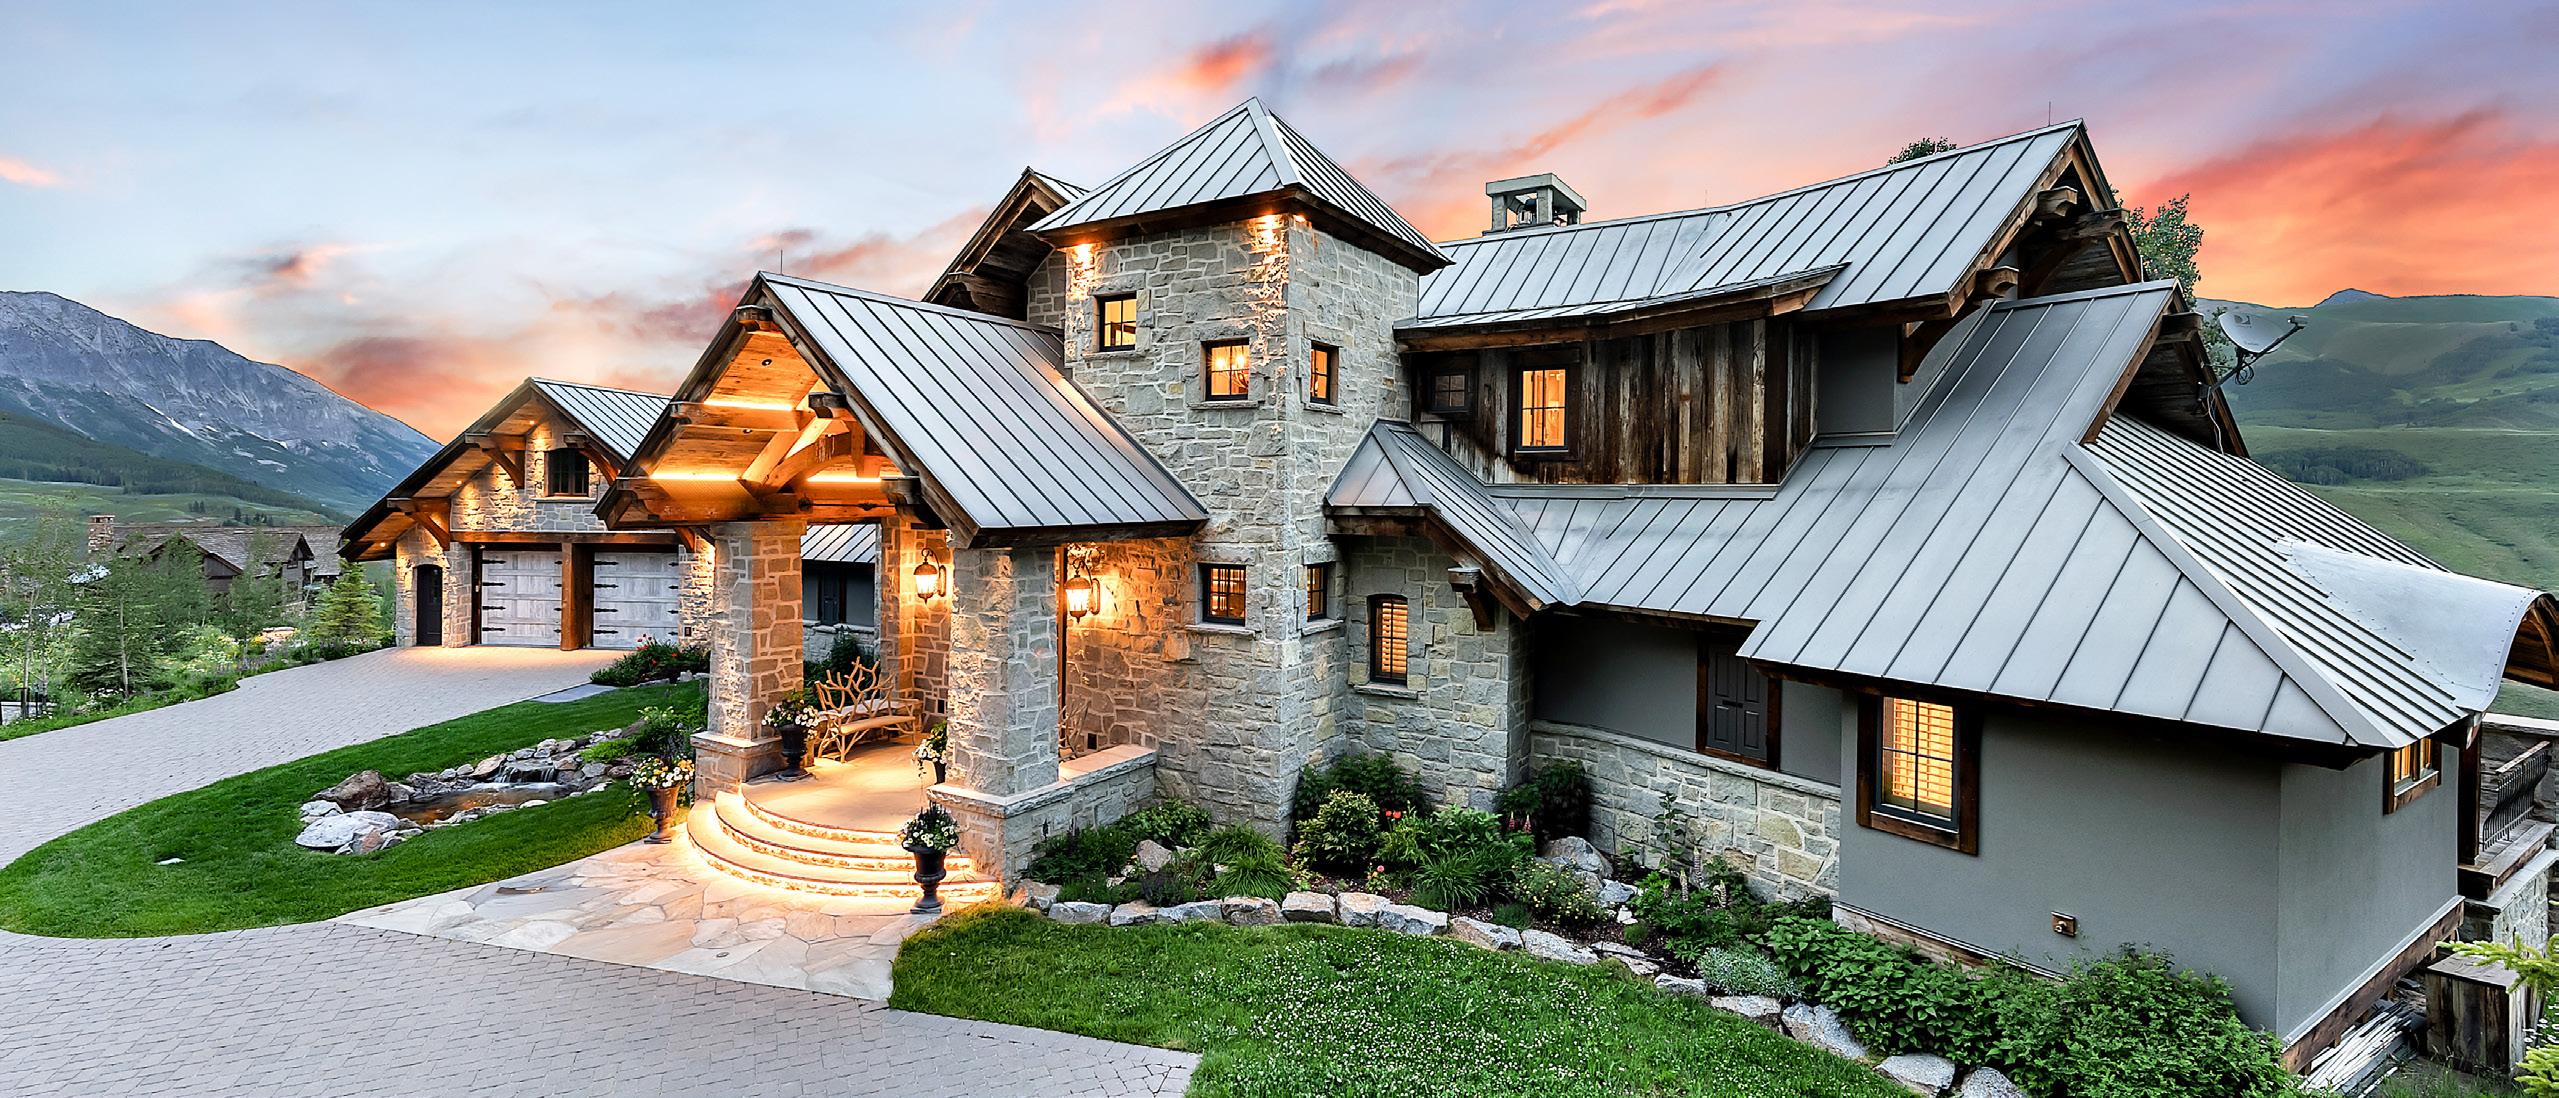
30726 Snowbird Lane, Evergreen
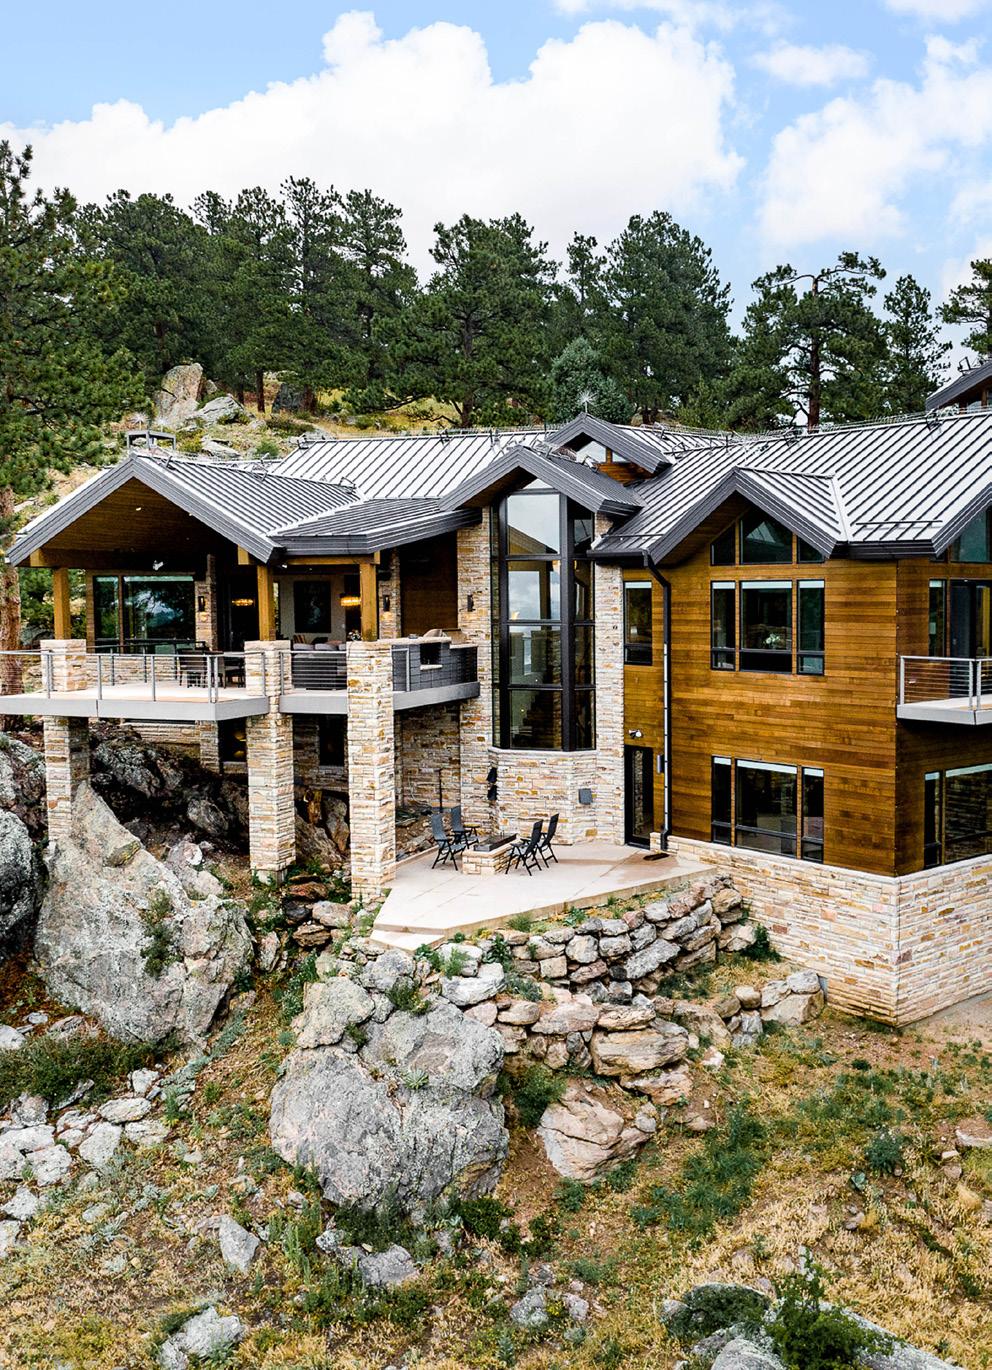
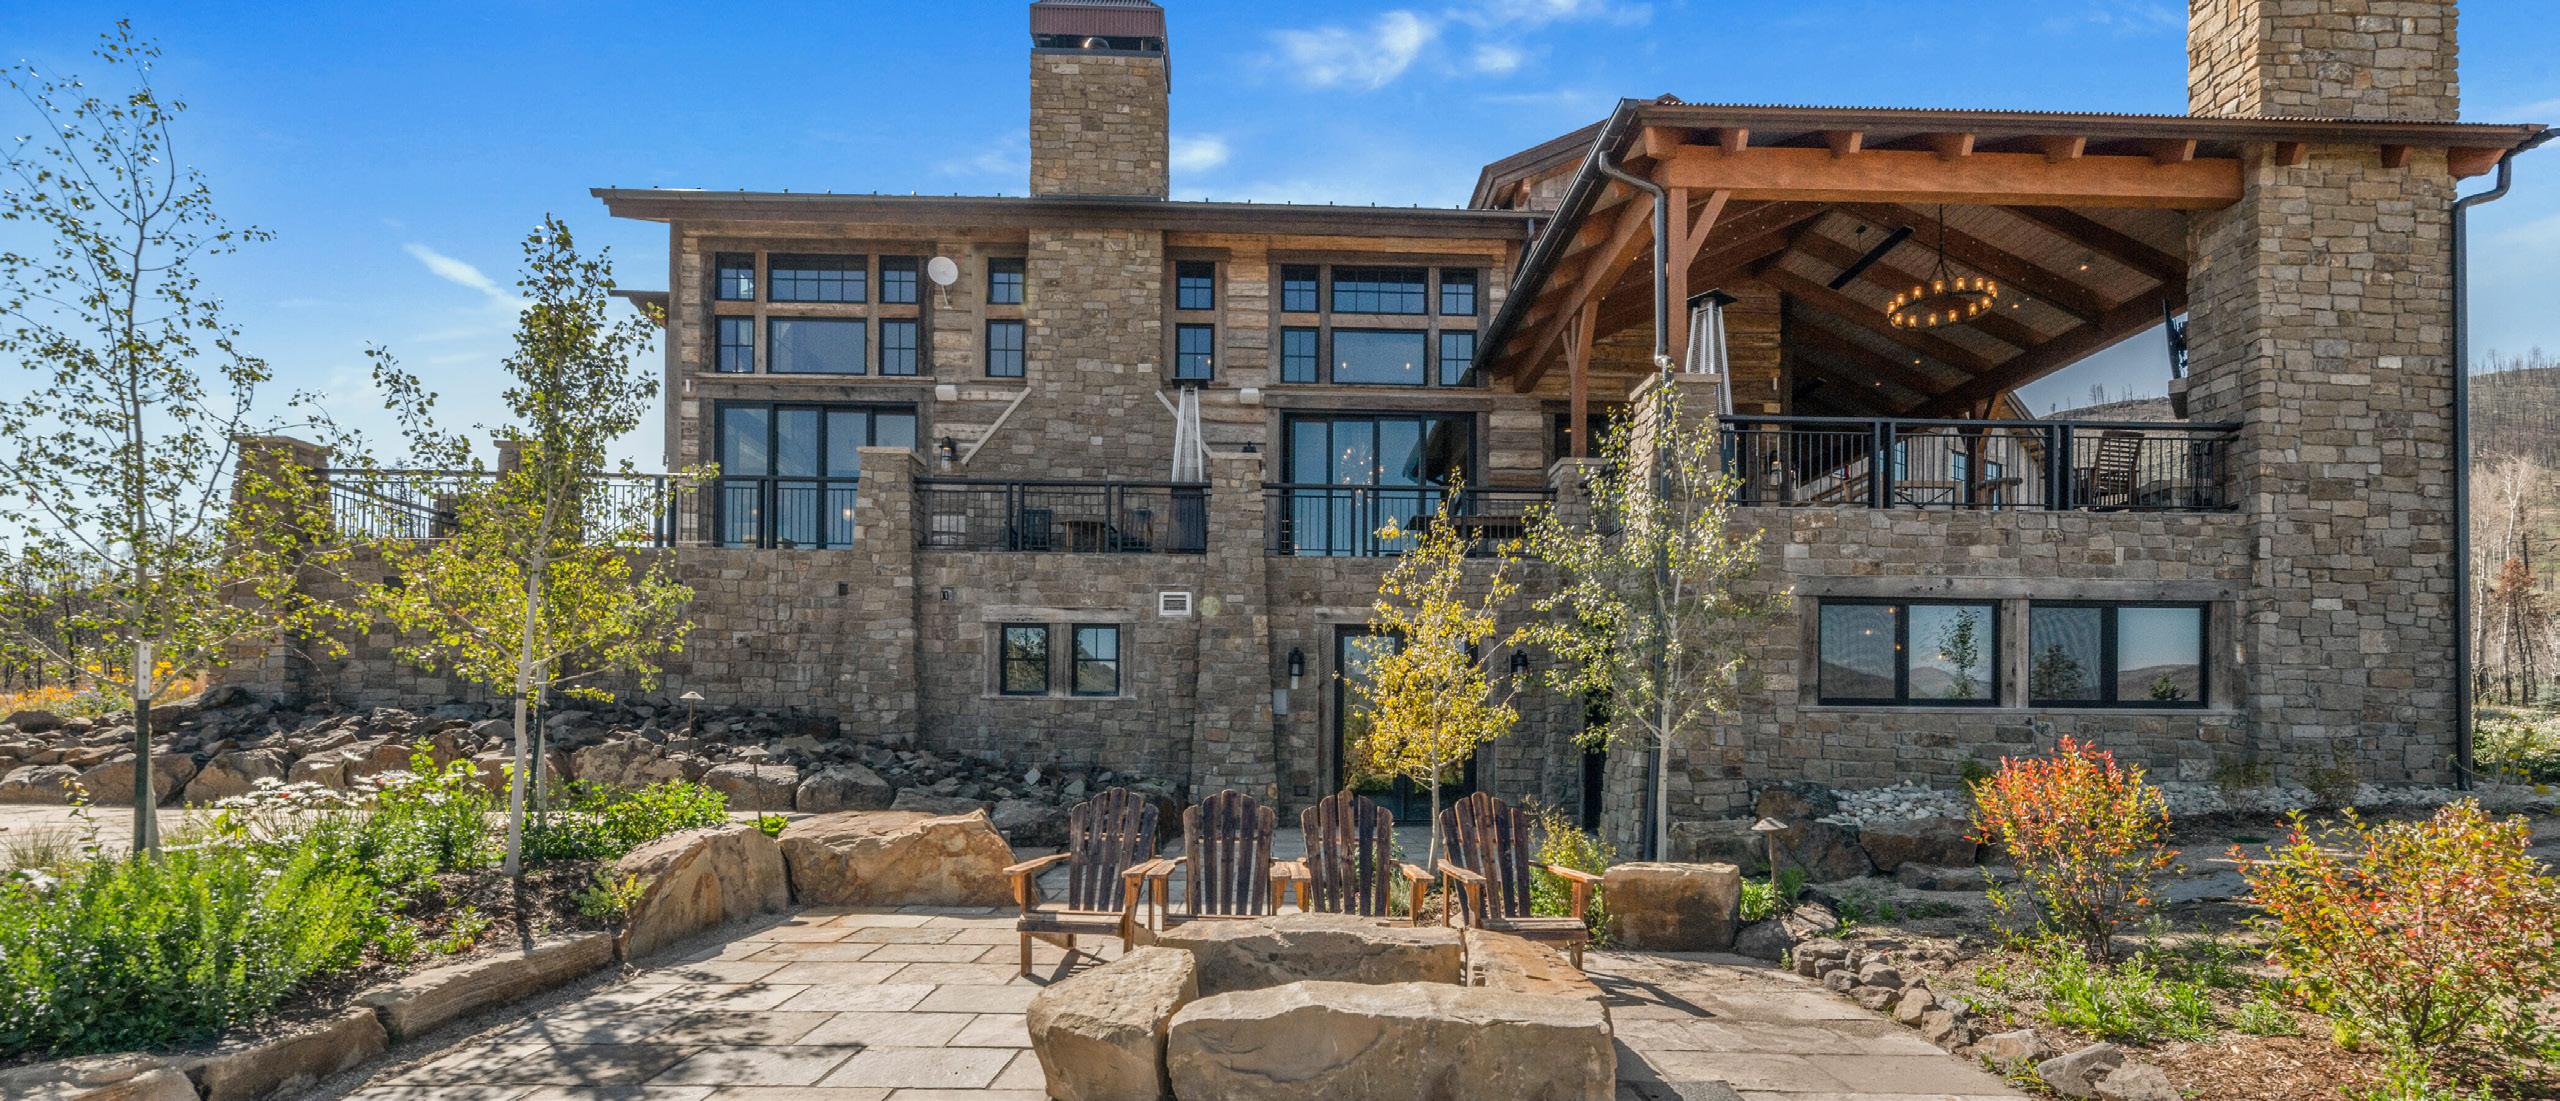
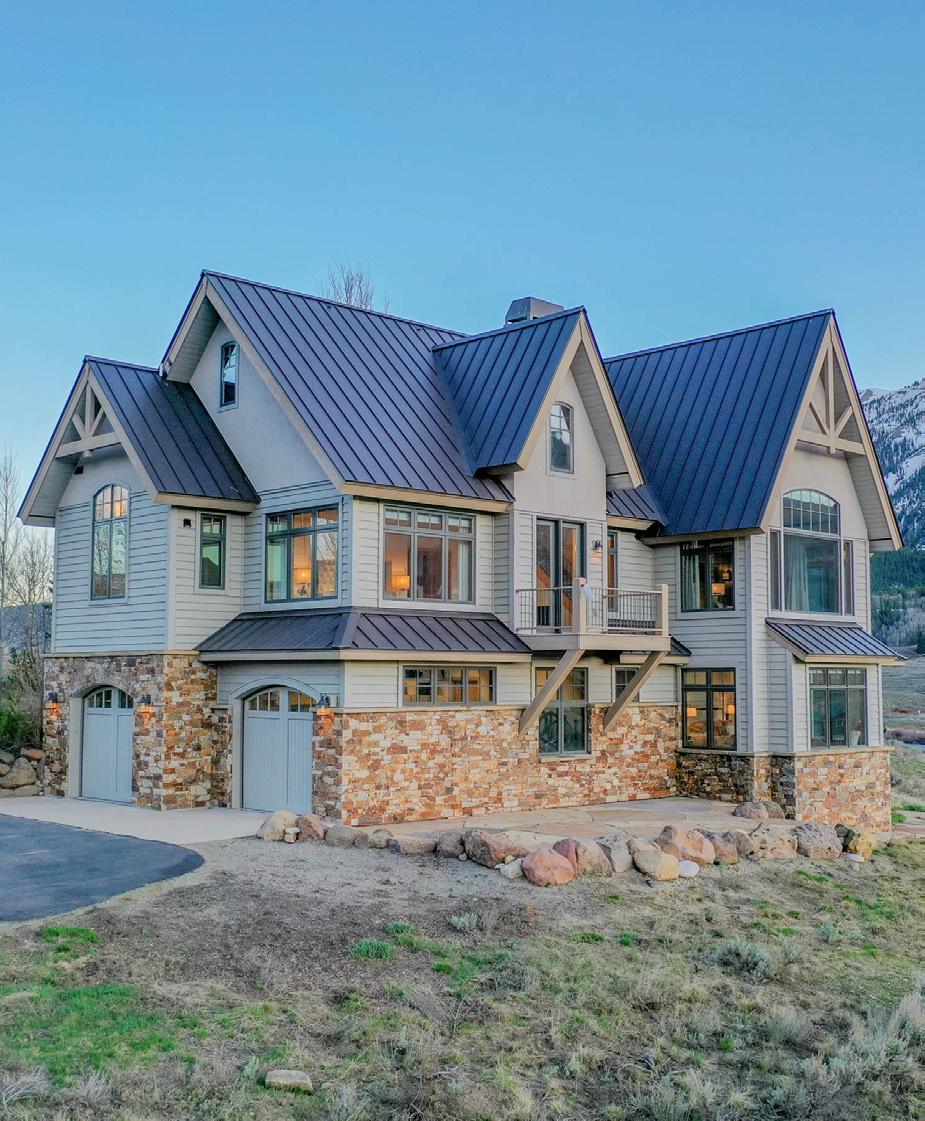
1090 Twisted Pine Road, Golden
REPORT
This year the real estate market throughout Colorado is experiencing a period of normalization following nearly two years of accelerated market speeds. While the most recent data paints a picture of a slowing pace of play, this deceleration is the breath of fresh air many consumers have been waiting for to finally reach their real estate goals. The luxury sector of the housing market has not been impacted by this trend to the degree that the rest of the market has experienced, which speaks to the sustained demand for homes of a certain caliber. However, market normalization is still being observed – allowing buying to make more competitive offers while sellers still benefit from a market tilted in their favor. For parties on either side of the closing table, the luxury real estate market in Colorado is still ripe with opportunities to create your dream life in your dream home.
LIV Sotheby’s International Realty produced a quarterly Residential Luxury Report, comparing January through September of this year to the previous year, measuring the performance of luxury real estate markets in some of Colorado’s most popular communities, analyzing the luxury market for Colorado’s diverse neighborhoods, the statistics in this report show performance for single-family homes and condos for Denver Metro ($1 million+), Colorado Springs ($1 million+), the Foothills ($1 million+), Boulder ($1 million+), the Vail Valley ($3 million+), Summit County ($2 million+), Grand County ($1 million+) Crested Butte ($2 million+), and Telluride ($3 million+).
2 RESIDENTIAL LUXURY
INTRODUCTION
03 DENVER METRO $1 Million + P. 18 BOULDER $1 Million + P. 29 CRESTED BUTTE $2 Million + P. 11 SOUTH METRO $1 Million + P. 21COLORADO SPRINGS $1 Million + P. 31 VAIL VALLEY $3 Million + P. 15FOOTHILLS $1 Million + P. 27 SUMMIT COUNTY $2 Million + P. 35 TELLURIDE $3 Million + P. 24 GRAND COUNTY $1 Million + P.
DENVER
Luxury homes in Denver Metro offer an upscale Colorado living experience near the excitement of the city while positioning residents just a short drive from some of the state’s most amazing outdoor spaces. Overall, the six counties across Denver Metro have experienced a 17.8% increase in the number of luxury homes sold through September of 2022 compared to the same period in 2021, with 4,446 luxury homes sold. The average sale price of those luxury homes decreased by 0.8%, bringing the average price for luxury homes in the community to $1,580,388. These increases resulted in a 16.9% rise in the total dollar volume sold, totaling $7,026,404,074.
The strength of the market was seen throughout the individual neighborhoods within Denver Metro as well. In Bow Mar/Bow Mar South, there was a 137.5% increase in the number of luxury homes sold, growing from eight homes sold through Q3 of 2021 to 19 homes sold so far this year. The Mayfair/Montclair and the Greenwood Village East neighborhoods also saw notable rises in luxury home sales, increasing by 15.4% and 13.3% respectively.
As more homebuyers compete for luxury real estate in Denver Metro, an upward trend in home prices has been observed. The Washington Park East/Central neighborhood, which is popular due to its access to the park and the activities and amenities that come with it, saw an 8.9% increase in sale prices for luxury homes. From January to September of this year, the average sold price for luxury homes in this neighborhood was $2,102,664. Cherry Creek North also saw home values appreciate, rising by 13.8% to reach an average sale price of $2,264,964.
Denver Metro’s limited inventory of available luxury homes has motivated
to purchase properties more quickly than last year. For example, luxury homes in the Country Club spent an average of 13 days on the market through September –81.7% less time than the same period last year.
3
buyers
Based on $1,000,000+ sales in Adams, Arapahoe, Broomfield, Denver, Douglas, and Jefferson Counties. This representation is based in whole or in part on data supplied from REColorado on October 5, 2022. REColorado does not guarantee nor is in any way responsible for its accuracy. Data maintained by REColorado may not reflect all real estate activity in the market.
METRO LUXURY MARKET January through September 2021 2022 % Change # of Properties Sold 3,775 4,446 17.8% Average Price Per Square Foot $514 $569 10.7% Average Days on Market 29 19 -34.5% Highest Price $9,000,000 $13,000,000 44.4% Average List Price $1,551,457 $1,495,659 -3.6% Average Sale Price $1,592,693 $1,580,388 -0.8% % Sold Price to List Price 101.1% 100.5% -0.6% Total Dollar Volume $6,012,415,591 $7,026,404,074 16.9% Counties: Adams, Arapahoe, Broomfield, Denver, Douglas, Jefferson DENVER METRO + $1,000,000 Sales
The
The
January
#
Average
Average
Highest
Average
Average
%
Total
January
#
Average
Average
Highest
Average
Average
%
Total
January
#
Average
Average
Highest
Average
Average
%
Total
1,569 1,715 9.3%
$601 $679 13.0%
30 17 -43.3%
$9,000,000 $9,000,000 0.0%
$1,593,774 $1,586,429 -0.5%
$1,624,566 $1,637,982 0.8%
101.3% 103.8% 2.5%
$2,548,944,449 $2,809,139,575 10.2%
Boundaries: City of Denver
41 39 -4.9%
$706 $868 23.0%
19 12 -36.8%
$5,000,000 $7,000,000 40.0%
$2,087,777 $2,337,287 12.0%
$2,164,460 $2,374,772 9.7%
103.9% 104.4% 0.5%
$88,742,850 $92,616,115 4.4%
Boundaries: Mississippi to Cherry Creek Drive South; University to Colorado
19 137.5%
$687 $754 9.7%
19 24 26.3%
$5,400,000 $5,350,000 -0.9%
$2,323,125 $2,302,079 -0.9%
$2,317,125 $2,313,553 -0.2%
99.6% 99.0% -0.5%
$18,537,000 $43,957,500 137.1%
Boundaries: West Quincy Avenue to West Bowles Avenue
4 DENVER ( CITY )
BONNIE BRAE/BELCARO
through September 2021 2022 % Change
of Properties Sold
Price Per Square Foot
Days on Market
Price
List Price
Sale Price
Sold Price to List Price
Dollar Volume
through September 2021 2022 % Change
of Properties Sold
Price Per Square Foot
Days on Market
Price
List Price
Sale Price
Sold Price to List Price
Dollar Volume
through September 2021 2022 % Change
of Properties Sold 8
Price Per Square Foot
Days on Market
Price
List Price
Sale Price
Sold Price to List Price
Dollar Volume
137.1%
total dollar volume in Bow Mar/ Bow Mar South increased by 137.1% January through September 2022 compared to that of 2021. BOW MAR/BOW MAR SOUTH 23.0%
average price per square foot in Bonnie Brae/Belcaro increased by 23.0% January through September 2022 compared to that of 2021.
increased by 20.9% January through September 2022 compared to that of
52.8%
(over 1
52.8%
to that of
5 CHERRY HILLS VILLAGE CHERRY HILLS VILLAGE CHERRY CREEK NORTHBoundaries: York to Colorado; 1st Avenue to 6th Avenue January through September 2021 2022 % Change # of Properties Sold 95 92 -3.2% Average Price Per Square Foot $733 $885 20.9% Average Days on Market 40 20 -50.0% Highest Price $7,625,000 $9,000,000 18.0% Average List Price $1,967,216 $2,308,264 17.3% Average Sale Price $1,989,687 $2,264,964 13.8% % Sold Price to List Price 97.0% 99.5% 2.6% Total Dollar Volume $189,020,300 $208,376,652 10.2% (Over 1 Acre, $2M+) Boundaries: Hampden to Belleview; Clarkson to Happy Canyon Road and Charlou January through September 2021 2022 % Change # of Properties Sold 43 25 -41.9% Average Price Per Square Foot $702 $881 25.5% Average Days on Market 53 25 -52.8% Highest Price $7,850,000 $13,000,000 65.6% Average List Price $3,895,000 $4,505,000 15.7% Average Sale Price $3,891,017 $4,533,880 16.5% % Sold Price to List Price 100.5% 100.4% -0.2% Total Dollar Volume $167,313,739 $113,347,000 -32.3% (Under 1 Acre, $2M+) Boundaries: Hampden to Belleview; Clarkson to Happy Canyon Road and Charlou January through September 2021 2022 % Change # of Properties Sold 37 30 -18.9% Average Price Per Square Foot $611 $778 27.4% Average Days on Market 35 11 -68.6% Highest Price $5,000,000 $7,100,000 42.0% Average List Price $3,040,569 $3,181,400 4.6% Average Sale Price $3,061,089 $3,436,124 12.3% % Sold Price to List Price 99.1% 106.5% 7.5% Total Dollar Volume $113,260,290 $103,083,705 -9.0%
The average number of days on market in Cherry Hills Village
acre) decreased by
January through September 2022 compared
20.9% The average sale price in Cherry Creek North
2021.
January through September
# of Properties Sold 27 17 -37.0%
Average Price Per Square
Average Days on
$508 $595 17.2%
15 10 -33.3%
Highest Price $3,500,000 $3,200,000 -8.6%
Average List Price $1,843,294 $2,035,887 10.4%
Average Sale Price $1,846,065 $2,052,481 11.2%
% Sold Price to
Price 100.8% 98.9% -1.9%
Total Dollar Volume $49,843,752 $34,892,169 -30.0%
Boundaries: South Polo Ridge Drive to West Bowles; Platte Canyon Road to South Platte River
January through September
Change
# of Properties Sold 22 11 -50.0%
Average Price Per Square Foot $751 $827 10.1%
Average Days on Market 71 13 -81.7%
Highest Price $6,075,000 $3,900,000 -35.8%
Average List Price $3,287,227 $2,590,455 -21.2%
Average Sale Price $3,268,665 $2,542,180 -22.2%
%
Total
Price
Price 97.7% 95.6% -2.1%
$71,910,633 $27,963,975 -61.1%
Boundaries:
-37.5%
$1,766,857
-14.0%
6
2021 2022 %
Sold
to List
Dollar Volume
COLUMBINE VALLEY
COUNTRY CLUB
2021 2022 % Change
Foot
Market
List
University to Downing 1st - 4th; Race to University 4th - 6th Boundaries: Holly to Monaco; Bayaud to 6th Avenue January through September 2021 2022 % Change # of Properties Sold 21 15 -28.6% Average Price Per Square Foot $579 $708 22.2% Average Days on Market 8 5
Highest Price $3,500,000 $4,250,000 21.4% Average List Price $1,680,381 $2,084,500 24.0% Average Sale Price
$2,128,367 20.5% % Sold Price to List Price 104.4% 108.6% 4.1% Total Dollar Volume $37,104,000 $31,925,500
CRESTMOOR 33.3% The average number of days on market in Columbine Valley decreased by 33.3% January through September 2022 compared to that of 2021. 22.2% The average price per square foot in Crestmoor increased by 22.2% January through September 2022 compared to that of 2021.
20.3%
(over 1
by 20.3% January
September 2022 compared to that of
(under
January through September 2022 compared to that of 2021.
by
7 GREENWOOD VILLAGE WEST GREENWOOD VILLAGE WEST GREENWOOD VILLAGE EASTBoundaries: I-25 to Havana; Belleview to Orchard January through September 2021 2022 % Change # of Properties Sold 30 34 13.3% Average Price Per Square Foot $463 $573 23.6% Average Days on Market 23 8 -65.2% Highest Price $2,310,000 $2,575,296 11.5% Average List Price $1,558,483 $1,684,556 8.1% Average Sale Price $1,576,489 $1,771,322 12.4% % Sold Price to List Price 100.3% 104.8% 4.5% Total Dollar Volume $47,294,667 $60,224,936 27.3% (Over 1 Acre) Boundaries: Orchard to Belleview; Clarkson to I-25 January through September 2021 2022 % Change # of Properties Sold 15 12 -20.0% Average Price Per Square Foot $601 $724 20.3% Average Days on Market 35 53 51.4% Highest Price $7,428,000 $5,998,000 -19.3% Average List Price $3,573,867 $3,688,333 3.2% Average Sale Price $3,410,247 $3,681,708 8.0% % Sold Price to List Price 96.5% 95.3% -1.2% Total Dollar Volume $51,153,700 $44,180,500 -13.6% (Under 1 Acre) Boundaries: Orchard to Belleview; Clarkson to I-25 January through September 2021 2022 % Change # of Properties Sold 51 48 -5.9% Average Price Per Square Foot $596 $652 9.4% Average Days on Market 19 11 -42.1% Highest Price $4,500,000 $6,725,000 49.4% Average List Price $2,345,950 $2,422,109 3.2% Average Sale Price $2,360,545 $2,463,721 4.4% % Sold Price to List Price 102.1% 103.1% 1.0% Total Dollar Volume $120,387,770 $118,258,588 -1.8%
The average price per square foot in Greenwood Village West
acre) increased
through
2021. 42.1% The average number of days on market in Greenwood Village West
1 acre) decreased
42.1%
January through September
# of
Average
Average
RANCH
78 60 -23.1%
$582 $743 27.7%
22 10 -54.5%
Highest Price $4,500,000 $8,000,000 77.8%
Average
Average
%
Total
January through September
# of
Average Price
Average Days
$1,890,037 $2,349,724 24.3%
$1,906,019 $2,391,648 25.5%
99.8% 101.8% 2.0%
$148,669,485 $143,498,884 -3.5%
Boundaries: Alameda to 6th; Colorado to Holly
10 7 -30.0%
$324 $548 68.9%
77 5 -93.5%
Highest Price $1,807,500 $3,000,000 66.0%
Average
$1,369,900 $1,901,143 38.8%
The average sold
percentage to list price in Huntington Trails/
increased by 7.2% January through September 2022 compared to that of 2021.
Average Sale
%
Total
The average number of days
$1,366,950 $2,048,143 49.8%
101.0% 108.3% 7.2%
$13,669,500 $14,337,000 4.9%
Boundaries: Lexington Place to 144th Avenue; McKay Lake to Huron Street
January
#
Average
Average
Highest
Average
Average
17 4 -76.5%
$408 $447 9.4%
8 3 -62.5%
$1,920,000 $2,127,500 10.8%
$1,533,412 $1,670,833 9.0%
$1,567,647 $1,772,250 13.1%
in Ken Caryl North
increased by 62.5% January through September 2022 compared to that of 2021.
%
Total
102.2% 107.0% 4.8%
$26,650,000 $10,633,500 -60.1%
Boundaries: Red Fox Lane to North Ranch Road; Golden Eagle Road to Blue Grouse Ridge Road
8 HILLTOP
HUNTINGTON TRAILS/LEXINGTON
2021 2022 % Change
Properties Sold
Price Per Square Foot
Days on Market
List Price
Sale Price
Sold Price to List Price
Dollar Volume
2021 2022 % Change
Properties Sold
Per Square Foot
on Market
List Price
Price
Sold Price to List Price
Dollar Volume
through September 2021 2022 % Change
of Properties Sold
Price Per Square Foot
Days on Market
Price
List Price
Sale Price
Sold Price to List Price
Dollar Volume
7.2%
price
Lexington
KEN CARYL NORTH
62.5%
on market
Ranch
33.3%
number of days
Mayfair/Montclair
through September
compared to that of
82.2%
by
through September
compared to that of
9 POLO RESERVE OBSERVATORY PARK MAYFAIR/MONTCLAIRBoundaries: Colorado to Quebec; 6th to Colfax January through September 2021 2022 % Change # of Properties Sold 39 45 15.4% Average Price Per Square Foot $492 $593 20.5% Average Days on Market 14 11 -21.4% Highest Price $1,895,000 $2,430,000 28.2% Average List Price $1,309,563 $1,489,975 13.8% Average Sale Price $1,341,206 $1,549,993 15.6% % Sold Price to List Price 100.7% 104.0% 3.3% Total Dollar Volume $52,307,028 $69,749,680 33.3% Boundaries: University to Colorado; Evans to Yale January through September 2021 2022 % Change # of Properties Sold 65 38 -41.5% Average Price Per Square Foot $588 $701 19.1% Average Days on Market 35 21 -40.0% Highest Price $3,870,000 $5,396,000 39.4% Average List Price $2,124,447 $2,521,788 18.7% Average Sale Price $2,150,923 $2,555,833 18.8% % Sold Price to List Price 99.1% 101.1% 2.1% Total Dollar Volume $139,810,022 $97,121,640 -30.5% Boundaries: North of Mineral; South of Arabian Place; West of the S Platte River; East of S. Platte Canyon Road January through September 2021 2022 % Change # of Properties Sold 7 2 -71.4% Average Price Per Square Foot $522 $654 25.2% Average Days on Market 45 8 -82.2% Highest Price $3,900,000 $3,200,000 -17.9% Average List Price $2,911,428 $2,850,000 -2.1% Average Sale Price $2,752,857 $2,757,500 0.2% % Sold Price to List Price 96.8% 97.4% 0.6% Total Dollar Volume $19,270,000 $5,515,000 -71.4%
The average
on market in
decreased by 21.4% January
2022
2021.
The average number of days on market in Polo Reserve decreased
82.2% January
2022
2021.
January
#
Average
Average
Highest
Average
Average
%
Total
January
# of
Average
Average
Highest
Average
Average
%
Total
5 2 -60.0%
$551 $645 16.9%
13 7 -46.2%
$2,350,000 $3,925,000 67.0%
$1,917,000 $3,200,000 66.9%
$1,929,000 $3,337,500 73.0%
100.98% 103.5% 2.5%
$9,645,000 $6,675,000 -30.8%
Boundaries: Federal Blvd to Zuni Street; High Prairie Way to 156th Avenue
108 113 4.6%
$759 $896 18.0%
19 19 0.0%
$4,375,000 $5,450,000 24.6%
$1,866,368 $2,018,254 8.1%
$1,930,040 $2,102,664 8.9%
102.4% 103.0% 0.6%
$208,444,311 $237,601,071 14.0%
Boundaries: Louisiana to Ellsworth, Ogden to University
10 SPRUCE MEADOWS
WASHINGTON PARK EAST/CENTRAL
through September 2021 2022 % Change
of Properties Sold
Price Per Square Foot
Days on Market
Price
List Price
Sale Price
Sold Price to List Price
Dollar Volume
through September 2021 2022 % Change
Properties Sold
Price Per Square Foot
Days on Market
Price
List Price
Sale Price
Sold Price to List Price
Dollar Volume
46.2% The average number of days on market in Spruce Meadows decreased by 46.2% January through September 2022 compared to that of 2021.
SOUTH METRO LUXURY
The South Metro luxury home market offers consumers more space than can typically be found near the city with just as many entertainment, outdoor activity, and shopping options. For this reason, the collection of neighborhoods that make up South Metro has become a popular place to invest in luxury properties.
Douglas County, which makes up much of the South Metro community saw a 17.9% increase in the number of luxury properties sold and a 2.6% increase in the average sold price through September of this year compared to January through September of last year. The combination of these increases resulted in a 21% increase in the total dollar volume sold within the luxury sector of the market.
Out of the eight luxury neighborhoods within the South Metro community, The Village at Castle Pines saw the most luxury home sales. Here, there were 81 homes sold during the first three quarters of the year – a 2.5% increase from the same time frame last year.
SOUTH
County
Luxury homes within the Heritage Estates neighborhood appreciated in
the most through Q3 of this year. Here, luxury homes sold for an average price of $2,577,965, a 46.6% increase from January through September of last year when the average price was $1,759,000. This drastic price increase is influenced by an impressive sale that closed for $3,094,824 earlier this year.
Heritage Hills proved to be a very popular community in the eyes of
through Q3 of 2021. Homes in this neighborhood saw a 56.4% decrease in average days on market, with most homes staying on the market for an average of just 17 days.
Based
$1,000,000+ sales in Douglas
11
price
consumers
on
County. Based on information from REColorado. This representation is based in whole or in part on data supplied from REColorado on September 5, 2022. REColorado does not guarantee nor is in any way responsible for its accuracy. Data maintained by REColorado may not reflect all real estate activity in the market.
MARKET January through September 2021 2022 % Change # of Properties Sold 820 967 17.9% Average Price Per Square Foot $433 $475 9.9% Average Days on Market 32 22 -31.3% Highest Price $4,350,000 $8,040,000 84.8% Average List Price $1,492,658 $1,484,079 -0.6% Average Sale Price $1,510,837 $1,550,737 2.6% % Sold Price to List Price 100.0% 100.0% 0.0% Total Dollar Volume $1,238,886,138 $1,499,562,345 21.0% Douglas
METRO + $1,000,000 Sales
January
# of
Average
Average
57 -23.0%
$438 $503 15.0%
8 18 125.0%
Highest Price $2,725,000 $4,400,000 61.5%
Average
Average Sale
%
Total
$1,477,815 $1,718,930 16.3%
$1,492,547 $1,727,700 15.8%
100.3% 97.9% -2.4%
$110,448,500 $98,478,900 -10.8%
Boundaries: South of Wildcat Reserve Pkwy; East of Weathersfield Way, West of Red Sun Ct
January through
# of
Average Price
Average
2 5 150.0%
$342 $449 31.2%
53 8 -84.9%
Highest Price $1,650,000 $2,605,000 57.9%
Average
Average Sale
%
Total
January
#
Average
Highest
Average
Average
%
$1,349,750 $1,742,800 29.1%
$1,437,500 $1,787,000 24.3%
104.3% 101.0% -3.2%
$2,875,000 $8,935,000 210.8%
5 -54.5%
$553 22.7%
16 -76.1%
$2,500,000 $3,094,824 23.8%
$1,742,909 $2,694,000 54.6%
$1,759,000 $2,577,965 46.6%
100.1% 97.1% -3.0%
$19,349,000 $12,889,824 -33.4%
12 BACKCOUNTRY
FALCON HILLS
through September 2021 2022 % Change
Properties Sold 74
Price Per Square Foot
Days on Market
List Price
Price
Sold Price to List Price
Dollar Volume
September 2021 2022 % Change
Properties Sold
Per Square Foot
Days on Market
List Price
Price
Sold Price to List Price
Dollar Volume
through September 2021 2022 % Change
of Properties Sold 11
Price Per Square Foot $450
Average Days on Market 67
Price
List Price
Sale Price
Sold Price to List Price
Total Dollar Volume
HERITAGE ESTATES 61.5% The highest sale price in Backcountry increased by 61.5% January through September 2022 compared to that of 2021. 76.1% The average number of days on market in Heritage Estates decreased by 76.1% January through September 2022 compared to that of 2021.
6.8%
September
to
September
compared to that of
13 RAVENNA KEENE RANCH HERITAGE HILLS January through September 2021 2022 % Change # of Properties Sold 42 30 -28.6% Average Price Per Square Foot $406 $462 14.0% Average Days on Market 39 17 -56.4% Highest Price $2,500,000 $2,500,025 0.0% Average List Price $1,476,043 $1,608,200 9.0% Average Sale Price $1,481,073 $1,633,180 10.3% % Sold Price to List Price 99.3% 98.1% -1.2% Total Dollar Volume $62,205,072 $48,995,389 -21.2% Boundaries: South Butte Circle to Castle Butte Drive; South Peak View Drive to West Tomah Road January through September 2021 2022 % Change # of Properties Sold 17 17 0.0% Average Price Per Square Foot $474 $464 -2.0% Average Days on Market 10 28 180.0% Highest Price $3,270,000 $2,892,000 -11.6% Average List Price $1,589,841 $1,709,844 7.5% Average Sale Price $1,594,706 $1,702,390 6.8% % Sold Price to List Price 99.6% 95.9% -3.8% Total Dollar Volume $27,110,000 $28,940,624 6.8% January through September 2021 2022 % Change # of Properties Sold 15 14 -6.7% Average Price Per Square Foot $732 $940 28.6% Average Days on Market 108 66 -38.9% Highest Price $4,100,000 $3,950,000 -3.7% Average List Price $2,657,727 $2,649,500 -0.3% Average Sale Price $2,575,467 $2,599,998 1.0% % Sold Price to List Price 96.4% 99.9% 3.7% Total Dollar Volume $38,632,000 $36,399,970 -5.8% 6.8% The average home sale price in Keene Ranch increased by
January through
2022 compared
that of 2021. 28.6% The average price per square foot in Ravenna increased by 28.6% January through
2022
2021.
The
Spirit
CASTLE
number
through September
compared to that of 2021.
January through September
# of Properties Sold 6 3 -50.0%
Average Price Per Square Foot $388 $352 -9.3%
Average Days on Market 179 98.36 -45.1%
Highest Price $2,265,000 $1,500,000 -33.8%
Average List Price $1,592,915 $1,486,666 -6.7%
Average Sale Price $1,606,667 $1,470,000 -8.5%
% Sold Price to List Price 95.6% 98.4% 2.9%
Total Dollar Volume $9,640,000 $4,410,000 -54.3%
January through September
Change
# of Properties Sold 79 81 2.5%
Average Price Per Square Foot $515 $574 11.5%
Average Days on Market 39 25 -35.9%
Highest Price $4,295,000 $4,595,000 7.0%
Average List Price $1,879,401 $1,896,392 0.9%
Average Sale Price $1,872,571 $1,898,710 1.4%
% Sold Price to List Price 100.2% 99.4% -0.7%
Total Dollar Volume $147,933,071 $153,795,480 4.0%
Boundaries: US 85 & Copper Blush to Northwood; Daniels Park to Gate 5, Country Club to I-25
14 SPIRIT RIDGE THE VILLAGE AT
PINES
2021 2022 % Change
2021 2022 %
45.1%
average
of days on market in
Ridge decreased by 45.1% January
2022
FOOTHILLS LUXURY MARKET
The Foothills, a community beloved for its nearness to nature and captivating views of the Front Range, saw an influx of luxury real estate activity during the first three quarters of 2022. As a whole, the number of luxury listings sold through September 2022, compared to the same time period in 2021, grew by an impressive 32.9%, totaling 946 luxury homes sold. Increased demand for high-end homes in this area raised the average sale price of luxury homes from $1,451,013 through Q3 in 2021 to $1,456,271 so far this year – a 0.4% increase. This community has seen total dollar volume sold in the luxury sector of the market rise by 33.3% through September, thanks to consumers’ need for lifestyle-focused, luxury homes in the Foothills.
Genesee saw the most luxury properties sold through September of this year, totaling 22 homes sold – a 24.1% decrease. This community also saw home prices increase. Through Q3, the average sale price for local luxury homes reached $1,673,935, which is 13.2% higher than last year.
Hangen Ranch saw one of the most notable appreciations in the average sale price for luxury homes in the Foothills. Luxury single-family homes in this community increased in average sold price by 27.8%, bringing the average sold price to $1,925,000.
have seen decreases in the average
market
to the high demand for listings in the Foothills. For example, luxury homes within Spring Ranch spent an average of 14 days on the market through September of this year compared to the same time frame last year, which is a 41.7% difference.
Based on $1,000,000+ sales in Jefferson County. Based on information from REColorado. This representation is based in whole or in part on data supplied from REColorado on September 5, 2022. REColorado does not guarantee nor is in any way responsible for its accuracy. Data maintained by REColorado may not reflect all real estate activity in the market.
15
Many communities
time luxury homes spent on the
due
January through September 2021 2022 % Change # of Properties Sold 712 946 32.9% Average Price Per Square Foot $311 $349 12.1% Average Days on Market 23 22 -4.3% Highest Price $5,440,000 $6,400,000 17.6% Average List Price $1,423,097 $1,386,815 -2.5% Average Sale Price $1,451,013 $1,456,271 0.4% % Sold Price to List Price 100.0% 101.0% 1.0% Total Dollar Volume $1,033,121,501 $1,377,632,228 33.3% FOOTHILLS Jefferson County + $1,000,000 Sales
January
#
GENESEE HANGEN RANCH
The average price per square foot in Hangen Ranch increased by 19.8% January through September 2022 compared to that of 2021.
HIWAN
RIDGE
Average
Average
Highest
Average
Average
%
Total
The average price per square foot in Ridge at Hiwan increased by 16.2% January through September 2022 compared to that of 2021.
22 -24.1%
$358 7.6%
18 20 11.1%
$2,200,000 $2,655,000 20.7%
$1,456,931 $1,699,473 16.6%
$1,479,171 $1,673,935 13.2%
101.2% 98.6% -2.5%
$42,895,950 $36,826,580 -14.1%
January through September
# of
Average
Average
Highest
Average
Average
%
Total
January through September
#
Average
Average
Highest
Average
Average
%
Total
Change
4 3 -25.0%
$415 $497 19.8%
11 15 36.4%
$1,922,222 $2,125,000 10.5%
$1,477,500 $1,600,000 8.3%
$1,506,181 $1,925,000 27.8%
103.3% 120.1% 16.2%
$6,024,722 $5,775,000 -4.1%
20 -4.8%
$287 $334 16.2%
9 17 88.9%
$2,600,000 $2,050,000 -21.2%
$1,472,010 $1,683,700 14.4%
$1,507,148 $1,676,562 11.2%
103.0% 98.7% -4.2%
$31,650,100 $33,531,241 5.9%
16
through September 2021 2022 % Change
of Properties Sold 29
Price Per Square Foot $333
Days on Market
Price
List Price
Sale Price
Sold Price to List Price
Dollar Volume
2021 2022 %
Properties Sold
Price Per Square Foot
Days on Market
Price
List Price
Sale Price
Sold Price to List Price
Dollar Volume
2021 2022 % Change
of Properties Sold 21
Price Per Square Foot
Days on Market
Price
List Price
Sale Price
Sold Price to List Price
Dollar Volume
AT
16.2%
19.8%
CHASE
17 RIVA
January through September 2021 2022 % Change # of Properties Sold 3 3 0.0% Average Price Per Square Foot $218 $272 25.1% Average Days on Market 111 4 -96.4% Highest Price $1,850,000 $1,510,000 -18.4% Average List Price $1,475,000 $1,301,667 -11.8% Average Sale Price $1,455,000 $1,356,667 -6.8% % Sold Price to List Price 97.8% 104.2% 6.5% Total Dollar Volume $4,365,000 $4,070,000 -6.8% SODA CREEK January through September 2021 2022 % Change # of Properties Sold 16 8 -50.0% Average Price Per Square Foot $349 $368 5.4% Average Days on Market 32 34 6.3% Highest Price $4,775,150 $4,598,500 -3.7% Average List Price $2,095,938 $2,510,000 19.8% Average Sale Price $2,003,693 $2,564,813 28.0% % Sold Price to List Price 96.0% 97.2% 1.3% Total Dollar Volume $32,059,090 $20,518,500 -36.0% January through September 2021 2022 % Change # of Properties Sold 4 1 -75.0% Average Price Per Square Foot $336 $385 14.5% Average Days on Market 24 14 -41.7% Highest Price $2,495,000 $2,200,000 -11.8% Average List Price $2,196,225 $2,200,000 0.2% Average Sale Price $2,130,000 $2,200,000 3.3% % Sold Price to List Price 94.6% 100.0% 5.8% Total Dollar Volume $8,520,000 $2,200,000 -74.2% SPRING RANCH 96.4% The average number of days on market in Riva Chase decreased by 96.4% January through September 2022 compared to that of 2021.
Boulder County is an eclectic community filled with plenty of natural spaces, a lively restaurant and entertainment scene, and one of the most desirable lifestyles in the country. Recently ranked as the No. 1 city in the nation to live in by U.S. News & World Report, Boulder is a popular destination for buying and selling luxury real estate.
Overall, Boulder County has seen a 9.2% increase in the number of luxury properties sold through Q3 of this year compared to the same time frame in 2021. The average sale price for luxury homes in this area decreased slightly by 1.2%, bringing the average price for local luxury properties to $1,751,371. The combination of these increases has boosted the total dollar volume sold by 7.8%, which brings the total to $1,963,287,036 through September of this year.
Looking at individual neighborhoods, Downtown Boulder had the most impressive increase in luxury listings sold. Through September of this year, there were 26 luxury homes sold, which is 18.2% more than during the same period in 2021. This community also saw the most appreciation through Q3, with average sale prices for luxury homes rising by 39.9% to reach an average price of $2,570,993.
The speed of the luxury real estate market in Boulder County increased over the course of the last 9 months. University Hill and Chautauqua had the quickest pace of sale out of the local
markets with homes in the area remaining on the market for an average of just 45 days. Other neighborhoods saw slightly longer average days on market for luxury homes, such as Boulder County
where homes spent 61 days on the market.
Based
18
luxury
Plains
on $1,000,000+ sales in Boulder County. Based on information from IRES, LLC. This representation is based in whole or in part on data supplied by IRES, LLC on September 5, 2022. IRES, LLC does not guarantee nor is in any way responsible for its accuracy. Data maintained by IRES,LLC may not reflect all real estate activity in the market. BOULDER LUXURY MARKET + $1,000,000 Sales January through September 2021 2022 % Change # of Properties Sold 1,027 1,121 9.2% Average Days on Market 67 59 -11.9% Highest Price $8,150,000 $10,000,000 23.0% Average Sale Price $1,772,803 $1,751,371 -1.2% % Sold Price to List Price 100.5% 102.0% 1.5% Total Dollar Volume $1,820,668,286 $1,963,287,036 7.8% BOULDER Boulder County
19 DOWNTOWN BOULDER BOULDER COUNTY PLAINS BOULDER (CITY) January through September 2021 2022 % Change # of Properties Sold 728 687 -5.6% Average Days on Market 67 64 -4.5% Highest Price $7,900,000 $10,000,000 26.6% Average Sale Price $1,838,834 $1,904,426 3.6% % Sold Price to List Price 100.3% 101.8% 1.5% Total Dollar Volume $1,338,671,007 $1,308,340,536 -2.3% Niwot, Somerset Meadows, White Hawk Ranch, Fairview Estates, Paragon Estates, Spanish Hills 22.7% The highest sale price in Boulder County Plains increased by 22.7% January through September 2022 compared to that of 2021. January through September 2021 2022 % Change # of Properties Sold 222 229 3.2% Average Days on Market 72 61 -15.3% Highest Price $8,150,000 $10,000,000 22.7% Average Sale Price $1,832,585 $1,780,546 -2.8% % Sold Price to List Price 99.7% 101.6% 1.9% Total Dollar Volume $406,833,811 $407,745,041 0.2% January through September 2021 2022 % Change # of Properties Sold 22 26 18.2% Average Days on Market 103 287 178.6% Highest Price $6,200,000 $4,100,000 -33.9% Average Sale Price $1,837,705 $2,570,993 39.9% % Sold Price to List Price 96.6% 100.9% 4.5% Total Dollar Volume $40,429,500 $66,845,814 65.3%
January through September
# of
The
2022
Change
Sold 653 603 -7.7%
Average Days on Market 69 67 -2.9%
Highest Price $7,900,000 $10,000,000 26.6%
Average Sale Price $1,866,143 $1,894,921 1.5%
%
Price to
Price 100.1% 101.4% 1.3%
Total Dollar Volume $1,218,591,143 $1,142,637,115 -6.2%
January through September
Change
# of Properties Sold 89 58 -34.8%
Average Days on Market 71 45 -36.6%
Highest Price $6,500,000 $6,875,000 5.8%
Average Sale Price $1,969,947 $2,392,019 21.4%
% Sold Price to List Price 99.8% 99.7% -0.1%
Total Dollar Volume $175,325,325 $138,737,090 -20.9%
20 FOOTHILLS COMMUNITIES
Pinebrook Hills, Boulder Heights, Lake of the Pines, Jamestown, Eldorado Springs
UNIVERSITY HILL & CHAUTAUQUA
2021
%
Properties
Sold
List
2021 2022 %
26.6%
highest sale price in the Foothills Communities decreased by 26.6% January through September 2022 compared to that of 2021.
COLORADO
Located just an hour south of Denver, Colorado Springs is a city that combined the very best of natural beauty and an exciting urban lifestyle. LIV Sotheby’s International Realty reports that there was a 32.6% increase in the number of luxury homes sold within El Paso and Teller County through Q3 of 2022 compared to the same time frame in 2021. So far this year, there were 419 high-end homes sold in this community. The average sale price of those homes decreased by 2% which brought the average sale price to $1,387,897 for the area.
Looking at the quantity of luxury real estate sales within the various communities that make up Colorado Springs, the most dramatic increase was seen in Monument where luxury home sales rose from 52 sales through Q3 of 2021 to 146 sales this year – a 180% increase. The Black Forest neighborhood had the second-highest number of luxury home sales with a total of 87 homes sold for more than $1,000,000.
In some areas, the average sale price for luxury homes rose as well. High-end homes in the Kissing Camels community sold for an impressive 28% higher price during the first three quarters of the year compared to the same period last year. Homes here sold for an average price of $1,599,148.
While the average days on market for both El Paso and Teller County was
days on market in
of this year, some individual neighborhoods experienced even faster market speeds. For example, luxury homes in Flying Horse remained on the market for an average of just 27 days through September.
21
37
Q3
Based on information from the Pikes Peak REALTOR® Services Corp. (“RSC”), for the period January 1, 2022 through September 5, 2022. RSC does not guarantee or is in any way responsible for its accuracy. Data maintained by RSC may not reflect all real estate activity in the market.
SPRINGS LUXURY MARKET + $1,000,000 Sales January through September 2021 2022 % Change Properties Sold 316 419 32.6% Average Price Per Square Foot $262 $280 6.9% Average Days on Market 48 37 -22.9% Highest Price $4,376,000 $7,000,000 60.0% Average List Price $1,455,770 $1,362,938 -6.4% Average Sales Price $1,416,150 $1,387,897 -2.0% % Sold Price to List Price 99.2% 100.1% 0.9% Total Dollar Volume $447,503,400 $581,528,843 29.9% COLORADO SPRINGS El Paso County & Teller County
The
The number of
January
Properties
Average
Average
Highest
Average
Average
%
Total
January through
Properties
Average
Average
Highest
Average
Average
%
Total
January
Properties
Average
Average
Highest
Average
Average
%
Total
60 87 45.0%
$260 $284 9.2%
29 43 48.3%
$2,650,000 $3,200,000 20.8%
$1,386,209 $1,416,035 2.2%
$1,359,367 $1,445,181 6.3%
99.40% 99.60% 0.2%
$81,562,020 $125,730,747 54.2%
79 67 -15.2%
$272 $255 -6.3%
53 57 7.5%
$4,376,000 $6,200,000 41.7%
$1,738,343 $1,502,173 -13.6%
$1,648,429 $1,582,388 -4.0%
98.50% 97.60% -0.9%
$130,225,891 $106,019,996 -18.6%
30 38 26.7%
$265 $247 -6.8%
27 27 0.0%
$3,800,000 $1,992,500 -47.6%
$1,390,705 $1,280,045 -8.0%
$1,390,505 $1,203,493 -13.4%
100.10% 100.30% 0.2%
$41,715,150 $45,732,734 9.6%
22 BLACK FOREST BROADMOOR
through September 2021 2022 % Change
Sold
Price Per Square Foot
Days on Market
Price
List Price
Sales Price
Sold Price to List Price
Dollar Volume
September 2021 2022 % Change
Sold
Price Per Square Foot
Days on Market
Price
List Price
Sales Price
Sold Price to List Price
Dollar Volume
through September 2021 2022 % Change
Sold
Price Per Square Foot
Days on Market
Price
List Price
Sales Price
Sold Price to List Price
Dollar Volume
54.2%
total dollar volume in Black Forest increased by 54.2% January through September 2022 compared to that of 2021. FLYING HORSE 26.7%
properties sold in Flying Horse increased by 26.7% January through September 2022 compared to that of 2021.
Properties
Average
Average
Highest
Average
January
Properties Sold
Average Price
Average
Highest
Average
Sales
$1,800,000
-11.2%
-1.8%
180.8%
19.3%
-30.6%
$2,150,000 $7,000,000 225.6%
$1,232,943 $1,358,819 10.2%
$1,243,621 $1,370,158 10.2%
$64,668,292
The total sales volume in Monument increased by 209.3% in the first half of 2022 compared to that of 2021.
23
through September 2021 2022 % Change
52 146
Per Square Foot $228 $272
Days on Market 36 25
Price
List Price
Average
Price
% Sold Price to List Price 100.50% 100.90% 0.4% Total Dollar Volume
$200,043,068 209.3% MONUMENT KISSING CAMELS 209.3%
January through September 2021 2022 % Change
Sold 13 20 53.8%
Price Per Square Foot $265 $427 61.1%
Days on Market 56 64 14.3%
Price
$4,390,265
Average List Price $1,305,000 $1,281,722
Sales Price $1,249,425 $1,599,148 28.0% % Sold Price to List Price 99.00% 106% 7.3% Total Dollar Volume $16,242,525 $31,982,960 96.9%
GRAND COUNTY LUXURY MARKET
Home to Colorado’s deepest natural lake, Grand County offers beautiful views of the waterfront, the mountains, and unforgettable sunsets. The luxury real estate market in this special community experienced a 27% boost in the number of properties sold through Q3 of 2022, in comparison to the same time frame last year. That increase in luxury home sales created a 26% rise in total dollar volume sold, which totaled $277,898,593 through September.
In the town of Granby, luxury single-family home sales rose by an impressive 77.3%, increasing from 22 homes sold through September of 2021 to 39 homes sold through September of this year. Winter Park also experienced a notable rise in luxury homebuying activity, with property sales increasing by 40%.
The Tabernash community saw luxury
prices appreciate through Q3 of this year, rising by 22.4% to $2,052,002. The real estate market in Winter Park also experienced an upward trend in
single-family home prices, which rose from $2,108,150 through September of 2021 to $2,157,977 through September of this year – a 2.4% increase.
Tabernash, the average
on market for
homes decreased by 39.1%. This accelerated market pace left homes in the area on the market for an average of 70 days through Q3 of this year.
24
single-family home
luxury
In
days
luxury single-family
January through September 2021 2022 % Change # of Properties Sold 137 174 27.0% Average Days on Market 115 132 14.8% Highest Price $4,600,000 $8,370,000 82.0% Average List Price $1,618,449 $1,601,724 -1.0% Average Sale Price $1,609,847 $1,597,118 -0.8% % Sold Price to List Price 100.4% 101.0% 0.6% Total Dollar Volume $220,549,104 $277,898,593 26.0% GRAND COUNTY + $1,000,000 Sales Based on $1,000,000+ sales for Grand County. Based on Information from Grand County’s Board of Realtors. This representation is based in whole or in part on data supplied by the Grand County Board of Realtors on September 5, 2022. The Grand County Board of Realtors does not guarantee nor is in any way responsible for its accuracy. Data maintained by the Grand County Board of Realtors may not reflect all real estate activity in the market.
-3.0%
average number of days on market
by 37.8% January through September 2022 compared to that of 2021.
-14.0%
-12.8%
numbers of properties sold in Granby increased by 77.3% January through September 2022 compared to that of 2021.
25 GRAND LAKE GRANBY FRASER January through September 2021 2022 % Change # of Properties Sold 24 20 -16.7% Average Days on Market 82 96 17.1% Highest Price $4,600,000 $3,400,000 -26.1% Average List Price $1,722,000 $1,705,300 -1.0% Average Sale Price $1,698,302 $1,641,662 -3.3% % Sold Price to List Price 99.2% 96.3% -2.9% Total Dollar Volume $40,759,250 $32,833,250 -19.4% January through September 2021 2022 % Change # of Properties Sold 29 30 3.4% Average Days on Market 119 164 37.8% Highest Price $4,100,000 $3,970,000 -3.2% Average List Price $1,772,583 $1,720,102
Average Sale Price $1,780,123 $1,728,297 -2.9% % Sold Price to List Price 101.7% 102.0% 0.2% Total Dollar Volume $51,623,592 $51,848,913 0.4% Single Family Homes Single Family Homes 37.8% The
in Fraser increased
77.3% The
Single Family Homes January through September 2021 2022 % Change # of Properties Sold 22 39 77.3% Average Days on Market 80 85 6.3% Highest Price $4,430,000 $2,025,000 -54.3% Average List Price $1,536,768 $1,322,154
Average Sale Price $1,538,613 $1,341,991
% Sold Price to List Price 100.1% 101.7% 1.6% Total Dollar Volume $33,849,500 $52,337,668 54.6%
The
$5,729,500
$4,785,000
-8.7%
-39.1%
$5,850,000
$1,669,800 $2,062,861 23.5%
$1,676,968 $2,052,002
-0.4%
$3,800,000
$2,229,900 $2,117,143 -5.1%
$2,108,150 $2,157,977 2.4%
of
$30,211,688
26 KREMMLING TABERNASH Single Family Homes January through September 2021 2022 % Change # of Properties Sold 16 18 12.5% Average Days on Market 115 70
Highest Price $3,500,000
67.1% Average List Price
Average Sale Price
22.4% % Sold Price to List Price 102.0% 101.6%
Total Dollar Volume $26,831,500 $36,936,050 37.7% Single Family Homes January through September 2021 2022 % Change # of Properties Sold 3 2 -33.3% Average Days on Market 449 126 -71.9% Highest Price $1,225,000 $8,370,000 583.3% Average List Price $1,276,667
348.8% Average Sale Price $1,150,000
316.1% % Sold Price to List Price 90.9% 83.0%
Total Dollar Volume $3,450,000 $9,570,000 177.4% WINTER PARK 177.4%
total sales volume in Kremmling increased by 177.4% January through September 2022 compared to that of 2021. January through September 2021 2022 % Change # of Properties Sold 10 14 40.0% Average Days on Market 78 301 285.9% Highest Price $2,899,000
31.1% Average List Price
Average Sale Price
% Sold Price to List Price 95.9% 102.0% 6.4% Total Dollar Volume $21,081,500
43.3% Single Family Homes 40.0% The number of properties sold in Winter Park increased by 40.0% January through September 2022 compared to that
2021.
SUMMIT COUNTY LUXURY
For those looking for breathtaking views, access to nature, and some of the most beautiful homes in Colorado, Summit County is the ultimate real estate destination. Through Q3 of this year, Summit County has experienced a boom in luxury homebuying and selling activity.
Overall, Summit County has seen a 6.1% increase in the number of luxury homes sold through September of this year compared to the same period of time in 2021. The average sold price of homes in this area decreased by 4.6%, which brings the average sale price for luxury homes to $3,007,296.
In Copper Mountain, a popular ski community, the number of luxury single-family homes sold rose by 300%, with four properties sold through September. Average sale prices for luxury listings in this resort town rose by 3.4%, bringing the average sale price for single-family homes in Copper Mountain to $3,982,769.
Breckenridge saw a decrease in the number of luxury homes sold through Q3 of this year. Through September, there were 74 single-family homes sold – a 24.5% difference from the same period in 2021. High-end homes here sold for an average price of $3,380,285, which is 3.9% less than the prior year.
Keystone also saw a dip in the number of luxury single-family homes sold, decreasing by 9.1%. However, homes here appreciated in price by an impressive 47.4%, bringing the average sale price to $3,995,500.
27
MARKET January through September 2021 2022 % Change # of Properties Sold 164 174 6.1% Average Price Per Square Foot $738 $844 14.4% Average Days on Market 56 32 -42.9% Highest Price $17,000,000 $12,200,000 -28.2% Average List Price $3,231,919 $3,084,684 -4.6% Average Sale Price $3,153,239 $3,007,296 -4.6% % Sold Price to List Price 98.0% 98.5% 0.5% Total Dollar Volume $549,676,213 $549,794,544 0.0% SUMMIT COUNTY + $2,000,000 Sales Based on $2,000,000+ sales in Summit County. Based on information from Summit Association of Realtors®. This representation is based in whole or in part on data supplied by Summit Association of Realtors® on September 5, 2022. Summit Association of Realtors® does not guarantee nor is in any way responsible for its accuracy. Data maintained by Summit Association of Realtors® may not reflect all real estate activity in the market.
January
#
Average
Average
Highest
Average
Average
%
Total
The
January
#
Average
Average
Highest
Average
Average
%
Total
#
Average
Average
Average
Total
-24.5%
$875 21.0%
34 -49.3%
$17,000,000 $12,200,000 -28.2%
$3,612,328 $3,503,432 -3.0%
$3,517,875 $3,380,285 -3.9%
97.8% 97.5% -0.3%
$344,751,775 $250,141,065 -27.4%
1 4 300.0%
$605 $766 26.5%
4 13 225.0%
$3,850,000 $5,431,074 41.1%
$3,995,000 $4,020,268 0.6%
$3,850,000 $3,982,769 3.4%
96.37% 99.0% 2.7%
$3,850,000 $15,931,074 313.8%
-9.1%
17.1%
-62.5%
$4,025,000 $4,375,000 8.7%
$2,755,818 $3,140,300 14.0%
$2,710,773 $3,995,500 47.4%
98.4% 96.1% -2.3%
$29,818,501 $29,955,000 0.5%
28
through September 2021 2022 % Change
of Properties Sold 98 74
Price Per Square Foot $723
Days on Market 67
Price
List Price
Sale Price
Sold Price to List Price
Dollar Volume
313.8%
total dollar volume in Copper Mountain increased by 313.8% January through September 2022 compared to that of 2021.
through September 2021 2022 % Change
of Properties Sold
Price Per Square Foot
Days on Market
Price
List Price
Sale Price
Sold Price to List Price
Dollar Volume
January through September 2021 2022 % Change
of Properties Sold 11 10
Price Per Square Foot $571 $668
Average Days on Market 48 18
Highest Price
List Price
Sale Price
% Sold Price to List Price
Dollar Volume
Single Family Homes Single Family Homes Single Family Homes BRECKENRIDGE COPPER MOUNTAIN KEYSTONE
CRESTED
Crested Butte boasts a tight-knit community surrounded by awe-inspiring scenery. Here, homebuyers will find stunning luxury homes, many of which have million-dollar views. This collection of neighborhoods within Gunnison County has seen a 35.6% decrease in the number of luxury properties sold through September this year compared to the same time frame in 2021. The average sale price of luxury homes in the area dipped by 0.4% while the average days spent on market for local homes decreased by 3.6% to reach 159 days on the market through Q3.
Rural Crested Butte saw the most luxury listings sold with a total of 15 homes sold through September of this year. The average sale price of those homes sold was $3,411,213 – a 12.2% increase from the same period the year prior. High-end listings in this area spent an average of 100 days on market through the first three quarters of the year.
In the Town of Crested Butte, there were five luxury
sold through September. Here, the average sale price was $3,940,000 and the average amount of time spent on the market was 319 days. In Mt. Crested Butte, there were slightly more luxury real estate sales, totaling seven through September. The average sale price of those homes was $3,037,514, making this the most affordable area in which to invest in a high-end home.
29
homes
Based on $2,000,000+ residential sales in Gunnison County. Based on data from the Gunnison County Association of Realtors® MLS, Colorado Real Estate Network (CREN) on September 5, 2022. Verify with a local Realtor®. All information is deemed reliable but not guaranteed. Data maintained by CREN MLS may not reflect all real estate activity in the market.
BUTTE LUXURY MARKET January through September 2021 2022 % Change # of Properties Sold 59 38 -35.6% Average Price Per Square Foot $972 $884 -9.0% Average Days on Market 165 159 -3.6% Highest Price $27,000,000 $11,550,000 -57.2% Average List Price $3,925,675 $3,801,368 -3.2% Average Sale Price $3,724,354 $3,707,652 -0.4% % Sold Price to List Price 94.9% 97.5% 2.8% Total Dollar Volume $219,736,900 $140,890,800 -35.9% CRESTED BUTTE + $2,000,000 Sales
Gunnison
County
January through
#
Average
Average
Highest
Average
Average
%
Total
January through September
# of
Average
Average
Highest
Average
Average Sale
%
Total
January through September
#
Average
Average
Highest
Average
%
5 -58.3%
$1,098 $1,398 27.3%
319 112.7%
$4,250,000 $5,100,000 20.0%
$3,262,000 $3,966,000 21.6%
$3,176,166 $3,940,000 24.0%
97.4% 99.3% 2.0%
$38,114,000 $19,700,000 -48.3%
Change
7 -50.0%
$628 $654 4.1%
113 168 48.7%
$5,700,000 $3,500,000 -38.6%
$3,131,785 $3,122,857 -0.3%
$3,003,714 $3,037,514 1.1%
95.9% 97.3% 1.4%
$42,052,000 $21,262,600 -49.4%
-11.8%
$910 $801 -12.0%
100 -43.5%
$4,200,000 $7,400,000 76.2%
$3,136,705 $3,534,800 12.7%
$3,039,355 $3,411,213 12.2%
96.9% 96.5% -0.4%
$51,669,040 $51,168,200 -1.0%
30
September 2021 2022 % Change
of Properties Sold 12
Price Per Square Foot
Days on Market 150
Price
List Price
Sale Price
Sold Price to List Price
Dollar Volume
2021 2022 %
Properties Sold 14
Price Per Square Foot
Days on Market
Price
List Price
Price
Sold Price to List Price
Dollar Volume
2021 2022 % Change
of Properties Sold 17 15
Price Per Square Foot
Days on Market 177
Price
Average List Price
Sale Price
Sold Price to List Price
Total Dollar Volume
Single Family Homes Single Family Homes Single Family Homes TOWN OF CRESTED BUTTE MT. CRESTED BUTTE RURAL CRESTED BUTTE 43.5% The average number of days on market in Rural Crested Butte decreased by 43.5% January through September 2022 compared to that of 2021. 27.3% The average sale price in the Town of Crested Butte increased by 27.3% January through September 2022 compared to that of 2021.
VAIL VALLEY LUXURY
Known for its upscale lifestyle, world-class ski resorts, and stunning mountain scenery, the Vail Valley has been a favorite community for consumers seeking a luxury living experience in Colorado. Through September of this year, compared to the same time frame in 2021, the number of luxury listings sold within Eagle County, which makes up the Vail Valley, decreased by 9.1%. Meanwhile, average sales prices rose by 6%, bringing the average sale price to $5,910,935.
This notable increase in luxury homebuying activity can be seen throughout some of the individual neighborhoods within the Vail Valley as well. In Arrowhead and the Vail Golf Course communities, the number of luxury homes sold rose by 36.4% and 16.7% respectively. Vail Village had the most luxury property sales through Q3, with 28 listings sold.
Luxury properties in Lionshead enjoyed a healthy appreciation in average sale price, rising by 38.3% to reach an average price of $8,223,333 through Q3. It should be noted that this increase was also influenced by a significant $30,875,000 sale that took place earlier this year.
The pace of the market in Vail Village increased through September of this year compared to the same period last year, with properties of all types selling 44.6% faster. Luxury listings in this iconic neighborhood remained on the market for an average of 82 days from January through September of 2022.
Based on $3,000,000+ sales in Eagle County. Based on information from Vail Board of Realtors®.
September 5,
Vail Board of Realtors® does
of Realtors®
in
31
This representation is based in whole or in part on data supplied by Vail Board
on
2022.
not guarantee nor is in any way responsible for its accuracy. Data maintained by Vail Board of Realtors® may not reflect all real estate activity
the market.
MARKET + $3,000,000 Sales January through September 2021 2022 % Change # of Properties Sold 187 170 -9.1% Average Price Per Square Foot $1,342 $1,499 11.7% Average Days on Market 182 69 -62.1% Highest Price $34,000,000 $30,875,000 -9.2% Average List Price $5,846,710 $6,119,841 4.7% Average Sale Price $5,578,664 $5,910,935 6.0% % Sold Price to List Price 96.1% 97.4% 1.4% Total Dollar Volume $1,043,210,171 $1,004,858,971 -3.7% VAIL VALLEY Eagle County
January through September
# of
Average Price
Average Days
11 15 36.4%
$776 $1,010 30.2%
104 76 -26.9%
Highest Price $10,605,750 $7,575,000 -28.6%
Average List Price $4,931,364 $5,424,533 10.0%
Average Sale Price $4,671,813 $5,343,966 14.4%
% Sold Price to
Total Dollar
Price 95.2% 99.1% 4.1%
$51,389,950 $80,159,500 56.0%
January through September
% Change
# of Properties Sold 20 15 -25.0%
Average Price Per Square
$1,250 $1,363 9.0%
Average Days on Market 111 32 -71.2%
Highest Price $13,500,000 $11,750,000 -13.0%
Average List Price $6,352,500 $7,097,000 11.7%
Average Sale Price $6,179,687 $6,916,766 11.9%
% Sold Price to
Total
Price 97.6% 97.3% -0.3%
$123,593,750 $103,751,500 -16.1%
January through September
# of
Average
Average
Highest
Average
Average
%
Total
Change
29 21 -27.6%
$1,041 $1,374 32.0%
265 85 -67.9%
$10,950,000 $10,200,000 -6.8%
$5,682,628 $4,676,000 -17.7%
$5,428,144 $4,569,214 -15.8%
96.1% 97.9% 1.9%
$157,416,176 $95,953,500 -39.0%
32
2021 2022 % Change
Properties Sold
Per Square Foot
on Market
List
Volume
2021 2022
Foot
List
Dollar Volume
2021 2022 %
Properties Sold
Price Per Square Foot
Days on Market
Price
List Price
Sale Price
Sold Price to List Price
Dollar Volume
56.0% The total dollar volume in Arrowhead increased by 56.0% in the first half of 2022 compared to that of 2021. All Properties All Properties All Properties ARROWHEAD BACHELOR GULCH BEAVER CREEK 67.9% The average number of days on market in Beaver Creek decreased by 67.9% January through September 2022 compared to that of 2021.
of
33 All Properties January through September 2021 2022 % Change # of Properties Sold 73 69 -5.5% Average Price Per Square Foot $2,033 $2,124 4.5% Average Days on Market 233 72 -69.1% Highest Price $34,000,000 $30,875,000 -9.2% Average List Price $7,014,274 $7,056,928 0.6% Average Sale Price $6,627,709 $6,795,057 2.5% % Sold Price to List Price 95.3% 97.6% 2.4% Total Dollar Volume $483,822,795 $468,859,000 -3.1% All Properties January through September 2021 2022 % Change # of Properties Sold 33 28 -15.2% Average Price Per Square Foot $2,623 $2,668 1.7% Average Days on Market 148 82 -44.6% Highest Price $34,000,000 $19,000,000 -44.1% Average List Price $8,406,182 $7,708,786 -8.3% Average Sale Price $7,935,568 $7,435,964 -6.3% % Sold Price to List Price 95.1% 97.9% 2.9% Total Dollar Volume $261,873,750 $208,207,000 -20.5% All Properties January through September 2021 2022 % Change # of Properties Sold 20 15 -25.0% Average Price Per Square Foot $1,971 $2,451 24.4% Average Days on Market 292 79 -72.9% Highest Price $12,450,000 $30,875,000 148.0% Average List Price $6,245,950 $8,569,333 37.2% Average Sale Price $5,944,500 $8,223,333 38.3% % Sold Price to List Price 95.5% 96.8% 1.4% Total Dollar Volume $118,890,000 $123,350,000 3.8% LIONSHEAD VAIL VILLAGE TOWN OF VAIL 38.3% The average home sale price in Lionshead increased by 38.3% January through September 2022 compared to that of 2021. 69.1% The average number of days on market in the Town of Vail decreased by 69.1% January through September 2022 compared to that
2021.
January
#
Average
January
Average
$15,500,000
$6,332,500 $7,700,000
$5,965,833 $7,289,285
$8,100,000
$8,100,000
34
through September 2021 2022 % Change
of Properties Sold 6 7 16.7%
Price Per Square Foot $1,536 $1,620 5.5% Average Days on Market 177 100 -43.5% Highest Price $8,750,000
77.1% Average List Price
21.6% Average Sale Price
22.2% % Sold Price to List Price 95.2% 97.1% 2.0% Total Dollar Volume $35,795,000 $51,025,000 42.5%
through September 2021 2022 % Change # of Properties Sold 1 No Sales
Price Per Square Foot $1,078 Average Days on Market 650 Highest Price
Average List Price $9,999,000 Average Sale Price
% Sold Price to List Price 81.0% Total Dollar Volume $8,100,000 All Properties All Properties VAIL GOLF COURSE SPRADDLE CREEK January through September 2021 2022 % Change # of Properties Sold 5 4 -20.0% Average Price Per Square Foot $714 $1,502 110.4% Average Days on Market 431 169 -60.8% Highest Price $8,500,000 $20,250,000 138.2% Average List Price $6,348,000 $12,347,500 94.5% Average Sale Price $6,064,500 $11,700,000 92.9% % Sold Price to List Price 95.5% 94.1% -1.4% Total Dollar Volume $30,322,500 $46,800,000 54.3%MOUNTAIN STAR 42.5% The total dollar volume in Vail Golf Course increased by 42.5% January through September 2022 compared to that of 2021. 60.8% The average number of days on market in Mountain Star decreased by 60.8% January through September 2022 compared to that of 2021. All Properties
TELLURIDE LUXURY MARKET
In Telluride, you’ll find incredible views, a community with a rich history, and gorgeous luxury homes that help residents create a life they truly love. In San Miguel County, which is home to Telluride and its surrounding communities, the luxury real estate market saw an impressive 7.9% increase in the number of homes sold through September compared to the same time frame in 2021. Overall, homes in this stunning community saw a 4.1% boost in the average sale price, reaching $6,148,465 through Q3.
The Town of Telluride community experienced the most notable increase in the number of luxury homes sold through September of this year, growing by an impressive 19%, from 21 homes sold through Q3 of last year to 25 homes sold through Q3 in 2022. The average sale price for listings here was $5,637,402 – a 1.4% increase from the previous year.
Mountain Village also experienced an increase in the number of luxury properties sold through September of this year – rising by 7.5% to reach a total of 43 listings sold. The average sale price of those properties was $6,112,789, which was 22% higher than the average sale price last year.
TELLURIDE
Miguel County
the Surrounding Mesas
which includes
Mesa, Specie Mesa, Turkey Creek Mesa, and Wilson Mesa, 15
of $6,945,945
a 15.6% decrease from the same period in 2022.
Based on sales $3,000,000+ and information from flexmls/Telluride Association of Realtors®. This representation is based in whole or in part on data supplied by Telluride Association of Realtors® on September 5, 2022. Telluride Association of Realtors® does not guarantee nor is in any way responsible for its accuracy. Data maintained by Telluride Association of Realtors® may not reflect all real estate activity in the market.does not guarantee nor is in any way responsible for its accuracy. Data maintained by REColorado may not reflect all real estate activity in the market.
35
In
community,
Deep Creek Mesa, Hastings Mesa, Iron Springs/Horsefly
luxury properties were sold at an average sale price
–
+ $3,000,000 Sales January through September 2021 2022 % Change # of Properties Sold 76 82 7.9% Average Price Per Square Foot $1,401 $1,705 21.7% Average Days on Market 293 143 -51.2% Highest Price $39,500,000 $17,100,000 -56.7% Average List Price $6,093,593 $6,430,768 5.5% Average Sale Price $5,905,098 $6,148,465 4.1% % Sold Price to List Price 96.9% 95.6% -1.3% Total Dollar Volume $448,787,455 $504,174,150 12.3%
San
January through September
# of Properties Sold
Change
25 19.0%
Average Price Per Square Foot $2,114 $2,247 6.3%
Average Days on Market 141 100 -29.1%
Highest Price $14,389,455 $12,500,000 -13.1%
Average List Price $5,723,048 $5,830,000 1.9%
Average Sale Price $5,558,498 $5,637,402 1.4%
% Sold Price to List Price 97.1% 96.7% -0.4%
Total Dollar Volume $116,728,455 $140,935,058 20.7%
January through September
2022 % Change
# of Properties Sold 40 43 7.5%
Average Price Per Square Foot $959 $1,392 45.2%
Average Days on Market 363 147 -59.5%
Highest Price $8,100,000 $17,100,000 111.1%
Average List Price $5,177,152 $6,249,140 20.7%
Average Sale Price $5,010,662 $6,112,789 22.0%
% Sold Price to List Price 96.8% 97.8% 1.1%
Total Dollar Volume $200,426,500 $262,849,917 31.1%
January through September
# of Properties Sold
% Change
15 7.1%
Average Price Per Square Foot $1,553 $1,639 5.5%
Average
Highest
Average
Average
%
Total
294 209 -28.9%
$39,500,000 $15,000,000 -62.0%
$8,567,357 $7,797,333 -9.0%
$8,226,607 $6,945,945 -15.6%
96.0% 89% -7.2%
$115,732,500 $104,189,175 -10.0%
36
2021 2022 %
21
2021
2021 2022
14
Days on Market
Price
List Price
Sale Price
Sold Price to List Price
Dollar Volume
28.9% The average number of days on market in the Surrounding Mesas decreased by 28.9% January through September 2022 compared to that of 2021. 20.7% The total sales volume in the Town of Telluride increased by 72.7% January through September 2022 compared to that of 2021. Deep Creek Mesa, Hastings Mea, Iron Springs/Horsefly Mesa, Specie Mesa, Sunshine Mesa, Turkey Creek Mesa, Wilson Mesa All Properties All PropertiesTOWN OF TELLURIDE MOUNTAIN VILLAGE SURROUNDING MESAS
in your happy place

The definition of paradise depends on your point of view. Find a home that makes each day more extraordinary than the last with LIV Sotheby’s International Realty. livsothebysrealty.com
38 WHY COLORADO? 04 07 28NATIONAL PARKS MOUNTAIN RANGES SKI AREAS & RESORTS
39 AVG DAYS OF SUNSHINE ANNUALY CRAFT BREWERIES 300 350+
