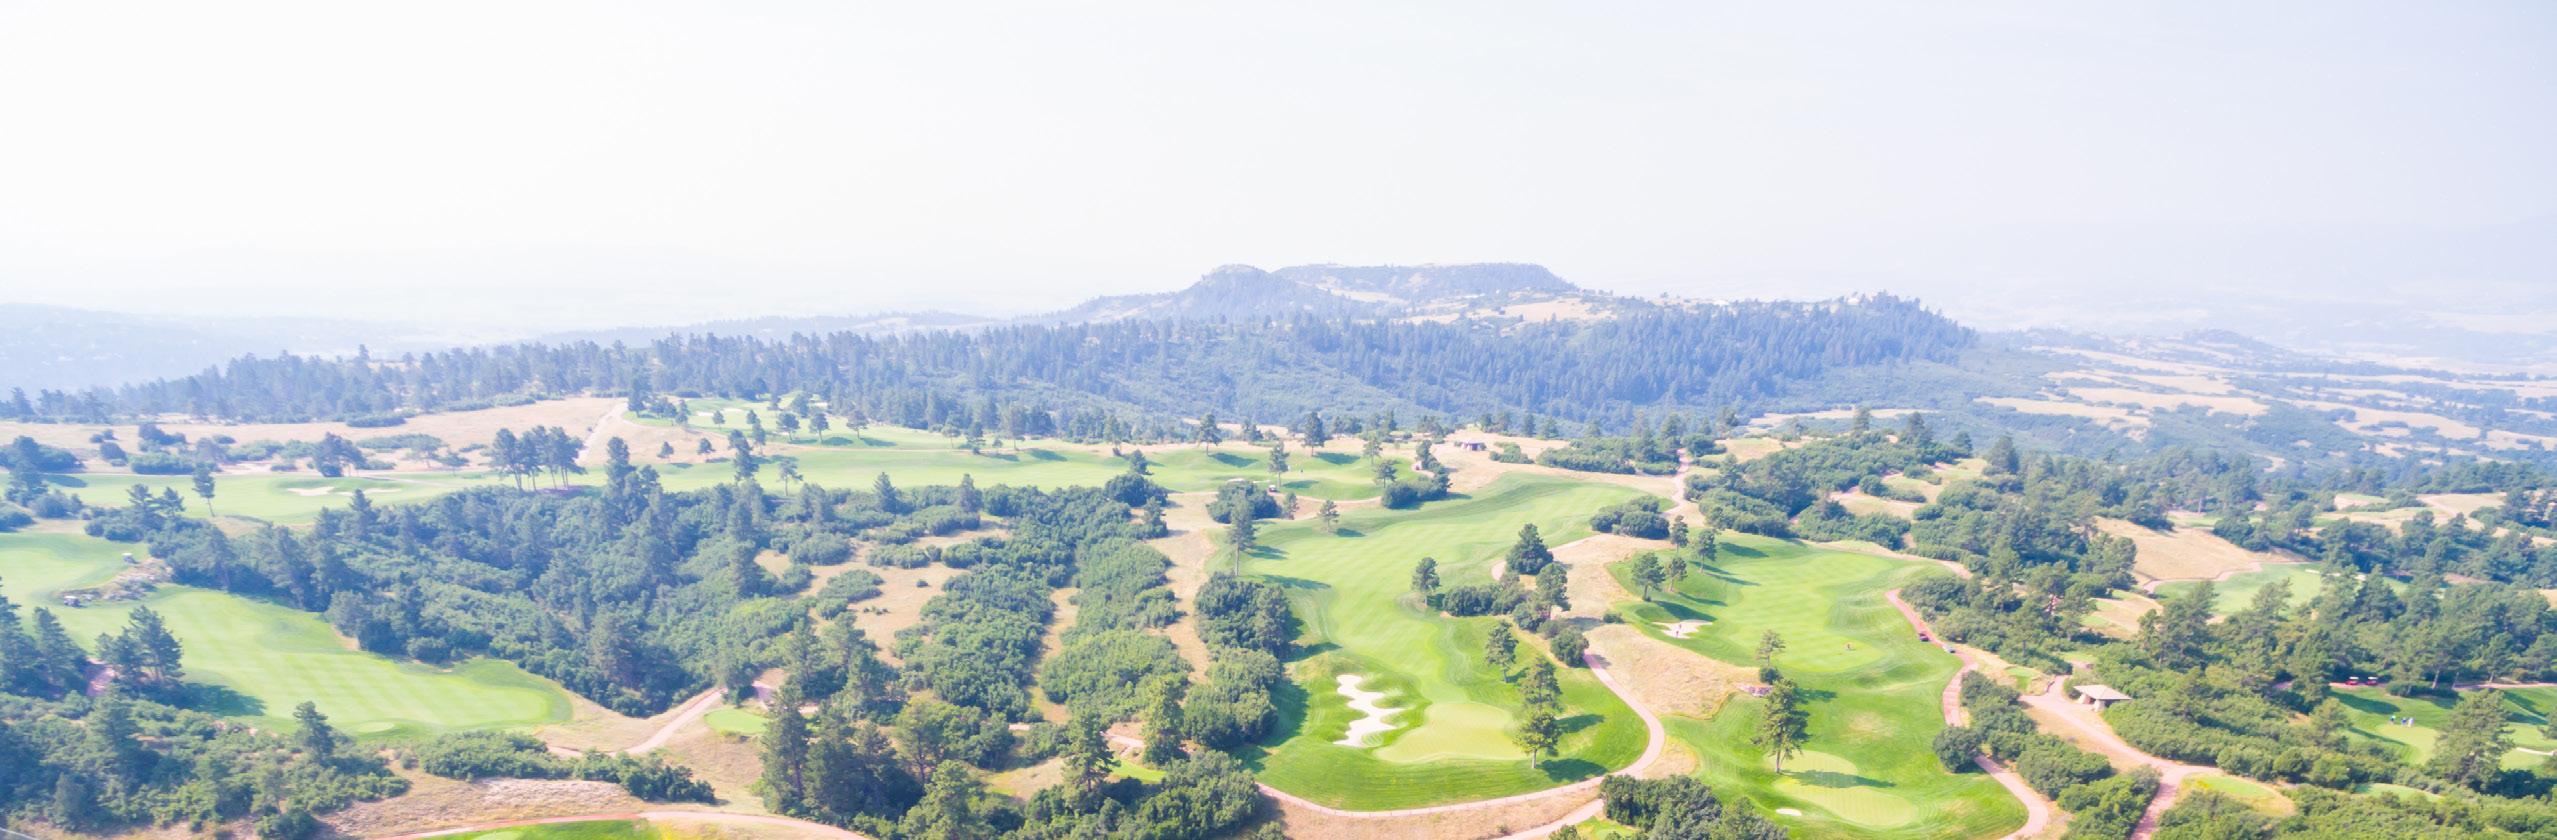
MARKET UPDATE South Metro
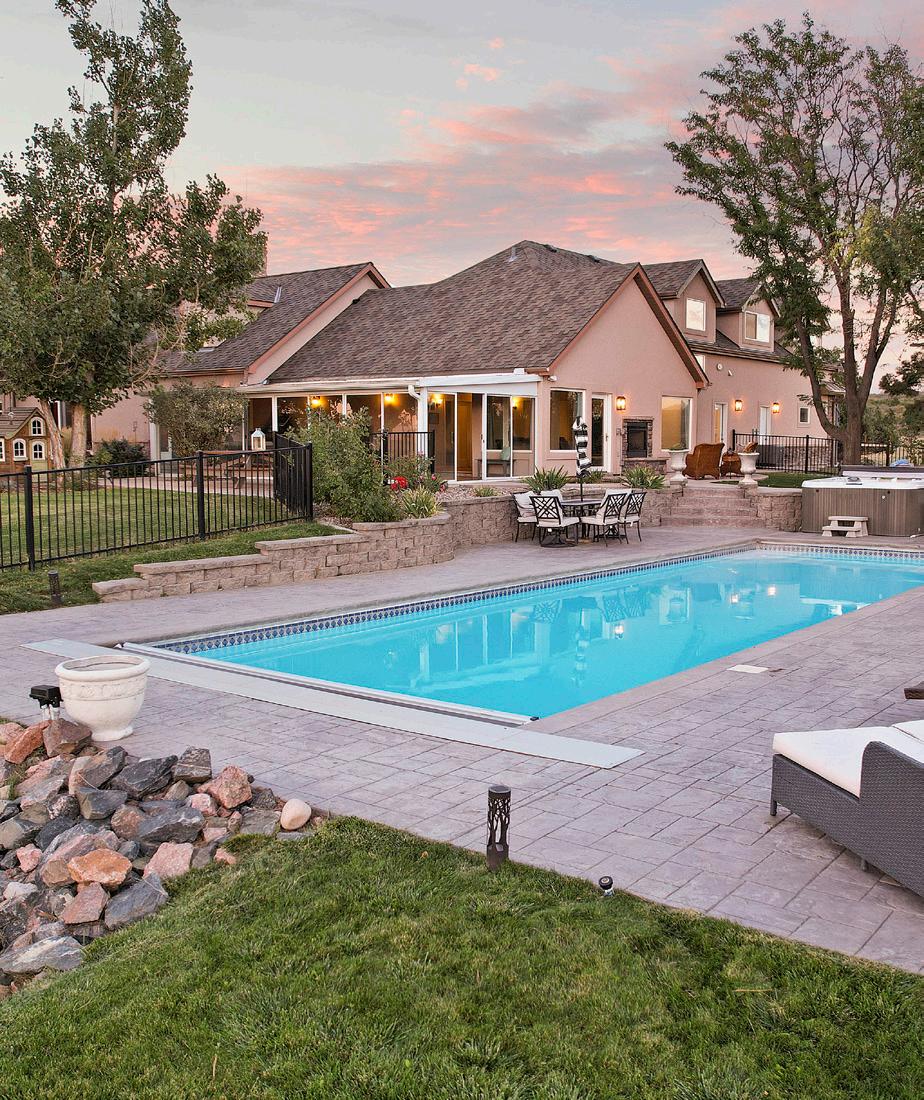
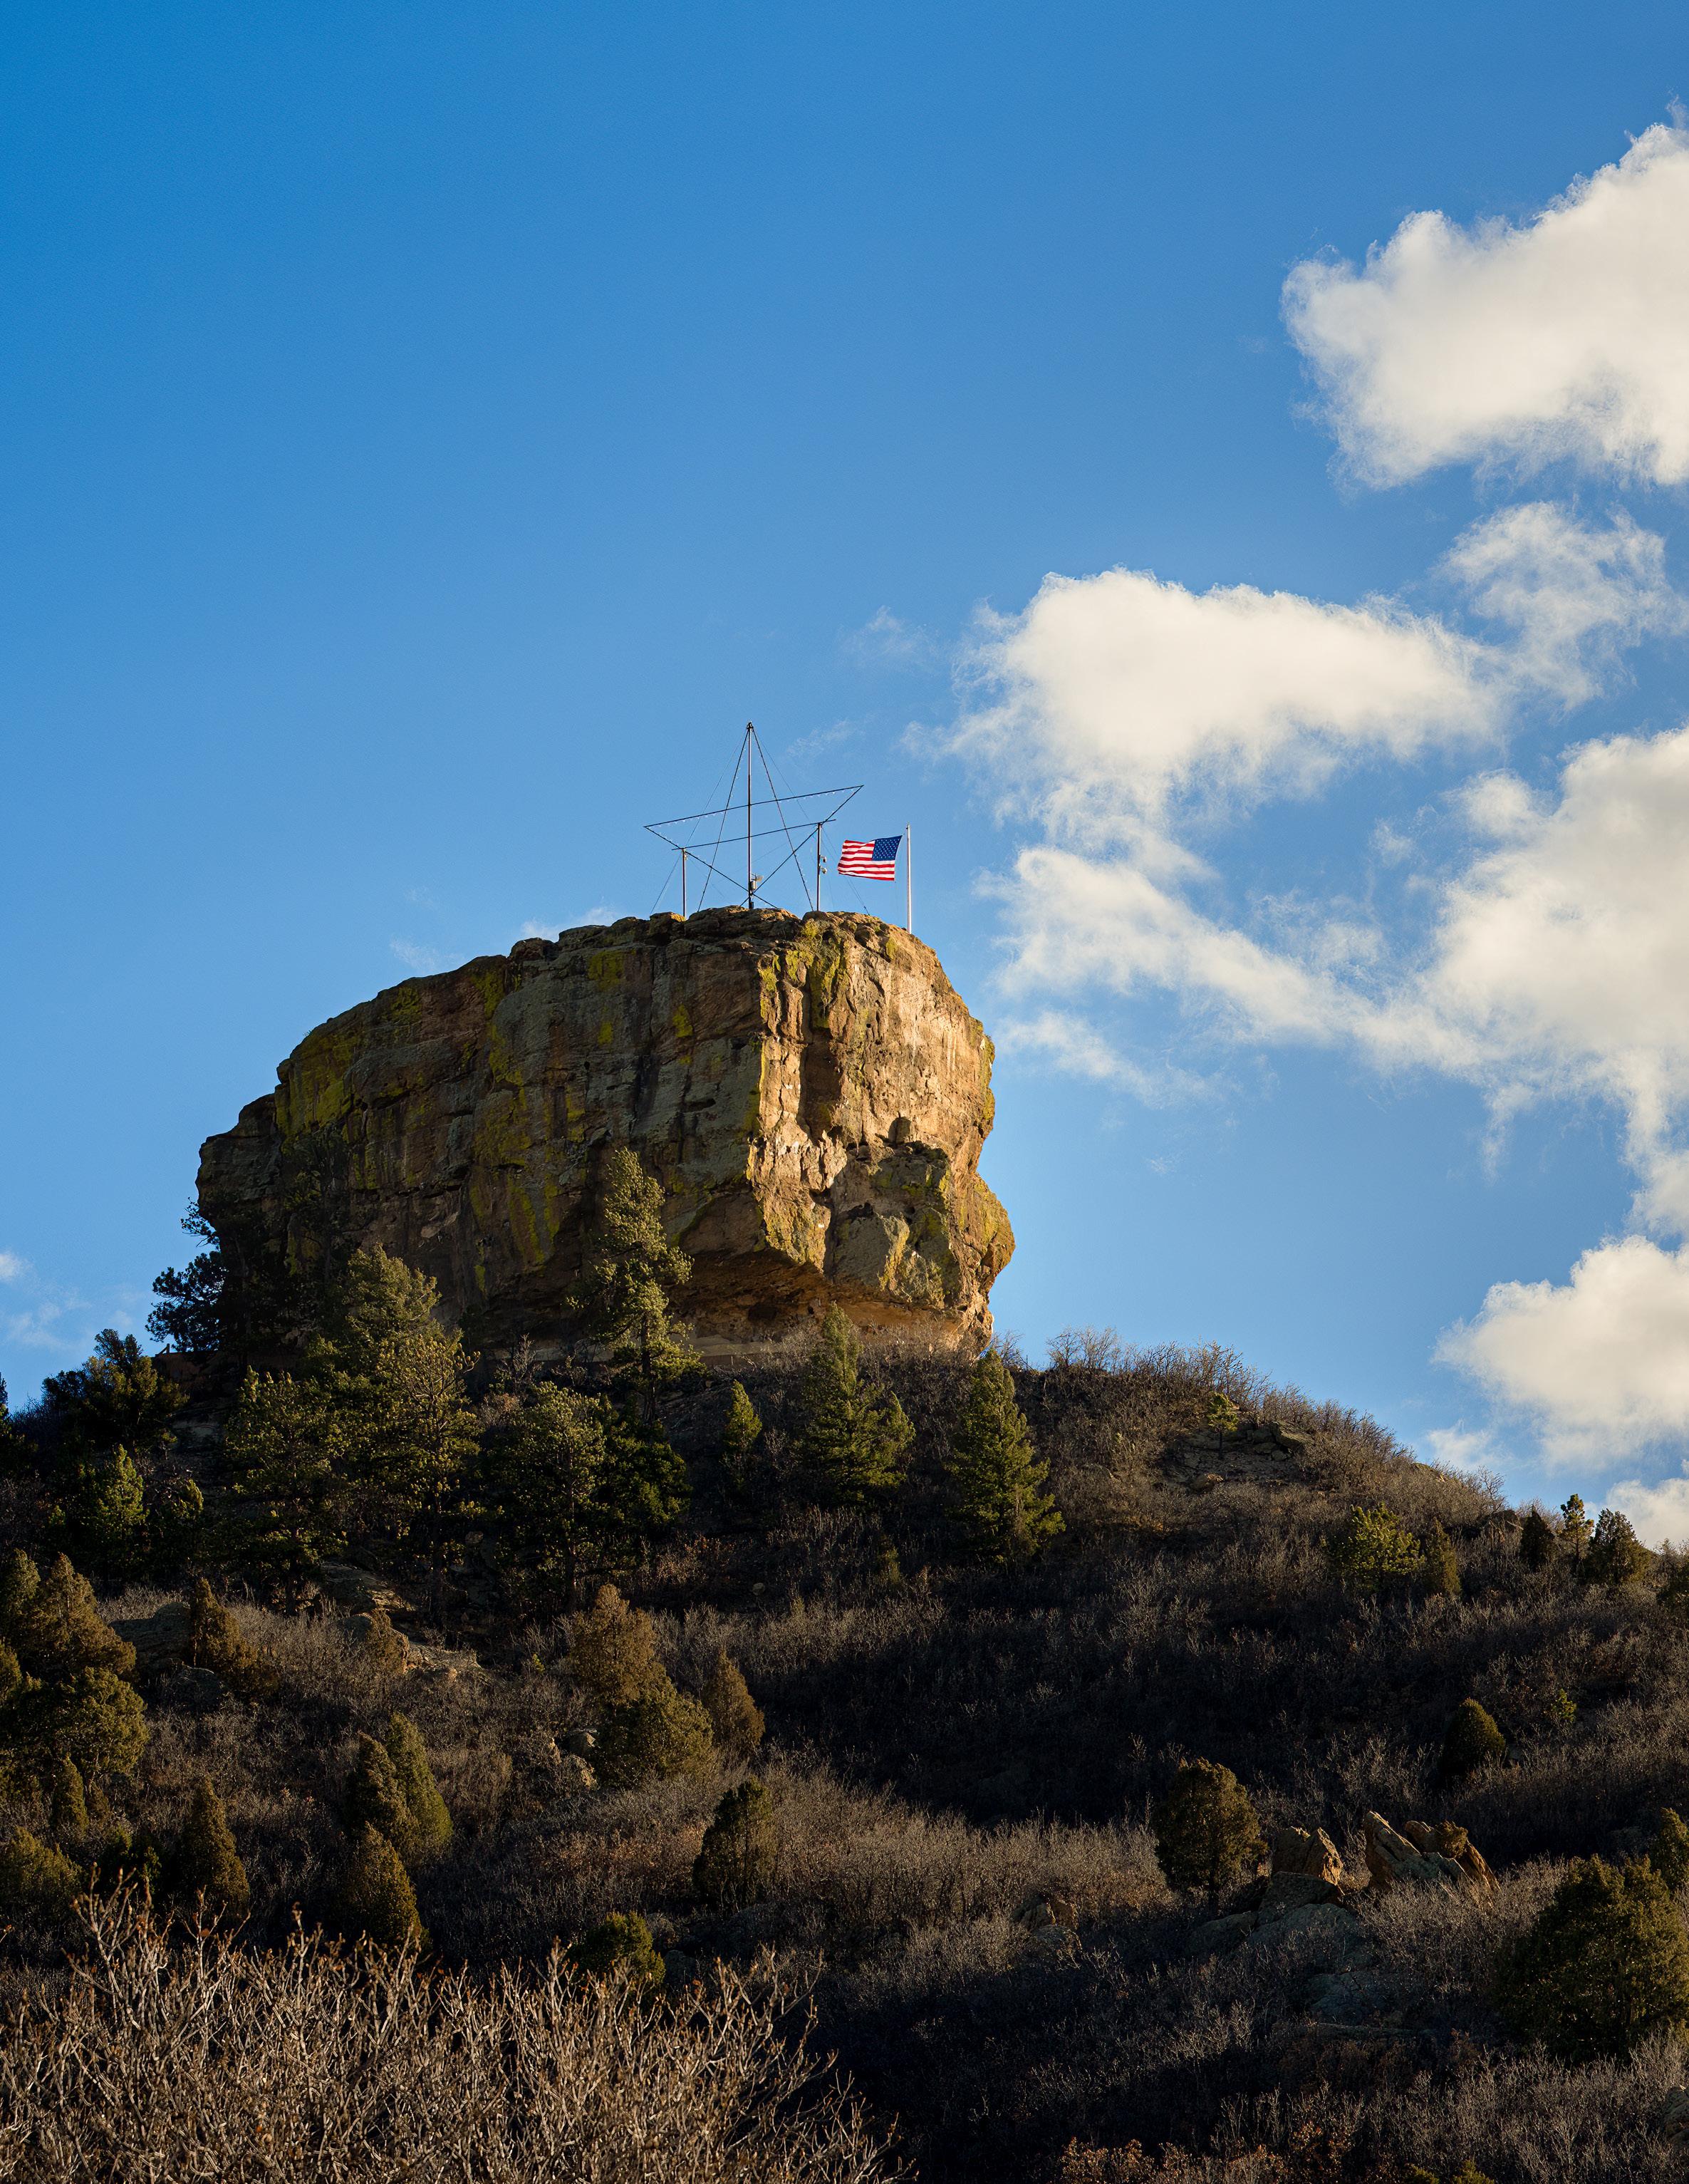
Denver’s South Metro neighborhood offers a wide selection of communities that can cater to almost every lifestyle. From spacious ranch properties to exquisitely planned communities and modern condominium living, there’s something here for everyone. Featuring an abundance of parks, trails, and other recreation options in addition to a bustling business hub and endless entertainment choices, it’s no wonder why the South Metro community has remained a favorite for those looking to write their next chapter in a Colorado home.
The South Metro real estate market is starting off 2023 on a positive note and outperforming many conservative expectations. The number of homes sold throughout Douglas County decreased in comparison to 2022. Through March of this year, there have been 1,744 homes sold —down 10.8% from 2022. However, low inventory coupled with continued buyer demand resulted in housing prices remaining strong and a decrease in the days on market. After a slow end of 2022, momentum is certainly building in the South Metro real estate market.
While rising interest rates mean that buyers have less purchasing power and sellers have come down ever
so slightly on pricing, limited inventory and high demand still give sellers a lot of control in this market. During the first quarter of the year, the average price for a single-family home in Douglas County is $820,364—down 2.8% from 2022.
South Metro’s individual neighborhoods vary in market trends, as there are many distinctions even within this small geographic region. We are seeing a wide variance in buyer demand for certain neighborhoods, subdivisions, and even buildings. In the first quarter of 2023, The Village at Castle Pines saw a 3.2% increase in average sales compared to 2022, and The Meadows saw a 9.1% decrease for the same time period.
We recognize each locality is unique and no two regions respond to market shifts the same way. To aid in presenting an accurate picture of each of the areas that make up Denver’s South Metro area, LIV Sotheby’s International Realty is proud to present our Micro-Market Report, representing the metrics of many key and beloved neighborhoods.
Conveniently located near all the very best activities and amenities that the Front Range has to offer, the South Metro community is a haven for homebuyers and sellers hoping to reach their lifestyle goals in Colorado.
Douglas County
coloradomicroreports.com Based on Information from REColorado for the period January 1st, 2023 - March 31th, 2023. This representation is based in whole or in part on data supplied by REColorado. REColorado does not guarantee nor is in any way responsible for its accuracy. Data maintained by REColorado may not reflect all real estate activity in the market. January through March 2022 2022 % Change New Listings 1,956 1,744 -10.8% Sold Listings (All Properties) 1,621 1,359 -16.2% Average Price (All Properties) $789,445 $762,095 -3.5% Average Price (Single Family) $843,718 $820,364 -2.8% Average Days on Market 17 50 194.1% % Sold Price to Original List Price 102.8% 97.3% -5.4% Total Dollar Volume Sold $1,279,690,313 $1,035,686,850 -19.1%
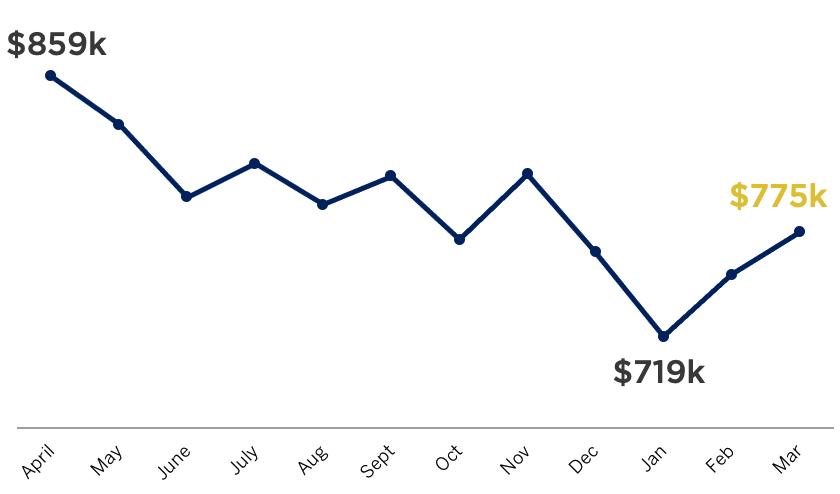
Average Sales Price (All Properties)
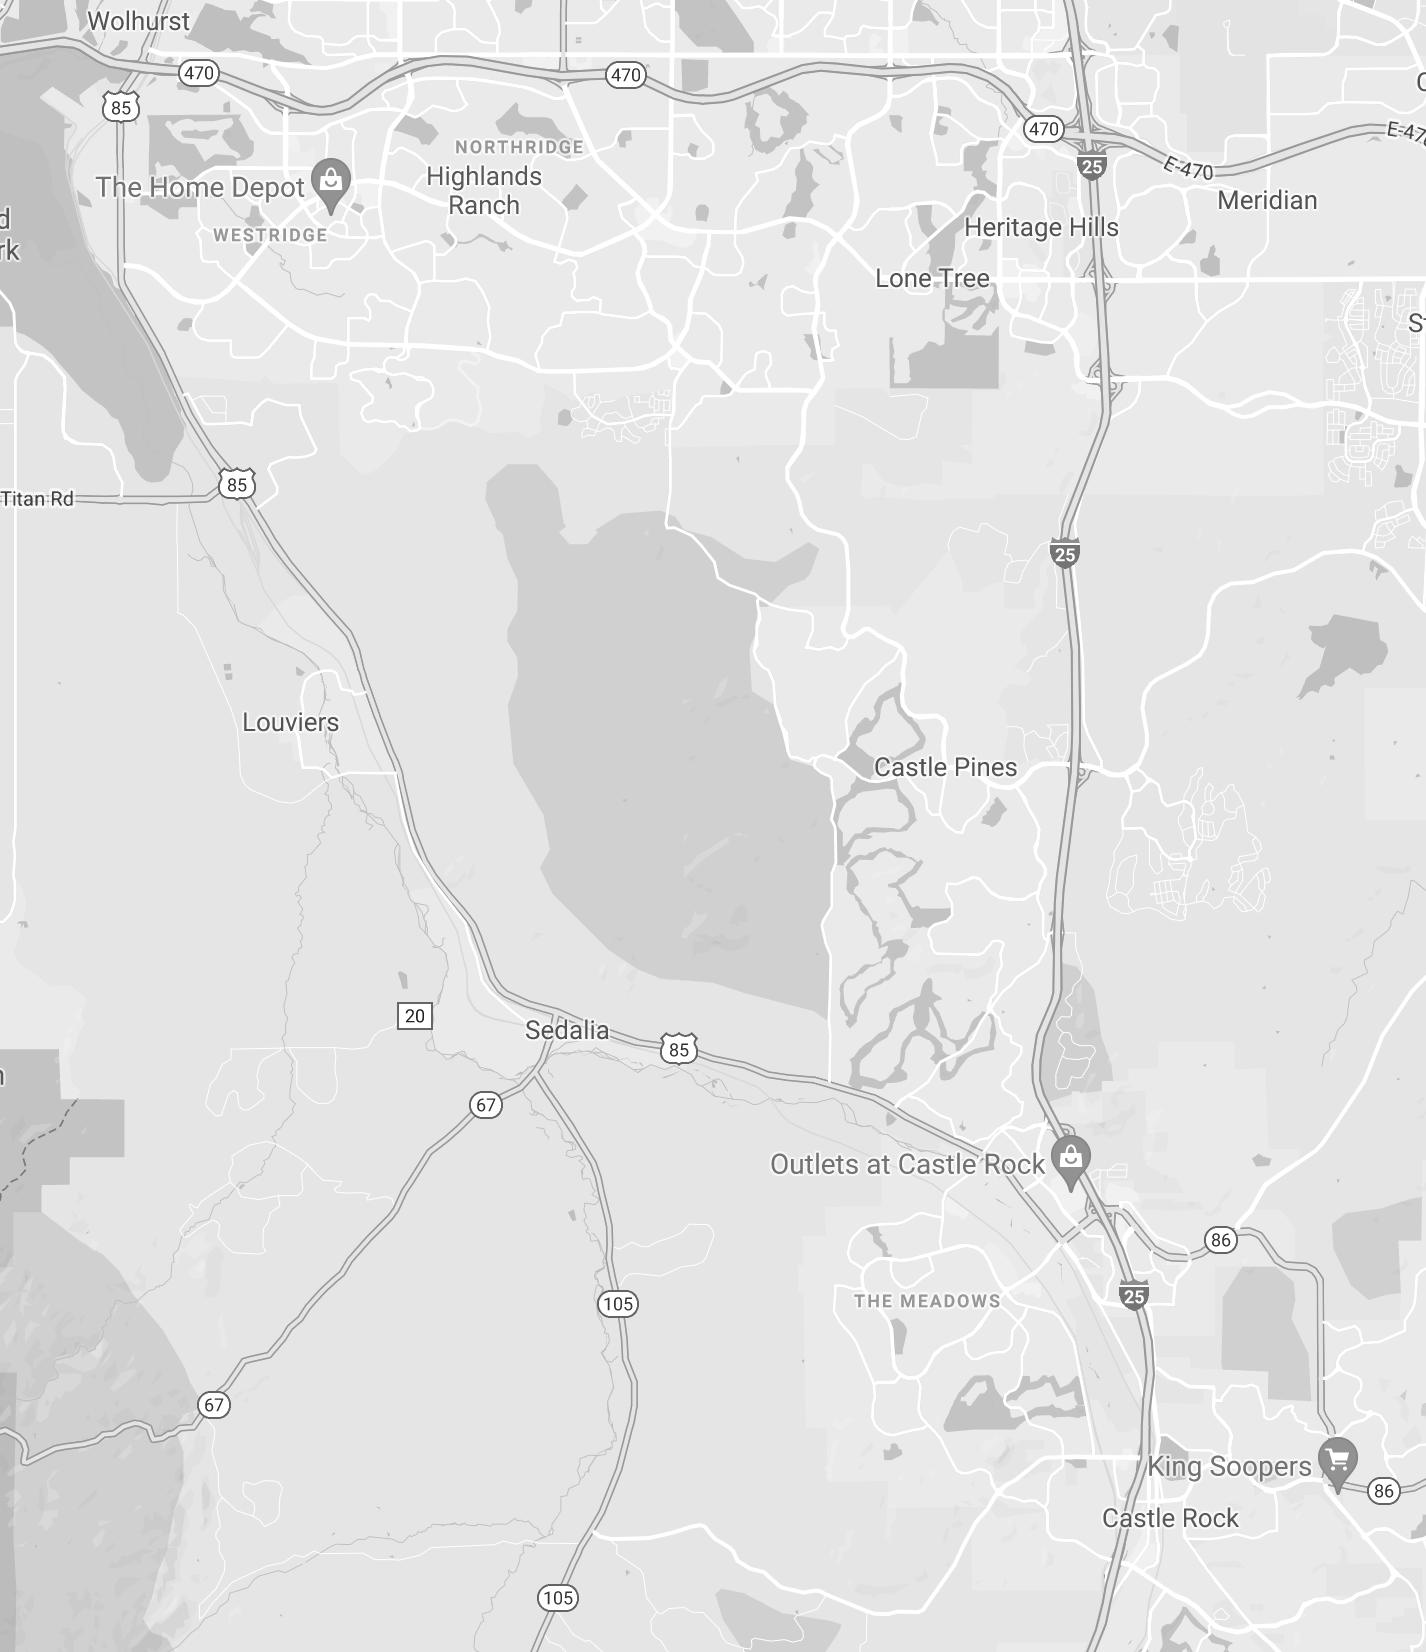
SOUTH METRO NEIGHBORHOODS
MICRO MARKET REPORT | South Metro JANUARY - MARCH 2023 • COLORADOMICROREPORTS.COM livsothebysrealty.com
1. Backcountry
2. Bell Mountain Ranch
3. Castle Pines
4. Castle Rock
5. Chaparral/Chenango
6. Crystal Valley
7. Eastridge
8. Falcon Hills
9. Firelight
10. Forest Park
11. Highlands Ranch Golf Club
12. Heritage Estates
13. Heritage Hills
14. Highlands Ranch
15. Inspiration
16. Keene Ranch
17. Larkspur
18. Lone Tree
19. The Meadows
20. Pradera & Timbers
21. Ravenna
22. Ridgegate
23. Roxborough Park
24. Spirit Ridge
25. Sterling Ranch
26. The Village at Castle Pines
15 8 7 13 2 5 11 14 16 9 10 3 6 4 1 25 20 19 18 17 21 24 23 26 27 12 22
27. Westridge
The number of properties sold in Backcountry increased by 40.0% in the first quarter of 2023 compared to that of 2022.
Bell Mountain Ranch is a working horse ranch in Castle Rock that has been around for over 100 years. This beautiful, high-end neighborhood, located 40 minutes southeast of Denver, features 305 custom home sites ranging from three to 12 acres.
BACKCOUNTRY BELL MOUNTAIN RANCH CASTLE PINES January through March 2022 2023 % Change Average Price $1,083,385 $1,008,366 -6.9% Average Price Per Square Foot $385 $374 -2.8% Average Days on Market 17 41 141.2% Highest Price $2,299,341 $2,824,063 22.8% Properties Sold 57 53 -7.0% % Sold Price to List Price 105.4% 96.2% -8.7% January through March 2022 2023 % Change Average Price $1,596,990 $1,634,571 2.4% Average Price Per Square Foot $496 $500 0.8% Average Days on Market 10 47 370.0% Highest Price $2,360,000 $3,600,000 52.5% Properties Sold 10 14 40.0% % Sold Price to List Price 102.8% 93.6% -9.0% January through March 2022 2023 % Change Average Price $1,468,333 $1,600,000 9.0% Average Price Per Square Foot $434 $609 40.4% Average Days on Market 25 30 20.0% Highest Price $1,675,000 $1,875,000 11.9% Properties Sold 3 2 -33.3% % Sold Price to List Price 96.0% 99.3% 3.5%
40.0%
26.1%
The highest home sale price in Chaparral/ Chenango increased by 26.1% in the first quarter of 2023 compared to that of 2022.
January through March 2022 2023 % Change Average Price $635,338 $681,258 7.2% Average Price Per Square Foot $288 $308 7.0% Average Days on Market 23 45 95.7% Highest Price $1,195,000 $960,000 -19.7% Properties Sold 78 43 -44.9% % Sold Price to List Price 101.3% 99.2% -2.1% January through March 2022 2023 % Change Average Price $791,746 $833,044 5.2% Average Price Per Square Foot $341 $345 1.4% Average Days on Market 17 49 188.2% Highest Price $3,800,000 $4,200,000 10.5% Properties Sold 421 311 -26.1% % Sold Price to List Price 103.9% 95.9% -7.7% January through March 2022 2023 % Change Average Price $1,441,667 $1,270,600 -11.9% Average Price Per Square Foot $417 $361 -13.4% Average Days on Market 9 42 366.7% Highest Price $1,575,000 $1,986,800 26.1% Properties Sold 3 3 0.0% % Sold Price to List Price 98.8% 87.1% -11.8% CRYSTAL VALLEY CHAPARRAL/CHENANGO CASTLE ROCK
Falcon Hills is a prestigious, master-planned, gated neighborhood located in Highlands Ranch. In this private neighborhood, residents enjoy the peaceful, quiet atmosphere with views of the Rocky Mountains and the Denver Metro area.
7.2%
The average price per square foot in Firelight increased by 7.2% in the first quarter of 2023 compared to that of 2022.
EASTRIDGE FALCON HILLS FIRELIGHT January through March 2022 2023 % Change Average Price $822,981 $765,818 -6.9% Average Price Per Square Foot $350 $375 7.2% Average Days on Market 5 45 800.0% Highest Price $1,300,000 $1,020,000 -21.5% Properties Sold 23 11 -52.2% % Sold Price to List Price 105.5% 99.0% -6.2% January through March 2022 2023 % Change Average Price $698,116 $650,711 -6.8% Average Price Per Square Foot $388 $350 -9.7% Average Days on Market 13 26 100.0% Highest Price $900,836 $895,000 -0.6% Properties Sold 15 19 26.7% % Sold Price to List Price 105.5% 98.7% -6.5% January through March 2022 2023 % Change Average Price $2,250,000 $1,469,000 -34.7% Average Price Per Square Foot $453 $436 -3.8% Average Days on Market 4 5 25.0% Highest Price $2,250,000 $1,469,000 -34.7% Properties Sold 1 1 0.0% % Sold Price to List Price 112.5% 100.0% -11.1%
28.2%
The average home sale price in Highlands Ranch Golf Club increased by 28.2% in the first quarter of 2023 compared to that of 2022.
Heritage Estates was built around the fairways of the Lone Tree Golf Course and is located near downtown
Lone Tree and Bluffs Regional Park, a popular hiking and biking spot for residents.
January through March 2022 2023 % Change Average Price - $1,722,500Average Price Per Square Foot - $431Average Days on Market - 222Highest Price - $1,940,000Properties Sold No Sales 4% Sold Price to List Price - 88.0%January through March 2022 2023 % Change Average Price - $1,473,500Average Price Per Square Foot - $438Average Days on Market - 18Highest Price - $1,672,000Properties Sold No Sales 2% Sold Price to List Price - 102.5%January through March 2022 2023 % Change Average Price $984,422 $1,262,333 28.2% Average Price Per Square Foot $331 $372 12.2% Average Days on Market 7 26 271.4% Highest Price $1,600,000 $1,749,000 9.3% Properties Sold 18 15 -16.7% % Sold Price to List Price 102.2% 101.2% -1.0% HERITAGE ESTATES HIGHLANDS RANCH GOLF CLUB FOREST PARK
Heritage Hills is a gated, luxury community in Lone Tree offering a combination of new builds and homes built in the last 20 years. Residents have access to a variety of parks, pools, tennis courts, and playgrounds within the community.
14.3%
The average number of days on market in Inspiration increased by 14.3% in the first quarter of 2023 compared to that of 2022.
January through March 2022 2023 % Change Average Price $815,371 $798,940 -2.0% Average Price Per Square Foot $316 $319 1.0% Average Days on Market 28 32 14.3% Highest Price $1,050,000 $1,000,000 -4.8% Properties Sold 24 15 -37.5% % Sold Price to List Price 98.6% 98.1% -0.5% January through March 2022 2023 % Change Average Price $1,497,148 $1,228,135 -18.0% Average Price Per Square Foot $443 $394 -11.1% Average Days on Market 2 51 2450.0% Highest Price $2,055,000 $1,525,039 -25.8% Properties Sold 6 4 -33.3% % Sold Price to List Price 102.2% 95.7% -6.4% January through March 2022 2023 % Change Average Price $797,423 $827,749 3.8% Average Price Per Square Foot $382 $364 -4.7% Average Days on Market 8 38 375.0% Highest Price $2,360,000 $3,600,000 52.5% Properties Sold 244 195 -20.1% % Sold Price to List Price 106.2% 97.1% -8.5%
HERITAGE HILLS HIGHLANDS RANCH INSPIRATION
0.6%
The average price per square foot in Keene Ranch increased by 0.6% in the first quarter of 2023 compared to that of 2022.
Lone Tree is a south Denver suburb, tucked just off I-25 in between Littleton and Parker. Conveniently located along the Light Rail at Lincoln Station, this Front Range town lies within Douglas County.
January through March 2022 2023 % Change Average Price $1,223,280 $1,202,923 -1.7% Average Price Per Square Foot $406 $381 -6.0% Average Days on Market 7 87 1142.9% Highest Price $2,055,000 $1,940,000 -5.6% Properties Sold 27 19 -29.6% % Sold Price to List Price 103.8% 92.6% -10.8% January through March 2022 2023 % Change Average Price $1,775,500 $1,375,000 -22.6% Average Price Per Square Foot $532 $535 0.6% Average Days on Market 26 28 7.7% Highest Price $2,892,000 $1,575,000 -45.5% Properties Sold 4 2 -50.0% % Sold Price to List Price 94.3% 97.8% 3.7% January through March 2022 2023 % Change Average Price $1,294,711 $842,714 -34.9% Average Price Per Square Foot $410 $378 -7.8% Average Days on Market 33 84 154.5% Highest Price $4,495,000 $1,225,000 -72.7% Properties Sold 25 7 -72.0% % Sold Price to List Price 100.3% 86.3% -13.9% LONE TREE LARKSPUR KEENE RANCH
43.5%
The number of properties sold in Pradera & Timbers decreased by 43.5% in the first quarter of 2023 compared to that of 2022.
Ravenna is a charming custom home village in Littleton set among rolling hills and red rock outcroppings on a worldclass golf course in Waterton Canyon.
January through March 2022 2023 % Change Average Price $1,912,500 $2,193,833 14.7% Average Price Per Square Foot $854 $904 5.8% Average Days on Market 90 150 66.7% Highest Price $1,925,000 $2,551,000 32.5% Properties Sold 2 3 50.0% % Sold Price to List Price 102.1% 98.2% -3.7% January through March 2022 2023 % Change Average Price $689,524 $626,632 -9.1% Average Price Per Square Foot $332 $298 -10.3% Average Days on Market 5 45 800.0% Highest Price $1,300,000 $1,086,500 -16.4% Properties Sold 81 57 -29.6% % Sold Price to List Price 105.6% 97.0% -8.1% January through March 2022 2023 % Change Average Price $1,363,058 $1,300,955 -4.6% Average Price Per Square Foot $430 $389 -9.5% Average Days on Market 21 27 28.6% Highest Price $2,450,000 $2,206,003 -10.0% Properties Sold 23 13 -43.5% % Sold Price to List Price 102.2% 97.3% -4.8%
THE MEADOWS PRADERA & TIMBERS RAVENNA
10.1%
The average price per square foot in Ridgegate increased by 10.1% in the first quarter of 2023 compared to that of 2022.
The small town of Roxborough Park lies between Chatfield State Park and Roxbourough State Park. Situated at the base of the foothills, Roxborough Park provides views of natural rock formations as well as the Rocky Mountains.
January through March 2022 2023 % Change Average Price - -Average Price Per Square Foot -
Average Days on Market
Highest Price
Properties Sold No Sales No Sales% Sold Price to List Price - -
January through March 2022 2023 % Change Average Price $901,367 $817,107 -9.3% Average Price Per Square Foot $346 $380 10.1% Average Days on Market 8 34 325.0% Highest Price $1,257,000 $1,400,000 11.4% Properties Sold 9 7 -22.2% % Sold Price to List Price 102.9% 98.9% -3.9% January through March 2022 2023 % Change Average Price $849,798 $954,167 12.3% Average Price Per Square Foot $452 $398 -11.9% Average Days on Market 5 27 440.0% Highest Price $1,285,000 $1,200,000 -6.6% Properties Sold 7 6 -14.3% % Sold Price to List Price 101.3% 95.3% -5.9% SPIRIT RIDGE ROXBOROUGH PARK RIDGEGATE
- -
- - -
- - -
-
Sterling Ranch is a masterplanned community located just four miles south of C-470 and one mile west of Santa Fe in Littleton. Sterling Ranch offers new homes with state-of-the-art technologies and sustainable resources.
17.6%
The number of properties sold in Westridge increased by 17.6% in the first quarter of 2023 compared to that of 2022.
STERLING RANCH THE VILLAGE AT CASTLE PINES WESTRIDGE January through March 2022 2023 % Change Average Price $710,824 $677,700 -4.7% Average Price Per Square Foot $384 $365 -4.9% Average Days on Market 5 31 520.0% Highest Price $962,000 $875,000 -9.0% Properties Sold 17 20 17.6% % Sold Price to List Price 109.8% 98.4% -10.4% January through March 2022 2023 % Change Average Price $770,064 $711,255 -7.6% Average Price Per Square Foot $317 $326 2.9% Average Days on Market 21 56 166.7% Highest Price $1,036,310 $1,400,000 35.1% Properties Sold 22 43 95.5% % Sold Price to List Price 100.5% 93.6% -6.9% January through March 2022 2023 % Change Average Price $1,861,380 $1,920,867 3.2% Average Price Per Square Foot $546 $580 6.1% Average Days on Market 19 68 257.9% Highest Price $3,800,000 $3,616,200 -4.8% Properties Sold 20 29 45.0% % Sold Price to List Price 101.8% 92.5% -9.1%
in the moment The definition of paradise depends on your point of view. Find a home that makes each day more extraordinary than the last with LIV Sotheby’s International Realty. 303.893.3200 | livsothebysrealty.com
04 07 28 NATIONAL PARKS MOUNTAIN RANGES SKI AREAS & RESORTS
AVG DAYS OF SUNSHINE ANNUALY CRAFT BREWERIES 300 350+
WHY COLORADO?
MICRO MARKET REPORT | South Metro JANUARY - MARCH 2023 • COLORADOMICROREPORTS.COM