Micro Market Report
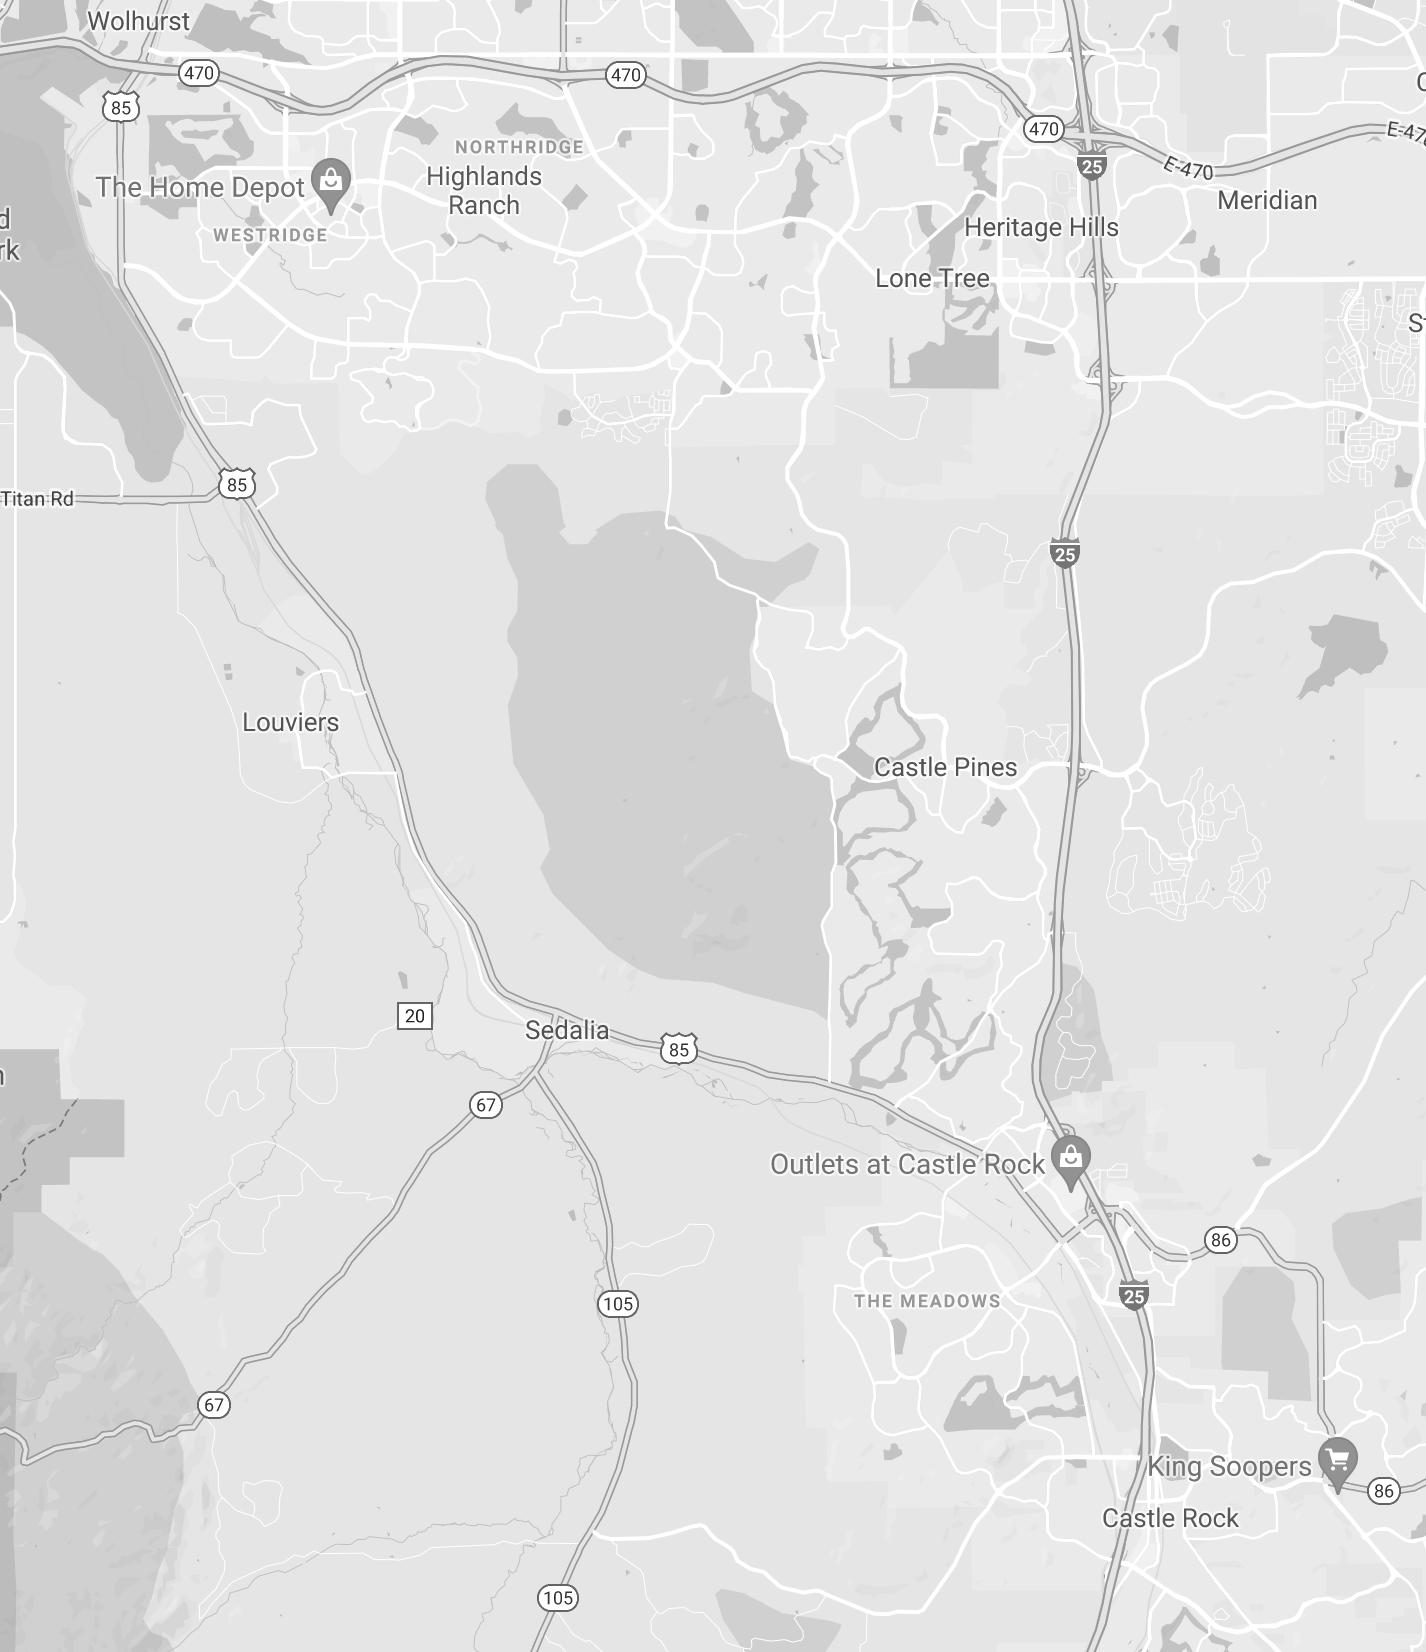
SOUTH METRO


880 Diamond Ridge Circle 1070 Cypress Way
QUARTER 3 2022

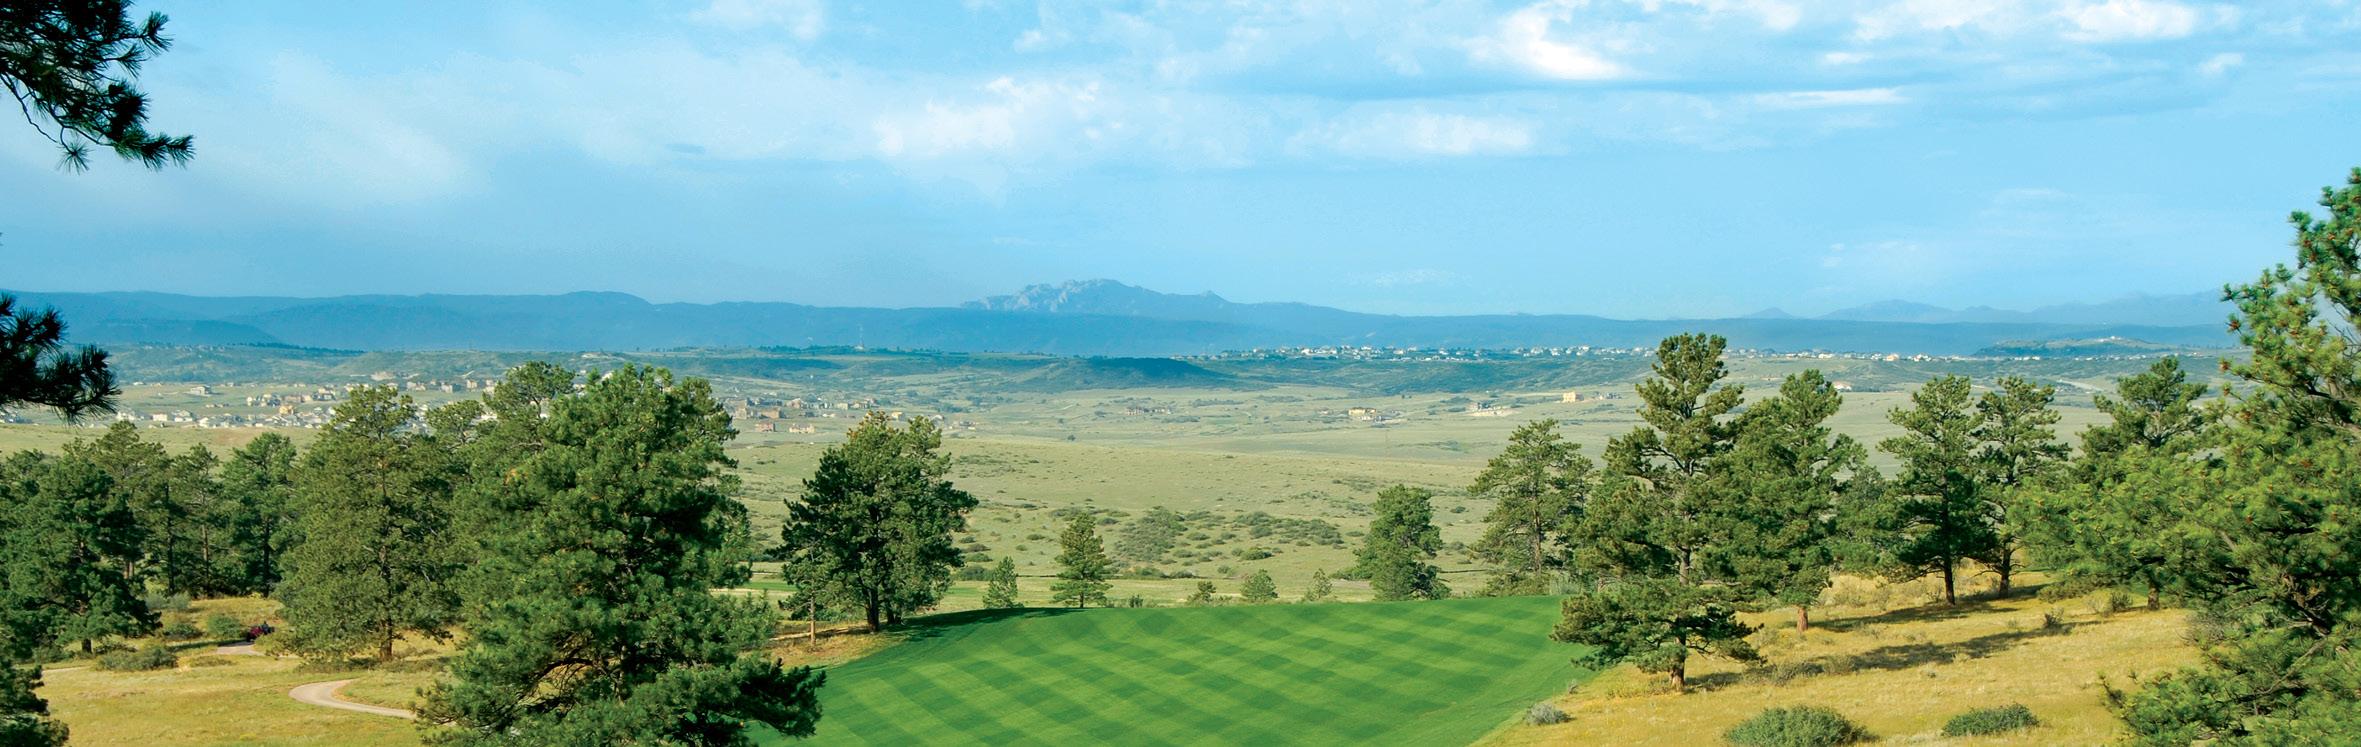
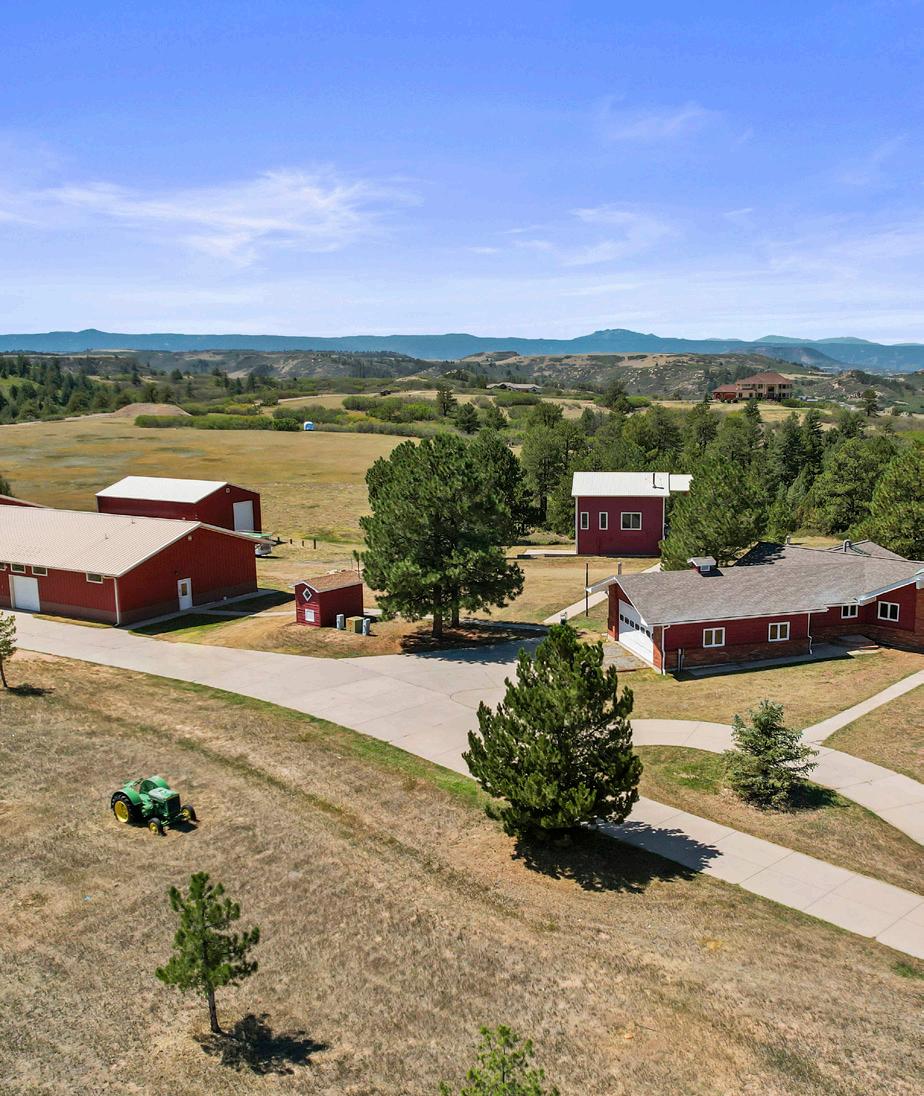
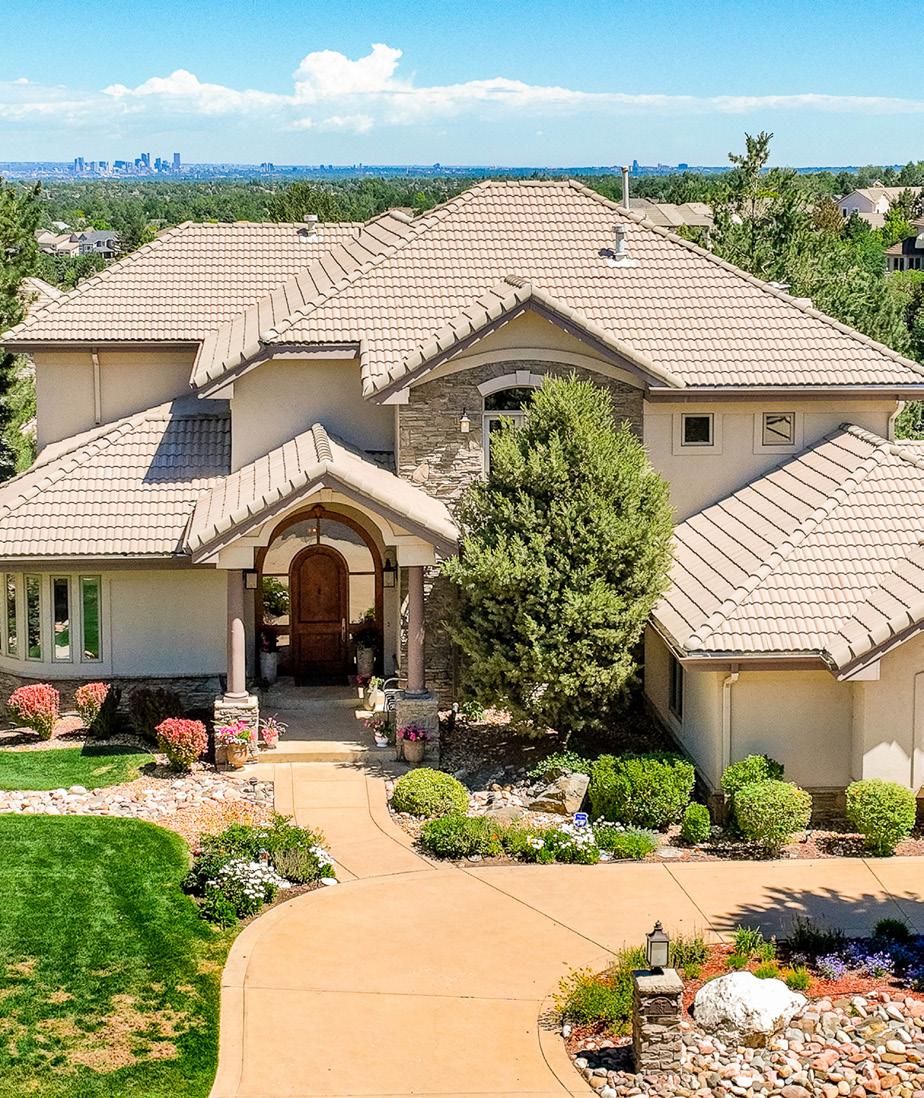
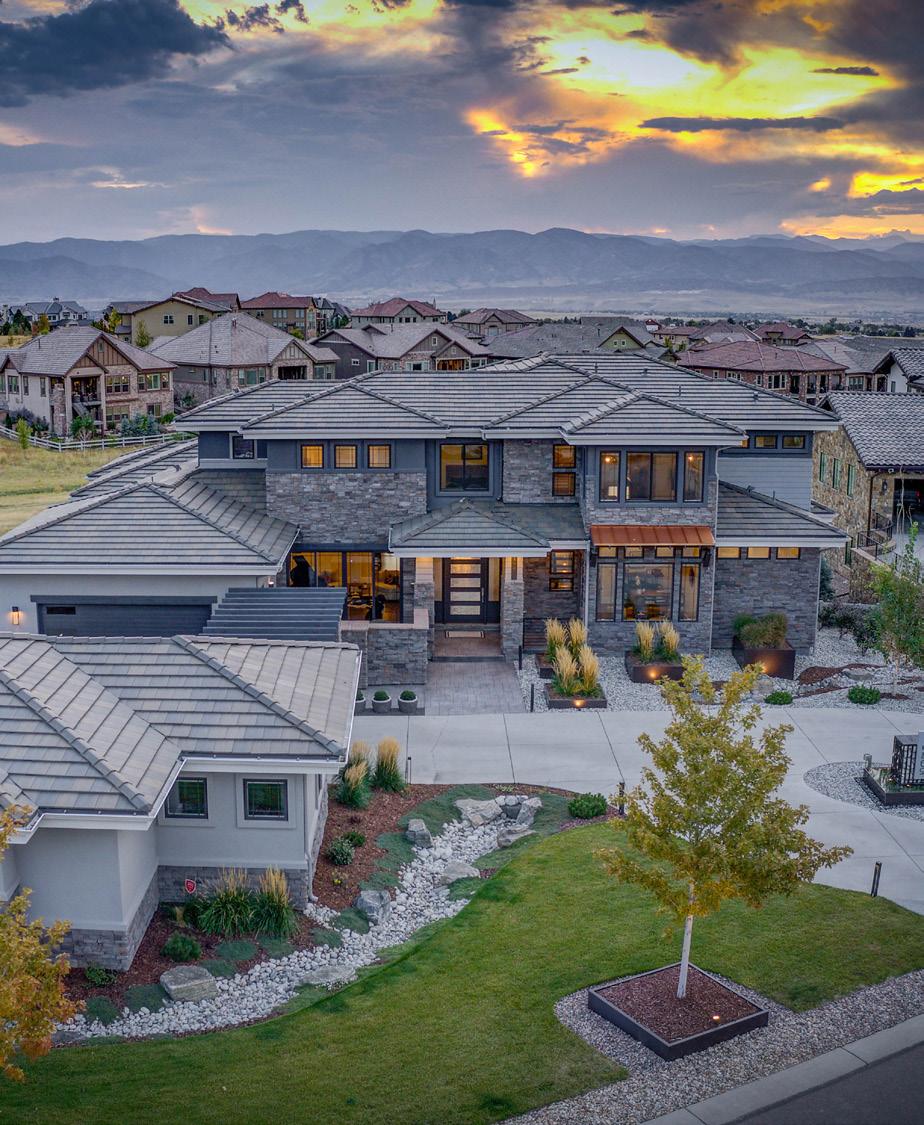
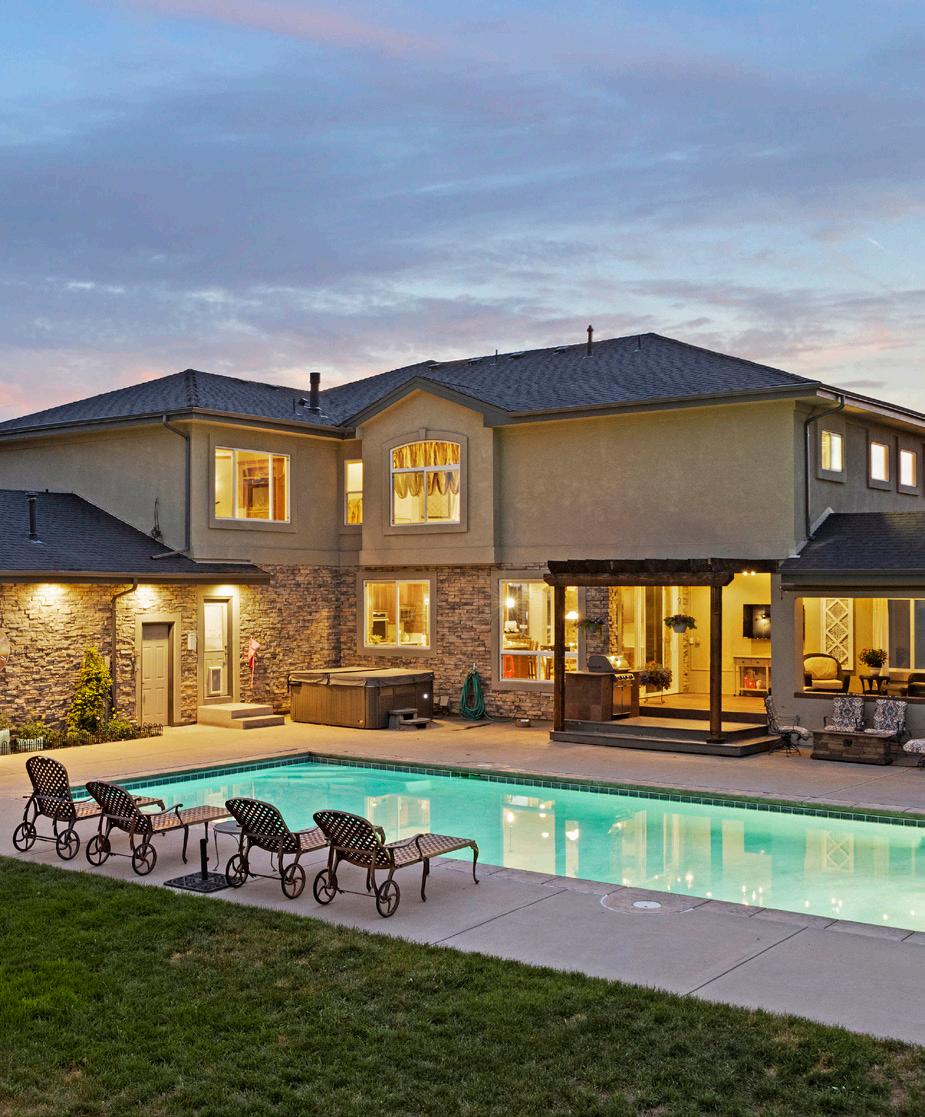
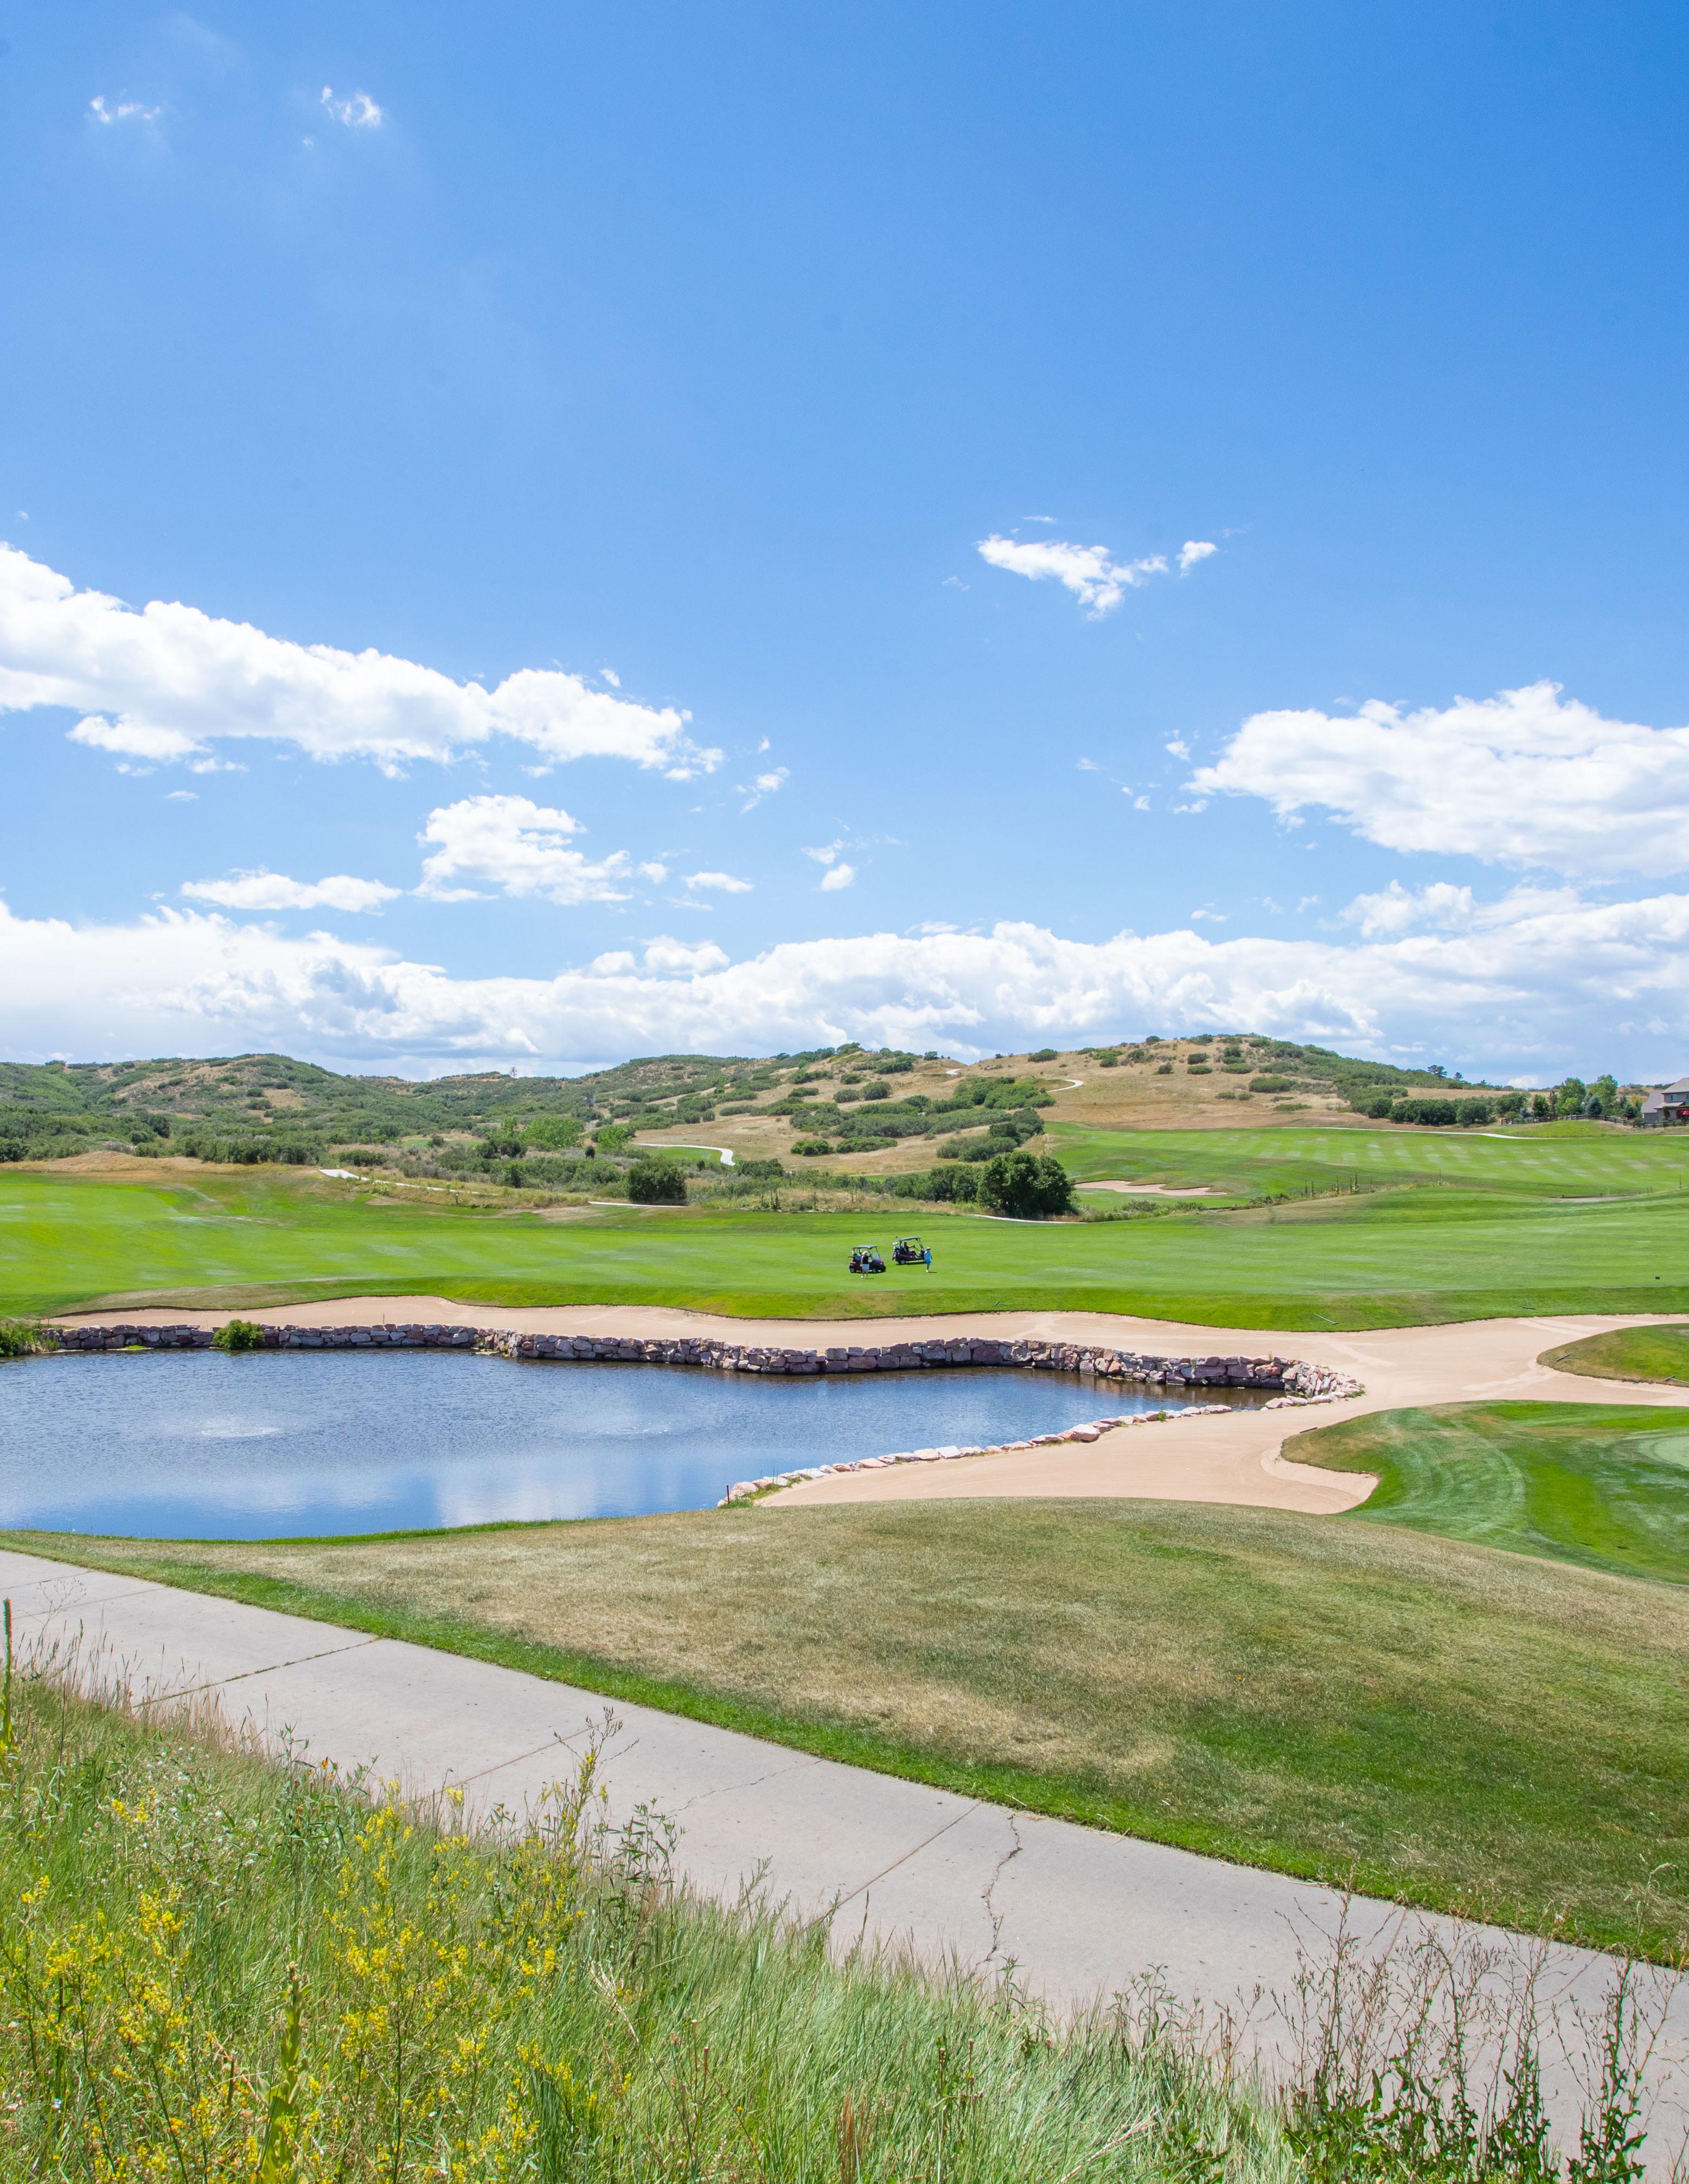
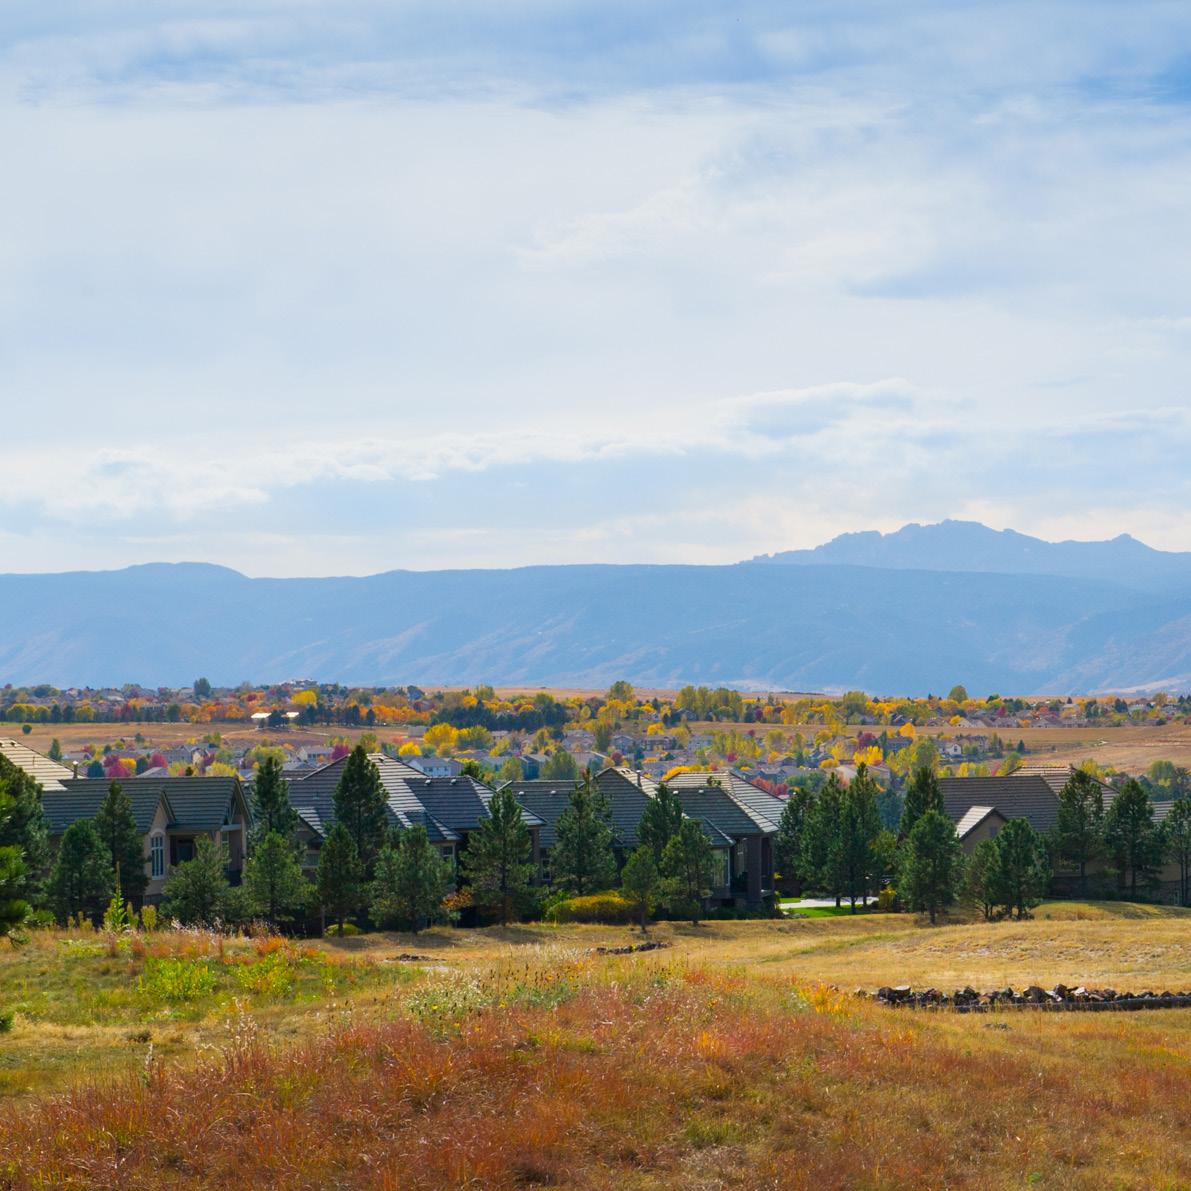
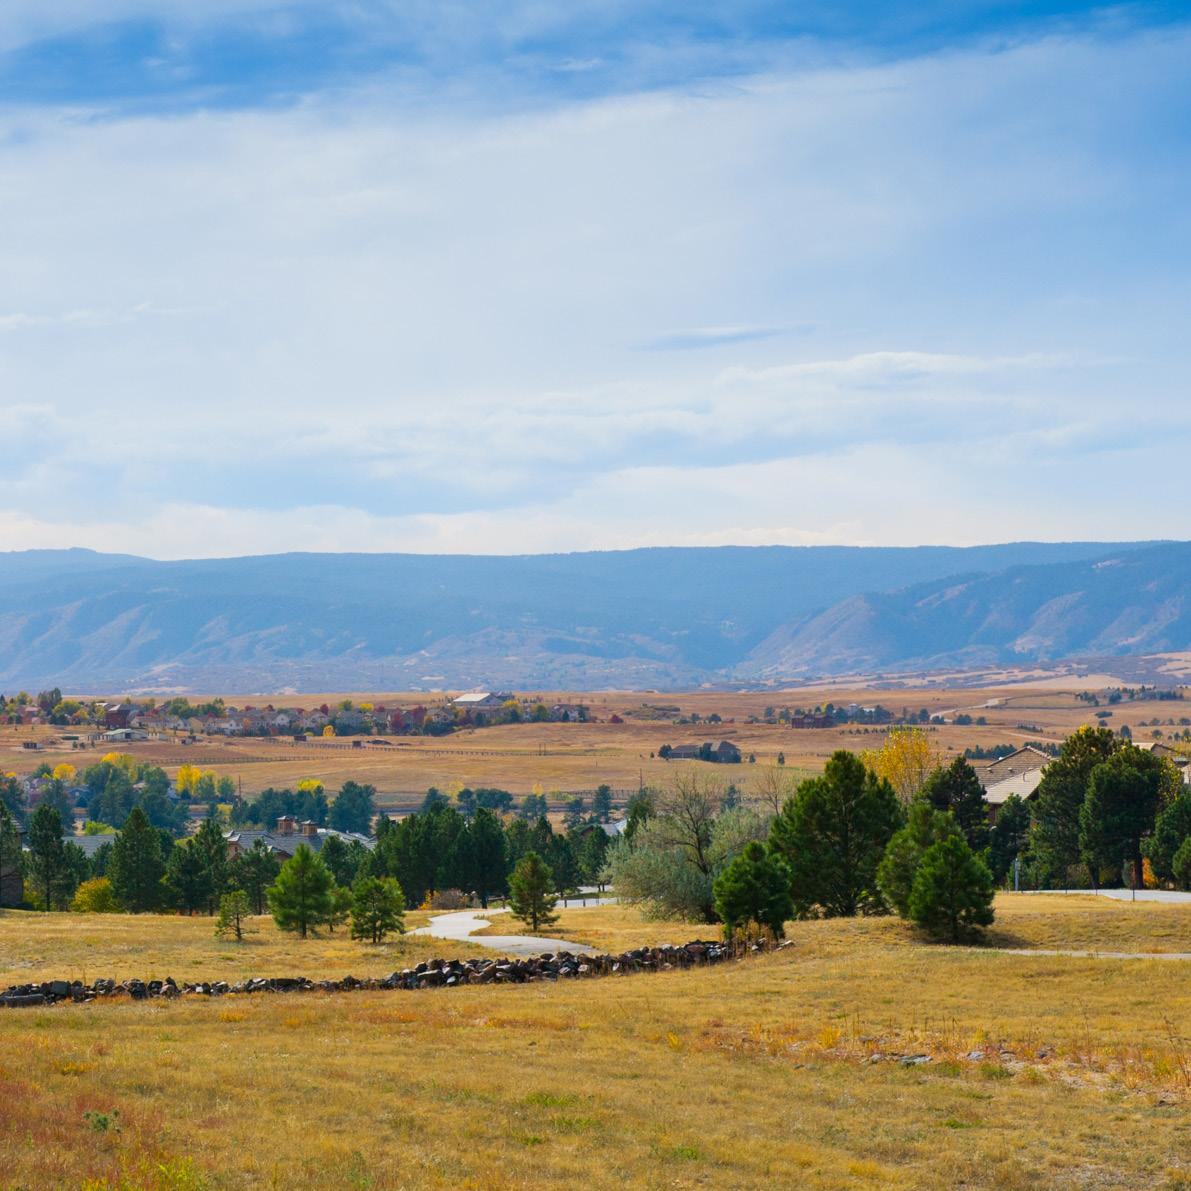
From spacious ranch properties to exquisitely planned communities and modern condominium living, Denver’s South Metro area offers a diverse selection of residences that cater to all kinds of lifestyles. Located near beautiful open spaces and an abundance of trails in addition to business hubs, the South Metro community boasts a one-of-a-kind Colorado living experience that provides its residents with the best of both worlds.
LIV Sotheby’s International Realty produces a South Metro Micro Market Report analyzing the real estate performance through Q3 of 2022 compared to the same time frame in 2021. Although the number of homes sold has decreased slightly by 13.3%, average sale prices in the area continue to appreciate. Through September, home prices rose by 14.4% to reach an average sale price of $813,973. South Metro saw a slight slowing of the market pace during this period with the average number of days spent on the market for local homes increasing by 30.8% to 17 days on the market.
Looking at individual neighborhoods within the South Metro community, there were several areas in which the number of homes sold increased through Q3 of this year compared to the same period in 2021. Crystal Valley saw a 3.9% increase in property sales, totaling 211 homes sold. Castle Rock had the most sales, reaching a total of 1,444 homes sold through September, which was 10.3% fewer sales than the previous year. One of the most significant increases in listing sales was seen in Inspiration, where there was a 72.9% increase in the number of homes sold, growing from 59 sales last year to 102 sales so far this year.
South Metro’s popularity among homebuyers has created an upward trend in home values within several neighborhoods through September of this year compared to the same time frame in 2021. For example, The Village at Castle Pines saw a 9.3% increase in average home prices, which brought the average price
to $1,875,500. Highlands Ranch also experienced this trend in appreciating home prices. Listings in this area sold for an average price of $838,795 through Q3 of 2022 – a 13.2% increase from the same period in 2021.
Conveniently located near all the very best activities and amenities that the Front Range has to offer, the South Metro community is a haven for homebuyers and sellers hoping to reach their lifestyle goals in Colorado.
The average price per square foot in Backcountry increased by 18.4% January through September 2022 compared to that of 2021.
2022 % Change
Average Price $1,420,046 $1,672,933 17.8%
Average Price Per Square Foot $426 $504 18.4%
Average Days on Market 8 17 112.5%
Highest Price $2,725,000 $4,400,000 61.5%
Properties Sold 84 61 -27.4%
% Sold Price to List Price 100.2% 98.0% -2.1%
Bell Mountain Ranch is a working horse ranch in Castle Rock that has been around for over 100 years. This beautiful, high-end neighborhood, located 40 minutes southeast of Denver, features 305 custom home sites ranging from three to 12 acres.
January through September
2022 % Change
Average Price $1,310,538 $1,399,375 6.8%
Average Price Per Square Foot $465 $483 3.8%
Average Days on Market 22 26 18.2%
Highest Price $1,850,000 $1,820,000 -1.6%
Properties Sold 13 8 -38.5%
% Sold Price to List Price 97.0% 97.5% 0.5%
2021 2022 % Change
Average Price $916,124 $1,061,625 15.9%
Average Price Per Square Foot $323 $377 17.0%
Average Days on Market 15 17 13.3%
Highest Price $2,988,889 $2,859,021 -4.3%
Properties Sold 233 227 -2.6%
% Sold Price to List Price 101.8% 101.6% -0.2%
Average
Highest
Average Price
Average Price Per
Days
Highest Price
% Sold Price to
Price
Average Price
Average
Average
Highest
The average number of days on market in Chaparral/Chenango decreased by 48.5% January through September 2022 compared to that of 2021.
Falcon Hills is a prestigious, master-planned, gated neighborhood located in Highlands Ranch. In this private neighborhood, residents enjoy the peaceful, quiet atmosphere with views of the Rocky Mountains and the Denver Metro area.
The average home price in Firelight increased by 22.0% January through September 2022 compared to that of 2021.
2022 % Change
Average Price $652,162 $728,185 11.7%
Average Price Per Square Foot $315 $377 19.8%
Average Days on Market 5 12 140.0%
Highest Price $1,170,000 $1,420,000 21.4%
Properties Sold 98 62 -36.7%
% Sold Price to List Price 105.7% 102.8% -2.7%
% Change
Average Price $1,285,000 $1,787,000 39.1%
Average Price Per Square Foot $321 $449 40.1%
Average Days on Market 35 8 -77.1%
Highest Price $1,650,000 $2,605,000 57.9%
Properties Sold 3 5 66.7%
% Sold Price to List Price 102.4% 101.0% -1.3%
2022 % Change
Average Price $701,145 $855,280 22.0%
Average Price Per Square Foot $304 $341 12.1%
Average Days on Market 6 13 116.7%
Highest Price $1,235,000 $1,590,000 28.7%
Properties Sold 78 89 14.1%
% Sold Price to List Price 105.0% 102.2% -2.6%
Average
Highest
Average Price
Average Price Per
Price
%
Price to
Average Price
Average Price
The average home price in Highlands Ranch Golf Club increased by 29.9% January through September 2022 compared to that of 2021.
Heritage Estates was built around the fairways of the Lone Tree Golf Course and is located near downtown Lone Tree and Bluffs Regional Park, a popular hiking and biking spot for residents.
Heritage Hills is a gated, luxury community in Lone Tree offering a combination of new builds and homes built in the last 20 years. Residents have access to a variety of parks, pools, tennis courts, and playgrounds within the community.
The number of homes sold in Inspiration increased by 72.9% January through September 2022 compared to that of 2021.
2022 % Change
Average Price $1,439,402 $1,605,335 11.5%
Average Price Per Square Foot $401 $460 14.9%
Average Days on Market 36 17 -52.8%
Highest Price $2,500,000 $2,500,025 0.0%
Properties Sold 45 31 -31.1%
% Sold Price to List Price 99.6% 98.2% -1.5%
2022 % Change
Average Price $741,049 $838,795 13.2%
Average Price Per Square Foot $330 $379 14.8%
Average Days on Market 6 12 100.0%
Highest Price $2,725,000 $4,400,000 61.5%
Properties Sold 1,265 1,036 -18.1%
% Sold Price to List Price 105.0% 102.1% -2.8%
2021 2022 % Change
Average Price $714,475 $801,279 12.1%
Average Price Per Square Foot $287 $333 15.9%
Average Days on Market 26 26 0.0%
Highest Price $1,050,000 $1,230,000 17.1%
Properties Sold 59 102 72.9%
% Sold Price to List Price 102.0% 99.8% -2.2%
Average Price
Average Price Per Square
Average Days on Market
Highest Price
% Sold Price to List Price
Average Price $952,213
Average Price Per Square Foot
Days on Market
Highest Price $4,350,000
Sold
% Sold Price to List Price
-6.3%
The average home sale price in Keene Ranch increased by 6.8% January through September 2022 compared to that of 2021.
KEENE RANCH LARKSPURAverage Price
Average Price Per Square
Average Days on Market
Highest Price
% Sold Price to
Lone Tree is a south Denver suburb, tucked just off I-25 in between Littleton and Parker. Conveniently located along the Light Rail at Lincoln Station (the last stop south), this Front Range town lies within Douglas County.
The average price per square foot in Pradera & Timbers increased by 30.0% January through September 2022 compared to that of 2021.
2022 % Change
Average Price $600,560 $698,904 16.4%
Average Price Per Square Foot $275 $328 19.1%
Average Days on Market 7 12 71.4%
Highest Price $1,106,000 $1,450,000 31.1%
Properties Sold 370 294 -20.5%
% Sold Price to List Price 103.7% 101.9% -1.7%
% Change
Average Price $1,166,427 $1,463,645 25.5%
Average Price Per Square Foot $335 $435 30.0%
Average Days on Market 22 17 -22.7%
Highest Price $2,275,000 $5,050,000 122.0%
Properties Sold 92 89 -3.3%
% Sold Price to List Price 101.4% 100.4% -1.0%
Ravenna is a charming custom home village in Littleton set among rolling hills and red rock outcroppings on a worldclass golf course in Waterton Canyon.
2022 % Change
Average Price $2,575,467 $2,599,998 1.0%
Average Price Per Square Foot $732 $940 28.6%
Average Days on Market 108 66 -38.9%
Highest Price $4,100,000 $3,950,000 -3.7%
Properties Sold 15 14 -6.7%
% Sold Price to List Price 96.4% 99.9% 3.7%
Average Price
Average Price Per Square
Average Days on Market
Highest Price
% Sold Price to List Price
Average Price $944,227
Average Price Per Square Foot
Average Days on Market
-62.5%
Highest Price $2,012,896 $2,600,000 29.2%
Sold
% Sold Price to List Price
Average Price
Average Price Per Square
Average Days on Market
Highest Price
%
The average price per square foot in Ridgegate increased by 12.7% January through September 2022 compared to that of 2021.
-27.9%
-0.8%
The small town of Roxborough Park lies between Chatfield State Park and Roxbourough State Park. Situated at the base of the foothills, Roxborough Park provides views of natural rock formations as well as the Rocky Mountains.
Price to
Sterling Ranch is a masterplanned community located just four miles south of C-470 and one mile west of Santa Fe in Littleton. Sterling Ranch offers new homes with state-of-the-art technologies and sustainable resources.
The average price per square foot in Westridge increased by 13.6% January through September 2022 compared to that of 2021.
2022 % Change
Average Price $749,600 $842,208 12.4%
Average Price Per Square Foot $285 $335 17.8%
Average Days on Market 16 15 -6.3%
Highest Price $1,495,000 $1,375,000 -8.0%
Properties Sold 61 77 26.2%
% Sold Price to List Price 101.5% 99.6% -1.9%
2022 % Change
Average Price $1,716,479 $1,875,500 9.3%
Average Price Per Square Foot $492 $573 16.5%
Average Days on Market 41 24 -41.5%
Highest Price $4,295,000 $4,595,000 7.0%
Properties Sold 94 83 -11.7%
% Sold Price to List Price 100.3% 99.4% -0.9%
2021 2022 % Change
Average Price $637,431 $712,314 11.7%
Average Price Per Square Foot $326 $370 13.6%
Average Days on Market 5 13 160.0%
Highest Price $1,226,000 $1,109,200 -9.5%
Properties Sold 128 82 -35.9%
% Sold Price to List Price 106.5% 102.0% -4.2%
MICRO MARKET REPORT | South Metro JANUARY SEPTEMBER 2022 • COLORADOMICROREPORTS.COM