Summit County MARKET UPDATE
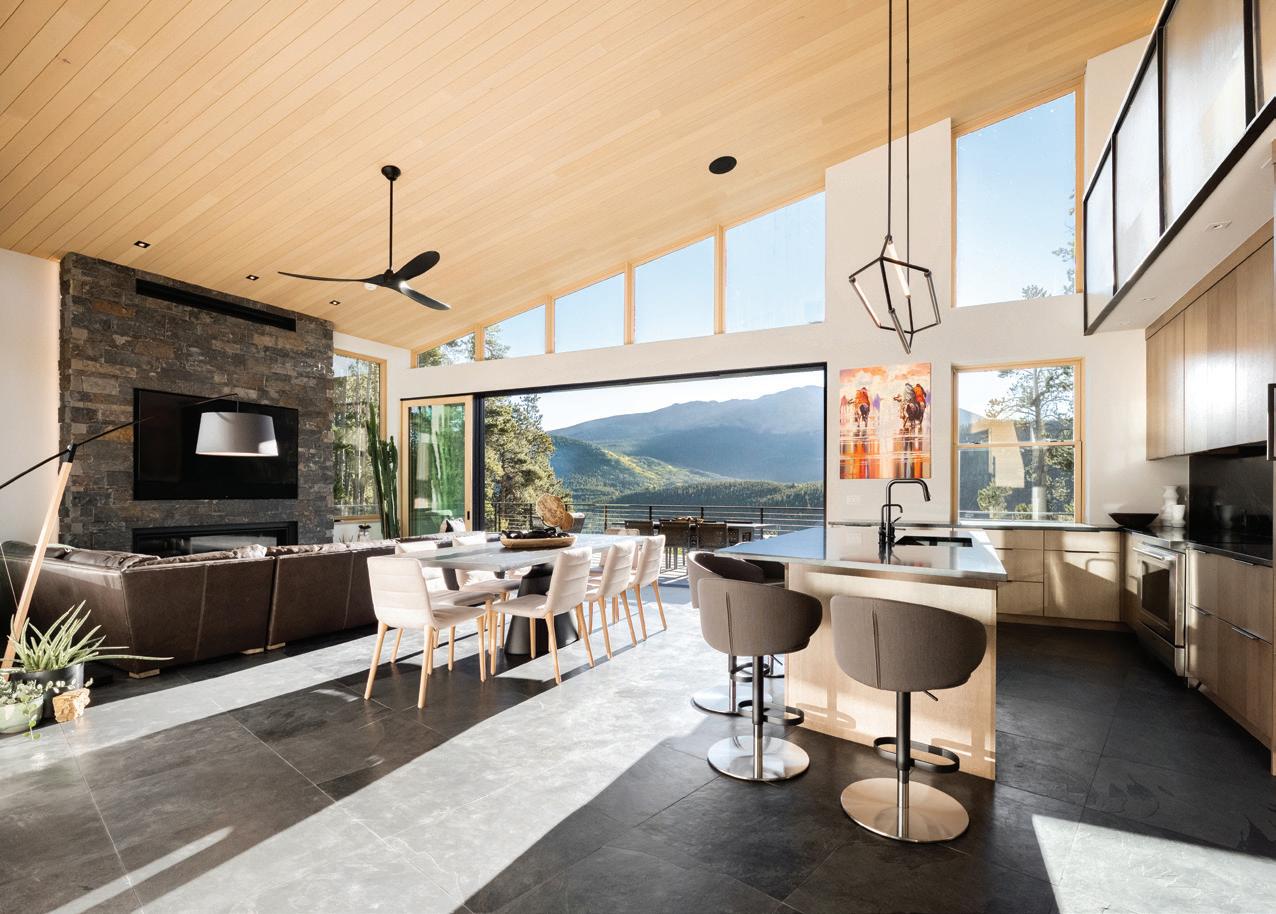
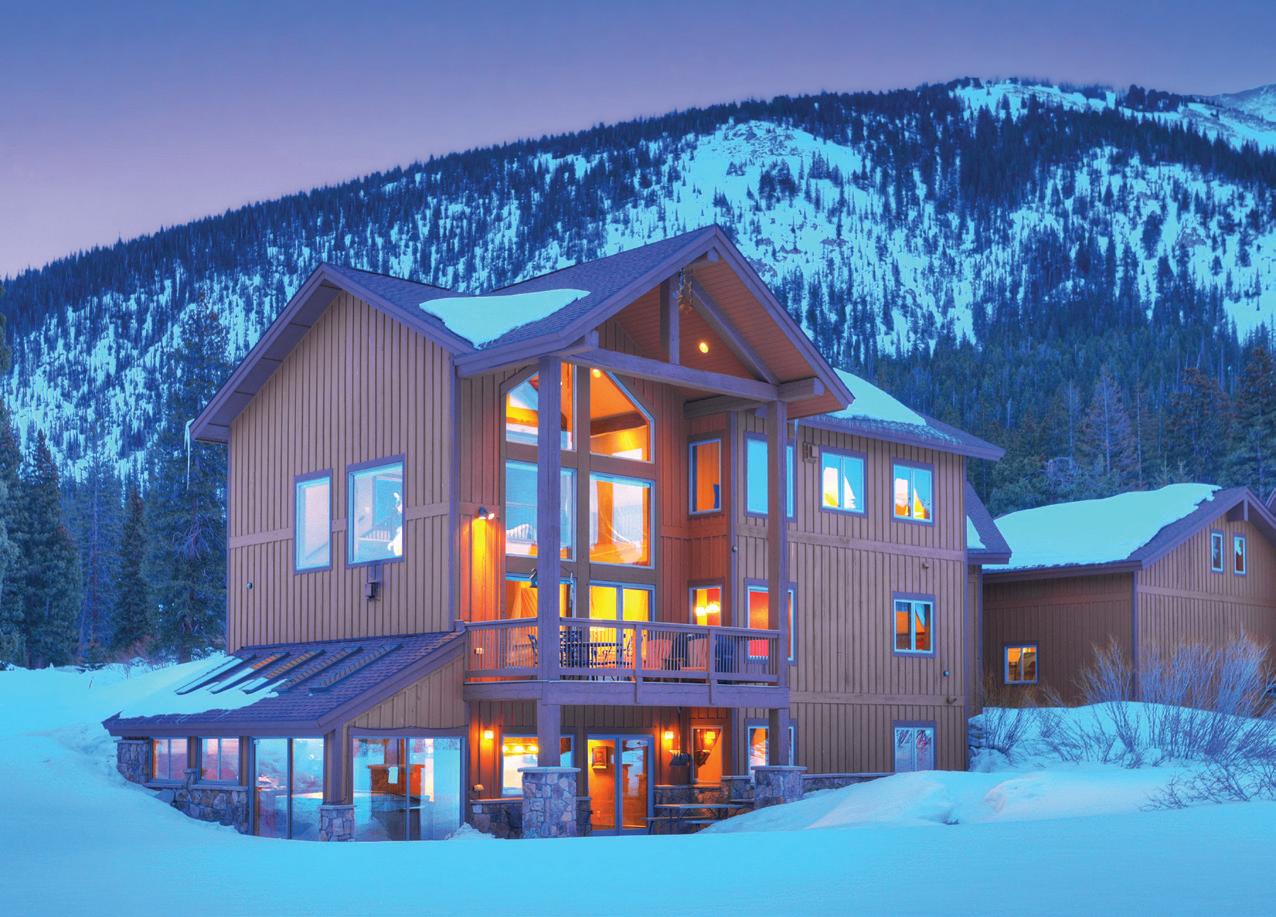
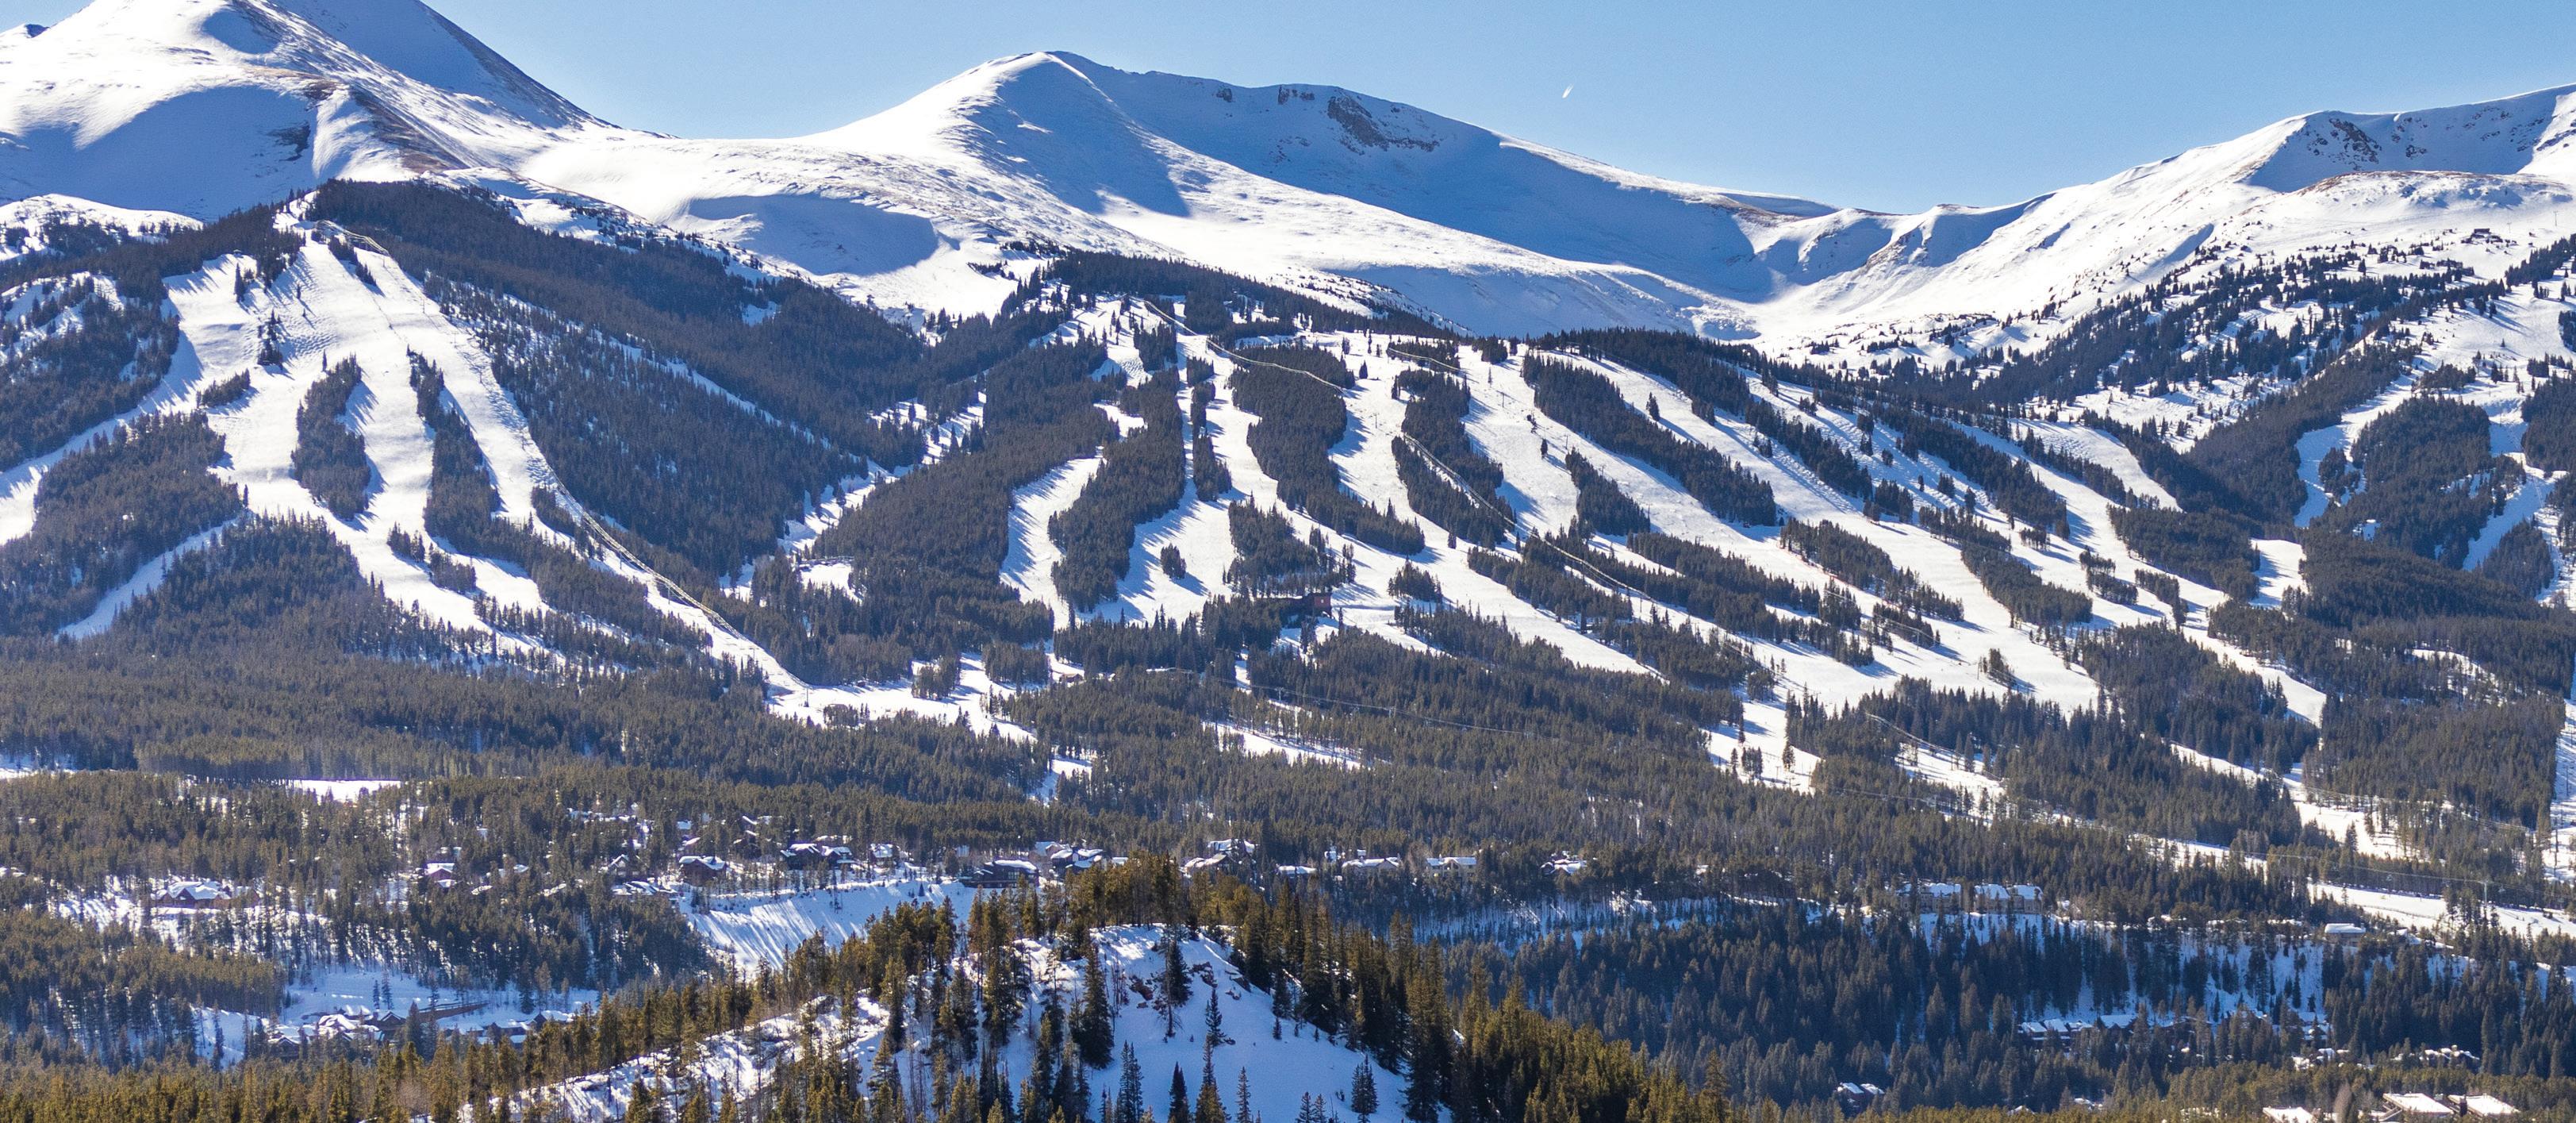
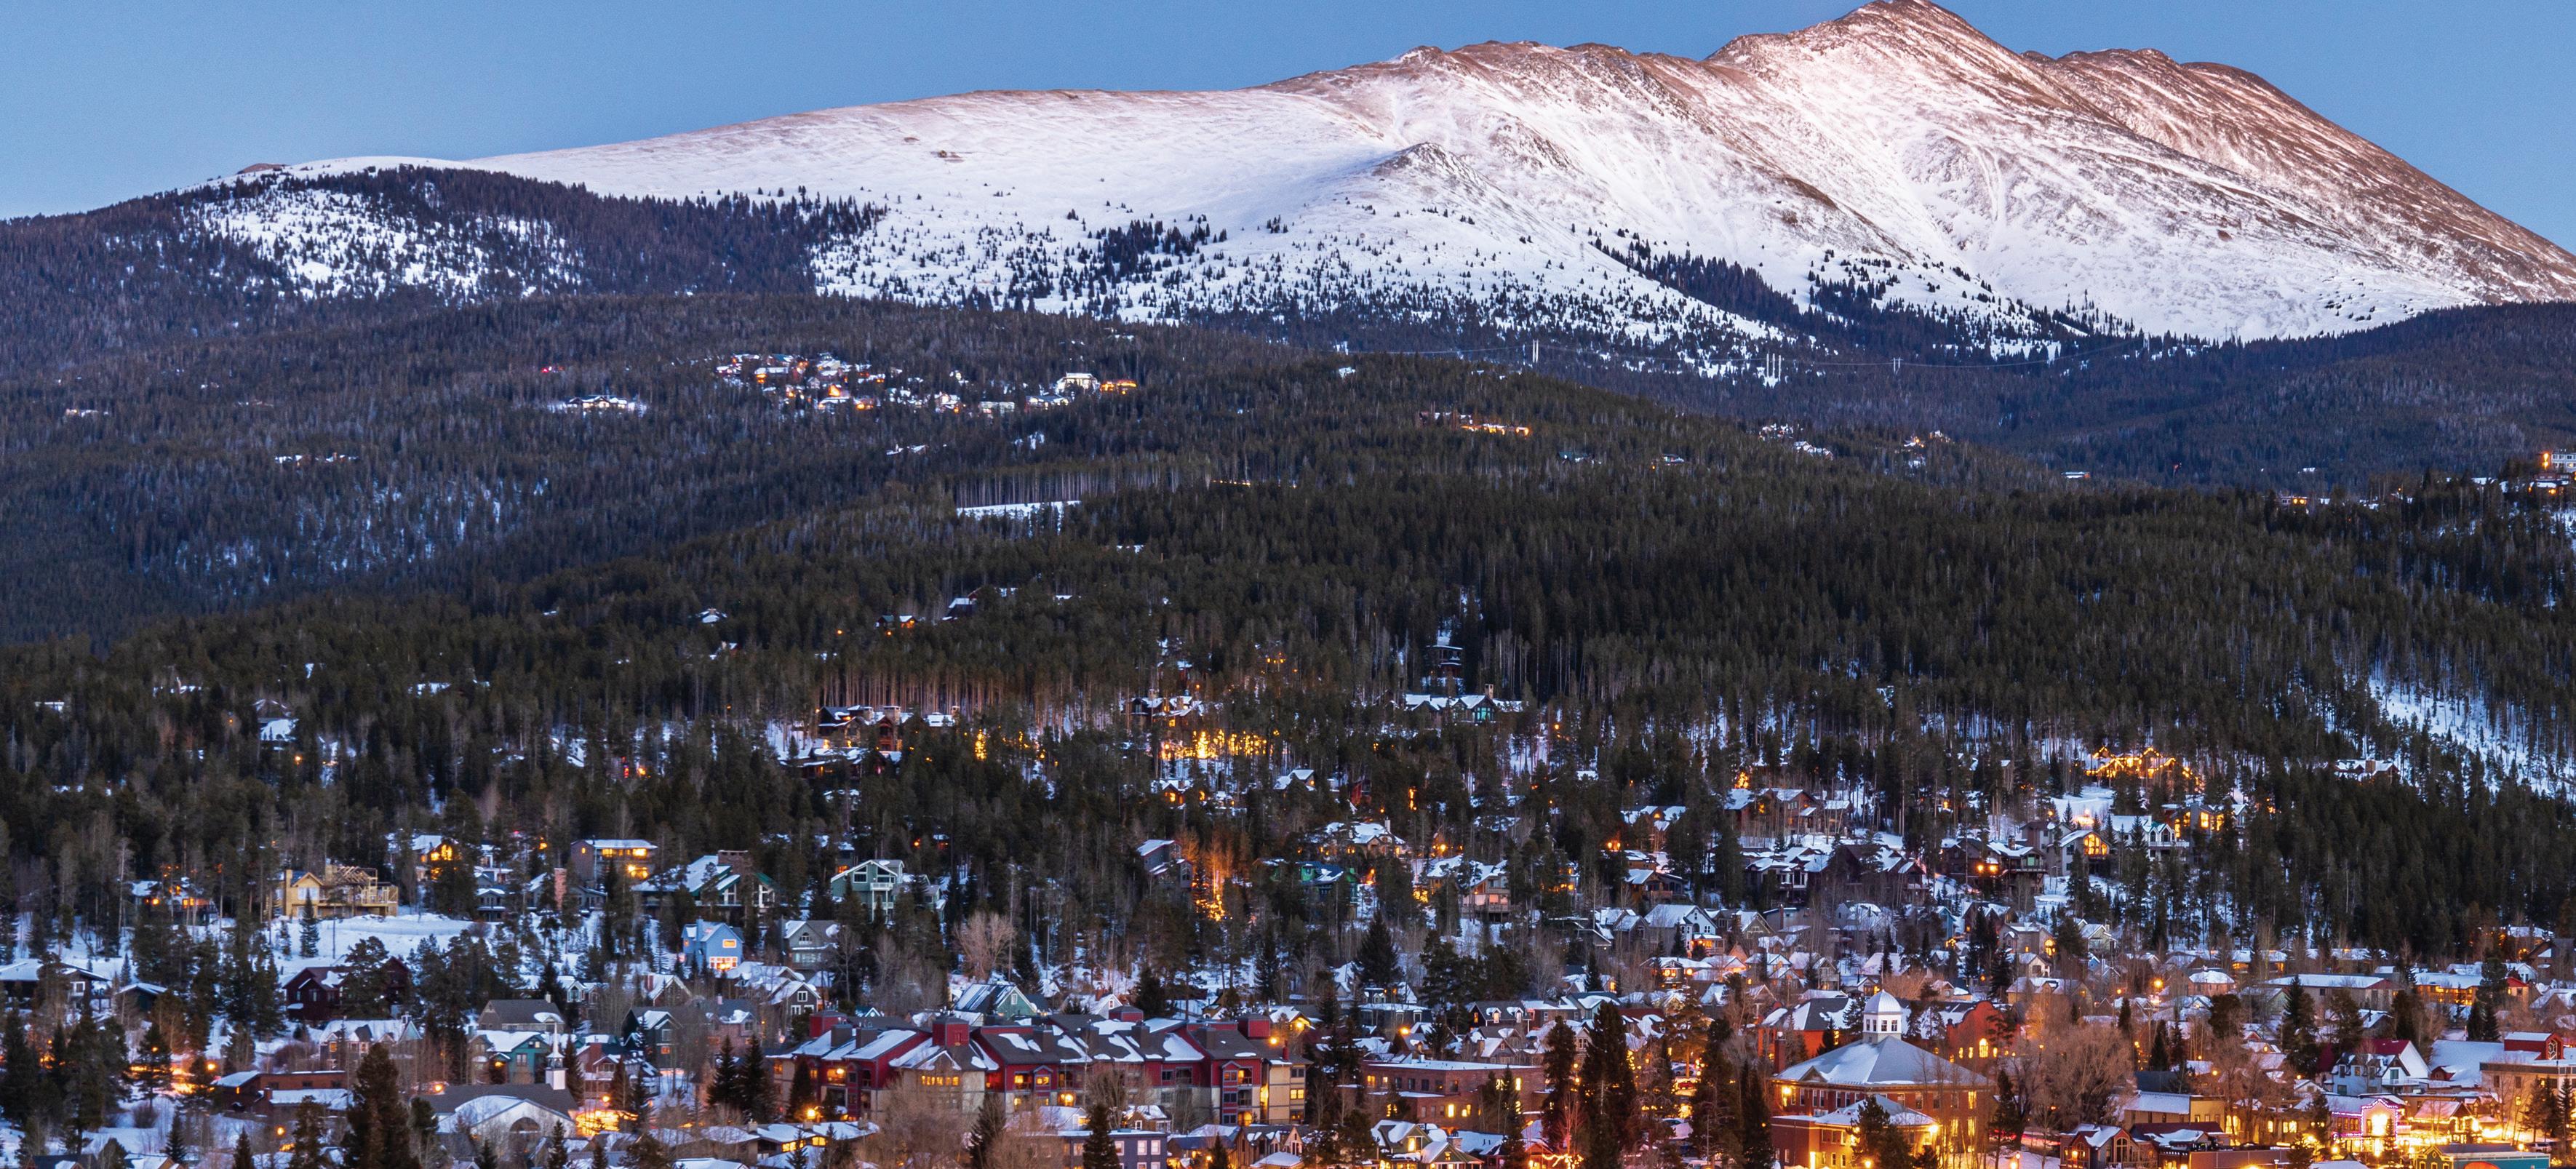
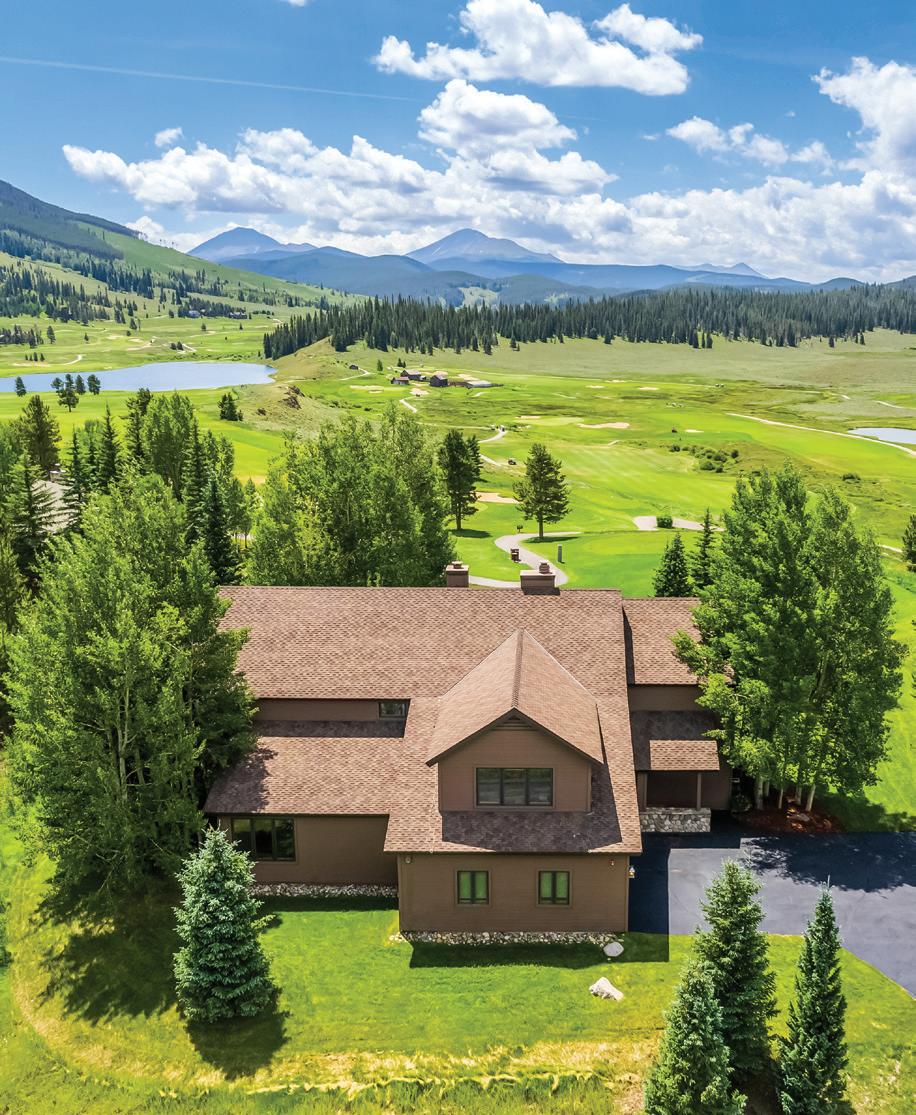
Founded in 1861, Summit County is best known for skiing. It’s home to Breckenridge, Keystone, Copper Mountain, and Arapahoe Basin resorts. Offering sweeping mountain vistas, access to Lake Dillon for boating and recreation, it’s just short drive to Denver.
The real estate market in Summit County showed stabilization after the record-breaking sales volume in 2020-2021. During the first quarter of 2023, sold listings throughout the county declined 18.3% when compared to 2022. Breckenridge had a 3.7% increase in average sold price from $1,767,953 to $1,833,451. The price per square foot declined 3.5% to $854. In Frisco, the average sold price was down 14.1% from $1,586,913 to $1,363,188. Frisco’s price per square foot held steady at $772.
The communities of Dillon and Summit Cove saw a 1.5% rise in average sold price from $858,318 to $871,200. Keystone remained popular for skiers and homebuyers alike, with a 26.1% jump in average sold price from $907,092 to $1,143,737. The average price
per square foot increased as well, up 18.8% from $724 to $860. Copper Mountain’s properties increased 13.4% in average sold price from $1,096,625 to $1,243,877.
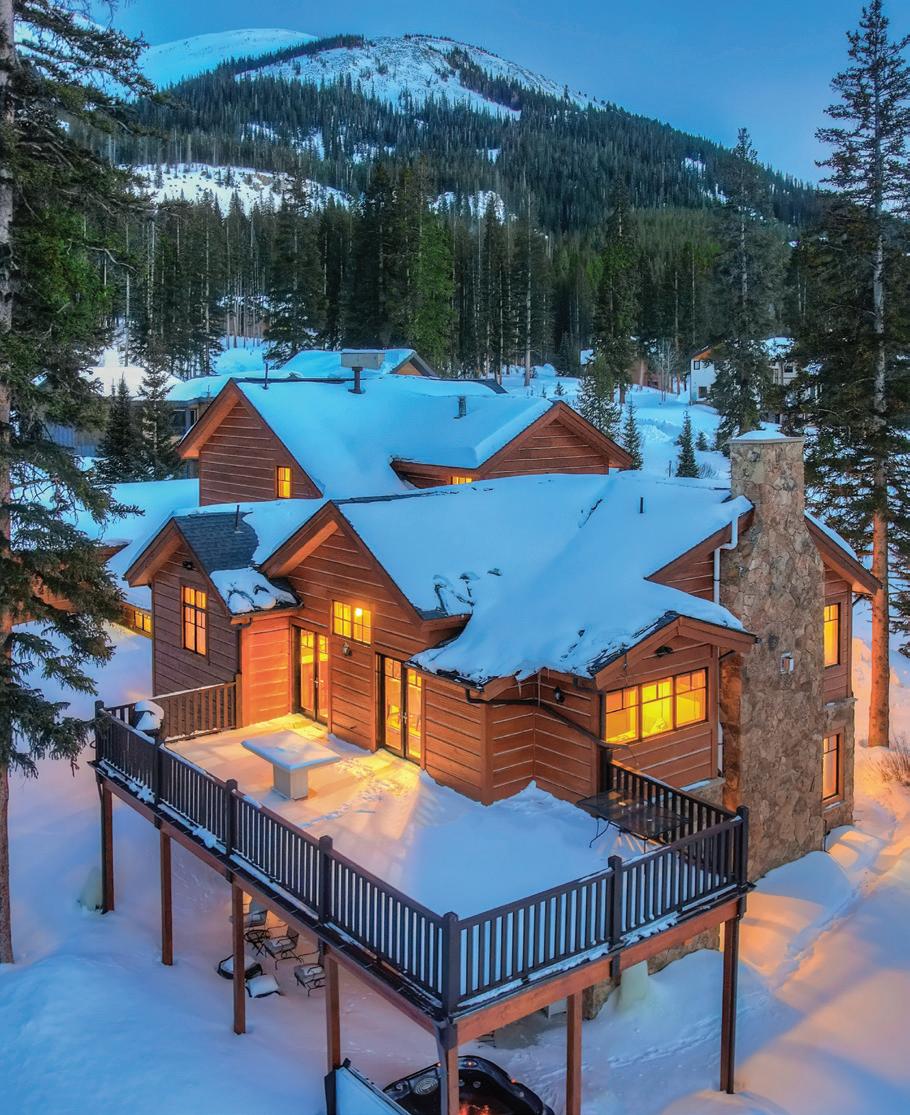
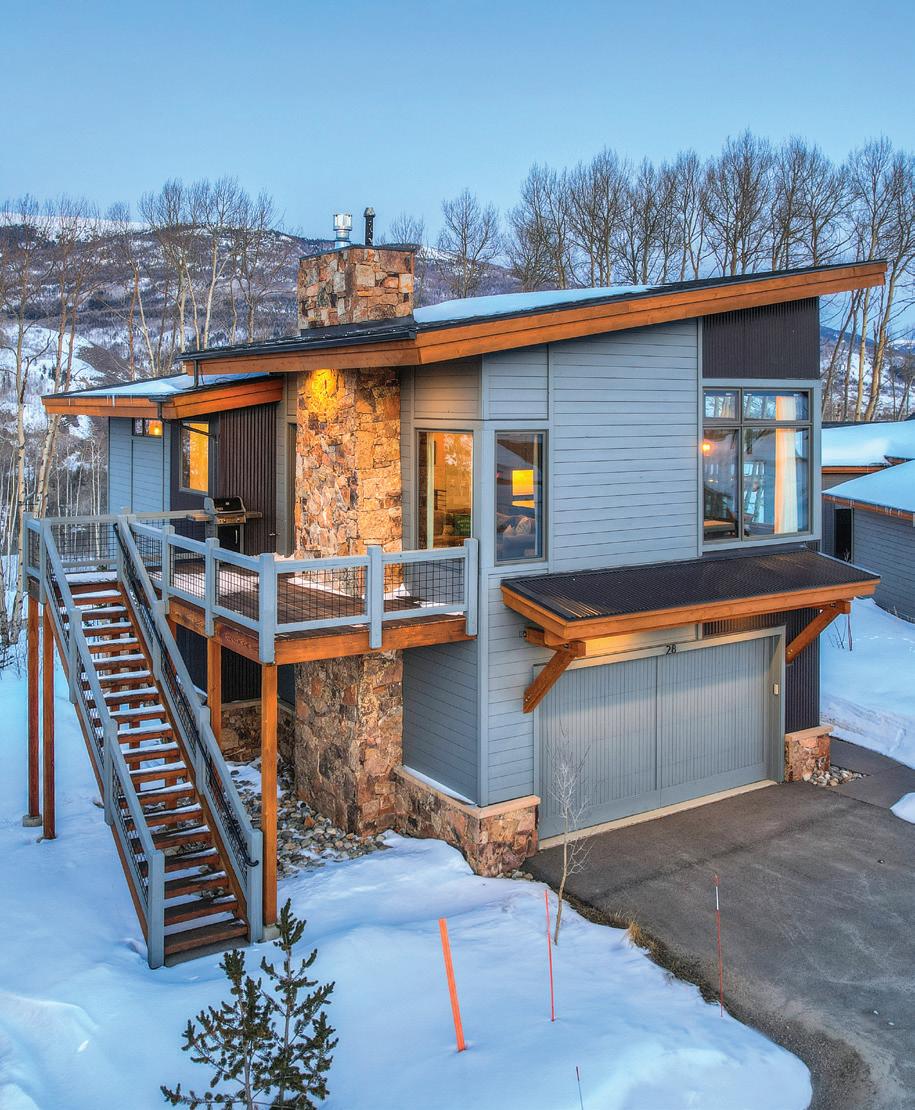
With properties ranging from ski-in, ski-out mountain homes to secluded retreats, Summit County continues to offer a variety of desirable options for both full-time residents and buyers in the market for vacation homes.
SUMMIT COUNTY


coloradomicroreports.com
in
Based on Information from Summit Association of Realtors®. This representation is based in whole or in part on data supplied by Summit Association of Realtors®. Summit Association of Realtors® does not
guarantee nor is
any way responsible for its accuracy. Data maintained by Summit Association of Realtors® may not reflect all real estate activity in the market.
January through March 2022 2023 % Change Sold Listings (All Properties) 278 227 -18.3% Sold Single Family 87 63 -27.6% Sold Condos/TH/DP 191 164 -14.1% Average Days on Market 23 55 139.1% Average Price $1,387,311 $1,274,655 -8.1% % Sold Price to List Price 101.9% 98.0% -3.8% Total Dollar Volume Sold $416,020,234 $308,866,265 -25.8% All Properties

MICRO MARKET REPORT | Summit County JANUARY - MARCH 2023 • COLORADOMICROREPORTS.COM livsothebysrealty.com
SUMMIT COUNTY NEIGHBORHOODS
3 5 4 6 2 1
1. Breckenridge 2. Copper Mountain 3. Frisco 4. Silverthorne 5. Dillon 6. Keystone
3.7%
The average price in Breckenridge increased by 3.7% January through March 2023 compared to that of 2022.
From historic Main Street where dozens of shops and restaurants can be enjoyed, to legendary snow skiing, to scenic summers, Breckenridge has all the hallmarks of a storied mountain retreat. But it’s the lifestyle Breckenridge provides that is as distinctive and alluring as the Ten Mile Range that surrounds this historic mountain town.
BRECKENRIDGE BRECKENRIDGE BRECKENRIDGE Single Family Homes January through March 2022 2023 % Change Average Price $2,829,617 $2,445,519 -13.6% Average Price per Square Foot $749.98 $717 -4.4% Average Days on Market 35 89 154.3% Highest Price $12,200,000 $6,000,000 -50.8% Properties Sold 33 29 -12.1% % Sold Price to Original List Price 100.7% 96.5% -4.1% All Properties January through March 2022 2023 % Change Average Price $1,767,953 $1,833,451 3.7% Average Price per Square Foot $885 $854 -3.5% Average Days on Market 27 91 237.0% Highest Price $12,200,000 $6,000,000 -50.8% Properties Sold 86 65 -24.4% % Sold Price to Original List Price 101.2% 96.4% -4.7%
Condominiums, Townhomes, Duplexes and Triplexes January through March 2022 2023 % Change Average Price $1,106,918 $1,340,395 21.1% Average Price per Square Foot $969 $965 -0.5% Average Days on Market 22 93 322.7% Highest Price $2,700,000 $4,500,000 66.7% Properties Sold 53 36 -32.1% % Sold Price to Original List Price 101.5% 96.3% -5.1%
14.1%
The average price in Frisco decreased by 14.1% January through March 2023 compared to that of 2022.
Founded in 1873, Frisco, Colorado is located just 70 miles west from Denver and is affectionately known by locals as the “Main Street of the Rockies”. This quaint and historic Colorado mountain town offers an abundance of activities to do year-round. Ideally situated near four ski resorts in Breckenridge, Keystone, Copper Mountain

FRISCO FRISCO FRISCO Single Family Homes January through March 2022 2023 % Change Average Price $2,281,250 $1,999,625 -12.3% Average Price per Square Foot $643 $610 -5.1% Average Days on Market 47 42 -10.6% Highest Price $3,250,000 $2,397,000 -26.2% Properties Sold 6 4 -33.3% % Sold Price to Original List Price 94.2% 96.9% 2.8% All Properties January through March 2022 2023 % Change Average Price $1,586,913 $1,363,188 -14.1% Average Price per Square Foot $772 $772 -0.1% Average Days on Market 15 33 120.0% Highest Price $3,250,000 $2,397,000 -26.2% Properties Sold 22 24 9.1% % Sold Price to Original List Price 102.8% 97.6% -5.1% Condominiums, Townhomes, Duplexes and Triplexes January through March 2022 2023 % Change Average Price $1,326,536 $1,235,900 -6.8% Average Price per Square Foot $821 $804 -2.0% Average Days on Market 3 32 966.7% Highest Price $2,192,850 $2,250,000 2.6% Properties Sold 16 20 25.0% % Sold Price to Original List Price 106.1% 97.7% -7.8%
and Arapahoe
of
and
Basin, the Town
Frisco attracts skiers
riders from all over the world.
12.2%
The average price per square foot in Dillon/Summit Cove decreased by 12.2% January through March 2023 compared to that of 2022.
The Town of Dillon is a little Colorado mountain town that’s big on outdoor activities. Summertime is when Dillon comes to life as it offers a variety of activities to enjoy including the annual Dillon Farmer’s Market, concerts and theater productions at the Dillon Amphitheater, live music on the water, and fun-filled days on Lake Dillon.
DILLON/SUMMIT COVE DILLON/SUMMIT COVE DILLON/SUMMIT COVE Single Family Homes January through March 2022 2023 % Change Average Price $1,900,000 $1,297,500 -31.7% Average Price per Square Foot $516 $531 3.1% Average Days on Market 21 65 209.5% Highest Price $1,900,000 $1,750,000 -7.9% Properties Sold 6 6 0.0% % Sold Price to Original List Price 101.8% 95.8% -5.9% All Properties January through March 2022 2023 % Change Average Price $858,318 $871,200 1.5% Average Price per Square Foot $667 $585 -12.2% Average Days on Market 9 37 311.1% Highest Price $2,389,000 $1,750,000 -26.7% Properties Sold 23 22 -4.3% % Sold Price to Original List Price 104.3% 98.5% -5.6% Condominiums, Townhomes, Duplexes and Triplexes January through March 2022 2023 % Change Average Price $691,253 $711,338 2.9% Average Price per Square Foot $720 $605 -16.0% Average Days on Market 4 27 575.0% Highest Price $2,389,000 $1,430,000 -40.1% Properties Sold 17 16 -5.9% % Sold Price to Original List Price 105.2% 99.5% -5.4%
15.9%
The percentage of properties sold in Silverthorne/Wildernest increased by 15.9% January through March 2023 compared to that of 2022.
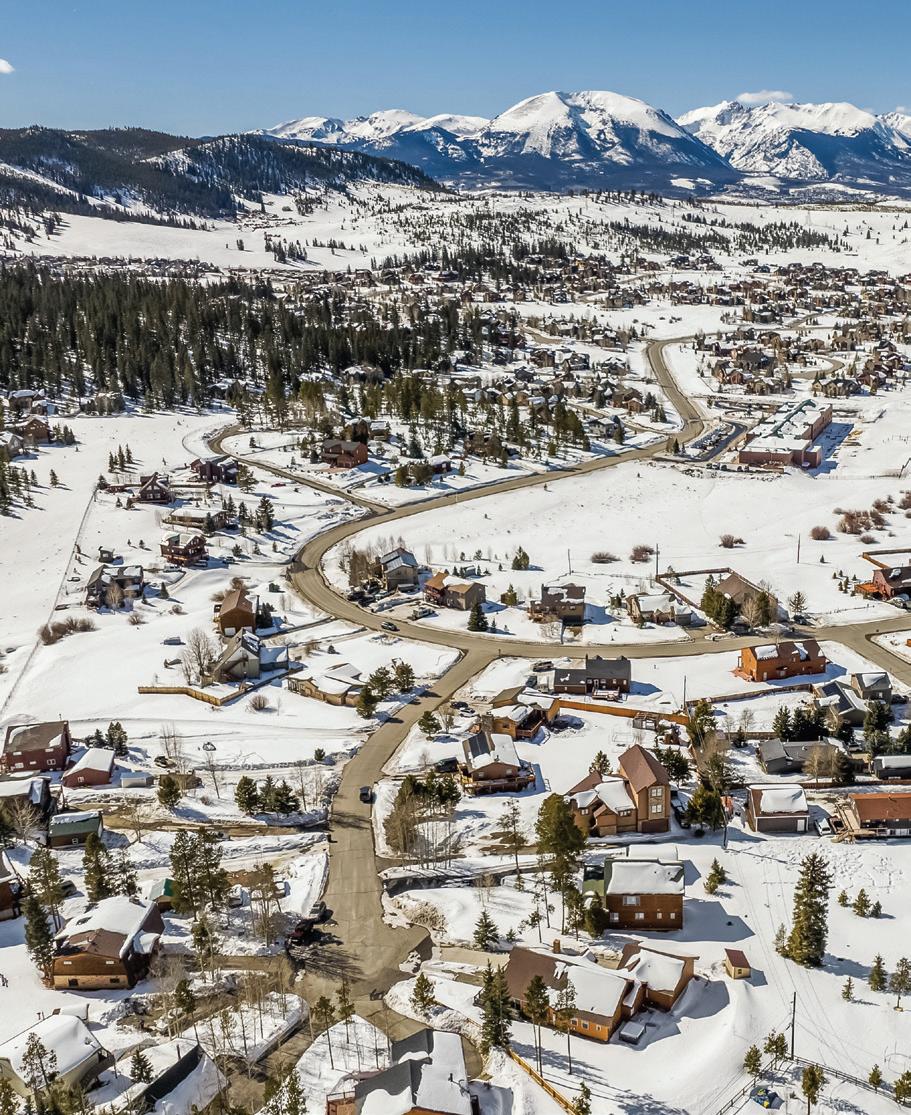
Located in the heart of Summit County and cradled in the Blue River Valley, Silverthorne is the quintessential Colorado mountain town. Silverthorne is situated amidst the world’s winter playgrounds, while being surrounded by the majestic Rocky Mountains which makes it the perfect location for yearround adventure.
SILVERTHORNE/WILDERNEST SILVERTHORNE/WILDERNEST SILVERTHORNE/WILDERNEST Single Family Homes January through March 2022 2023 % Change Average Price $2,365,033 $1,393,579 -41.1% Average Price per Square Foot $627 $559 -10.8% Average Days on Market 51 51 0.0% Highest Price $6,500,000 $2,850,000 -56.2% Properties Sold 35 18 -48.6% % Sold Price to Original List Price 99.5% 100.8% 1.2% All Properties January through March 2022 2023 % Change Average Price $1,524,485 $950,167 -37.7% Average Price per Square Foot $621 $603 -2.8% Average Days on Market 36 40 11.1% Highest Price $6,500,000 $2,850,000 -56.2% Properties Sold 69 80 15.9% % Sold Price to Original List Price 101.3% 99.5% -1.9% Condominiums, Townhomes, Duplexes and Triplexes January through March 2022 2023 % Change Average Price $659,215 $821,435 24.6% Average Price per Square Foot $615 $616 0.2% Average Days on Market 19 37 94.7% Highest Price $1,300,000 $1,935,000 48.8% Properties Sold 34 62 82.4% % Sold Price to Original List Price 103.2% 99.1% -4.0%
26.1%
The average price in Keystone increased by 26.1% January through March 2023 compared to that of 2022.
Keystone, Colorado, founded in 1970 and nestled between three separate mountains, is home to Keystone Resort, an alpine ski resort. The resort features five expert bowls and 131 slopes on 3,000 acres that includes tree skiing, smooth cruisers, mogul-covered runs as well as wide groomers for skiers and snowboards of all ability levels to enjoy.
KEYSTONE KEYSTONE KEYSTONE Single Family Homes January through March 2022 2023 % Change Average Price $2,157,824 $2,386,500 10.6% Average Price per Square Foot $632 $770 22.0% Average Days on Market 44 79 79.5% Highest Price $4,295,000 $4,300,000 0.1% Properties Sold 5 5 0.0% % Sold Price to Original List Price 97.6% 96.5% -1.2% All Properties January through March 2022 2023 % Change Average Price $907,092 $1,143,737 26.1% Average Price per Square Foot $724 $860 18.8% Average Days on Market 14 59 321.4% Highest Price $4,295,000 $4,300,000 0.1% Properties Sold 62 25 -59.7% % Sold Price to Original List Price 102.5% 97.3% -5.0% Condominiums, Townhomes, Duplexes and Triplexes January through March 2022 2023 % Change Average Price $797,379 $833,046 4.5% Average Price per Square Foot $732 $882 20.6% Average Days on Market 11 54 390.9% Highest Price $1,865,000 $1,650,000 -11.5% Properties Sold 57 20 -64.9% % Sold Price to Original List Price 10.9% 97.5% 794.6%
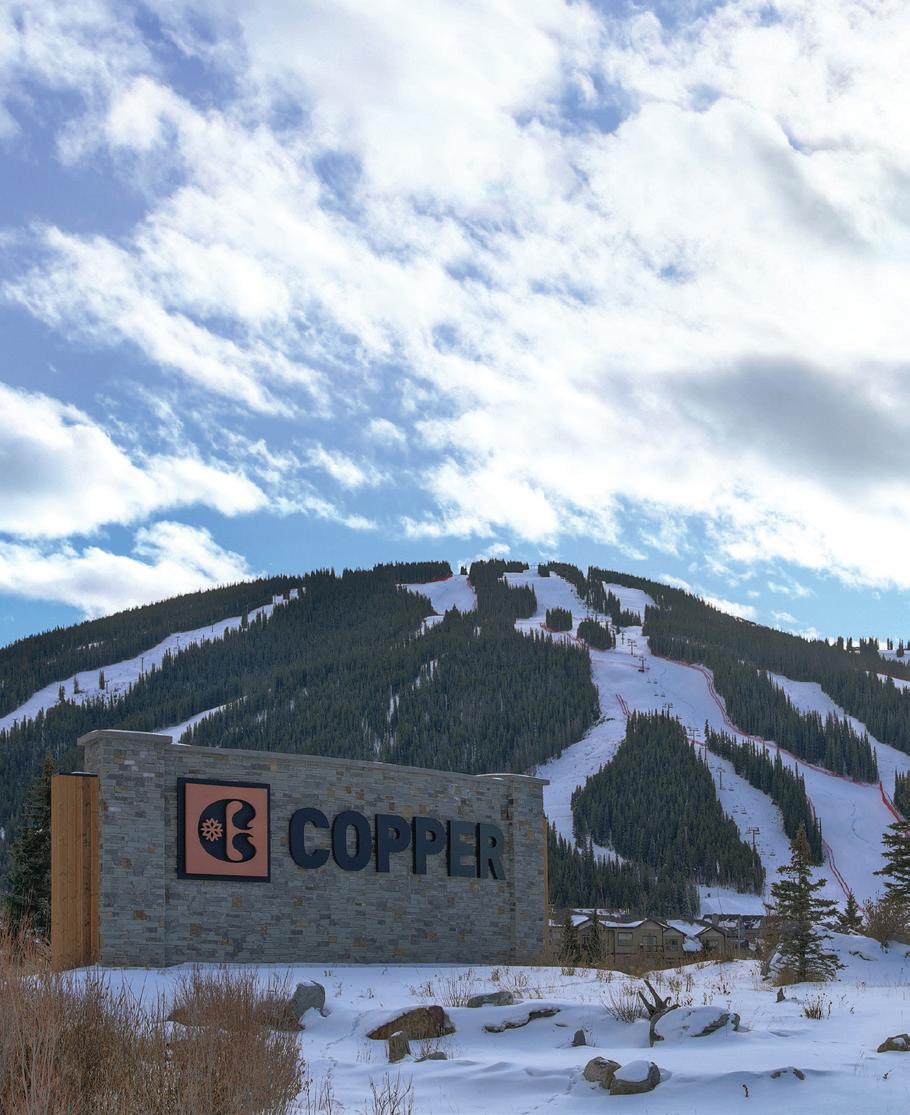
20.3%
The average price per square foot in Copper Mountain increased by 20.3% January through March 2023 compared to that of 2022.
Copper Mountain is located just 75 miles west of Denver and like most of the other notable areas of Summit County, Colorado, it is most known for its world-class ski resort. The resort features over 2,500 acres of naturally divided terrain catering to all skill levels, as well as terrain parks and the Woodward Barn Half Pipe where the world’s best skiers and riders compete to be the best.
COPPER MOUNTAIN COPPER MOUNTAIN COPPER MOUNTAIN Single Family Homes January through March 2022 2023 % Change Average Price $3,600,000 $3,500,000 -2.8% Average Price per Square Foot $768 $822 7.1% Average Days on Market 18 68 277.8% Highest Price $4,200,000 $3,500,000 -16.7% Properties Sold 2 1 -50.0% % Sold Price to Original List Price 99.4% 97.2% -2.2% All Properties January through March 2022 2023 % Change Average Price $1,096,625 $1,243,877 13.4% Average Price per Square Foot $867 $1,043 20.3% Average Days on Market 7 22 214.3% Highest Price $4,200,000 $3,500,000 -16.7% Properties Sold 16 11 -31.3% % Sold Price to Original List Price 100.6% 98.5% -2.1% Condominiums, Townhomes, Duplexes and Triplexes January through March 2022 2023 % Change Average Price $739,000 $1,018,265 37.8% Average Price per Square Foot $881 $99 -88.8% Average Days on Market 6 18 200.0% Highest Price $985,000 $3,175,000 222.3% Properties Sold 14 10 -28.6% % Sold Price to Original List Price 100.7% 98.6% -2.1%
04 07 28 NATIONAL PARKS MOUNTAIN RANGES SKI AREAS & RESORTS
WHY COLORADO?


AVG DAYS OF SUNSHINE ANNUALY CRAFT BREWERIES 300 350+
MICRO MARKET REPORT | Summit County JANUARY - MARCH 2023 • COLORADOMICROREPORTS.COM