Micro Market Report


SUMMIT COUNTY, COLORADO


983 Emerald Road25 Sage Drive Q3 2022

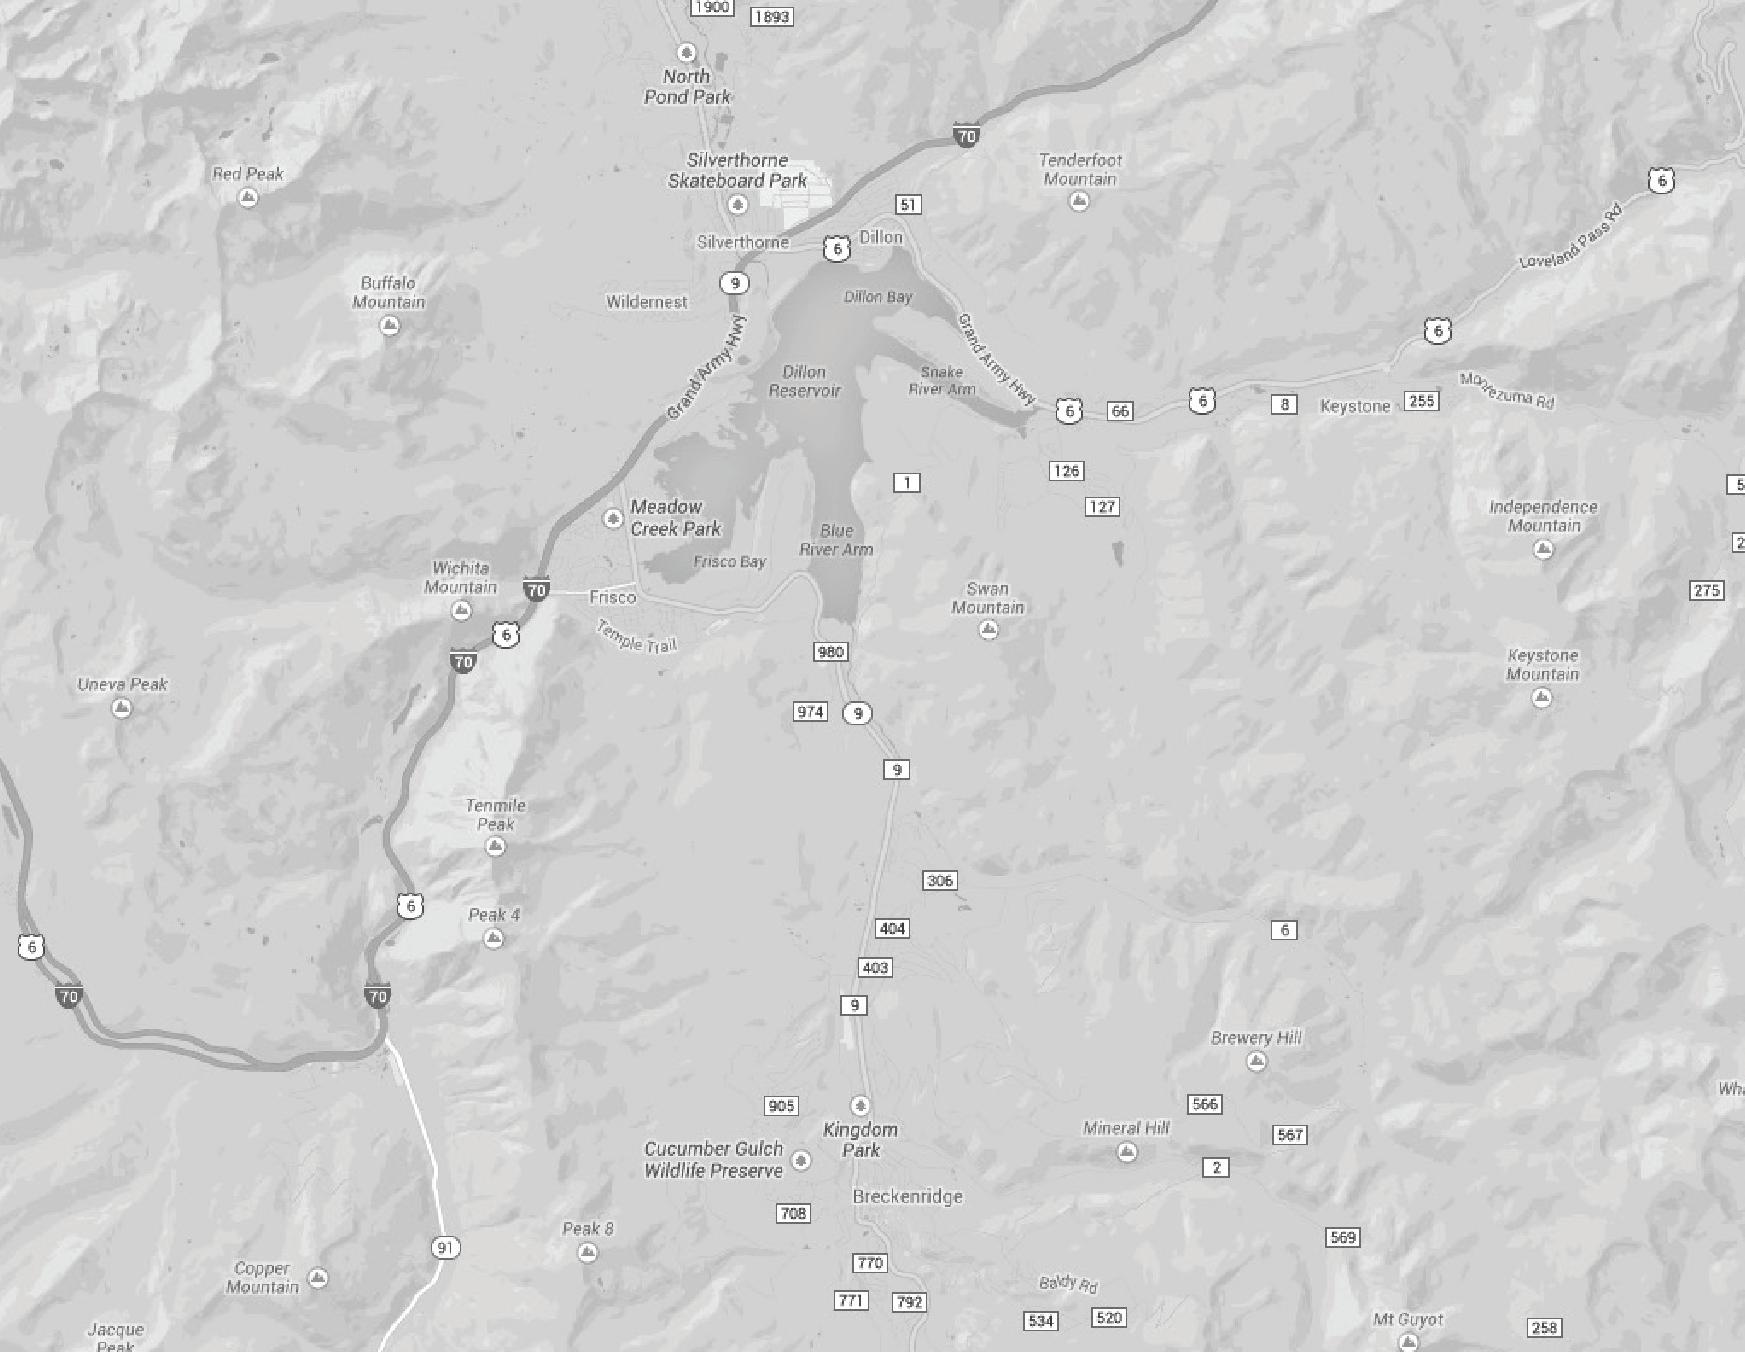
Established in 1861 and originally renowned for its silver and gold mines, Summit County is comprised of the mountain towns Breckenridge, Dillon, Frisco, Copper, Keystone, and Silverthorne. Known for its high elevation and world-class ski resorts, Summit County has no shortage of year-round activities, including hiking and biking on the miles of trails and boating on Lake Dillon. The excitement continues with endless craft breweries and restaurants and performances at the Dillon Amphitheatre. Summit County is less than a hundred miles from Denver, making it easily accessible for Colorado Front Range residents and visitors alike.
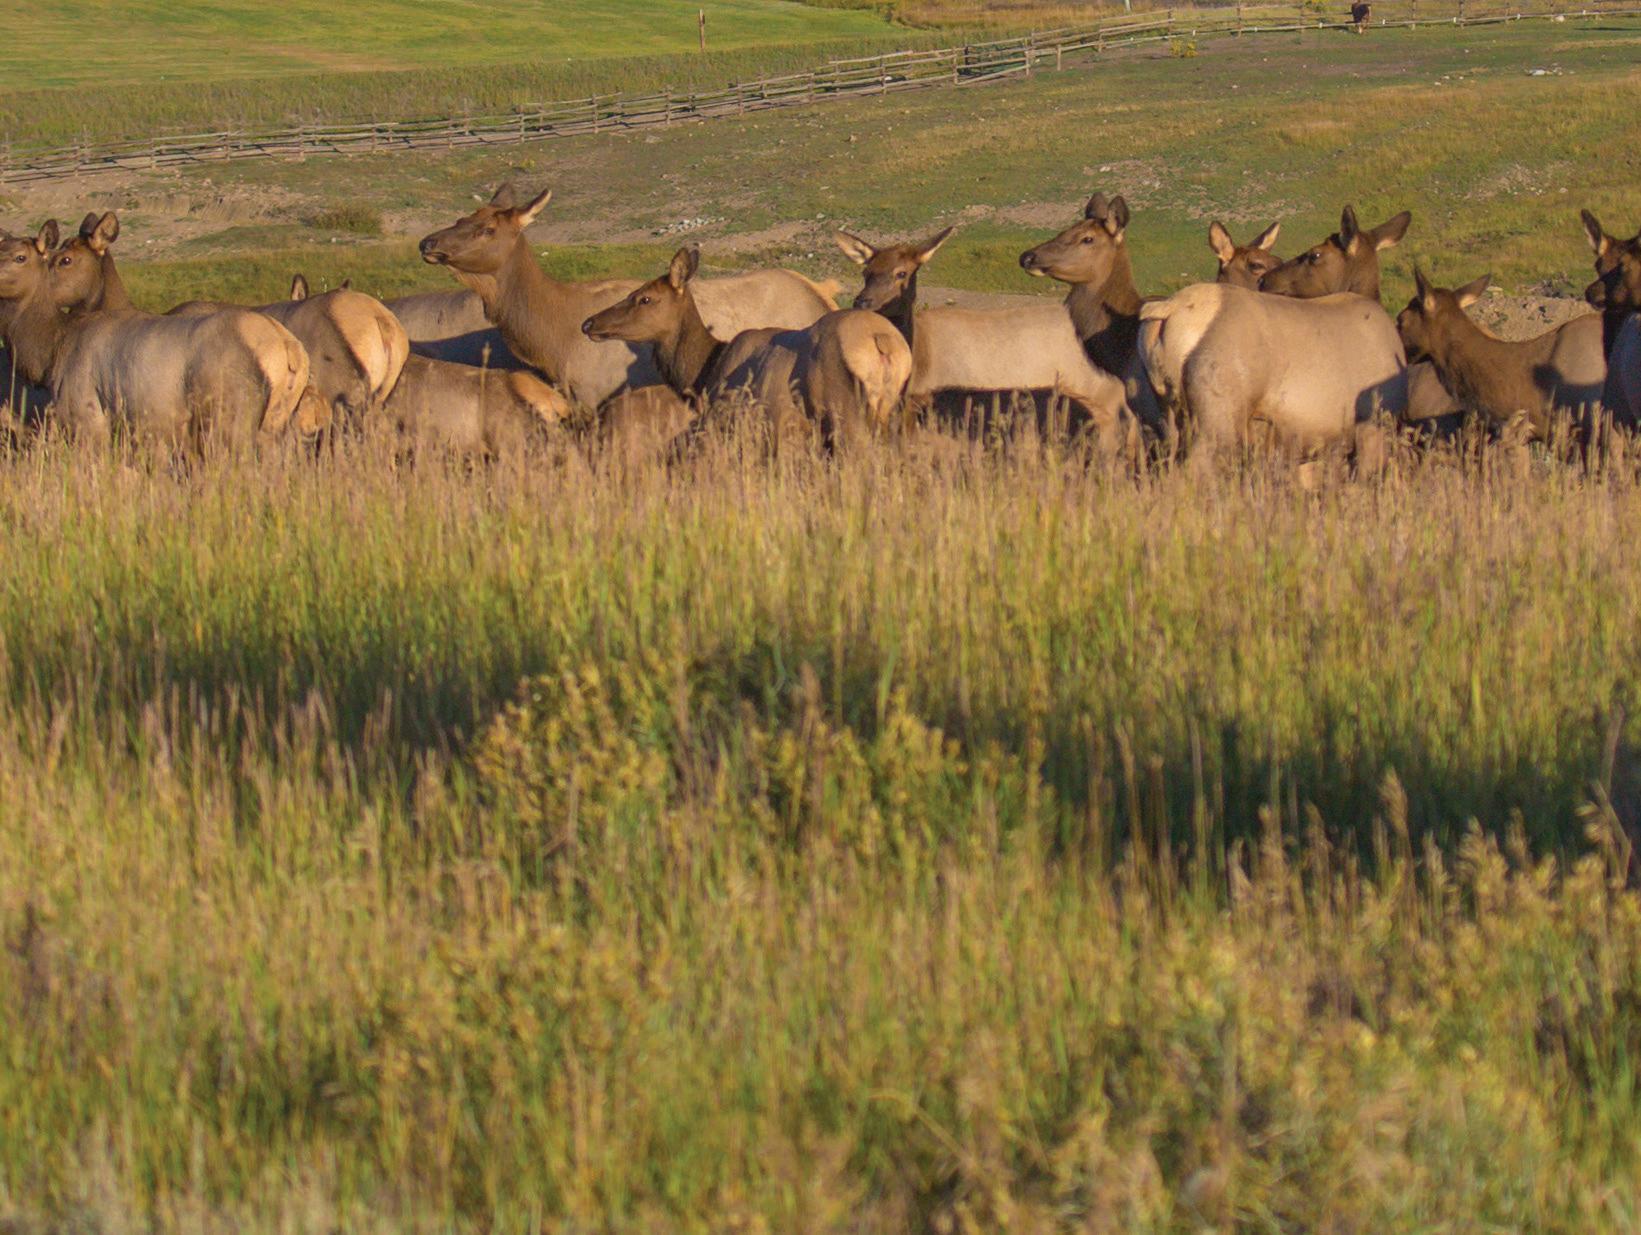
With just over 31,000 residents and growing, Summit County is a mecca for outdoor enthusiasts seeking a place where they can chase adventure. This migration to the mountains has only grown stronger in the past several years, with people leaving the congestion of big cities to live in smaller communities with access to outdoor recreation. As this desire grows stronger, real estate in Summit County will continue to grow in popularity. Every quarter, LIV Sotheby’s International Realty produces a Micro Market Report focused on the real estate activity in Summit County neighborhoods. For quarter three, this report is a year-over-year comparison of the first nine months of 2021 compared to the first nine months of 2022, analyzing January through September.
Summit County remains a desirable market, reflected in the 18.1% increase in average sold price

to $1.29 million in properties across the county. After a redhot sales year in 2021, inventory is lower, resulting in a 35% decrease in sold listings compared to the previous year. Breckenridge had the highest average sold price, up 16.3% to $1.72 million. Keystone saw the largest jump in average sold price, increasing 27.2% to $1.02 million in the past nine months. Frisco also had a significant 22.2% jump in average sold price, from $1.04 million to $1.27 million. Inventory in Dillon/Summit Cove was only on the market for an average of 12 days, as buyers dashed to make quick decisions in this lakefront community.

Continue reading to learn more about how the real estate market in Summit County performed during the first nine months of the year. This Colorado Micro Market Report includes real estate data statistics for the following neighborhoods (single family, unless otherwise indicated): Breckenridge, Copper Mountain, Dillon, Frisco, Keystone, and Silverthorne.
Based on Information from Summit Association of Realtors®. This representation is based in whole or in part on data supplied by Summit Association of Realtors®. Summit Association of Realtors® does not guarantee nor is in any way responsible for its accuracy. Data maintained by Summit Association of Realtors® may not reflect all real estate activity in the market.
The average price in Breckenridge increased by 16.3% January through September 2022 compared to that of 2021.
From historic Main Street where dozens of shops and restaurants can be enjoyed, to legendary snow skiing, to scenic summers, Breckenridge has all the hallmarks of a storied mountain retreat. But it’s the lifestyle Breckenridge provides that is as distinctive and alluring as the Ten Mile Range that surrounds this historic mountain town.
2022 % Change
Average Price $1,483,242 $1,725,715 16.3%
Average Price per Square Foot
Average Days on Market
$898 20.5%
26 -23.5%
Highest Price $17,000,000 $12,200,000 -28.2%
Properties Sold
-43.2%
% Sold Price to Original List Price 100.0% 99.1% -0.9%
2022 % Change
Average Price $2,166,348 $2,366,578 9.2%
Average Price per Square Foot $633.04 $772 21.9%
Average Days on Market
28 -31.7%
Highest Price $17,000,000 $12,200,000 -28.2%
Properties Sold
149 -39.7%
% Sold Price to Original List Price 100.0% 98.7% -1.3%
Single Family Homes
Average Price $949,295 $1,167,302 23.0%
Average Price per Square Foot $833 $1,009 21.1%
Average Days on Market 29 25 -13.8%
Highest Price $3,631,500 $4,400,000 21.2%
Properties Sold
171 -45.9%
% Sold Price to Original List Price 100.1% 99.5% -0.6%
Average Price
Average Price
Average
Highest Price
The average price per square foot in Frisco increased by 18.5%
January through September 2022 compared to that of 2021.
Average Price
Average Price per
Average
Highest Price
Price
January through
Average Price
Average Price per Square
Average Days on Market
Highest Price
%
Price to
Founded in 1873, Frisco, Colorado is located just 70 miles west from Denver and is affectionately known by locals as the “Main Street of the Rockies”. This quaint and historic Colorado mountain town offers an abundance of activities to do year-round. Ideally situated near four ski resorts in Breckenridge, Keystone, Copper Mountain and Arapahoe Basin, the Town of Frisco attracts skiers and riders from all over the world.

The average days on market in Dillon/Summit Cove increased by 9.1% January through September 2022 compared to that of 2021.
Average Price $817,764 $922,053 12.8%
Average Price per Square Foot $545 $692 27.1%
Average Days on Market 11 12 9.1%
Highest Price $3,500,000 $2,475,000 -29.3%
Properties Sold 164 103 -37.2%
% Sold Price to Original List Price 102.7% 101.8% -0.9%
Average Price $1,297,338 $1,344,472 3.6%
Average Price per Square Foot $491 $578 17.9%
Average Days on Market 17 15 -11.8%
Highest Price $3,500,000 $2,040,000 -41.7%
Properties Sold 44 28 -36.4%
% Sold Price to Original List Price 103.6% 101.1% -2.4%

The Town of Dillon is a little Colorado mountain town that’s big on outdoor activities. Summertime is when Dillon comes to life as it offers a variety of activities to enjoy including the annual Dillon Farmer’s Market, concerts and theater productions at the Dillon Amphitheater, live music on the water, and fun-filled days on Lake Dillon.
Average Price $641,920 $764,350 19.1%
Average Price per Square Foot $565 $735 30.1%
Average Days on Market 9 10 11.1%
Highest Price $1,605,000 $2,475,000 54.2%
Properties Sold 120 75 -37.5%
% Sold Price to Original List Price 102.4% 102.1% -0.3%
Average Price
Average Price per Square
Average Days on
Highest Price
%
Price to
Average Price
Average Price per Square Foot
Average Days on Market
Highest Price
% Sold Price to Original List Price
The highest price in Silverthorne/ Wildernest increased by 71.1%
January through September 2022 compared to that of 2021.
Average Price
Average Price per Square Foot
Average Days on Market
Highest Price
%
Price to
Located in the heart of Summit County and cradled in the Blue River Valley, Silverthorne is the quintessential Colorado mountain town. Silverthorne is situated amidst the world’s winter playgrounds, while being surrounded by the majestic Rocky Mountains which makes it the perfect location for yearround adventure.
The average price in Keystone increased by 27.2% January through September 2022 compared to that of 2021.
Keystone, Colorado, founded in 1970 and nestled between three separate mountains, is home to Keystone Resort, an alpine ski resort. The resort features five expert bowls and 131 slopes on 3,000 acres that includes tree skiing, smooth cruisers, mogul-covered runs as well as wide groomers for skiers and snowboards of all ability levels to enjoy.
2022 % Change
Average Price $804,447 $1,023,473 27.2%
Average Price per Square Foot $647 $800 23.8%
Average Days on Market 42 14 -66.7%
Highest Price $4,025,000 $4,375,000 8.7%
Properties Sold 246 197 -19.9%
% Sold Price to Original List Price 101.0% 100.7% -0.3%
Average Price $1,912,780 $2,518,151 31.6%
Average Price per Square Foot $514 $653 27.0%
Average Days on Market 40 30 -25.0%
Highest Price $4,025,000 $4,375,000 8.7%
Properties Sold 25 14 -44.0%
% Sold Price to Original List Price 99.9% 95.3% -4.6%
2021 2022 % Change
Average Price $679,070 $909,126 33.9%
Average Price per Square Foot $661 $812 22.7%
Average Days on Market 42 13 -69.0%
Highest Price $2,810,000 $2,300,000 -18.1%
Properties Sold 221 183 -17.2%
% Sold Price to Original List Price 101.2% 101.1% 0.0%
Average Price
Average Price per
Average Days
Highest Price
%
Price
Average Price
Average Price per Square
Average Days
Highest Price
%
Price to
The average price per square foot in Copper Mountain increased by 22.6%
January through September 2022 compared to that of 2021.
Average Price
Average Price per Square
Average Days on Market
Highest Price
%
Price
Copper Mountain is located just 75 miles west of Denver and like most of the other notable areas of Summit County, Colorado, it is most known for its world-class ski resort. The resort features over 2,500 acres of naturally divided terrain catering to all skill levels, as well as terrain parks and the Woodward Barn Half Pipe where the world’s best skiers and riders compete to be the best.