Micro Market Report


COLORADO


8210 Highway 145 224 Country Club Drive Q3 2022
TELLURIDE,


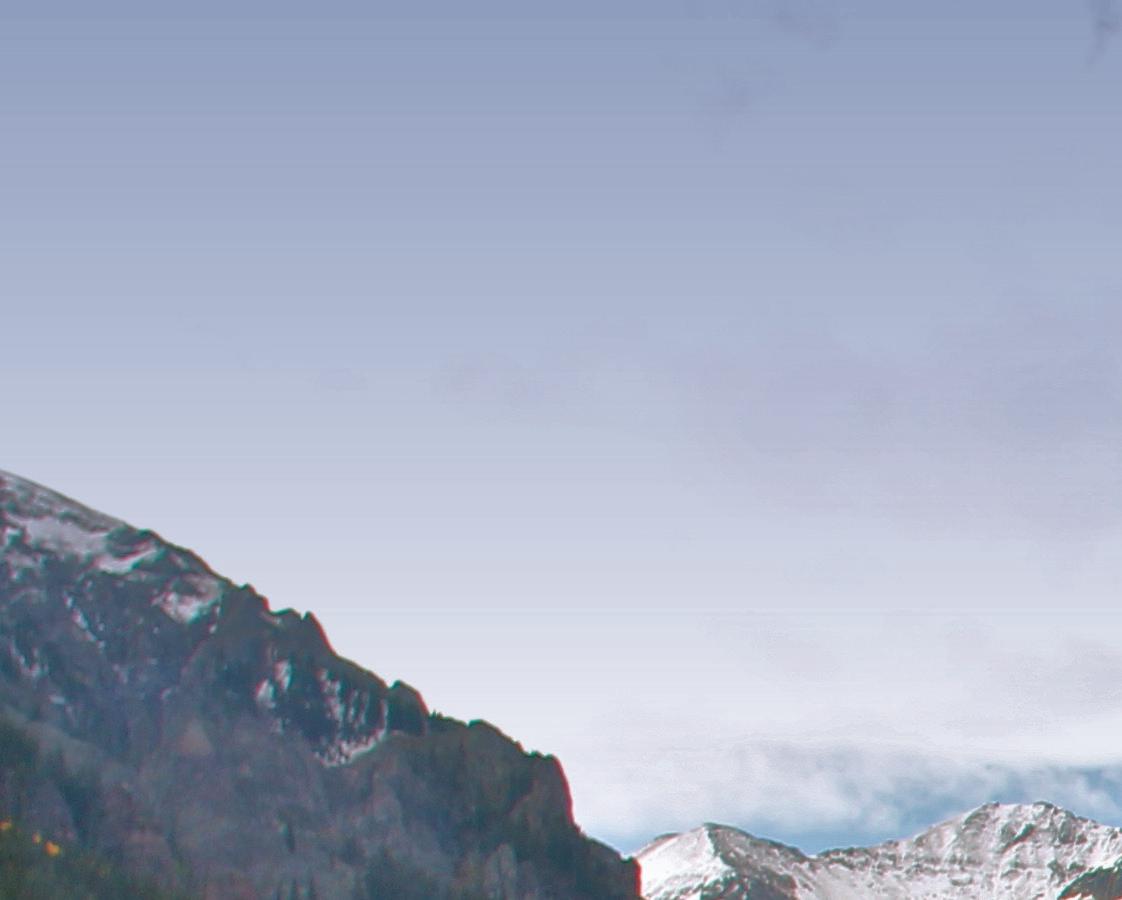
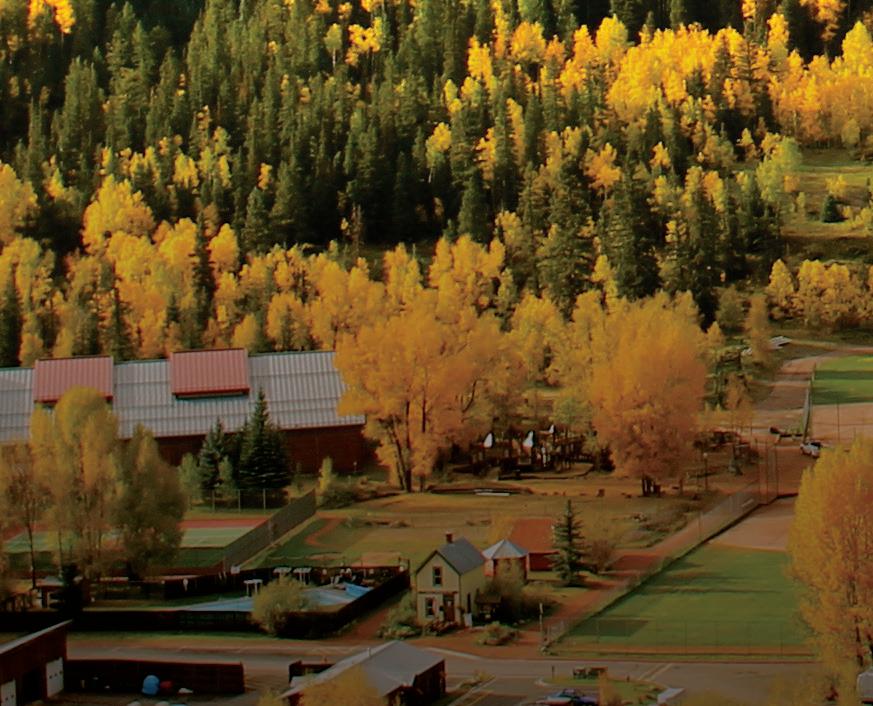
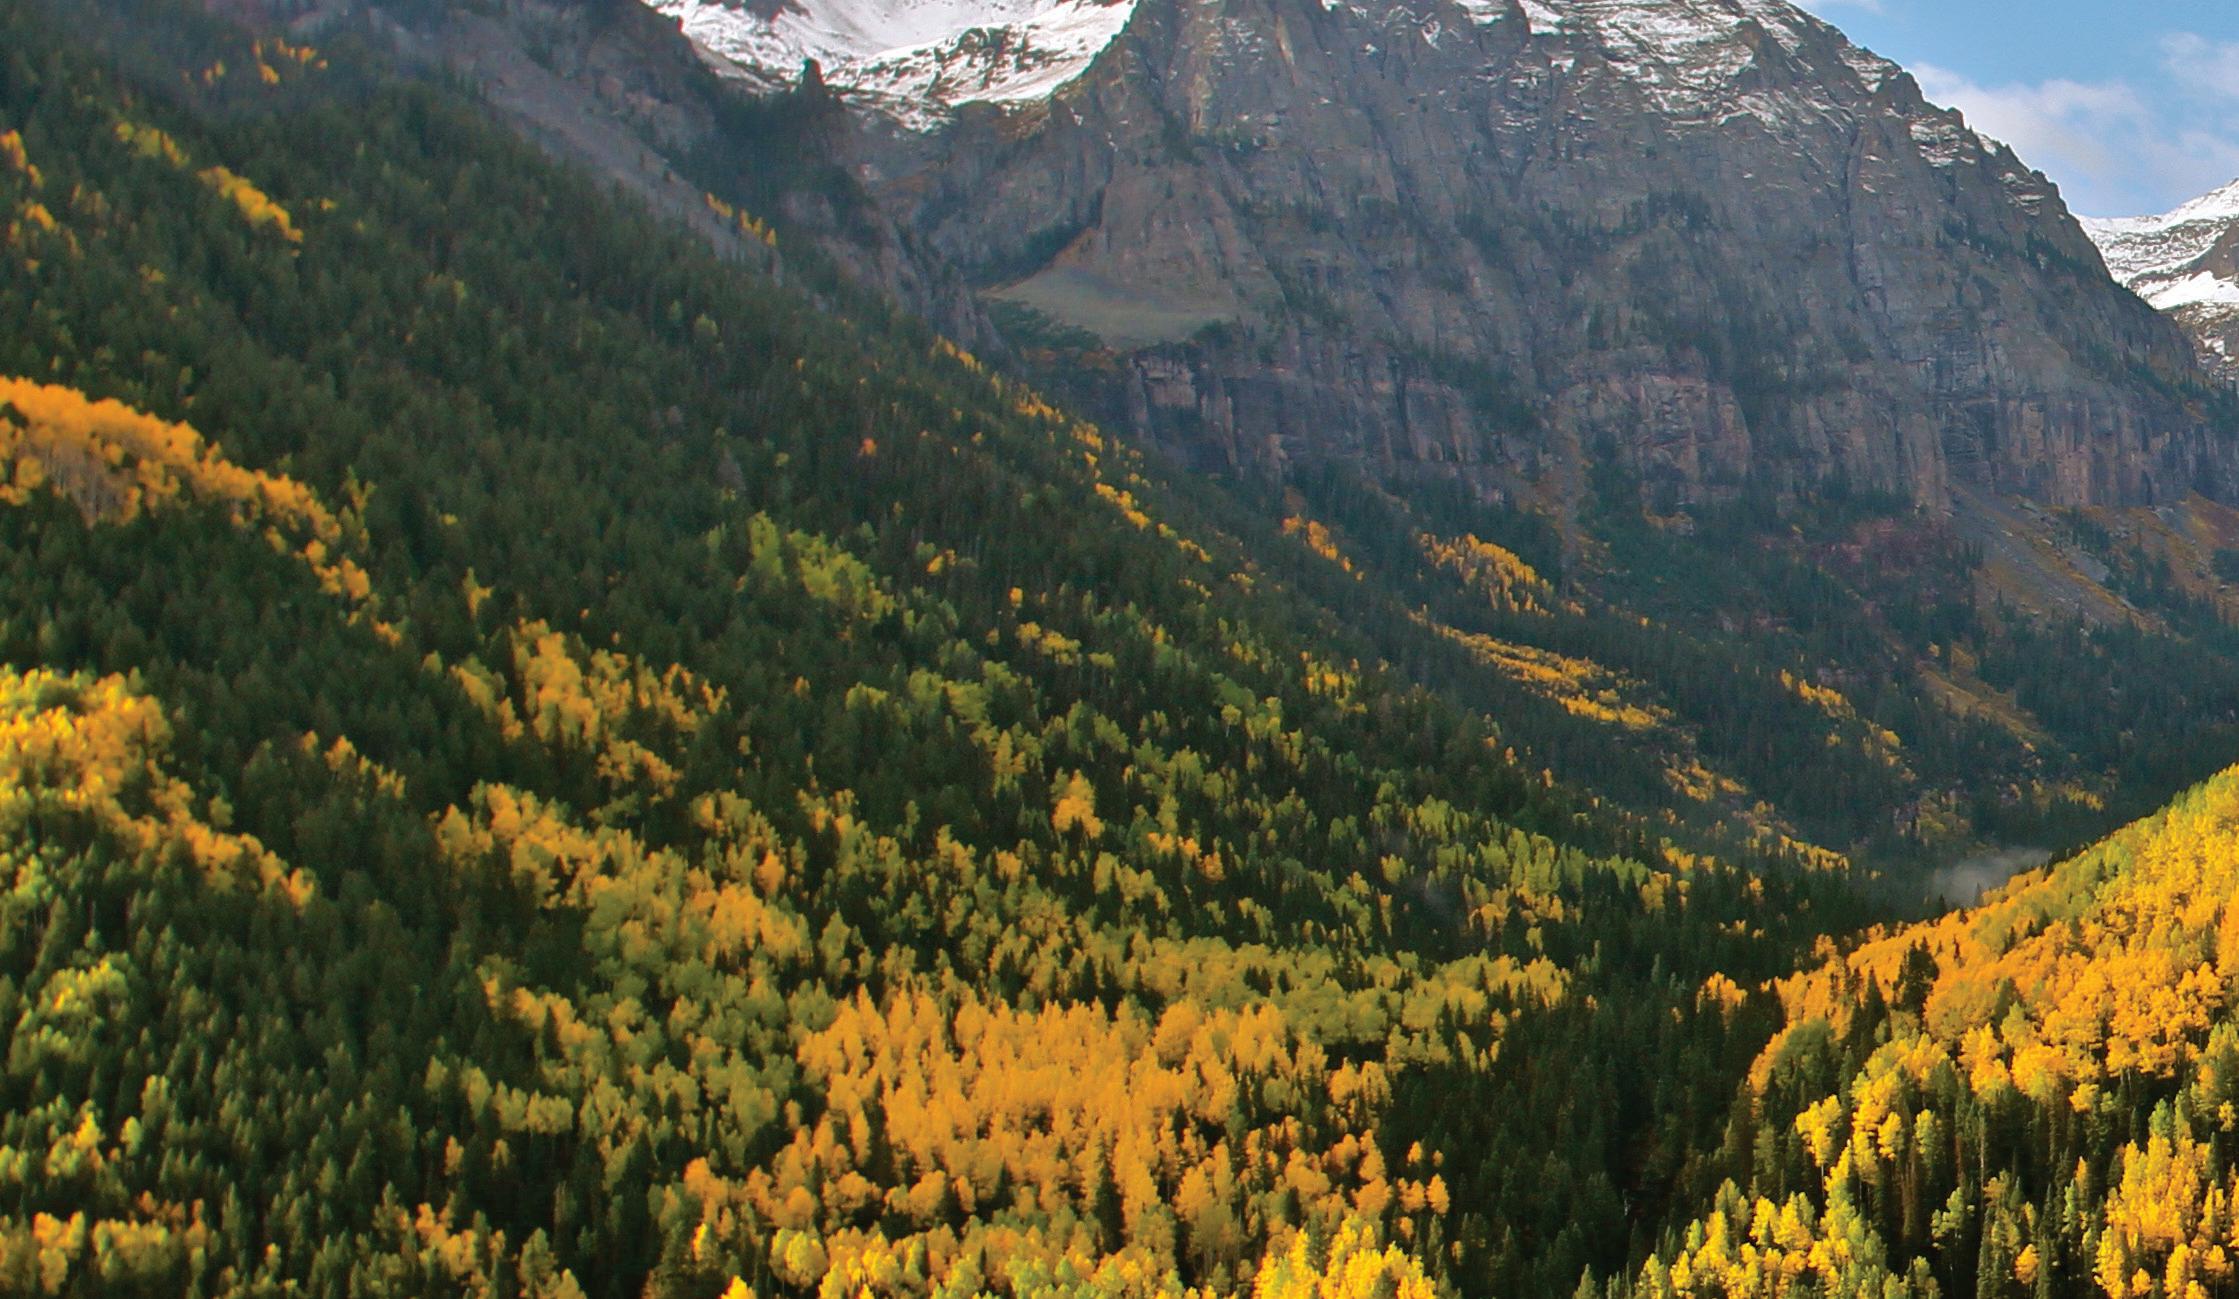
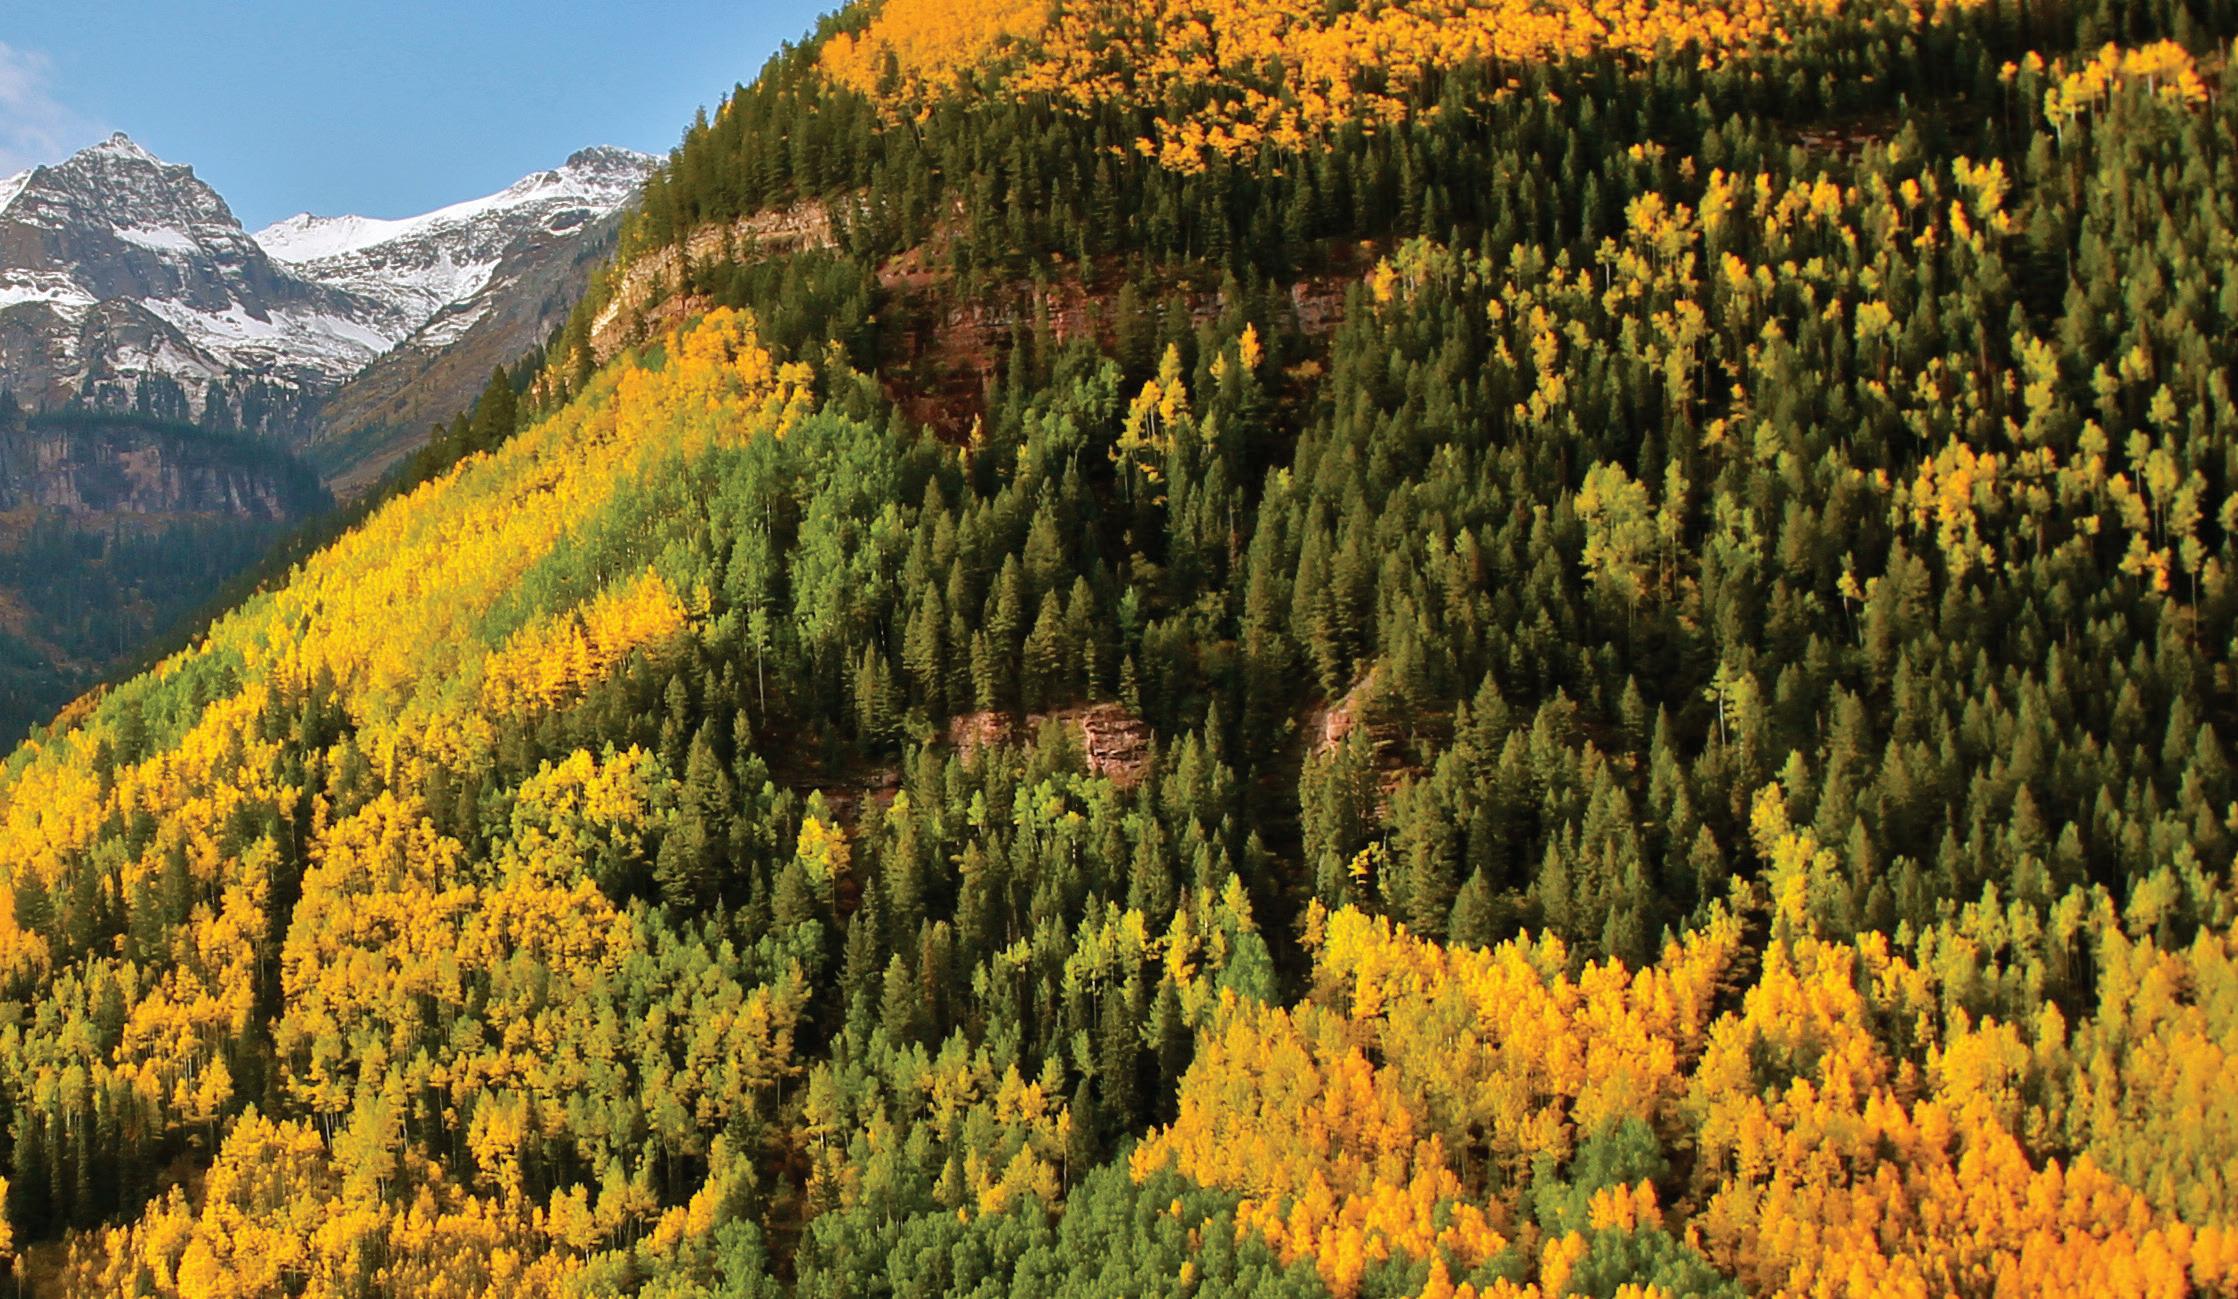
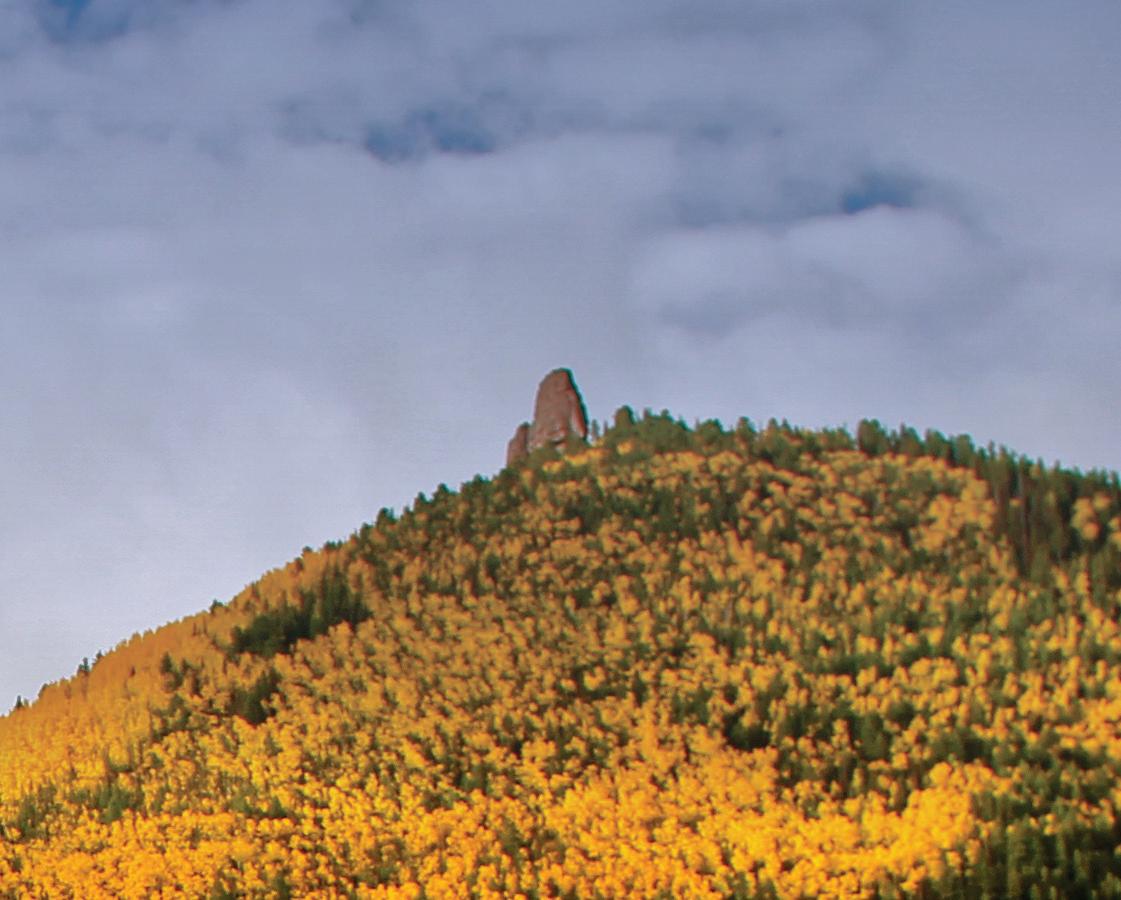
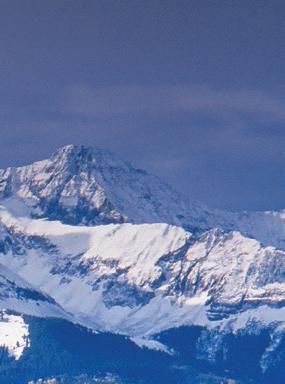
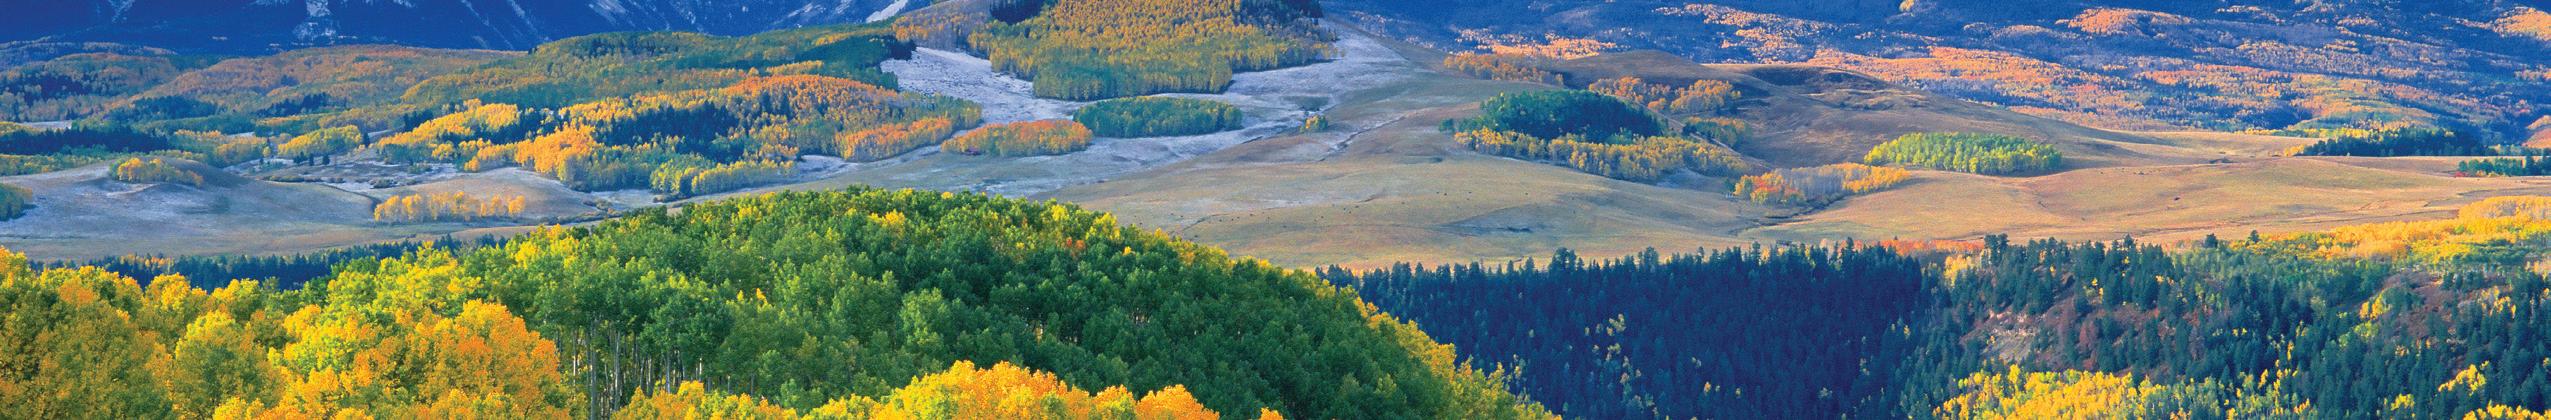
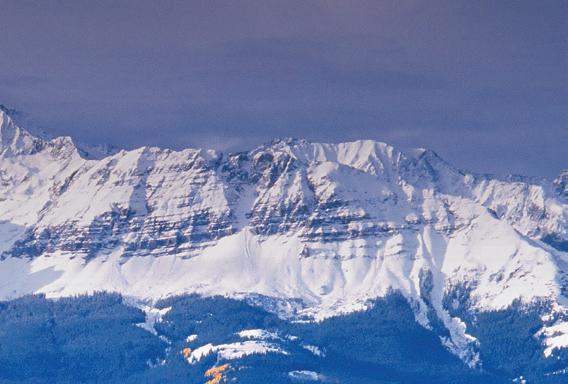
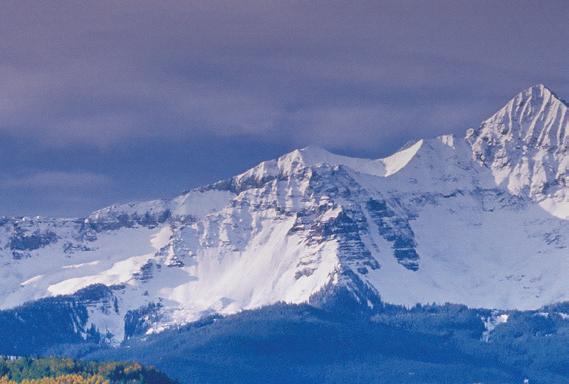
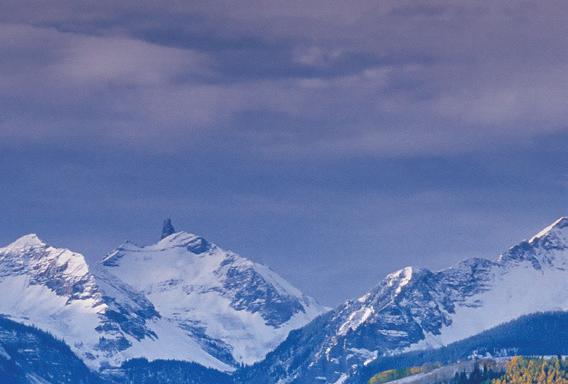
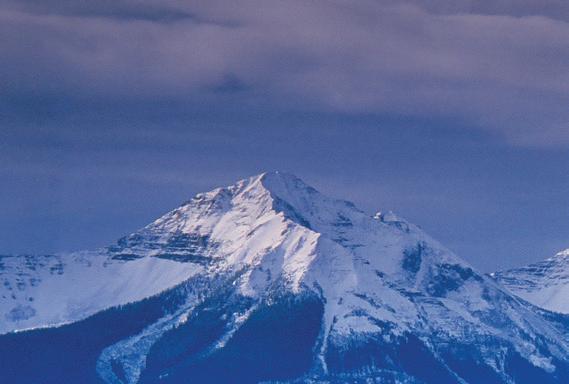
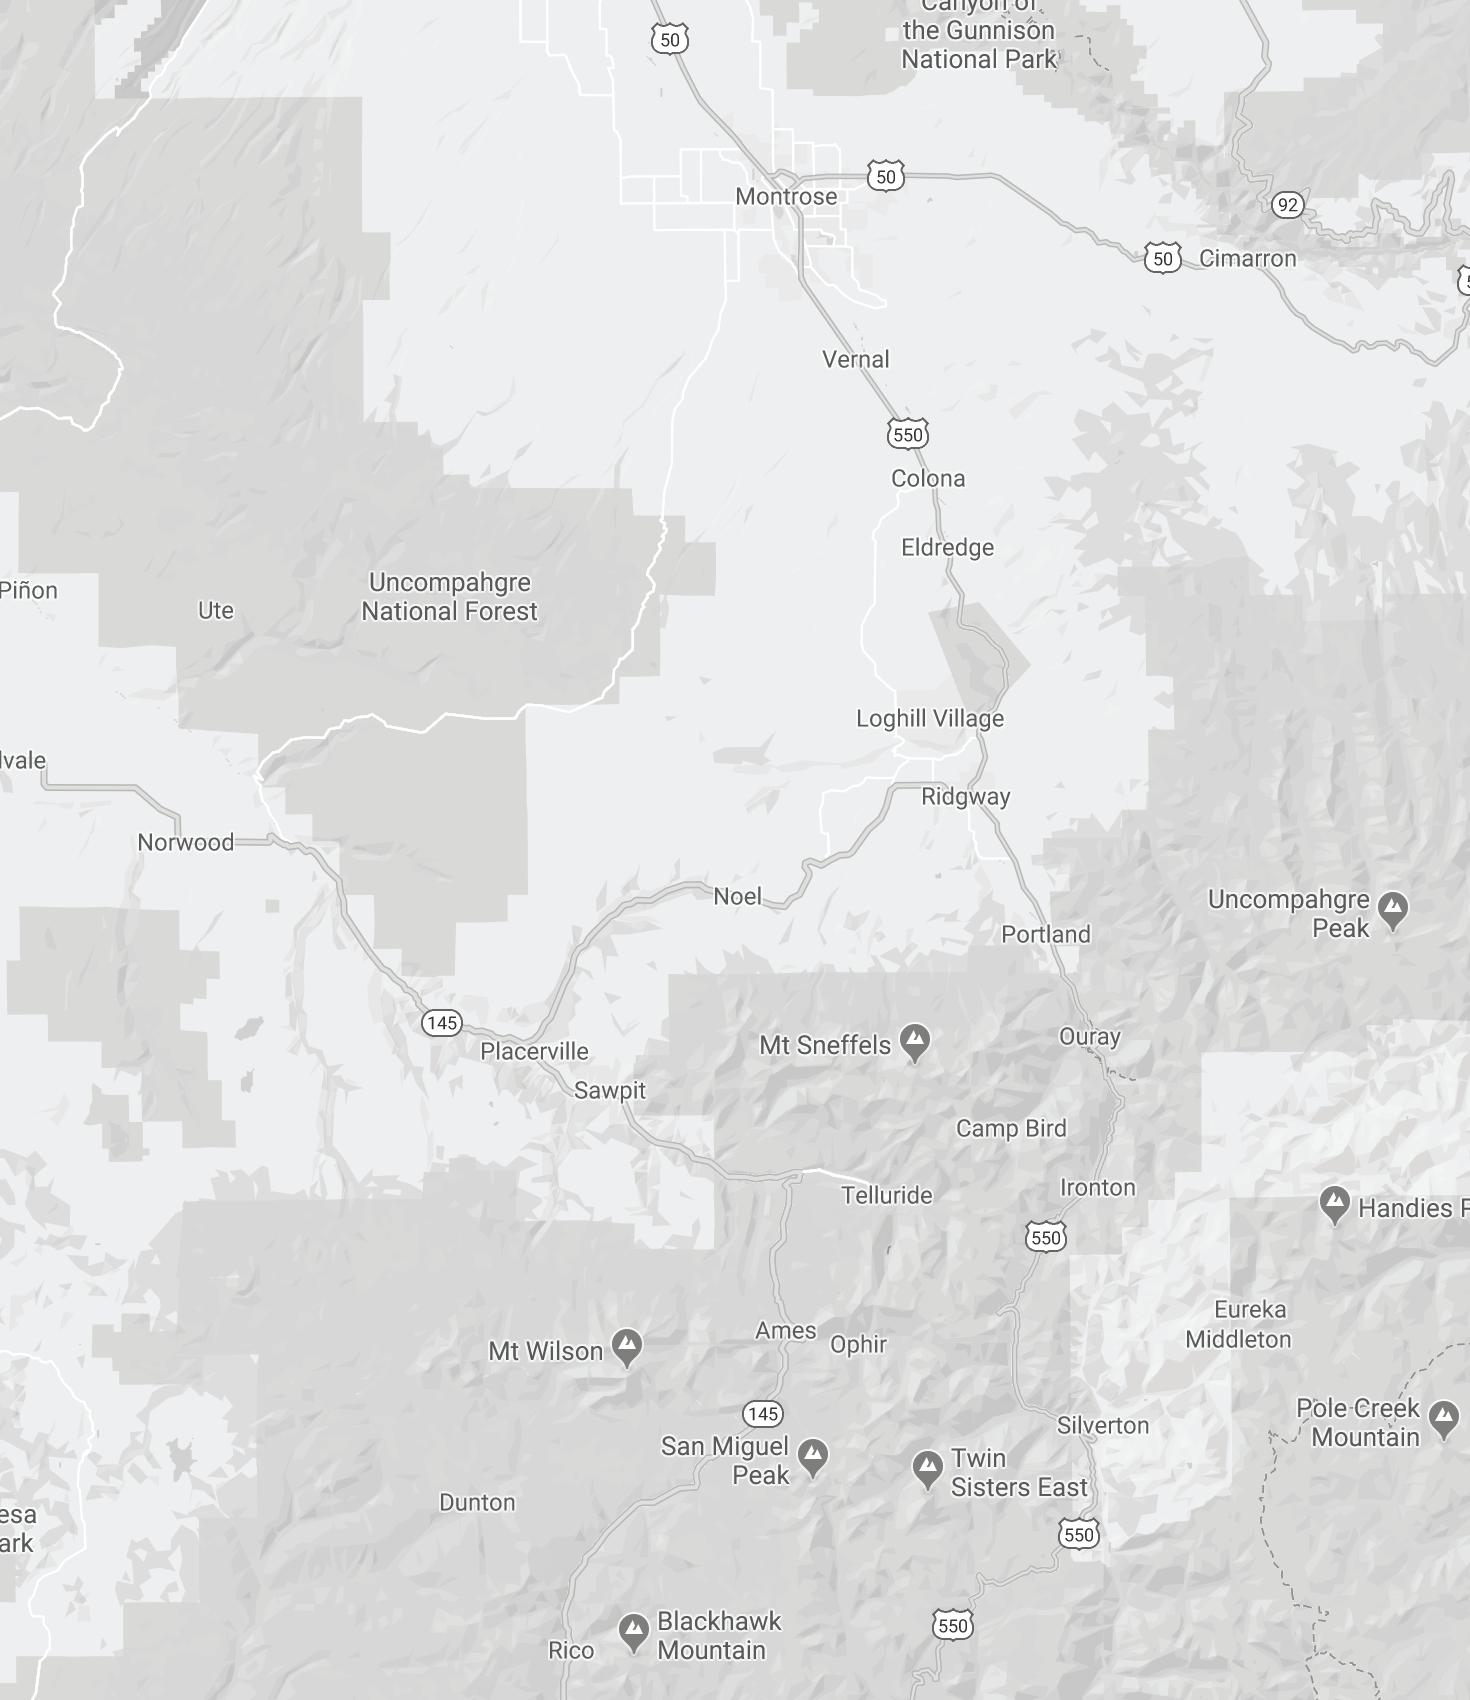
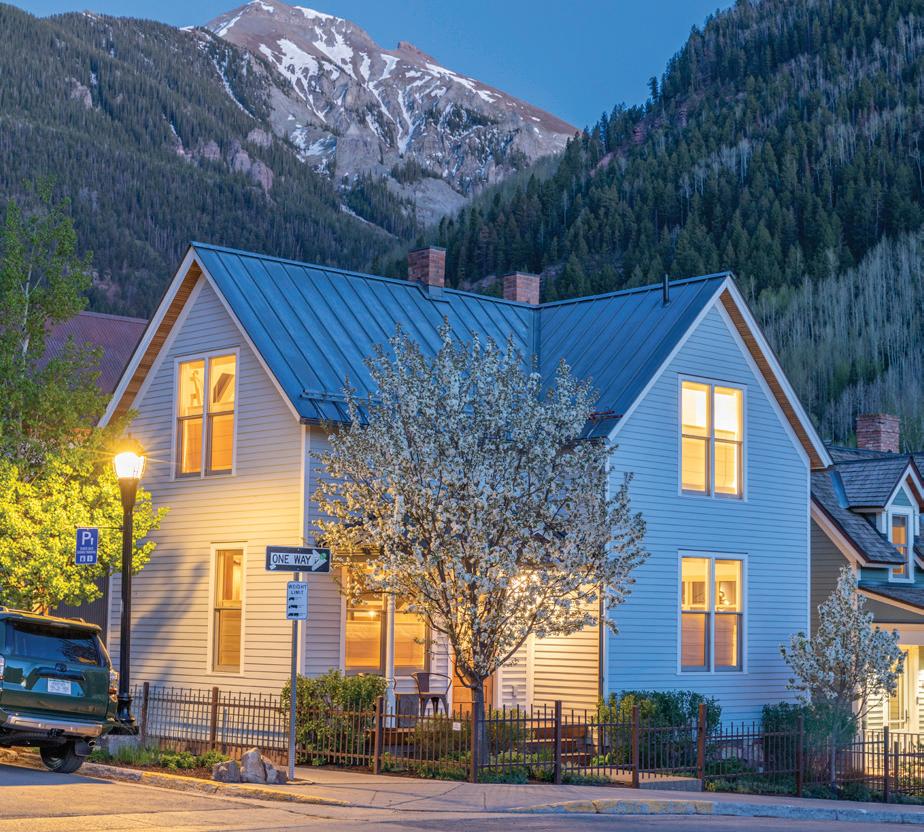
Situated in a box canyon in southwestern Colorado, Telluride’s rich history dates back to the late 1800s. The 1913 Sheridan Opera House, preserved gold rush cabins made of local pine and spruce, and its National Historic Landmark District designation add to the charm of this mountain town. The San Juan Mountains offer a spectacular backdrop, with 14ers Wilson Peak, El Diente and Mount Sneffels all within an hour drive from downtown. From summer wildflowers to challenging ski terrain, there are abundant outdoor recreation options. Endless outdoor festivals, art galleries, restaurants, and shops make for a vibrant ambiance year-round. Although this enclave of 2,500 residents feels far removed from the hustle and bustle of city life, it’s just 60 miles away from Montrose Airport, accessible by ten major hubs across the country.
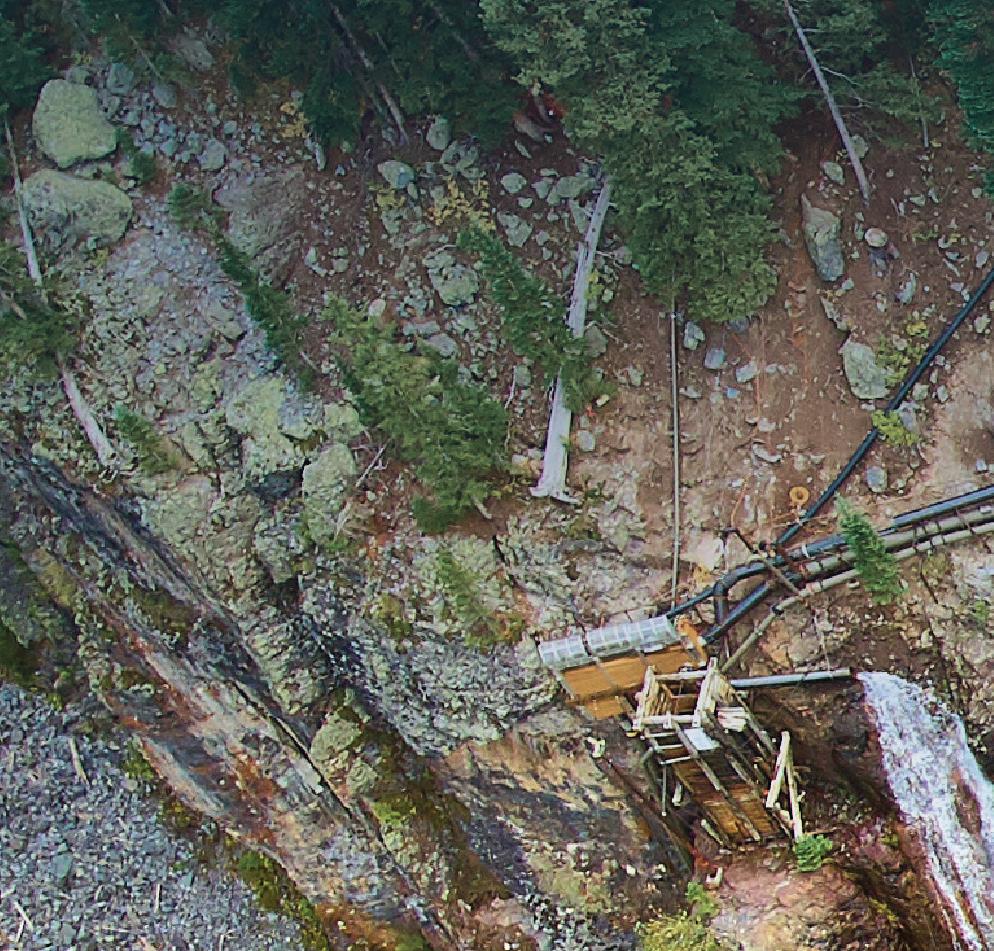
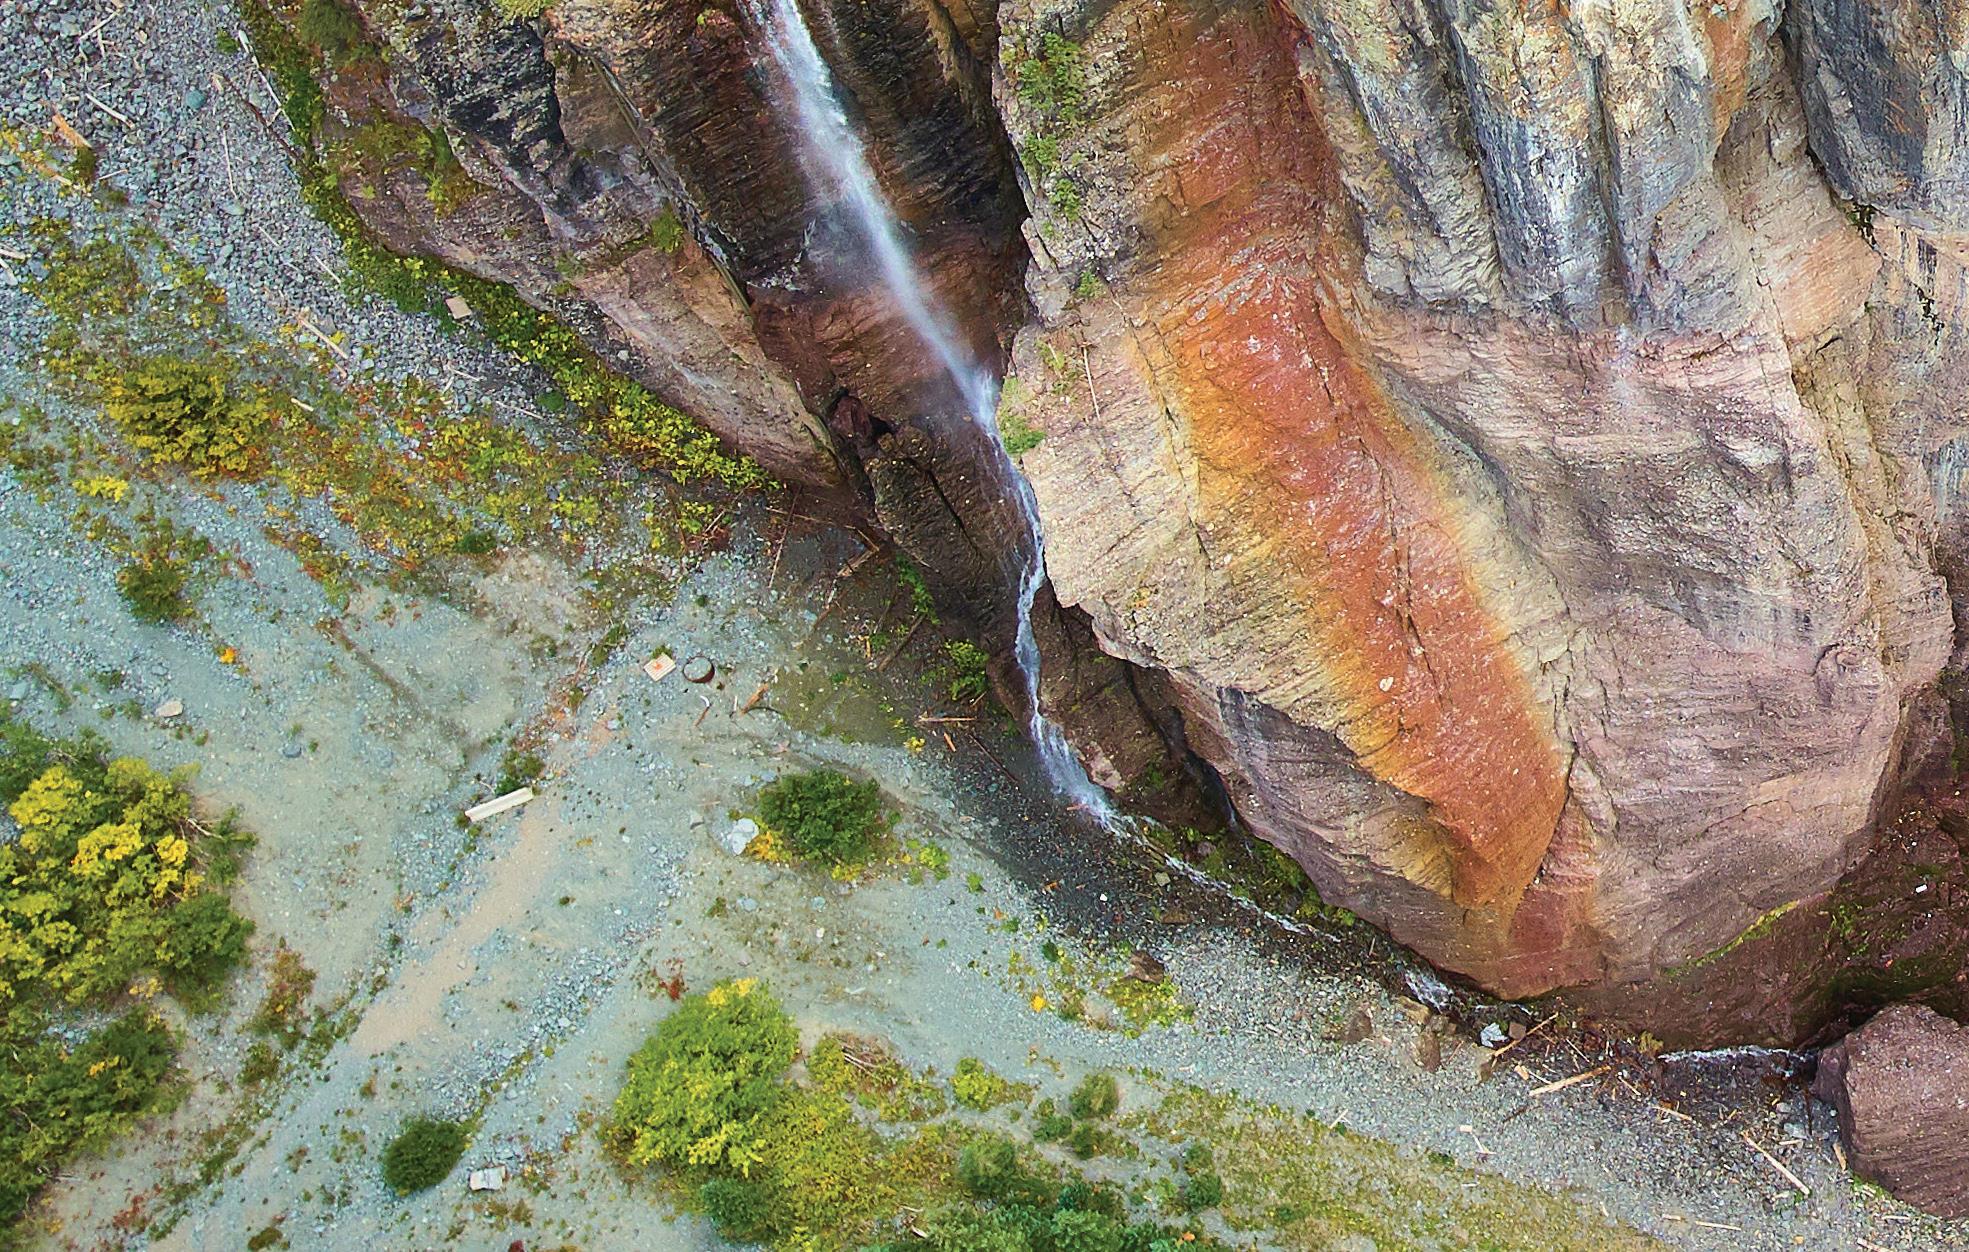
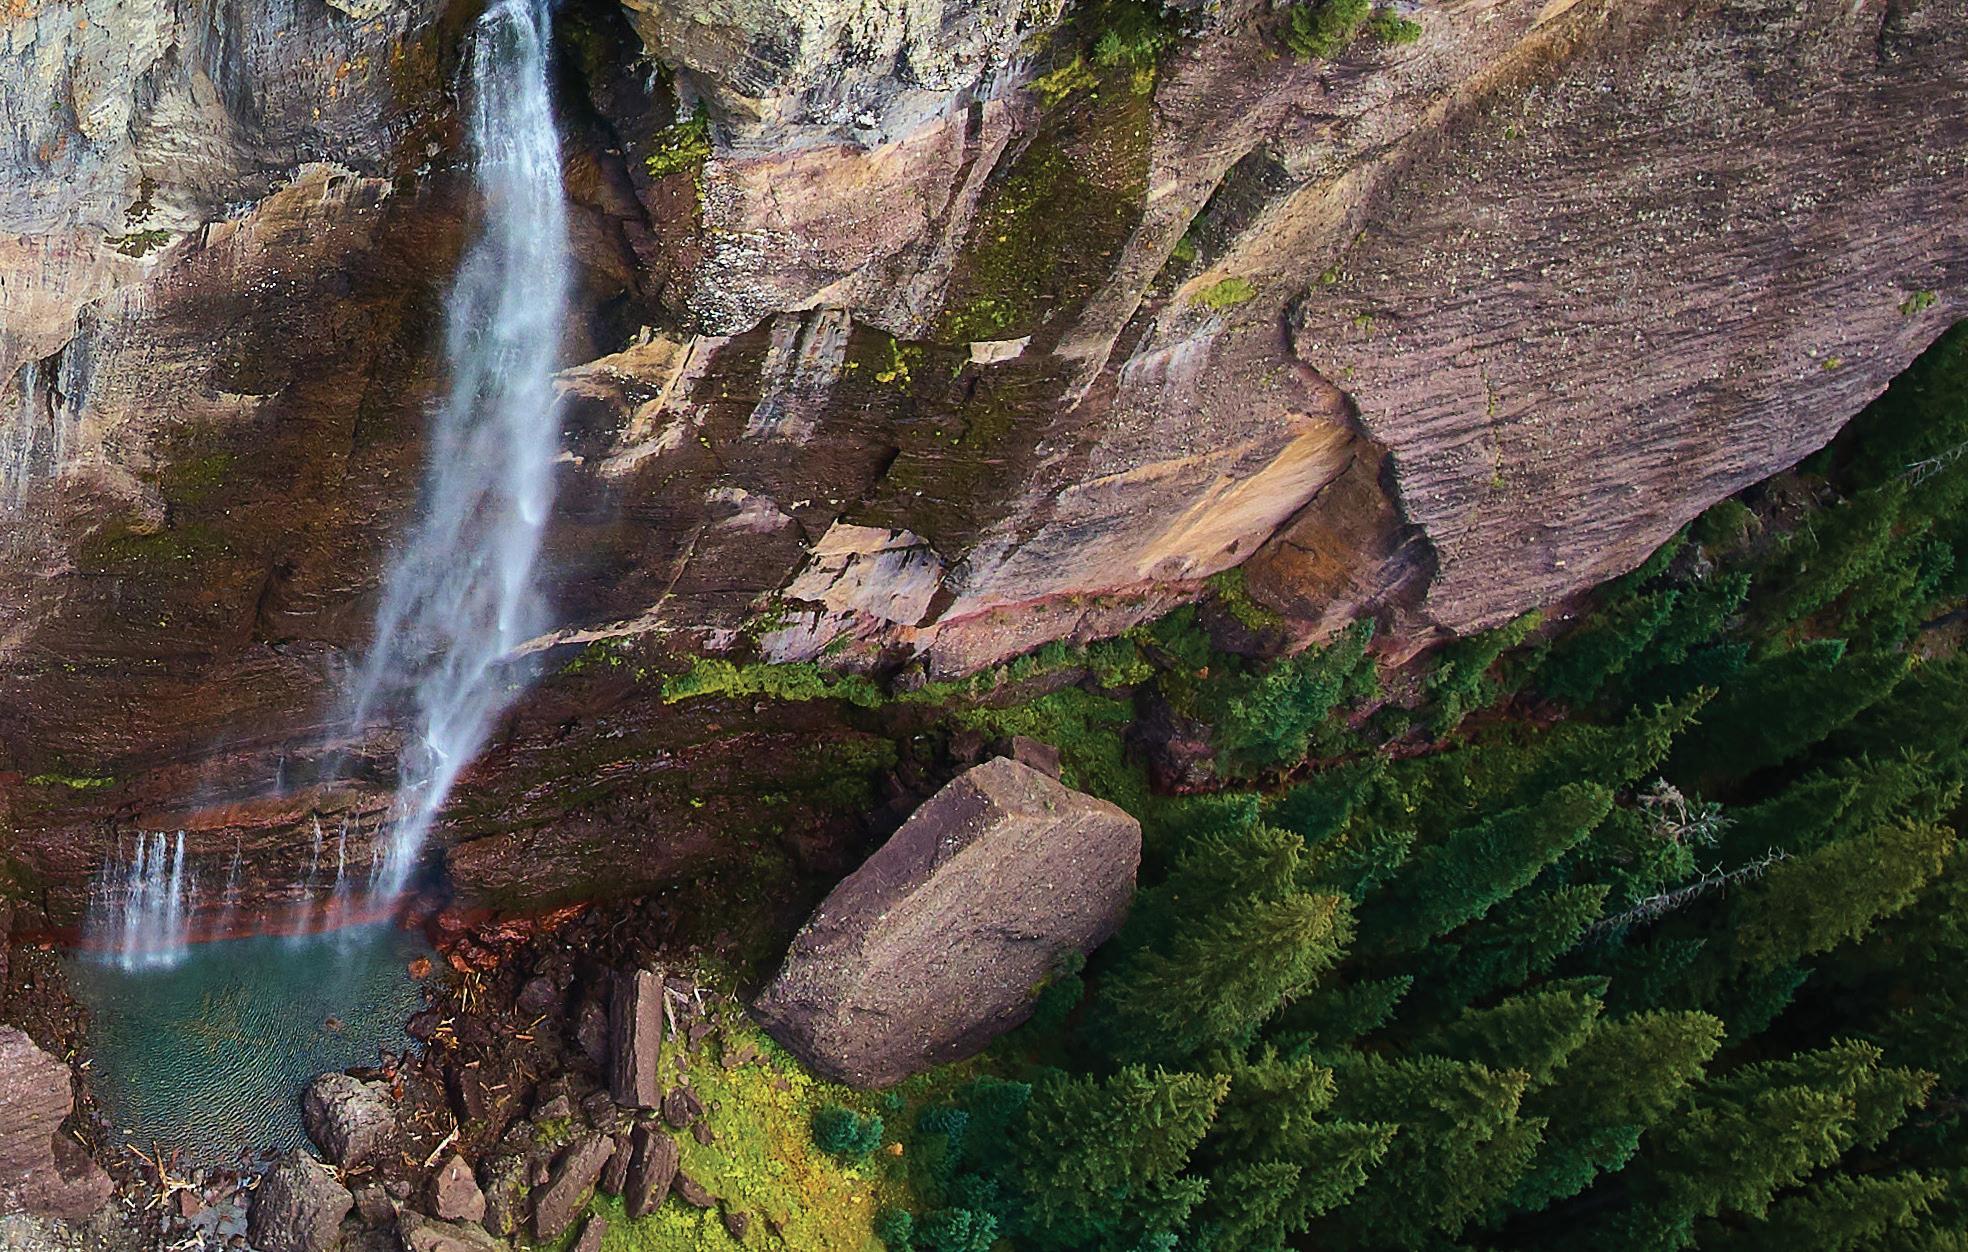
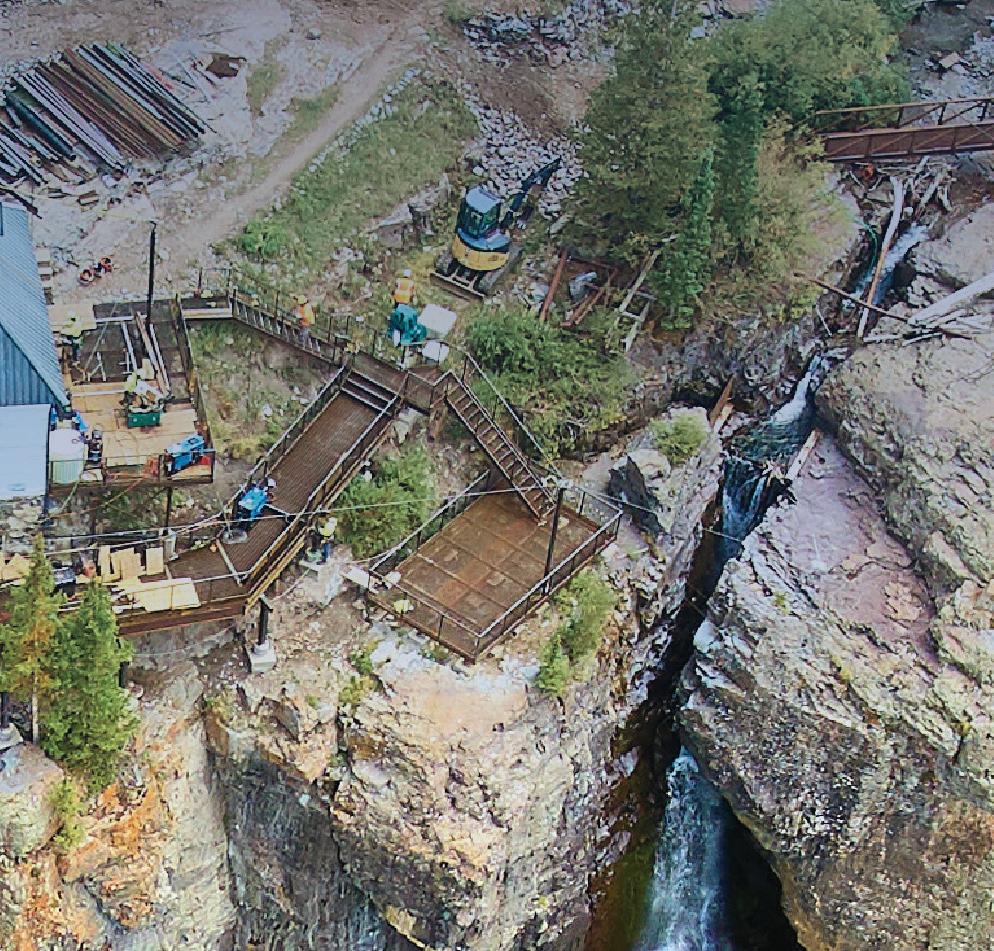
Telluride’s event calendar includes the storied Bluegrass Festival, Mountainfilm, and Blues & Brews Festival. Above all else, the area’s scenery astounds, whether you’re enjoying views of Bridal Veil Falls above town or the region’s many 13,000 to 14,000-foot peaks on the trails. Every quarter, LIV Sotheby’s International Realty produces a Micro Market Report analyzing real estate performance in San Miguel County, where Telluride is located. For quarter three, this report is a yearover-year comparison of the first nine months of 2021 compared to the first nine months of 2022, analyzing January through September.
San Miguel County showed sustained growth in the average sold price, with a 29.4% increase to $2.94 million over the past three quarters. The average days on market dropped nearly in half from 2021, down 43.2% to 109 days. Mountain Village had a tremendous 60.4% jump in average sold price, coming in at $3.81 million. The Town of Telluride had the lowest average days on market in the county, down 31.1% to 93 days compared to 135 days in 2021. The average sold price in town increased 19.6% to $2.66 million as demand remains strong for properties in the former mining town. The nearby community of Ridgway also had a sizeable increase in average sold price, as it went up 24.6% to $1.01 million.
Continue reading to learn more about how the real estate market in Telluride and surrounding communities performed during the first nine months of the year. This Colorado Micro Market Report includes real estate data statistics for the following neighborhoods: Town of Telluride, Mountain Village, Surrounding Mesas, Norwood, and Ridgway: Ouray County.
Based on Information from flexmls/Telluride Association of Realtors®. This representation is based in whole or in part on data supplied by flexmls/Telluride Association of Realtors®. flexmls/Telluride Association of Realtors does not guarantee nor is in any way responsible for its accuracy. Data maintained by flexmls/Telluride Association of Realtors may not reflect all real estate activity in the market.
coloradomicroreports.com
The average sold price for single family homes in the Town of Telluride increased by 12.8% January through September 2022 compared to that of 2021.
% Change
Average Sold Price $2,226,899 $2,662,492 19.6%
Average Price per Square Foot $1,486 $1,821 22.5%
Average Days on Market
93 -31.1%
Highest Price $14,389,455 $9,950,000 -30.9%
Properties Sold 88 76 -13.6%
% Sold Price to List Price 97.2% 97.8% 0.6%
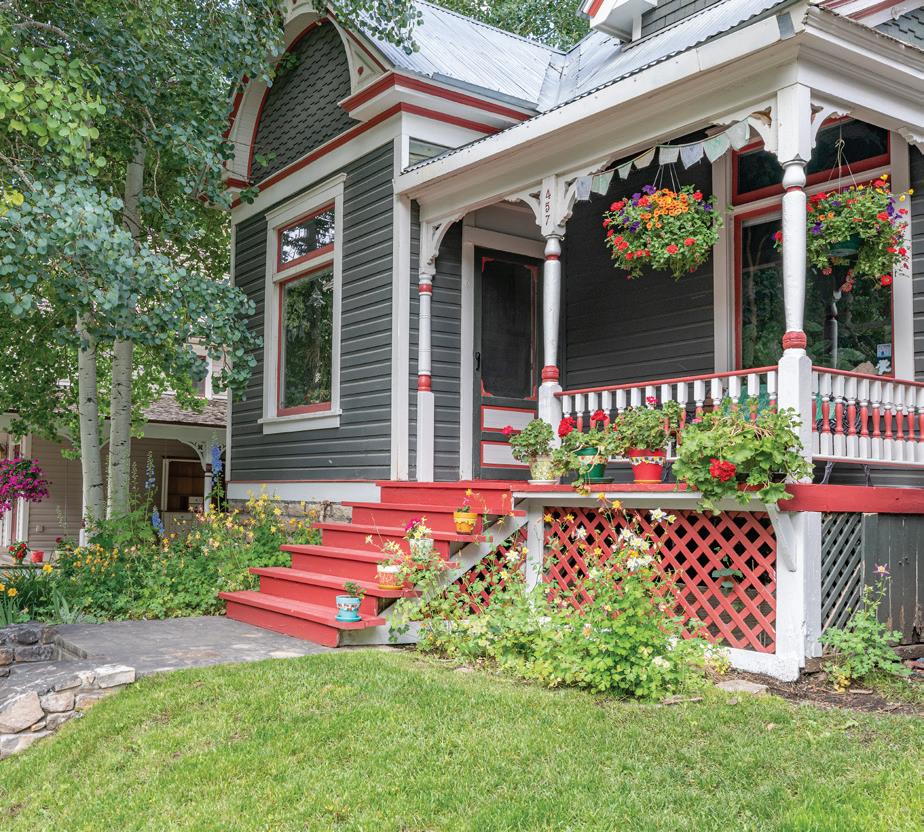
The historic Town of Telluride , designated as a National Historic Landmark District in 1964, is near the end of a picturesque box canyon surrounded by incredible 13,000 and 14,000-foot peaks. Just 12 blocks long by eight blocks wide, the town is a menagerie of colorful Victorian homes, superb restaurants, historic buildings, and independent boutiques, galleries and outfitters.
2022 % Change
Average Sold Price $4,449,602 $5,019,170 12.8%
Average Price per Square Foot $2,038 $2,002 -1.8%
Average Days on Market 160 98 -38.8%
Highest Price $14,389,455 $9,950,000 -30.9%
Properties Sold 24 18 -25.0%
% Sold Price to List Price 96.7% 97.7% 1.1%
2022 % Change
Average Sold Price $1,393,385 $1,931,109 38.6%
Average Price per Square Foot $1,279 $1,764 37.9%
Average Days on Market 125 92 -26.4%
Highest Price $5,600,000 $6,250,000 11.6%
Properties Sold 64 58 -9.4%
% Sold Price to List Price 97.9% 97.9% 0.1%
Condominiums, Townhomes, Duplexes and Triplexes
2022 % Change
Average Sold Price $1,774,391 $2,250,000 26.8%
Average Days on Market
-57.7%
Highest Price $4,725,000 $3,400,000 -28.0%
Properties Sold
% Sold Price to List Price
6 -73.9%
-6.2%
Average
Average
Average
Highest

Average
Average
The highest sold price of single family homes in Mountain Village increased by 111.1% January through September 2022 compared to that of 2021.
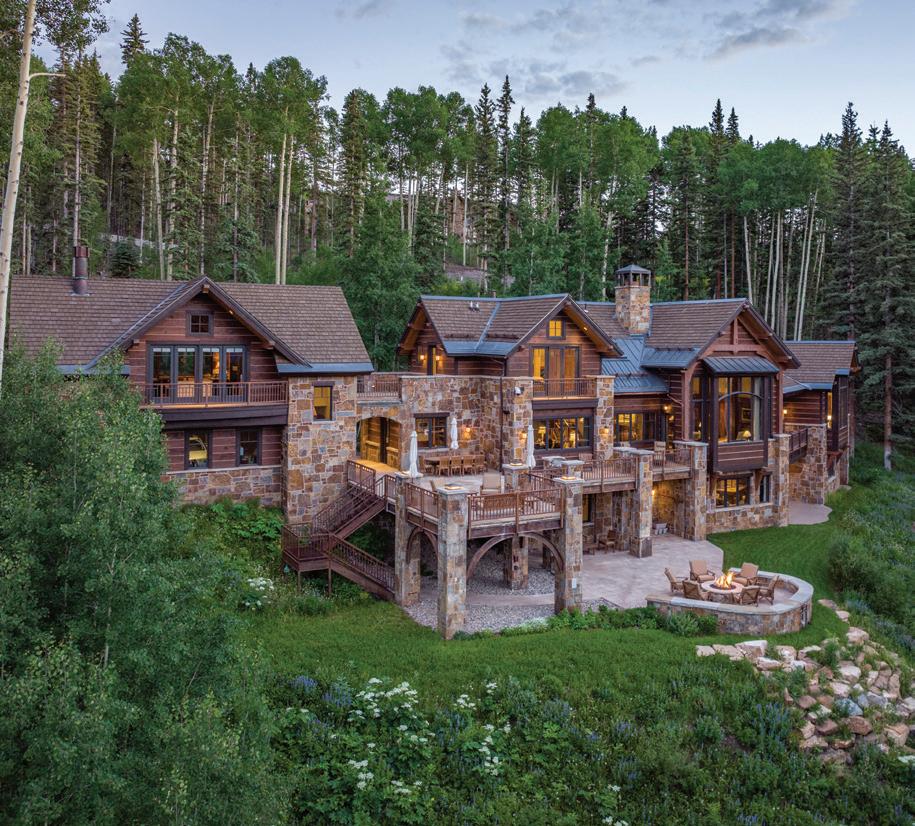
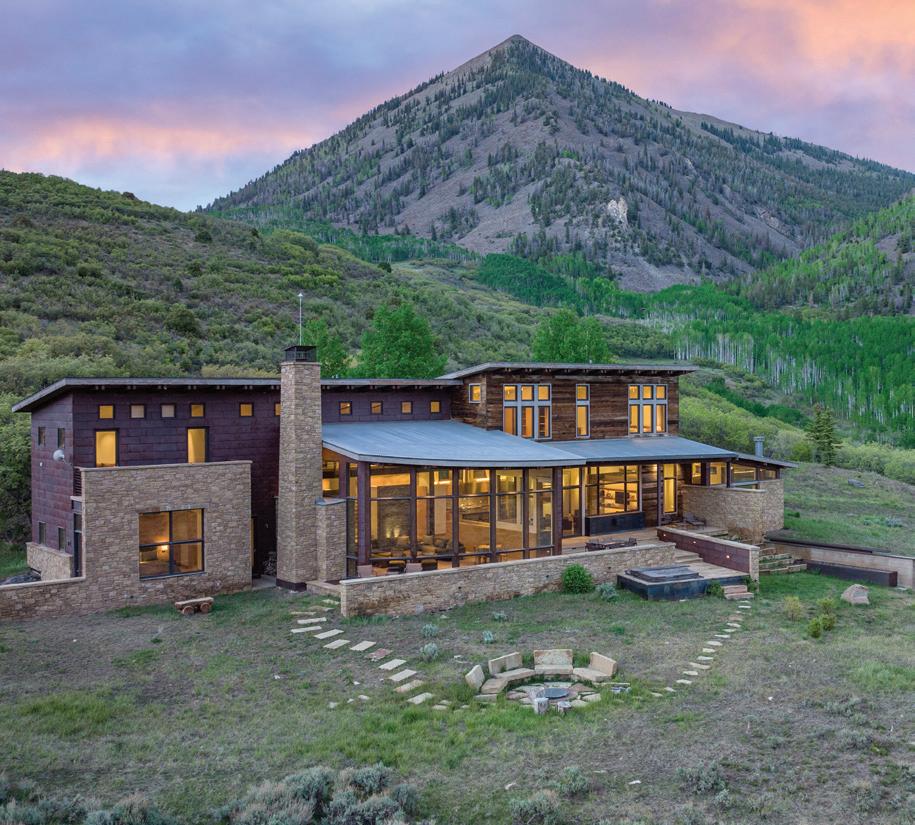
Founded in 1986 and incorporated in 1995, the Town of Mountain Village was inspired by modern ski villages in Europe with cobblestone plazas, European architectural accents and a mix of residential and commercial structures. At over 9,500 feet in elevation, the town sits on the north end of sunny Turkey Creek Mesa and consists of over 2,100 acres of land.
The average price per square foot for all residential properties in Surrounding Mesas increased by 21.3% January through September 2022 compared that of 2021.
Average Sold Price $3,858,664 $4,032,308 4.5%
Average Price per Square Foot
Average Days on Market
$1,175 21.3%
174 -31.2%
Highest Price $39,500,000 $15,000,000 -62.0%
Properties Sold
% Sold Price to List Price 96.3%
32 -15.8%
-5.9%
All Residential Properties - Deep Creek Mesa, Hastings Mesa, Iron Springs/ Horse y Mesa, Specie Mesa, Sunshine Mesa, Turkey Creek Mesa, Wilson Mesa
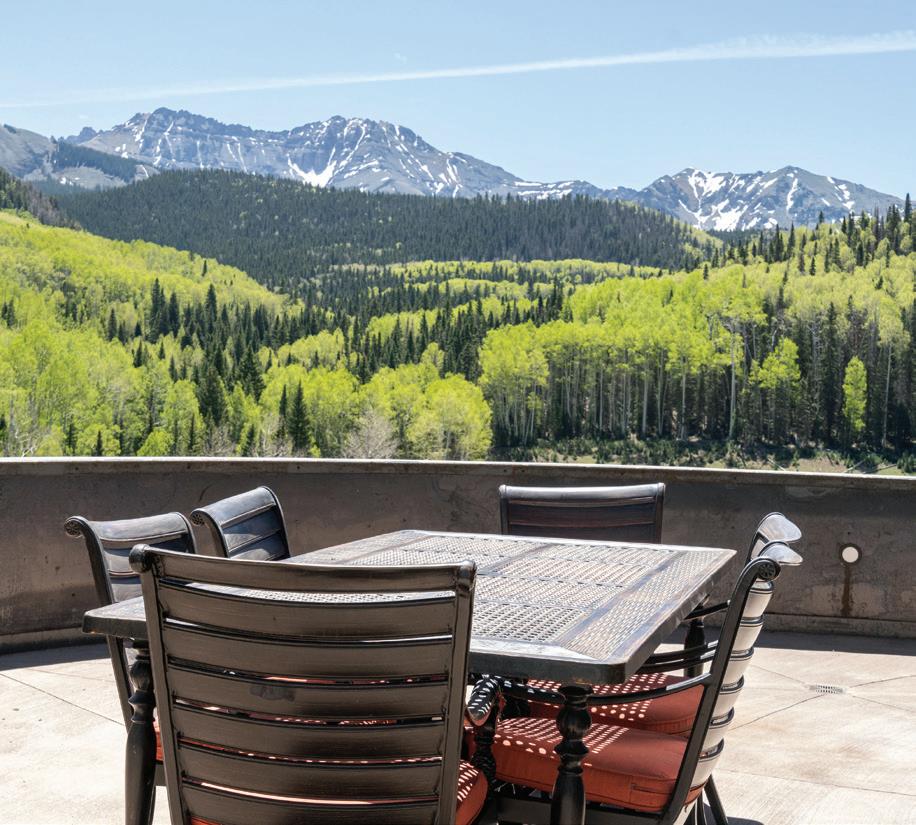
The Town of Norwood, about a 40-minute drive from Telluride, is located on a western plateau and is primarily agricultural in nature featuring ranch lands, cattle and other livestock operations. Outdoor activities are plentiful, with no shortage of options for hunting, shing, hiking and mountain biking nearby.
Average Sold Price $734,679 $2,054,238 179.6%
Average Days on Market
237 -49.3%
Highest Price $4,495,000 $32,000,000 611.9%
Properties Sold
% Sold Price to List Price 95.3%
41 -44.6%
-0.6%
Land - Deep Creek Mesa, Hastings Mesa, Iron Springs/Horse y Mesa, Specie Mesa, Sunshine Mesa, Turkey Creek Mesa, Wilson Mesa
Average Sold Price
Average Price per Square Foot
Average Days on Market
Highest Price
Properties Sold
% Sold Price to List Price
% Change
$520,331 -1.8%
6.9%
102 -51.0%
-31.1%
-10.0%
-0.5%
Average Sold Price
Average Days on Market
Highest Price
Properties Sold
% Sold Price to List Price
$224,009 49.1%
15.5%
$600,000 -8.4%
-52.2%
-6.0%
Average
Average
Average
Highest
Average
Average
Highest
%
Average
Average
The average sold price for all residential properties in Ridgway increased by 24.6% January through September 2022 compared to that of 2021.
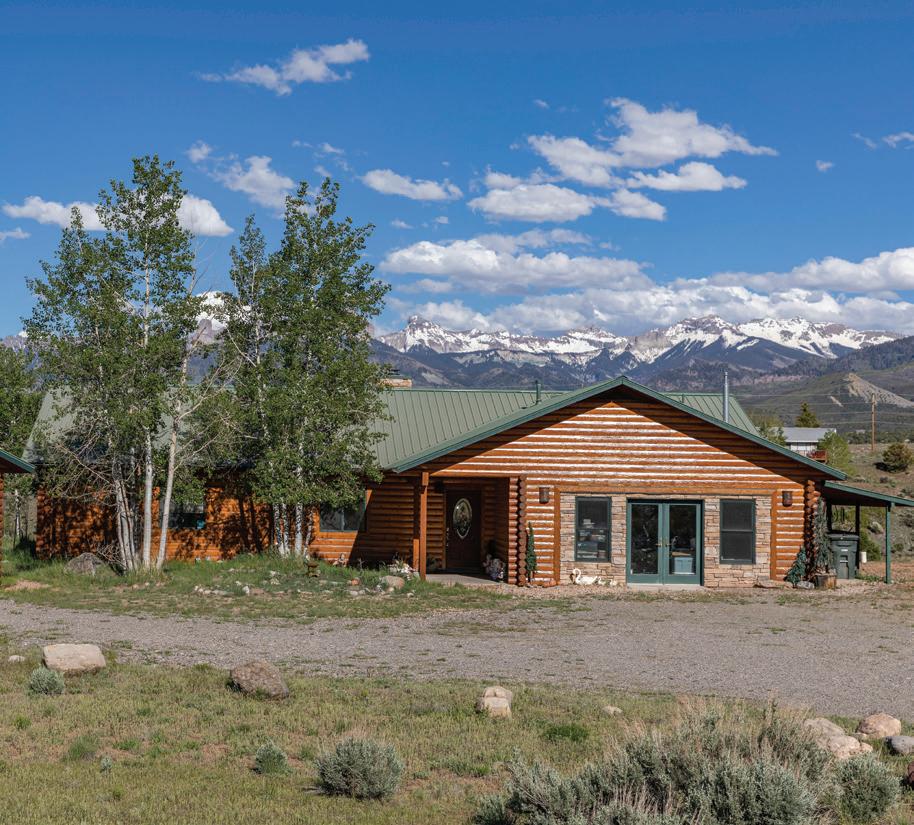
A 30-minute drive north of Telluride, and set in the beautiful Uncompahgre Valley, is the Town of Ridgway. Often referred to as the “Gateway to the San Juans,” Ridgway is a close-knit community with a picture-perfect downtown as well as several outlying subdivisions and the expansive Log Hill Mesa.

MICRO MARKET REPORT | Telluride JANUARY SEPTEMBER 2022 • COLORADOMICROREPORTS.COM