Micro Market Report
WEST METRO


QUARTER 3 2022
1090 Twisted Pine Road
1992 Montane Drive

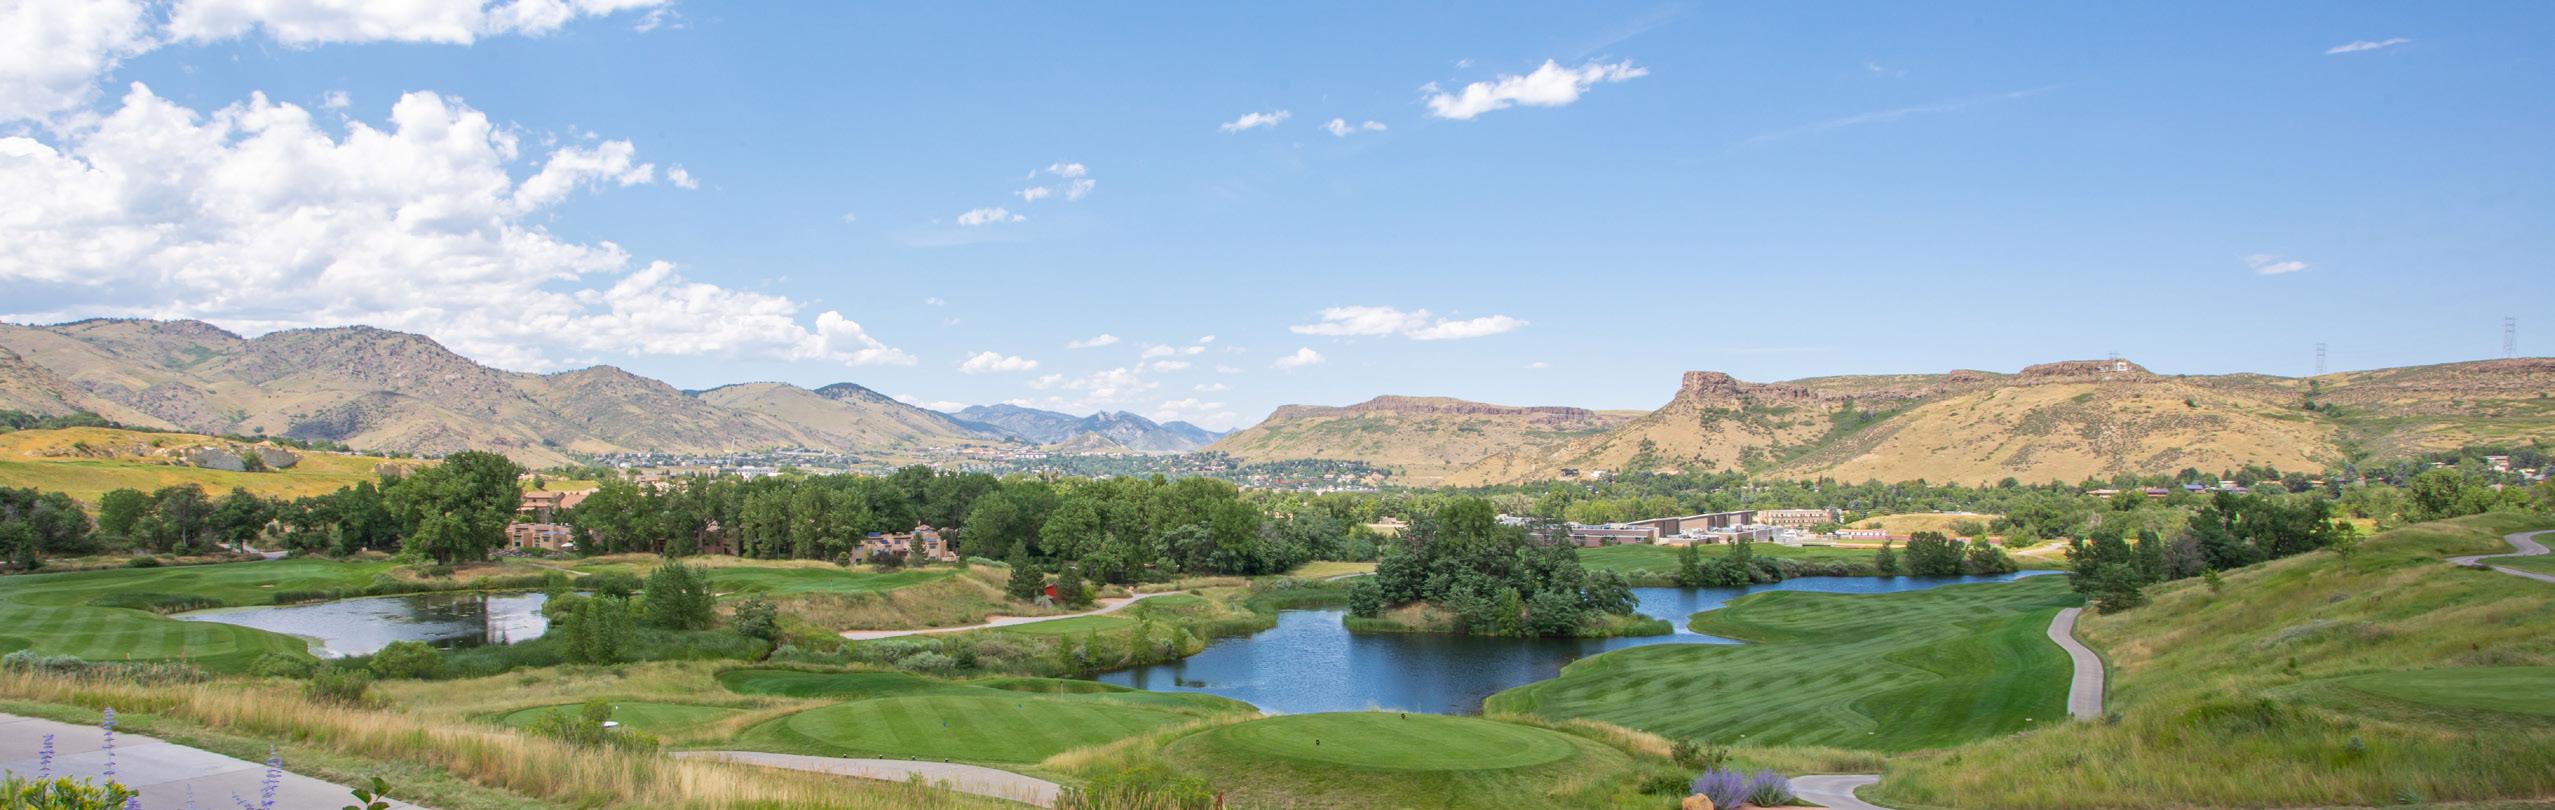
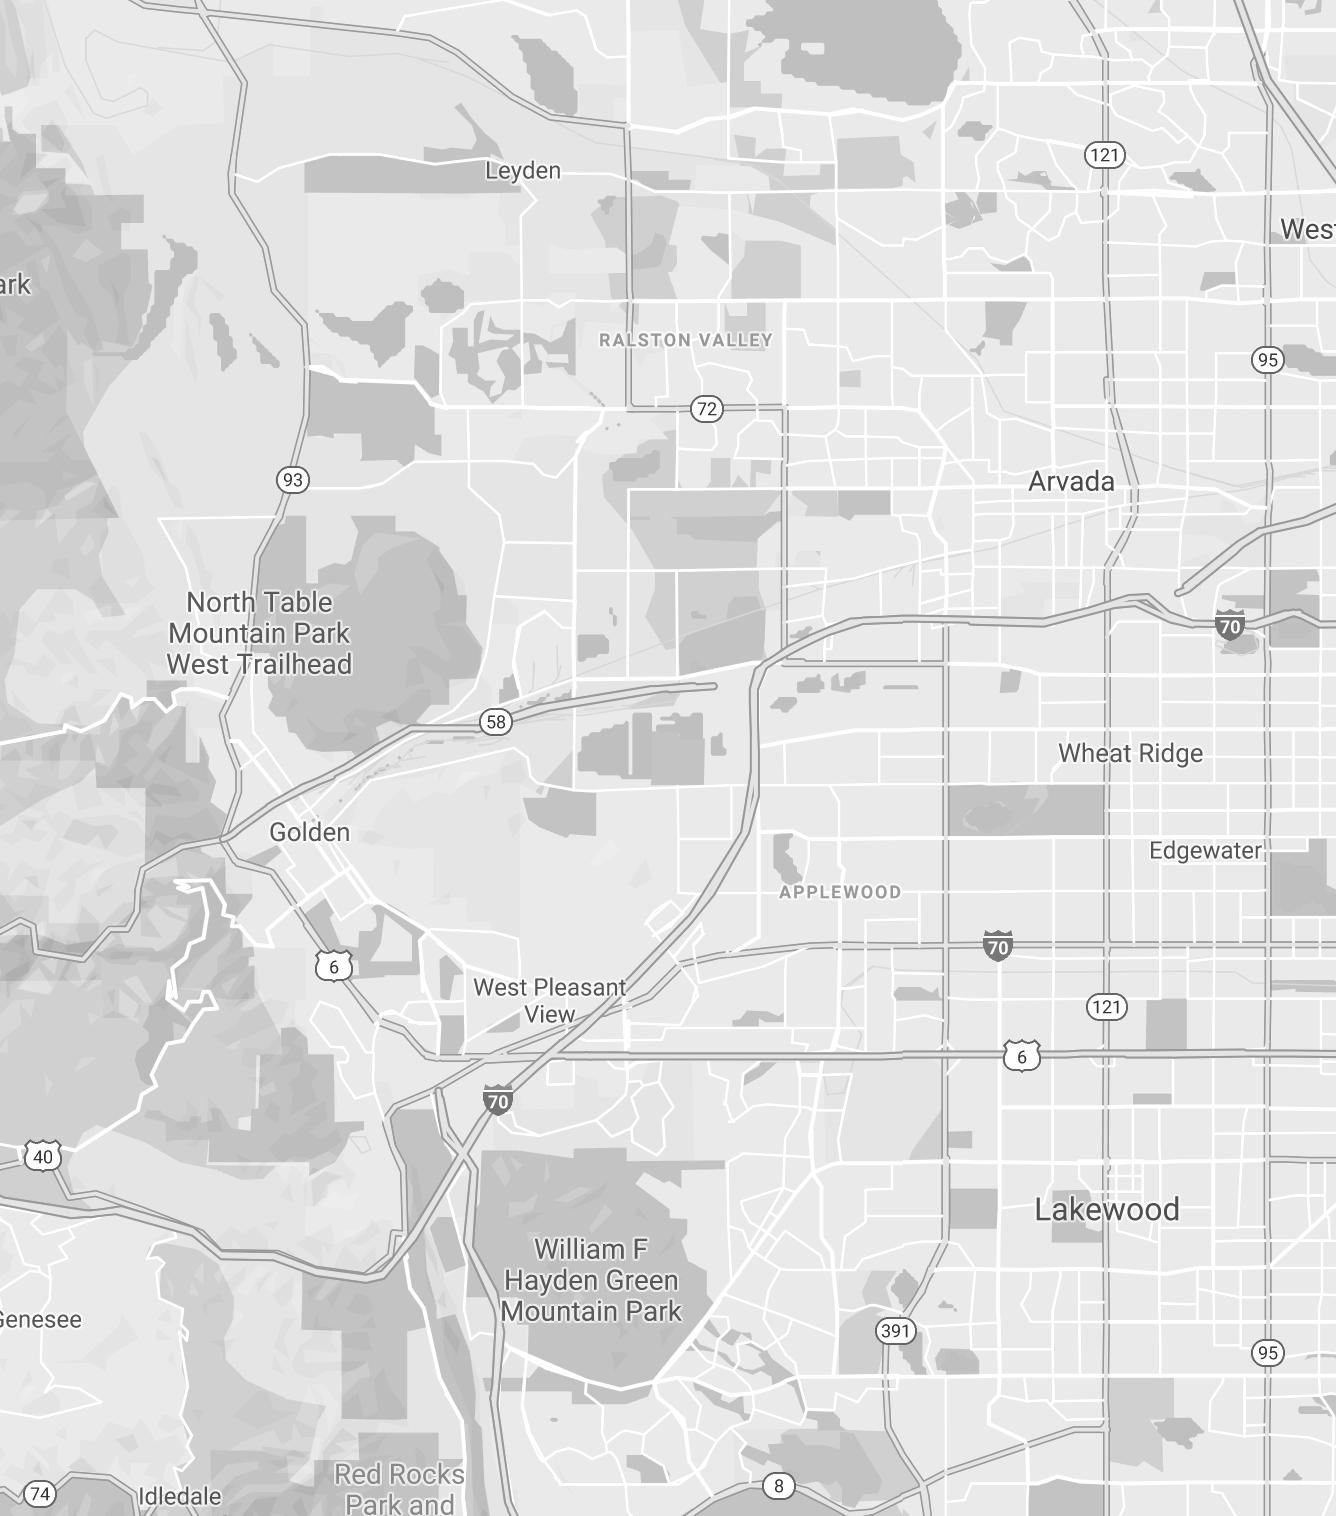
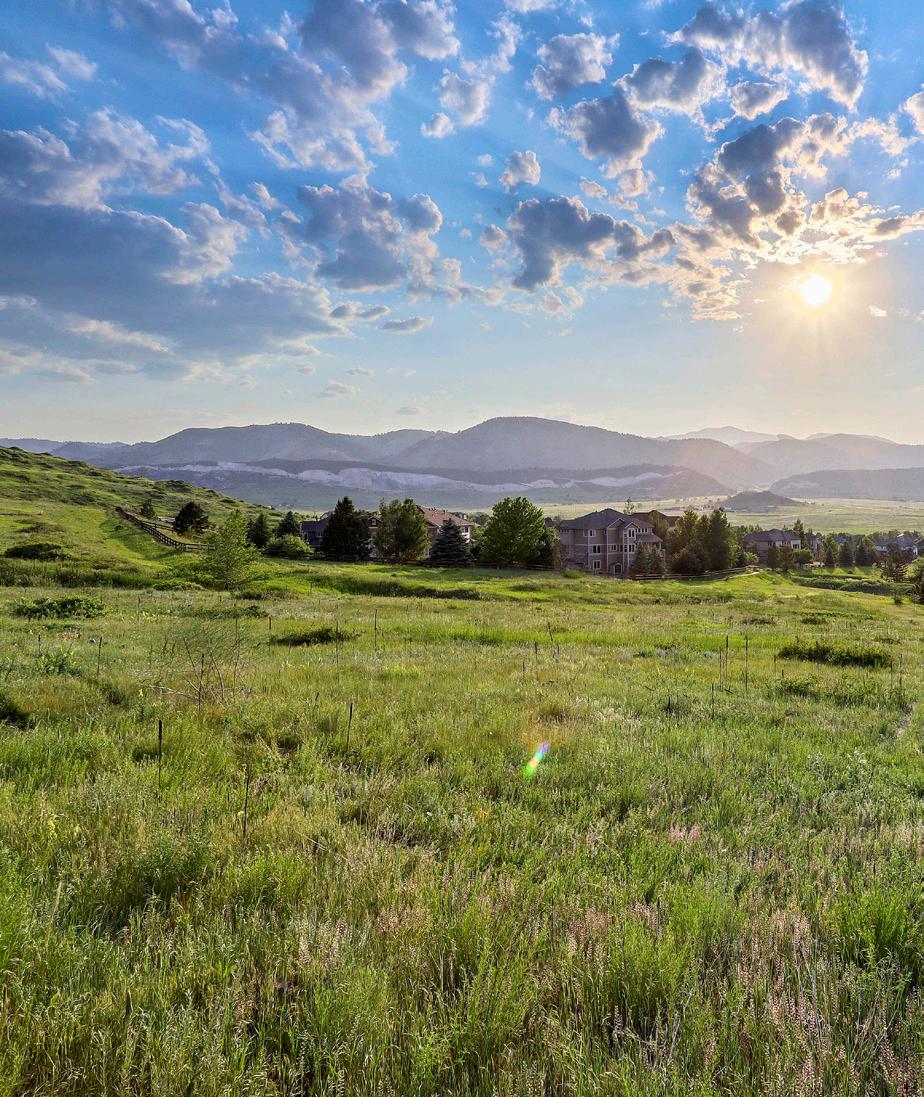
Just outside of Denver, the West Metro community offers the chance to live in a variety of neighborhoods suitable for every lifestyle within reach of the excitement of the city and the serenity of the mountains. This amenity-rich area within Jefferson County is a suburban haven located minutes from downtown Denver that boasts all of the food, fun, and adventure that homebuyers are looking for with more room and affordability than downtown living.
LIV Sotheby’s International Realty produces a Micro Market Report focused on the West Metro market and its performance from January through September of 2022 compared to the same time frame in 2021. So far this year, West Metro has seen average home prices appreciate by 14.1% to reach an average price of $704,787. Homes in this area sold for 101.7% of the original list price through September of this year and the speed of the market remained quick despite the increase in time homes remained for sale through Q3. Homes in this community spent just 13 days on market – an 18.2% increase from January through September of last year.
Several West Metro communities enjoyed price appreciation through the third quarter of the year as compared to the same period last year. The city of Golden, a community where history and exciting recreation and entertainment options meet, saw home prices rise by 17.6% to reach an average price of $922,594. Arvada and Canyon Point also saw appreciating home prices. Average sale prices in these communities rose by 15.8% and 25.7% respectively
to reach $666,023 and $1,612,225. Arvada was the most affordable area in which to purchase a home while Canyon Point offered the highest-priced luxury homes in West Metro.
In addition to increases in prices, the surge of demand resulted in increases in the number of homes sold in several West Metro neighborhoods. For example, Fieldstone property sales rose by 100%, growing from four sales through September of 2021 to eight sales through September of 2022. Arvada, the community which had the most homes sold through Q3 in West Metro, saw a total of 2,020 homes sold. The city of Golden had a 13.5% decrease in sales through Q3 of this year with 154 homes sold compared to 178 homes sold during the same time frame last year.
With unbeatable access to both the city and Colorado’s scenic natural spaces, West Metro will continue to provide homebuyers and sellers with unique opportunities to reach their real estate and lifestyle goals.
January through September 2021 2022 % Change
New Listings 10,226 9,657 -5.6%
Sold Listings (All Properties) 8,773 7,710 -12.1%
Average Price (All Properties) $617,671 $704,787 14.1%
Average Price (Single Family) $704,441 $805,503 14.3%
Average Days on Market 11 13 18.2%
% Sold Price to Original List Price 103.3% 101.7% -1.5%
Total Dollar Volume Sold $4,461,691,263 $5,348,285,977 19.9%
Based on Information from REColorado for the period January 1st, 2022 - September 30th, 2022. This representation is based in whole or in part on data supplied by REColorado. REColorado does not guarantee nor is in any way responsible for its accuracy. Data maintained by REColorado may not reflect all real estate activity in the market.
Alkire Estates offers custom homes on larger lots, typically around one-half acre and up. Residents love Alkire Estates because of the vast green open space, as well as it’s location nearby Standley Lake and Standley Lake State Park.
The average price per square foot in Arvada increased by 15.9% January through September 2022 compared to that of 2021.
2022 % Change
Average Price $1,284,500 $1,340,000 4.3%
Average Price Per Square Foot $346 $491 41.7%
Average Days on Market 36 24 -33.3%
Highest Price $1,385,000 $1,515,000 9.4%
Properties Sold 4 4 0.0%
% Sold Price to List Price 97.9% 98.2% 0.3%
2022 % Change
Average Price $858,693 $933,597 8.7%
Average Price Per Square Foot $461 $528 14.4% Average Days on Market 12 12 0.0%
Highest Price $2,700,000 $2,500,000 -7.4%
Properties Sold 99 94 -5.1%
% Sold Price to List Price 102.6% 103.0% 0.4%
Average Price $575,151 $666,023 15.8%
Average Price Per Square Foot $359 $416 15.9%
Average Days on Market 8 14 75.0%
Highest Price $3,025,000 $2,680,000 -11.4%
Properties Sold 2,247 2,020 -10.1%
% Sold Price to List Price 104.0% 102.9% -1.1%
Average Price
Average Price Per
Average Days
Highest Price
Price to
Average Price
Average Price Per Square Foot
Average Days on Market
Highest Price $1,625,000
Sold
% Sold Price to List Price
Average Price
Average Price Per Square
Average Days on
Highest Price
Price
-40.0%
-33.3%
-4.0%
The average home price in Canyon Point increased by 25.7% January through September 2022 compared to that of 2021.
A newer community, Eagle Ridge is comprised of three different neighborhoods with larger homes that come in two-story, tri-level, and ranch style. Nearby, there are beautiful parks and trails, and a bike path that leads right to Golden.
Fieldstone is a suburban neighborhood in the town of Arvada with close access to the shops of Olde Town Arvada.
The average number of days on market in Village of Five Parks decreased by 37.5% January through September 2022 compared to that of 2021.
2022 % Change
Average Price $1,008,375 $1,214,675 20.5%
Average Price Per Square Foot $371 $427 15.0%
Average Days on Market 2 12 500.0%
Highest Price $1,087,500 $1,500,000 37.9%
Properties Sold 4 8 100.0%
% Sold Price to List Price 110.3% 104.2% -5.5%
2022 % Change
Average Price $752,036 $878,592 16.8%
Average Price Per Square Foot $292 $361 23.4%
Average Days on Market 8 5 -37.5%
Highest Price $871,000 $1,101,000 26.4%
Properties Sold 14 19 35.7%
% Sold Price to List Price 104.1% 104.0% -0.1%
Average Price $784,417 $922,594 17.6%
Average Price Per Square Foot $498 $591 18.5%
Average Days on Market 10 8 -20.0%
Highest Price $2,220,000 $2,850,000 28.4%
Properties Sold 178 154 -13.5%
% Sold Price to List Price 104.7% 103.5% -1.2%
Average
Average
Average
Highest
%
Average Price
Average Price
Average
Highest
%
Average Price
Average Price
Average
Highest
%
The average home price in Green Mountain Village increased by 20.5% January through September 2022 compared to that of
Located north of downtown Golden and backing up to North Table Mountain, Mesa Meadows is a popular neighborhood filled with a variety of different homes like two-story, ranch style, and large custom homes.
The average number of days on market in North Table Mountain Village decreased by 10.0% January through September 2022 compared to that of 2021.
Oak Park is a suburban neighborhood located in Arvada and contains both single-family homes and apartments. Inside the neighborhood lies the Oak Park with playgrounds, fields, paved trails, sport courts, and a baseball diamond.
2022 % Change
Average Price $1,121,585 $1,266,400 12.9%
Average Price Per Square Foot $342 $394 15.1%
Average Days on Market 8 15 87.5%
Highest Price $1,700,000 $1,785,000 5.0%
Properties Sold 17 15 -11.8%
% Sold Price to List Price 101.9% 99.5% -2.3%
% Change
Average Price $817,964 $826,667 1.1%
Average Price Per Square Foot $377 $403 6.8%
Average Days on Market 20 18 -10.0%
Highest Price $1,061,000 $880,000 -17.1%
Properties Sold 7 3 -57.1%
% Sold Price to List Price 107.1% 104.1% -2.8%
2022 % Change
Average Price $737,500 $702,864 -4.7%
Average Price Per Square Foot $335 $333 -0.7%
Average Days on Market 7 4 -42.9%
Highest Price $755,000 $805,000 6.6%
Properties Sold 2 3 50.0%
% Sold Price to List Price 103.7% 110.1% 6.2%
Average Price
Average Price Per
Average
Highest Price
%
Price to
Average Price
Average Price Per
Average Days
Highest Price
% Sold Price to
Price
January
Average Price
Average Price Per
Average
Highest Price
%
Price
The average home price in Skyline Estates increased by 12.7% January through September 2022 compared to that of 2021.
Solterra is located between Green Mountain and Bear Creek Lake Park, with impressive views to the west of Red Rocks, Mount Morrison, and the Foothills.
The average price per square foot in Spring Mesa increased by 41.0% January through September 2022 compared to that of 2021.
Average Price $1,224,417 $1,504,434 22.9%
Average Price Per Square Foot $369 $520 41.0%
Average Days on Market 12 8 -33.3%
Highest Price $1,415,000 $1,915,000 35.3%
Properties Sold 12 6 -50.0%
% Sold Price to List Price 98.1% 106.4% 8.5%
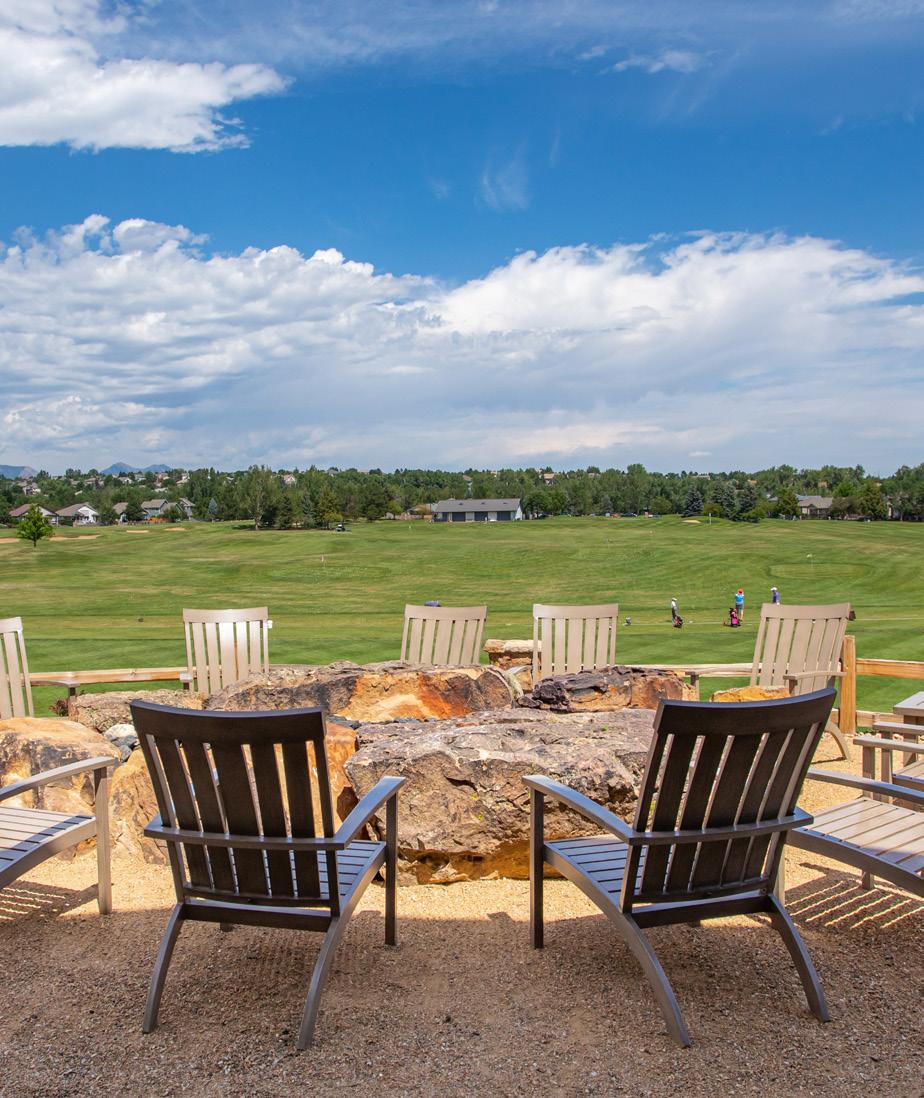
Sunrise Ridge offers residents perfect suburban living in Arvada. Located about two miles away from both The Bibber Creek Stables as well as the West Woods Golf Course, Sunrise Ridge is perfect for those who enjoy their daily outdoor activities.
Average Price $837,711 $1,041,667 24.3%
Average Price Per Square Foot $326 $368 13.0%
Average Days on Market 3 14 366.7%
Highest Price $1,096,000 $1,200,000 9.5%
Properties Sold 5 3 -40.0%
% Sold Price to List Price 106.9% 95.1% -11.0%
Average Price $1,223,250 $1,444,167 18.1%
Average Price Per Square Foot $367 $462 25.9%
Average Days on Market 1 8 700.0%
Highest Price $1,426,000 $1,710,000 19.9%
Properties Sold 8 6 -25.0%
% Sold Price to List Price 100.7% 97.8% -2.9%
Average
Average
Highest
%
Average Price
Average Price Per
Average
Highest
%
Price
Average Price
Average Price
Average
Highest
Properties
%
Tamarisk is located in south Green Mountain, a Lakewood suburb. Tamarisk offers close proximity to some of Colorado’s best amenities, including Red Rocks Amphitheater, Bear Creek Lake Park, Dinosaur Ridge Park, and Morrison.
Trail Village is a beautiful community in Arvada that runs along the Jefferson Country Open Space. Here you have close access to a variety of trails, parks, and the West Woods Golf Course.
JANUARY SEPTEMBER 2022 • COLORADOMICROREPORTS.COM