MALTA CHAMBER OF CONSTRUCTION MANAGEMENT

Professionalism, Innovation and Quality in Construction Management

MALTA CHAMBER OF CONSTRUCTION MANAGEMENT
Professionalism, Innovation and Quality in Construction Management
SUMMARY REPORT ON A SURVEY DONE BY THE MALTA CHAMBER OF CONSTRUCTION MANAGEMENT AS PART OF THE CHAMBER’S COMMITMENT TO THE CIOB EDI CHARTER
September 2022
Jesmond Chetcuti
Chantal Stagno Navarra
Jurgen Borg CiliaLewis Blake
Gesmond Baldacchino
Following the signing of the chartership with CIOB, the Malta Chamber of Construction Management [MCCM] created a working group solely dedicated to the charter. The working group consists of five (5) individuals who have been appointed by Mr Jesmond Chetcuti, the chamber’s president.
Mr Jesmond Chectuti MCIOB; AMICE, Ms Chantal Stagno Navarra MCIOB, MSc AEES. Mr Jurgen Borg Cilia MRICS, MACostE, BSc QS, MRes, MSc HPB, MVEAR 4.0, Mr Lewis Blake, BSc Const. Manage, MCIOB, Mr Gesmond Baldaccino.
Following internal meetings, the group created a survey to establish the situation of MCCM members at their workplace concerning EDI. This was the first survey carried out for the working group and a learning curve.
Although only 46% of the members responded to the survey, the working group is quite satisfied with the results it has attained so far. An in depth analysis of the survey is attached to this document. The survey’s results will be published in our next quarterly magazine and on our website. I, Mr Jesmond Chetcuti, MCCM president, would like to thank Mr Harrison for his availability and the working group comprising, Ms Chantal Stagno Navarra, Mr Jurgen Borg Cilia for his analysis, Mr Lewis Blake, and Mr Gesmond Baldacchino for their support. As one notices, the working group mainly consists of men, which is also reflected in our survey results where most of our members in the construction sector are dominated by male figures
This chapter will present the findings from the questionnaires held for the Equality, Diversity, and Inclusion (EDI). The results and analysis will show the respondents’ opinions on the construction industry. This chapter is divided into three main sections:
1.2.1 The presentations and analysis of findings from a quantitative perspective
1.3 Discussion of results.
The data collected was analysed using software for the quantitative method. The software used to analyse the data for the quantitative approach was Microsoft Excel
The analysis of the questionnaires will be examined in section 1.2.1, together with the discussions and research. All the data in this report derives from the questionnaires sent to 105 respondents via websites and emails. Only forty eight respondents replied to this questionnaire, approximately 46% of the total questionnaires
The quantitative perspective: a questionnaire sent to the respondents which contains questions concerning descriptors such as age, gender, race, disability problems, etc.
In quantitative data analysis, raw numbers are used in meaningful data by applying rational and critical thinking. Questionnaires were sent to 105 respondents; only 48 successfully replied to the survey, approximately 46% of whom had the time to fill in the study and submitted back to the researcher.
The respondents who successfully filled in the questionnaire were 94% male and 6% female and successfully returned the questionnaire to the researcher. In terms of age, the researcher divided the group age into ten categories these will be based on the groups of 15 to 19 years old with a no percentage, followed by 20 to 24 years old with a scale of 2%, 24 to 29 years old with a scale of 2%, 30 to 34 years old with a ranking of 12.50%, 35 to 39 years old with a scale of 27%, 40 to 44 years old with a scale of 18.75%, 45 to 49 years old with a ranking of 16.67%, 50 to 54 years old with a scale of 12.50%, 55 to 59 years old with a scale of 8.33%, and over 60 years old with 0% responses. Most of the respondents were European with a percentage of 90%, which is most of the respondents, followed by multiple ethnicities of 4% and then African, Asian and Others all scale 2% each. Figure 1 below shows the Race, Gender, and Ethnicity of all the successfully received questionnaires
General information of the respondents
European African Asian Other Multiple ethnicity
Female
35-39 40-44 45-49 50-54 55-59 Over 60
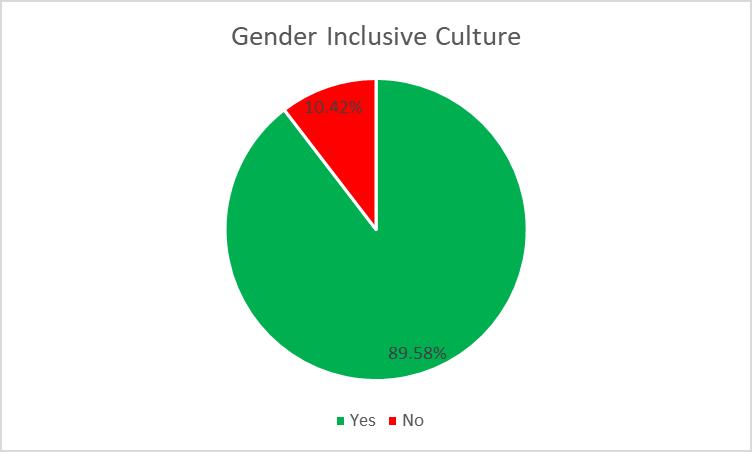
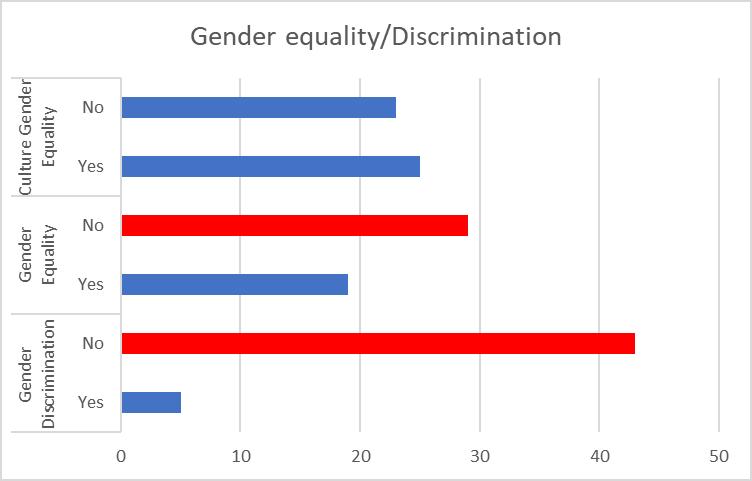
Figure 2 above shows that most of the respondents said that their place of work has gender inclusive culture. Only 10.50% of 100% mentioned that their place of work is limited to certain people and not it is not open to everyone. Figure 3 below shows that the same respondents were asked whether they felt that their place of work is doing something to cater the gender equality; 60.50%, which amounts to 29 respondents, stated “NO”, while the rest stated “YES”.
The survey shows that five (5) out of forty eight (48) suffer from gender discrimination at the place of work. While approximately more than half of the respondents, 25, said “YES” that their workplace encourages cultural gender equality.
The survey shows that in Malta, a significant part of the sample taken for this research had never felt marginalised in the workplace because of their race and culture. The results show that 90% of the respondents never felt race and cultural discrimination issues. Agreeing with this result, the next question caters for the values of the respondent’s unique background and experience. Where 44 respondents mentioned that the organisation they work for deals with their background and expertise, regardless of where they are, what colour they are and what cultural experience they have. Also, they mentioned that their organisation offers equal opportunities for career growth.
89.36% 0.00% 10.00% 20.00% 30.00% 40.00% 50.00% 60.00% 70.00% 80.00% 90.00% 100.00%
Yes No Yes No Yes No
Figure 4: Ethnicity and career in the workplace
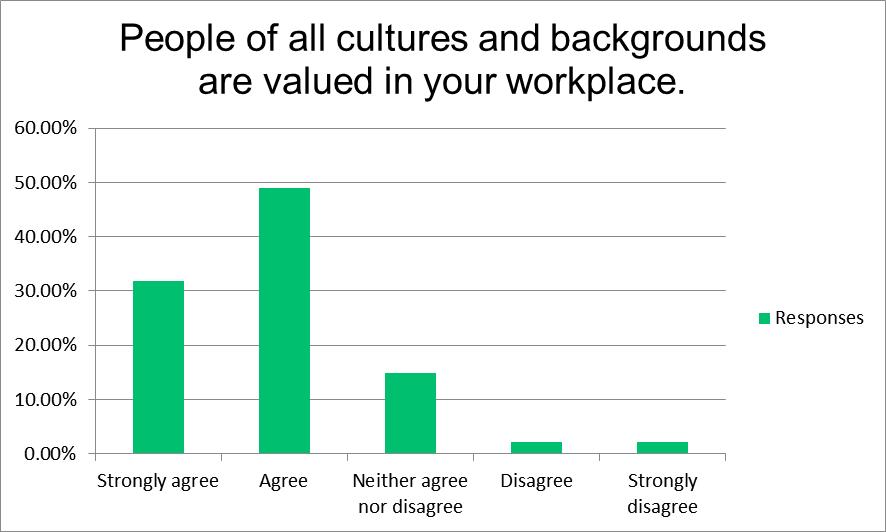
Supporting this above statement, a Likert scale of five (5) was created to help the previous information, where the maximum percentage was 49% which is linked to agree, followed by strongly agree with 32% of the respondents, then neither agree nor disagree with a rate of 15% and disagree and strongly disagree 4% in total which is the minor percentage obtain for this question. The figure below shows the percentage obtained for this question “People of all cultures and backgrounds are valued in your workplace.”
Figure 5: Valued cultures and backgrounds
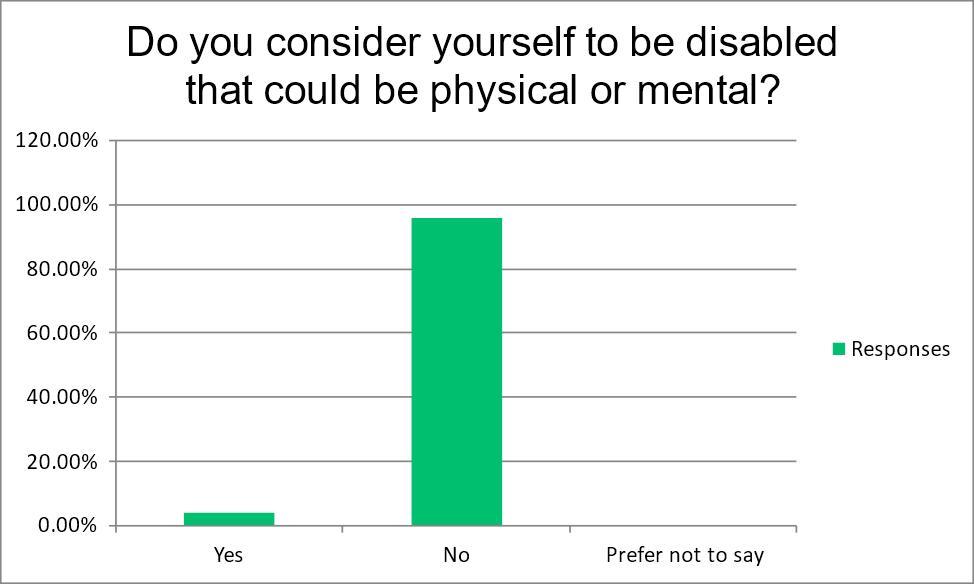
While from figure 5 below, the researcher can identify that 96% of the respondents have no mental or physical health issues. In comparison, 4% have answered yes that they suffer from a psychological or physical health issue.
Figure 6: Disability (Mental or Physical health issue)
The results obtained in the questionnaire show that one (1) respondent said yes while the other five (5) said that their employer does not know how to handle and employ a person with a disability at the place of work. Although figure 2 above shows only two (2) respondents have a disability, the other three (3) mentioned that their employer has not sufficient knowledge of how to employ a person with a disability. At the same time, question 6 of the questionnaire caters for if the employer carries out an effective policy that allows for full integration of people with disabilities. Six (6) respondents replied to this question that their employer has no effective policy to cater for the integration. In comparison, three (3) respondents mentioned that their employer allows the approach for full integration of people with disabilities. Again, this question was for those respondents who said yes in question 4. Only two respondents mentioned they have disabilities. While Question five (5), which caters if you consider that your employer gets sufficient knowledge on how to employ a person with a disability, cannot be concluded as
some of the respondents also answered this question, question five (5) had to be answered by only those who are disabled.
The results show that approximately 72% mentioned that their place of work has a social atmosphere for understanding the needs and possibilities of people with disability. At the same time, the other 28% mentioned that their place of work has no social atmosphere for people with disabilities.
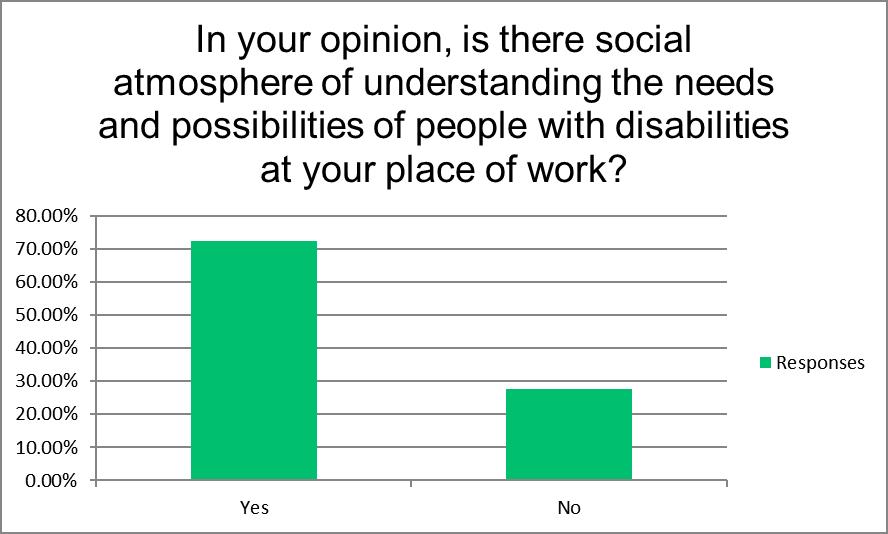
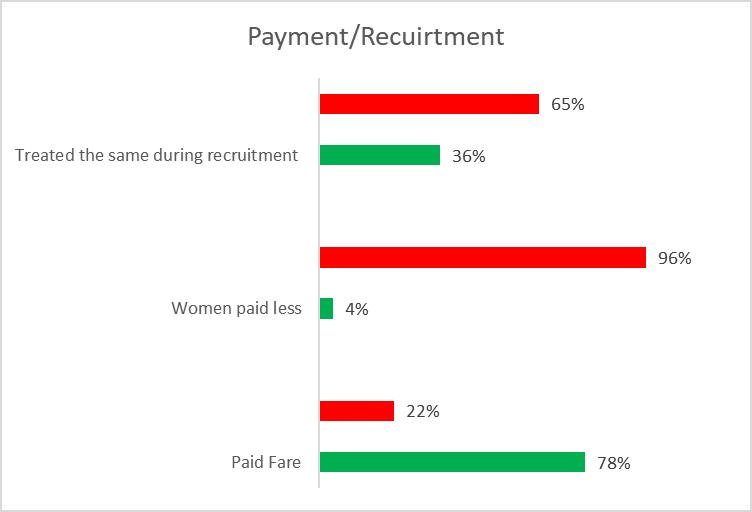
Figure 5 below shows thirty-seven (37) out of forty-seven (48) stated that they are paid fairly at their place of work and for their current occupation. At the same time, ten (10) respondents mentioned that they were unhappy with their salary. The survey also showed that the respondents agreed that women should not be paid less for doing the same, with a percentage of 96%, while only 4% stated that they wish that women should be paid less than men. The survey also shows that during the interviews for the recruitment of employees, women and men are not treated the same. This shows that employers prefer to employ men rather than women in the construction industry. Question 18 mentioned whether you know or feel that women have less opportunity than men; ten (10) respondents said “YES” they know or think that they are being discriminated while the other thirty eight (38) respondents specified that they do not suffer or know someone that had to suffer less opportunity than men.
This questionnaire section was created on a Likert scale of 5 with strongly agree, agree, neither agree nor disagree, and strongly disagree. Where the question specifies the statement, “Do you agree with the statement (sexual harassment represents behaviour which is largely normalised in the construction sector)”. Figure 7 below shows that most respondents neither agreed nor disagreed, with a scale of 35.42%. Approximately sixteen (16) respondents disagreed with the
statement with 33.33%, followed by agree with thirteen respondents on a scale of 27.08%. Finally, strongly agree with a percentage of 4.17%. None of the respondents strongly disagreed with the statement.
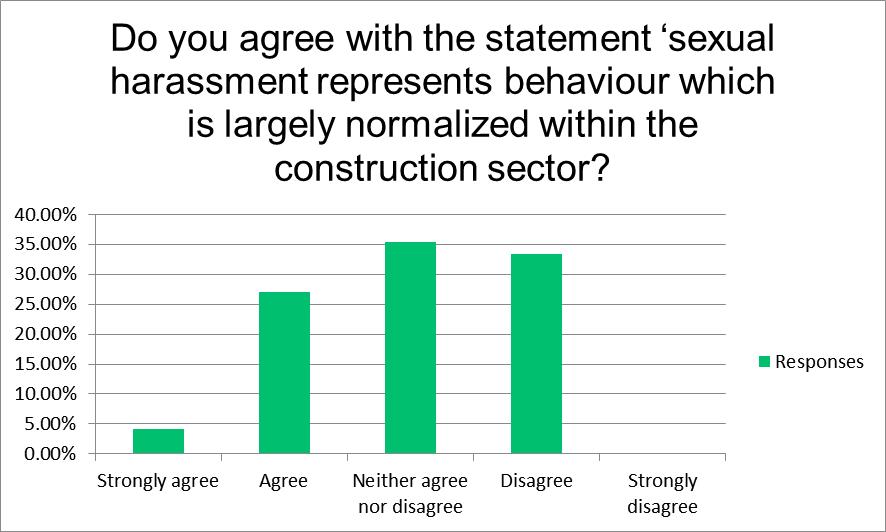

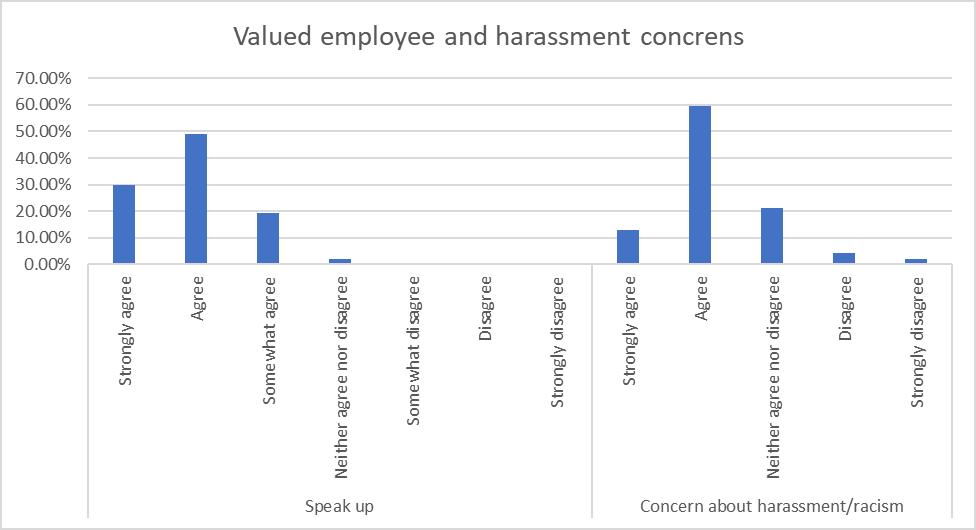
Figure 10 above shows that the employee, whatever race, culture, age, and gender they are employees valued at the place of work, with a percentage of 49% agree, 30% strongly agree, 30% somewhat agree, 2% neither agree nor disagree and no rate for the disagree section. At the same time, they are also concerned about where they should lay a complaint when racism or sexual harassment occurs in the workplace. Only 6% of the respondents said they do not know what to do when they suffer racism or sexual harassment at the workplace.
The main objectives of this research were to establish equality, diversity, and inclusivity at the place of work.
The limitation of this survey may be considered as a lack of data from the respondents the understanding of the question in the questionnaire. The research was conducted only by the Malta Chamber of Construction Management member The study was carried out in a cross sectional approach because time was limited. Limitations in data tools and since the survey was based on epistemological assumptions on a philosophical worldview of pragmatism. Since
MCCM was launched in May 2022, this is the first survey that this chamber is doing, and it lacks experience in such questionnaires and surveys
From the above data gathered from the respondents, it can be concluded that in Malta, most construction site managers workers are Men, with a rate of 94% out of 100% of this sample that was gathered from the respondents, with a majority of European ethnicity of 89% works in the Maltese construction site managers. To whom approx. 96% of the total respondents have no disability, neither mental nor physical.
In Malta, there is no gender inclusive culture discrimination as 90% of the respondents answered “YES” in our workplace; we have a gender inclusive culture. Also, in Malta, people with different cultures and backgrounds are valued and respected. Also, the respondents specify that they are paid fairly for their roles and responsibilities in the workplace. While sexual harassment behaviour in the construction industry in Malta is large “NOT” normalised most of the respondent specifies that they neither agree nor disagree with the statement in the questionnaire.