Effects of automated transit, pedestrian, and bicyling facilities on urban travel patterns
EFFECTS OF AUTOMATED TRANSIT, PEDESTRIAN AND BICYCLING FACILITIES ON URBAN TRAVEL PATTERNS
4. Title and Subtitle
EFFECTS OF AUTOMATED TRANSIT, PEDESTRIAN, AND BICYCLING FACILITIES ON URBAN TRAVEL PATTERNS
7. Author(s)
J. Levine, M. Zellner, Y. Shiftan, M. Arquero de Alarcon, A. Diffenderfer
9. Performing Organization Name and Address
University of Michigan 2000 Bonisteel Blvd. Ann Arbor, MI 48109
University of Illinois Chicago 2035 W Taylor St. Chicago, IL 60612
12. Sponsoring Agency Name and Address
US Department of Transportation Federal Highway Administration Office of Operations R& D Turner-Fairbank Highway Research Center 6300 Georgetown Pike. McLean, VA 22101
15. Supplementary Notes
Project performed for the Federal Highway Administration
Jonathan Levine, Principal Investigator
Moira Zellner, Yoram Shiftan, Maria Arquero de Alarcon, Co-Principal Investigators
5. Report Date: September 2013
6. Performing Organization Code
8. Performing Organization Report No.
10. Work Unit No. (TRAIS)
11. Contract or Grant No. DTFH61‐09‐C‐00013
13. Type of Report and Period Covered
September 2009 – September 2013
14. Sponsoring Agency Code
Dean Massey, Joshua Morrison, Sen Liu, Wen Zhong, Tara Mather, Inbal Glikman, Research Assistants
Douglas Hammer, Survey Field Coordinator
16. Abstract
Transit in the United States often suffers from the problem of inability to deliver travelers all the way from their point of origin to their destination. This “last-mile” problem is thought to deter transit use among riders with auto access, even when high-quality transit service is provided for the majority of the trip distance. This study explores how transportation improvements, including automated driverless community transit between origins of trips and nearby transit stations, and urban-design improvements enhancing pedestrians’ and cyclists’ commute might help overcome the last-mile problem. This study was based on four neighborhoods in metropolitan Chicago, selected as an area with significant regional rail but also room to grow in terms of transit use. The neighborhoods were chosen to represent similar access to the Chicago Transportation Authority (CTA) rail system but different combinations of affluence and density: higher-income/higher-density (Evanston); higher-income/lower-density (Skokie); lower-income/higher-density (Pilsen) and lower-income/lower-density (Cicero).
Overall, the presence of the community transit and urban-design improvements had a marked effect on the sample modeled. The sample lived within 1.5 miles of a CTA rail station and worked within 3 miles of a station. The transportation mode choices of this group were modeled with and without community transit and a set of urban amenities. Deploying these reduced driving by between 7 and 29 percentage points; the largest percentage-point reductions were in the more auto-oriented areas of Cicero (16 percentage points) and Skokie (29 percentage points). Auto-use reductions were somewhat lower in areas with greater transit use to begin with: Pilsen (8 percentage points) and Evanston (7 percentage points). Use of the train increased between 9 and 28 percentage points, with more auto-oriented Skokie (28 percentage points) and Cicero (23 percentage points) exceeding the denser Pilsen (12 percentage points) and Evanston (9 percentage points). CTA mode shares among the sampled/modeled population increased from 24% to 52% in Skokie, 46% to 55% in Evanston, 52%to 75% in Cicero, and 52% to 64% in Pilsen. Across all neighborhoods community transit is forecast to decrease car share from its current 36% to 22% and increase CTA share from its current 50% to 67%. The findings that community transit produced greater change in the lower density areas of Skokie and Cicero are among the more robust in the study. Results from the stated-preference experiments suggest that these changes could be further improved with supportive augmenting policies, notably pertaining to parking pricing.
17. Key Words
Automated Vehicles, Transit, Last-Mile Problem
19. Security Classification (of this report)
Unclassified
20. Security Classification (of this page)
Unclassified
18. Distribution Statement No restrictions.
21. No of Pages 260
22. Price N/A
EXECUTIVE SUMMARY 1
Transit in the United States often suffers from the problem of inability to deliver travelers all the way from their point of origin to their destination. This “last-mile” problem is thought to deter transit use among riders with auto access, even when high-quality transit service is provided for the majority of the trip distance. This study explores how transportation improvements, including automated driverless community transit between origins of trips and nearby transit stations, and urban-design improvements enhancing pedestrians’ and cyclists’ commute might help overcome the last-mile problem. This study was based on four neighborhoods in metropolitan Chicago, selected as an area with significant regional rail but also room to grow in terms of transit use. The neighborhoods were chosen to represent similar access to the Chicago Transportation Authority (CTA) rail system but different combinations of affluence and density: higher-income/higher-density (Evanston); higher-income/lower-density (Skokie); lower-income/ higher-density (Pilsen) and lower-income/lower-density (Cicero).
The study entailed a household survey of at least 150 respondents in each of the neighborhoods studied. This survey incorporated both peoples’ current travel patterns and their stated preferences after hypothetical implementation of the improvements, which were described both visually and quantitatively. It was used as the basis of estimation of an activity-based model of mode choice in the areas studied.
In parallel, an agent-based model representing the commuters and their preferences for different aspects of transportation disutility, namely cost, time and safety was developed. Commuters in the model assess their transportation options in light of their preferences, the characteristics of their environment, and the various modes available to them. The model was calibrated with data from the four neighborhoods, and implemented on stylized versions of each neighborhood. In its first iteration, the model was developed using parameters found in the travel behavior literature. A second round of modeling incorporated parameters from the activity-based model into the agent-based model.
Simulations were run on the basis of this combined model. Overall, the presence of the community transit and urban-design improvements had a marked effect on the sample modeled. The sample lived within 1.5 miles of a CTA rail station and worked within 3 miles of a station. The transportation mode choices of this group were modeled with and without community transit and a set of urban amenities. Deploying these reduced driving by between 7 and 29 percentage points; the largest percentage-point reductions were in the more auto-oriented areas of Cicero (16 percentage points) and Skokie (29 percentage points). Auto-use reductions were somewhat lower in areas with greater transit use to begin with: Pilsen (8 percentage points) and Evanston (7 percentage points). Use of the train increased between 9 and 28 percentage points, with more auto-oriented Skokie (28 percentage points) and Cicero (23 percentage points) exceeding the denser Pilsen (12 percentage points) and Evanston (9 percentage points). CTA mode shares among the sampled/modeled population increased from 24% to 52% in Skokie, 46% to 55% in Evanston, 52% to 75% in Cicero, and 52% to 64% in Pilsen. Across all neighborhoods community transit is forecast to decrease car share from its current 36% to 22% and increase CTA share from its current 50% to 67%. The findings that community transit produced greater change in the lowerdensity areas of Skokie and Cicero are among the more robust in the study. Results from the stated-preference experiments suggest that these changes could be further improved with supportive augmenting policies, notably pertaining to parking pricing.
Initial agent-based models based on mode-choice literature suggested that effect of community transit alone could be augmented
with urban-design improvements to the walking and cycling environment, with roughly an additional 5 percentage points of drivers diverted through urban-design improvements. However, responses to the images used in the survey did not support this initial finding; respondents did not register differences in their mode choices between the shuttle-based scenarios and those that included the full complement of urban-design improvements. The minimum case represented was community transit with a bike lane; the benefits were observed with the shift between the base case and that one. Extensive urban-design improvements beyond the bike lane were tested, and none of them had a measurable impact on mode choice in our study. Thus while there is support in the mode-choice literature for the potential of urban-design improvements to reduce driving, this study did not generate additional empirical evidence in this regard.
The models enabled an investigation into the effect of neighborhood environments on the success of the improvements contemplated, as well as that of supporting policies. Less dense neighborhoods were more sensitive to higher parking costs, streetscape improvements and community transit service than the denser and more pedestrian-oriented neighborhoods. Distance from the station encouraged driving, but the presence of community transit encouraged shifts towards transit. Streetscape improvements tended to support transit use for residences closer to train stations. Results from the activity-based model suggest that of the design variables, the frequency of the community transit vehicle had the greatest influence on its use.
In addition to anticipating a range of likely mode choice outcomes, the agent-based modeling approach facilitates exploration of the mechanism underlying travelers’ behavior. Rather than modeling through data fitting, the approach involved formulating theory of behavior first, using data to parameterize the conceptual model, and running simulations to see how the outputs would match observations. Discrepancies that arose led to both modifications of the theory and reformulations of the conceptual model to explain them. For example, while in general frequent and nearby bus service shuttling travelers towards the commuter train station with express service downtown encourages transit use, extensive bus coverage can also encourage
bus use to access downtown. Replication of the small share of cyclists among commuters from the neighborhoods required the use of modespecific bike penalties in the model. These penalties exceeded those typically found in the literature, suggesting relatively greater barriers to cycling in these neighborhoods than elsewhere in the country.
One hypothesis that was tested in both agent-based and activitybased models was that of a feedback between presence of users of the pedestrian, cycling, and transit modes and the attractiveness of these modes. While this feedback may be present in practice, neither investigation found evidence of it.
Survey respondents were also asked their perceptions regarding travel via the different modes under the various improvement scenarios. Perceptions of the qualities of transit, cycling, and walking improved markedly, and considerably more than any decrease in the perceptions of the qualities of driving. In general, lower transit, cycling, and walking in the base case were associated with greater improvement in perceptions under the improved conditions: where transit, pedestrian, and cycling rates were high, there seemed to be less room for improvement.
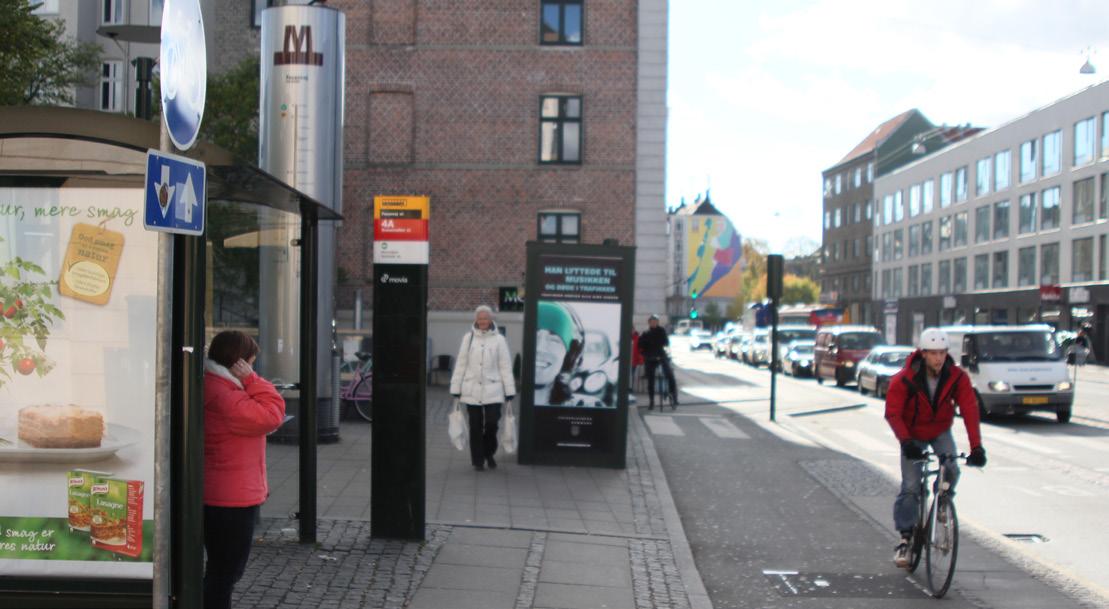
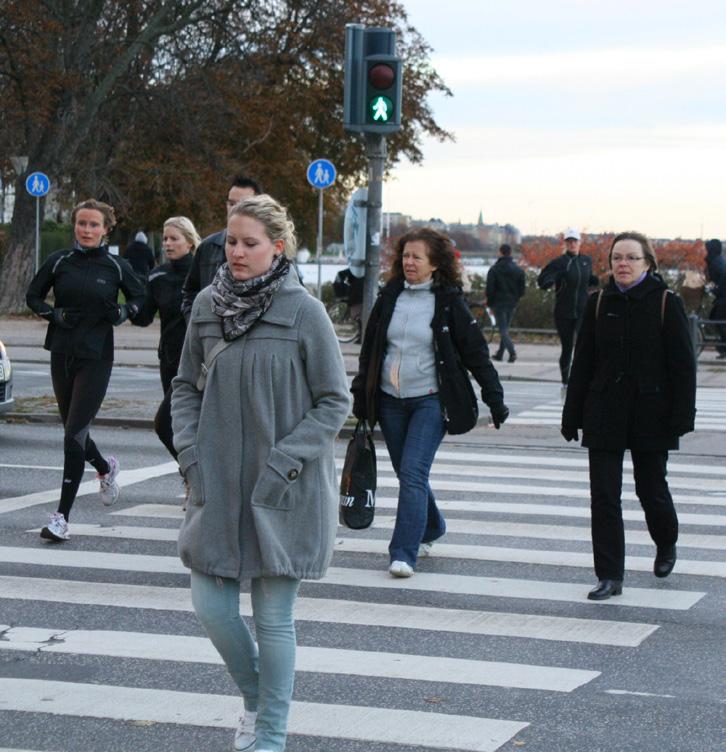
A comparative analysis of Copenhagen, a world leader in transit, cycling, and pedestrianism was conducted (Appendix 1). The analysis was designed to establish a basis for comparison and to provide inspiration for proposed urban design improvements. While the analysis suggested that significant modal shifts are feasible in the US context—especially when contemplated improvements are augmented with other supportive policies—achieving a transportation profile akin to that of Copenhagen is not likely absent extensive integrated policies in land-use change and transportation and energy pricing.
Estimates presented here are intended to represent a bestcase scenario. Sources of error include self-selection bias (only the small percentage of survey recruits willing to respond were surveyed), bias on the part of survey respondents answering questions about their behavior under hypothetical transportation and urban-design improvements, and modeling error. The analysis estimated and controlled for these biases to the fullest extent possible.
1.1 Quadrifoglio, L., & Chandra, S. (2011). Evaluating the Effect of Street Network Connectivity on First/Last Mile Transit Performance: Texas Transportation Institute, Texas A&M University System.
Overall, the combination of agent-based and activity-based model provides insights into the dynamics that can lead to policy success. Given the large numbers of uncertainties, modeled numbers that the models generate remain best-guess estimates of a best-case scenario.
1.1 Introduction
Rapid progress in automated vehicle technology over the last few years opens up the possibility of novel transportation alternatives. The car that drives itself—once a futuristic vision but currently under development in a number of forms—can offer numerous safety, societal, and infrastructure-related advantages. But the transformative power of rapid technological advances need not be restricted to private transportation and can alter people’s choices of modes, destinations, and even locations. One potential domain of this transformation is in the “Last-Mile Problem” of public transit1 whereby access to and from high-quality transit—referred to as “the last mile”—strongly shapes people’s propensity to use the transit mode. Transit that offers frequent and rapid service along the main lines but leaves the travelers a mile from their destinations with poor connecting options is rarely the mode of choice.
Cost is always a significant obstacle to overcoming the “lastmile” problem. In low-to-medium density environments in particular, the cost of providing connecting service may not be shared across a high number of passengers because of low vehicle occupancies; this renders the cost per passenger unaffordable, whether in the form of high fares or unsupportable subsidies. A majority of the operating costs of public transit are the cost of wages and benefits 2; technological innovations that can reduce transit labor intensiveness therefore hold potential to expand transit’s reach by lowering its per passenger cost. In addition, work rules frequently require or prioritize day-long shifts for drivers, leading to high labor costs that continue even during periods of low transit demand.
In combination, these ideas—automated vehicles, high labor costs for transit, and avoiding operating costs during periods of low
1.3 e.g., Agrawal, A. M., Schlossberg, M., & Irvin, K. (2008). How Far, by Which Route and Why? A Spatial Analysis of Pedestrian Preference. Journal of Urban Design, 13(1), 8198.
1.4 Saelens, B., & Handy, S. (2008). Built Environment Correlates of Walking: A Review. Medicine & Science in Sports & Exercise, 40(7S), S550-S566.
1.5 Mehta, V. (2009). Look Closely and You Will See, Listen Carefully and You Will Hear: Urban Design and Social Interaction on Streets. Journal of Urban Design, 14(1), 2964.
1.6 Estupiñan, N., & Rodríquez, D. (2008). The Relationship between Urban Form and Station Boardings for Bogotá’s BRT. Transportation Research Part A, 42(296-306).
1.7 Rodríquez, D., Estupiñan, N., & Elizabeth, B. (2009). The relationship between segmentlevel built environment attributes and pedestrian activity around Bogota’s BRT stations. Transportation Research Part D: Transport and Environment, 14(7), 470–478.
1.8 Buehler, R., & Pucher, J. (2012). Cycling to Work in 90 Large American Cities: New Evidence on the Role of Bike Paths and Lanes. Transportation, 39(2), 409-432.
1.9 Pucher, J., Dill, J., & Handy, S. (2010). Infrastructure, Programs and Policies to Increase Bicycling: An International Review. Preventive Medicine, 50(S1), S106-S125.
transit demand—suggest an approach to the perennial “last-mile” problem: automated community transit to provide services between neighborhoods and rapid transit stations. The potential for these vehicles to operate without drivers may significantly lower their operating costs, thus enabling frequent demand-tailored service that better serves travelers’ needs.
The vision of frequent driverless community transit linking neighborhoods and rapid transit is undoubtedly a long way off and would require significant research and development work, some of which would need to start early on. As appealing as it may appear to some, the vision is not self-justifying, however. It may be that in most U.S. contexts, even a high level of community transit service connecting neighborhoods to rapid transit would be insufficient to alter the travel choices of a significant number of travelers. Alternatively, streetscape improvements or rising driving costs, which have been more extensively covered in the literature, 3 may provide stronger incentives for modal shifts. For example, the success of transit depends in large part on its broader urban environment, since every transit trip begins and ends as a walking trip. Improved streetscape aesthetics, increased density and mixing of land uses, and presence of sidewalk walkers enhance the attractiveness of walking as a mode of transportation 4,5 and to bus ridership. 6,7 For many people, the bicycle can provide a fast commute to work but is frequently hampered by unappealing or unsafe bicycle facilities. Establishing bike facilities, lanes and paths can result in higher bike use, more so if lanes are separate from the street. 8,9
We present here an initial inquiry into the relative impact of approaches to the last-mile problem based in automated community transit, pedestrian improvements, and cycling enhancements, with the intent of informing discussions on policy choices with regard to these options. Because investments in automated vehicle technology are long-term in nature and somewhat speculative at this point, this research is intended as an initial inquiry into the capacity of this technology, when deployed as community transit in combination with urban-design improvements, to encourage shifts away from the drivealone mode. For this reason, this research has been structured as a “best-case” scenario for these technologies; the idea is to aid in an assessment of whether or not they hold promise for further research
and development rather than a narrow feasibility assessment. This “best-case” framework guided working assumptions for the analysis: no congestion in the local streets of the neighborhoods studies; no limitations due to weather or nighttime conditions; the ability to alter rights-of-way without restriction to improve transit, pedestrian and cycling environments. Similarly, in order to model this best-case scenario, the analysis tested modifications in the transportation environment, such as changes in the cost of parking or driving that would give the greatest chance of yielding significant shifts in travelers’ modes.
The analysis was conducted in four neighborhoods of metropolitan Chicago, a region with effective regional rail transit together with high auto use. The neighborhoods represent combinations of two important factors in mode choice: land-use mix
Figure 1.1: Location of the four Chicago neighborhoods: Skokie, Evanston, Cicero and Pilsen. CTA train network in color.
and density, which is also strongly associated with the transit type and level of service provided, and income. The neighborhoods are: (a) Skokie (higher income, lower-density single use) at the DempsterSkokie station, (b) Evanston (higher income, higher-density mixed use) at the Davis station, (c) Cicero (lower income, lower-density single use) at the 54th/Cermak station, and (d) Pilsen (lower income, higherdensity mixed use) at the Damen station.
The analysis proceeded in four components. (1) A survey was completed of residents in the four neighborhoods to assess current travel patterns, and perceptions and likely responses to contemplated improvements in neighborhood transit, together with associated improvements in the walking and cycling environments. (2) An agentbased model of mode choice was developed to enable exploration into interaction among travelers and the spatial dimensions of their travel behavior. Coefficients of the model were derived from the research literature. (3) An activity-based model of mode choice was estimated on the basis of the survey data to estimate the components of travel behavior under the contemplated transit, pedestrian, and cycling alternatives. (4) Estimated coefficients from the activity-based model were used to modify the activity-based model, and results compared.
In parallel, a comparative analysis of Copenhagen, a world leader in transit, cycling, and pedestrianism was conducted (Appendix 1). The analysis was designed to establish a basis for comparison and to provide inspiration for proposed urban design improvements.
SURVEY METHODOLOGY 2
2.1 The research protocol with the UIC Institutional Review Board (IRB) in November 2010, and received the approval letter stating that the protocol met the criteria for expedited review as defined in the U.S. Department of Health and Human Services Regulations for the Protection of Human Subjects on March 24, 2011, under IRB protocol number 2010-1066.
2.2 Though phone numbers can be purchased with address-based sample, we did not purchase the numbers for this study.
2.1 Overview
The Survey Research Laboratory (SRL) at the University of Illinois at Chicago (UIC) conducted a telephone survey 1 for this study.
Of interest was the capacity of these improvements to generate the following shifts:
1. Modal shift of neighborhood trips from auto to other modes of transportation;
2. Increased use of regional public transit based on improved station access;
The four neighborhoods involved in this study represented different land-use and demographic characteristics to ensure the generalizability of the research findings to a variety of urban conditions. As part of the survey, respondents were asked to complete a travel diary and were presented with images representing potential improvements to the pedestrian, cycling, and transit environments of their neighborhoods and responded to scenarios regarding their travel under these altered conditions.
2.2 Study Design
2.2.1 Sampling Plan
This survey had a multimode design. Address-based sampling was used to randomly select addresses from the four neighborhoods— Cicero, Pilsen, Evanston, and Skokie. An initial mailing describing the study was sent to all selected addresses. This letter indicated that respondents would be required to complete a travel diary and take part in a phone interview based on the travel diary. 2 Household adults age 18 and older self-selected into the sample and completed and returned a form (referred to as a “response letter” hereafter) with their name, phone number, and responses to questions that determined eligibility. Upon receipt of the form, SRL staff reviewed the information; if the respondent was eligible and willing to participate, they were sent a
packet with additional study materials and information about when they could expect to receive a phone call to conduct the interview. A $50 check was offered as an incentive and mailed to respondents upon completion of the telephone interview.
At the time of the original proposal, we estimated a starting sample size of 7,700 households would result in 766 completed interviews. These 7,700 households would be equally divided among the four neighborhoods. Of the 7,700 households selected for the study, we expected that 19% (1,463) would return a response letter with contact information and answers to the questions that determine eligibility. We estimated we would make contact by telephone with 94.7% of the 1,463 households to ask for the respondent who returned the response letter, and we expected 77.8% of the households contacted to be cooperative. Of the resulting 1,078 households, we estimated that 92.9% would be eligible, that we would contact 85.0% of them to conduct the survey, and that 90.0% of those contacted would complete the interview. Based on these rates, we expected that individuals from 766 households would complete the telephone survey, resulting in a participation rate of 10.0%. These estimates were based on our experience with similar studies, though we had never executed this exact design.
2.2.2 Respondent Eligibility
In addition to being 18 or older, eligible respondents had to (1) speak English or Spanish, (2) confirm that they lived at the street address that was selected in the sample, and (3) commute to work or to a school located within three miles of a Chicago Transit Authority (CTA) station or travel to their neighborhood CTA station at least once a week. Only one person from each household could participate.
There were a few instances when the person who returned the response letter was not 18 or older. This was discovered during the phone interview; these cases were coded as ineligible. In addition, several respondents did not confirm their address on the response letter, but interviewers also confirmed the respondent’s address during the telephone interview. If the respondent no longer lived at the sampled address, the case was coded as ineligible.
2.3 Late in data collection we discovered that though the initial sample frame had unique mailing addresses, the policy of including respondents who lived at unit numbers that were not sampled resulted in people being included in the sample more than one time. We removed these duplicate cases.
Early in the data collection period, some respondents returned the response letter and indicated that they lived at the sampled street address but in a different unit/apartment than had been selected. These respondents were included in the sample. 3
2.2.3 Study Materials
Once we determined that a respondent was eligible to participate, we mailed them a study packet that included the following:
1. A cover letter, including instructions for completing the travel diary on a randomly assigned weekday
2. A consent information form
3. A travel diary
4. A booklet containing seven color images and six worksheets
All study materials are included as Appendices 2 and 3. The travel diary and the booklet were used by the respondent to complete the telephone interview. The images in the booklet were of the respondent’s local Chicago Transit Authority (CTA) station in its current state and then with a variety of physical improvements to the area surrounding the station.
2.4 Addresses that were noted as unoccupied for 90 days or longer were not included in the sample frame. Post office box (P.O. box) addresses were also not included in the frame unless they were the only way for an address to get mail (OWTGM) or if the city-style address was forwarded to a post office box. Genesys was able to tell us if more than one residence was associated with a specified address. If such an address was selected, one mailing was sent to the address.
The geographic areas for the study were selected by the project investigators because they were close to select CTA stations. Because the images that were mailed to the respondent for use during the phone interview were dependent on the direction the respondent approached the CTA station, we divided each of the four neighborhoods into two subareas (A and B) so that the appropriate materials could be included in the mailing more easily. The boundaries for the sampled areas in each neighborhood are shown in next page, and Chapter 3.
Table 2.1 shows the population distribution in areas A and B in each of the four neighborhoods as reported to us from Marketing Systems Group, Genesys Sampling (our sampling vendor) on February 29, 2012.
Addresses were purchased three times during the main study and were purchased from each of the subareas - Cicero A&B; Pilsen A&B; Evanston A&B; and Skokie A&B - in proportion to the distribution of the neighborhood’s population. 4
Table 2.1 Population Size & Percent Distribution, by Neighborhood
2.2.4 Questionnaire Development and Design
The questionnaire was developed by the team of study investigators with help from the SRL project coordinator and reviewed by SRL’s Questionnaire Review Committee (QRC). The committee is composed of SRL staff members appointed by the Director to ensure that all questionnaires administered by SRL follow ethical practices and basic principles of questionnaire construction. No instrument is administered to respondents before approval is obtained from this committee. The final version of the questionnaire is included in Appendix 4.
The questionnaire was primarily centered on the respondent’s travel on a randomly selected weekday. Six “choice experiments” were included in the questionnaire. Respondents used the booklet of images and worksheets in their study packets to complete this section of the interview. These experiments used the actual travel data obtained from the respondent to create hypothetical travel scenarios. Interviewers entered respondents’ starting location address and destination into Google Maps. The various travel times for each mode of transportation were entered into the questionnaire instrument that used formulas to calculate travel times and costs, such as travel time to the CTA station, total drive time, and community transit vehicle frequency. The interviewers read these values to the respondent who entered them into the worksheet in the booklet. This process was designed so that the formulas generated different values for each worksheet. Respondents were asked to study the information on the worksheet as well as the corresponding image and select the mode of transportation they would choose based on the scenario being presented. Due to the complexity of this, QRC suggested that the SRL project coordinator conduct some informal cognitive interviews with SRL staff to see how the questionnaire worked. The feedback received during these
Figure 2.1: Geographic boundaries of the Areas of Study in the four neighborhoods.
informal cognitive interviews helped simplify and focus the content of the travel diary and the worksheets to make it easier for survey respondents to use.
After the QRC review, the instruments were programmed for Computer-Assisted-Telephone-Interviewing (CATI) administration and tested by the field section and project coordinator before pretest data collection began. SRL utilizes the CASES system developed by the Computer-Assisted Survey Methods Program at the University of California-Berkeley. This survey was programmed in CASES version 5.4.
2.3 Pilot Study
SRL conducted a pilot study in April 2011. Due to OMB restrictions, only nine pilot study telephone interviews could be completed. This limited our ability to test assumptions about response rates. A random sample of 100 addresses—25 from each of the geographic areas--was purchased from Genesys Sampling. It was expected that 19% of the respondents would return the response letter. Telephone interviews would be attempted with all of those. Based on the estimated participation rates, we expected to be able to complete ten interviews, though interviewers were instructed to stop at nine per the OMB regulations.
The initial recruitment letters were sent out to households on April 18, 2011. We did not conduct Spanish language interviews in the pilot study, so the recruitment letter was sent in English only. Respondents 18 years or older in the household self-selected into the survey. Those respondents returned the response letter, and SRL staff reviewed the response letters to ensure that participants lived at the sampled address and worked or went to school within three miles of a CTA station or visited their CTA station or station area at least one time per week. On May 11, 2011, questionnaire packets were sent out to respondents who were both eligible and agreed to complete the questionnaire. The interview packet included a randomly selected travel date on which the respondent would complete the enclosed travel diary. The interviewer would ask them to provide information from this travel diary during the phone interview. If the respondent
did not travel on the selected day, they were asked to select the next weekday that they traveled as the reference day. Data collection started on May 18 and continued through May 31, 2011.
Four field supervisors were trained to conduct the pilot study telephone interviews. Interviewer training was held on May 16, 2011. Training included a general orientation to the design and purpose of the study, instructions on gaining cooperation of the household and the respondent, a question-by-question review of the survey instrument (with instructions on how to record answers and how to probe), and practice interviews with all instruments. All supervisors were supplied with an interviewer training manual, which covered all aspects of the data collection procedures. This manual was used during the training session and as a reference throughout the pretest.
Most telephone interviewing was conducted on weekday evenings and weekends to increase the probability of successful contact with survey respondents, although daytime appointment requests were accommodated. Respondents were interviewed within five days of the date they were assigned to complete their travel diary.
Table 2.2 shows the final disposition of sample for the pilot study cases. Appendix 5 provides a description of disposition codes.
Table 2.2 Final Disposition of Sample, Overall & by Neighborhood: Pretest
Table 2.3 Final Sample Numbers & Rates: Overall & by Neighborhood:Pretest
Table 2.3 shows the rates at each stage of the data collection process. Appendix 6 provides a description of these rates.
2.5 The American Association for Public Opinion Research.(2011). Standard definitions: Final dispositions of case codes and outcome rates for surveys(7th ed.). AAPOR.
2.6 Standard Definitions notes that “response rates” should be calculated for studies that have probability samples. While the first stage of the sample for this study is a probability sample, the subsequent stages are not. AAPOR suggests calculating a participation rate for nonprobability Internet studies, and we have elected to do so here as well.
As anticipated, 19% of the households (19 of the 100 sampled) did return the response letter. Two of these were eligible but were returned too late to be included in the pilot study (the timeframe for returning the letters in the main study was longer, one was ineligible because the respondent indicated that he/she did not live at the sampled address, and another was a refusal. As such, 15 of the cases were set up for calling. Of these, we completed nine interviews. This was the maximum allowed per OMB rules; however, it was also the amount that we would have been able to complete even without OMB rules. While the overall rates were what we had expected, rates varied substantially by neighborhood.
The participation rate is defined as the number of completed interviews divided by the number of cases that were sent questionnaires.5,6 As shown in Table 2.4, the overall participation rate for this study was 9.0%; the participation rates varied by neighborhood from 4.0% (for both Cicero and Pilsen) to 16.0% (for Evanston). Skokie’s participation rate was 12.0%. Response rates were not calculated for this study because the sample was not a probability sample at every stage—once a household was selected, the respondent self-selected from an unknown number of potential eligible respondents within the household.
A pilot study debriefing was held on June 2, 2011. The SRL project team met to discuss what worked well and what might need to be changed for the main study. Several changes resulted from this meeting. First, the images and worksheets in the study packet for the pilot study were large (11”x17” images) and uncollected. This was burdensome both for respondents as well as for SRL Data Reduction staff, who were responsible for the mailings. In the main study, these images and worksheets were organized into a printed and bound booklet and arranged so that the worksheet faced its corresponding image for ease of use. Second, it was hard for respondents to determine what was different in each of the images presented to them. It was suggested that we add titles to each image and label the changes in each to make it easier for respondents to identify what they should be looking at. This change was implemented for the main study. Third, there were some changes made to the questionnaire. The travel diary questions were changed so respondents were asked about the highway
tolls only one time per tour, and the mode of transit questions were reworded so interviewers did not have to read the response options each time.
Later in June, the questionnaire and all study materials were sent to Yolanda Fowler, our Spanish translation consultant, for English to Spanish translation. Once we received the translations, they were reviewed internally for consistency. The Spanish version of the questionnaire then was incorporated into the CASES programming for telephone interviewing.
OMB requested more information about the study in October 2011 and January 2012. We received approval from the agency in February 2012. Per OMB regulations, the following paragraph was added to the response letter and the travel diary.
This collection of information is voluntary and will be used to gauge potential travel-behavior response to farreaching improvements in the pedestrian, cycling, and transit environments of neighborhoods. Public reporting burden is estimated to average 1 hour and 45 minutes per response, including the time for reviewing instructions searching existing data sources, gathering and maintaining the data needed, and completing and reviewing the collection of information. Please note that an agency may not conduct or sponsor, and a person is not required to respond to, a collection of information unless it displays a currently valid OMB control number. The OMB control number for this collection is 2125-0629. Send comments regarding this burden estimate or any other aspect of this collection of information, including suggestions for reducing this burden to: Information Collection Clearance Officer, Federal Highway Administration, 1200 New Jersey Avenue, SE, Washington, DC 20590.
2.4 Main Survey Study
2.4.1
Sample Management
Table 2.5 shows the dates of sample purchase, the number of cases in each of the eight geographic areas (both A and B sections of each neighborhood), and the date of the initial mailing.
Data collection started on March 12, 2012, when the initial mailing for Replicate 1 was sent. The first sample purchase of 7,700 cases consisted of the same number of cases—1,925—in each of the four neighborhoods. These cases were delivered in eight replicates; the initial mailing date for these replicates ranged from March 12 to April 30, 2012. Based on the pilot study, we expected that the number of completed interviews would differ by neighborhood at the completion of the first eight replicates.
Response to the initial mailing in these first eight replicates was about half of what we estimated. Thus, we purchased an additional 5,000 pieces of sample. Prior to the second sample purchase, it was apparent that we would be unable to reach the original study goal of completing 200 interviews in all four neighborhoods. Because we had far more interviews in Evanston than in the other areas, the second sample purchase included cases in Cicero, Pilsen, and Skokie only. The number allocated to each of the neighborhoods was based on our best estimates of what would be necessary to obtain an equal number of interviews in all four neighborhoods. These cases were mailed out in two replicates—9 and 10—in late May and early June 2012.
After a four-month hiatus from data collection, the third sample purchase was made on November 19, 2012. Using neighborhoodspecific rates, we purchased sample such that we would complete at least 150 interviews in each neighborhood. We had already exceeded this number of completes in Evanston, so—as for the second sample purchase—we did not order any sample in Evanston. The 3,998 cases were distributed across Cicero, Pilsen, and Skokie as shown in Table 2.4 (replicates 11 and 12).
The initial mailing sent to respondents requested that they return
Table 2.4 Number of Cases, Initial Mailing Date, & Date Sample Was Ordered, by Geographic Area
2.7 If respondents had not traveled on the reference day, they were told to complete the travel diary on the next weekday that they did travel. If respondents had not completed the travel diary prior to the phone call, we asked what day they planned to complete the diary and scheduled an appointment for the day after that. If respondents had misplaced the study packet, SRL mailed additional materials to them with a new reference date.
a response letter. Those who returned the letter on or before March 26 and were eligible and willing to participate were sent a study packet on April 9, 2012 (see Table 2.5). The study packet included a randomly selected travel date (April 16–20 for this first set of respondents) on which the respondent was asked to complete the enclosed travel diary. The sample for the first set of respondents was set up for calling on April 17. The CASES system released the cases on a daily basis so that interviewers would call respondents on the appropriate day (i.e., the day following their reference date)7. At the outset of the study, we hoped to have the phone interviews completed within a five-day period. However, because some cases required more time and because the response to recruitment was lower than expected, we relaxed this rule in the hopes of obtaining as many completed interviews as possible. Data collection continued through July 20, 2012, took a four-month hiatus, and resumed on December 7, with the replicate 11 mailing (see Table 2.4). Data collection ended on February 4, 2013.
2.4.2 Interviewer Training
Interviewer training was scheduled for week of April 13, 2012,
Table 2.5 Cases Returned by Mail That Were Set up for Calling, by Mail Return, Study Packet Mailing, & Setup Dates
† These do not include people who returned a response letter during hiatus or after we ended data collection.
‡ Monday, January 21 was the Dr. Martin Luther King holiday, and was not included as a reference day.
* Three cases were not included in the study packet mailing because they were from Pilsen and we had already completed enough interviews in that neighborhood.
with 11 interviewers and four supervisors. Eight of the 11 interviewers were new hires. All of the newly hired interviewers had received general training on all SRL interviewing procedures prior to data collection. As with the pilot study, training included a general orientation to the design and purpose of the study, instructions on gaining cooperation of the household and the respondent, a question-by-question review of the survey instrument, and practice interviews. The main study training manual is included in Appendix 4.
After the four-month suspension of data collection, a second
interviewer training was conducted on January 14, 2013. All of the interviewers who attended this training had previous experience on this project, so it was more of a refresher course than an initial training. There was one notable change made to the survey instrument during this hiatus: the addition of an open-ended question in each choice experiment. The investigators wanted to record why the respondent selected the mode of transportation they chose, so this question was added in each of the six experiments.
2.4.3 Field Procedures
Many of the phone numbers that respondents provided were cell phones and work numbers. Therefore, there was a greater mix of daytime, evening, and weekend calling on this study than anticipated. We budgeted to make up to 20 contact attempts before finalizing a case as a noncontact and two attempts at refusal conversion.
A procedure was put in place to re-mail study packets to respondents who said they lost their packets when the interviewer called to conduct the telephone interview. The Field section ran weekly reports of these cases and sent them to Data Reduction to execute the re-mail process. The re-mail included a new travel date. Interviewers were scheduled to call the respondent for an interview the day after this new travel date.
Given the large number of cell phones in this sample, in May 2012, we added conditional text for cell phones to make sure the respondent was in a safe place before we began interviewing. We also confirmed that in the event of a dropped call, it would be okay to call back. We used recommended text from AAPOR for this language.
As data collection progressed, it became apparent that about one quarter of respondents provided travel information that did not work with the choice experiment section of the interview. In some of these cases, respondent travel did not involve any transportation other than walking. If a respondent’s destinations were all within walking distance of their starting location for the day, it was not possible to conduct the choice experiments because there were no feasible driving or transit options for their trip. In other cases, respondents did not travel anywhere that could be accessed by public transit; these situations also
made it impossible to create the hypothetical scenarios necessary to conduct the choice experiments. Interviewers were trained on how to instruct the programmed instrument to skip the choice experiment worksheet section in these cases.
2.4.4 Participation Rates
Table 2.6 shows the final disposition of sample. In this table, completed interviews are divided into four different codes that are separated by language and then by the number of interviews that contain choice experiment worksheet data and the number of interviews that do not contain these data. Again, Appendix 5 provides a description of disposition codes.
Table 2.7 shows the rates at each stage of the data collection process. The first four lines refer to the initial mailing, while those that
2.6 Final Disposition of Sample, Overall & by Neighborhood: Main Study
Table
Table 2.7 Final Sample Numbers & Rates, Overall & by Neighborhood
2.8 The American Association for Public Opinion Research. (2011). Standard definitions: Final dispositions of case codes and outcome rates for Surveys (7th ed.). AAPOR. p. 38
2.9 Standard Definitions notes that “response rates” should be calculated for studies that have probability samples. While the first stage of the sample for this study is a probability sample, the subsequent stages are not. AAPOR suggests calculating a participation rate for nonprobability Internet studies, and we have elected to do so here as well.
follow refer to cases that were set up for calling. Appendix 6 provides a description of these rates.
The participation rate is defined as “the number of responders who have provided a usable response divided by the total number of initial personal invitations requesting participation”.8,9 As shown in Table 2.5, the overall participation rate for this study was 3.8%; the participation rates varied by neighborhood from 2.0% in Cicero to 9.2% in Evanston. Response rates were not calculated for this study because the sample was not a probability sample at every stage—once an address was randomly selected, the respondent self-selected from an unknown number of potential eligible respondents who shared the same street address.
2.10 For this study, the data collection period for a particular case began on the reference date and lasted for five days. Because we had a difficult time obtaining the needed completes, during data collection we relaxed the restriction regarding completing the complete in five days on May 30, 2012. Moving forward, we called respondents to complete phone interviews until we exhausted the maximum number of call attempts (20).
2.4.5 Refusal Conversion and Quality Control
SRL makes a substantial effort to contact respondents during the data collection period.10 In a phone survey, interviewers contact a household up to 20 times before assigning a final disposition. If a respondent refuses to complete either a screener or an interview, interviewers continue calling up to the 20 attempts or until they get a second refusal or a complete interview, at which point the case is finalized. Our standard refusal conversion protocol is two conversion attempts with the standard wait period of seven days between refusals.
Throughout the study, all interviewers are monitored during at least 10% of the time spent interviewing. Monitoring consists of someone in a supervisory role watching a remote screen and listening in on the conversation of the interview. All interviewers are monitored within the first week of the study to enable us to catch problems early. If an interviewer is having difficulty, monitoring is increased or the interviewer is removed from the study.
2.4.6 Data Set Processing
The SRL Office of Survey Systems checked and cleaned the data to ensure that any illegal answers were caught and corrected. A preliminary data set with 549 cases was delivered to study investigators on August 17, 2012. A final data set was delivered on March 15, 2013.
No sample weighting was employed for this study.
2.5 Survey Limitations
This sample for this study was not drawn as a probability sample at all stages. The initial stage was sampled with known probability from a list of addresses; however, the selection of the respondent from the selected street address was not a probability-based sample (if a respondent returned the response letter and indicated he/she lived at the same street address but in a different unit, we allowed that respondent to remain in the sample). Consequently, the results of the study cannot used to make population inferences. With this overall limitation in mind, we can consider two specific sources of error:
coverage and measurement error. Each of these is briefly discussed.
2.5.1 Coverage Error
Coverage error can occur when members of the population of interest are not included in the sampling frame. When this omission is random and those included are no different from those who are excluded, coverage error is not a problem. When those who are omitted differ in ways related to the primary variables of interest, coverage error leads to bias. In this survey, the sample was drawn from the Delivery Sequence File constructed by the United States Post Office. Given the USPS uses this database for mail delivery, it is comprehensive and is updated regularly. Thus, coverage error is minimal. Only institutionalized and homeless people are omitted from the frame.
2.5.2 Measurement Error
In addition to coverage bias, numerous sources of measurement error may influence results. For example, question wording, the ordering of questions within the instrument, and the mode of data collection (i.e., telephone vs. face-to-face vs. self-administered surveys) each may affect data quality and should be considered when interpreting survey results. None of these forms of potential measurement error can be definitively eliminated. Following the pretest some changes were made to the instrument to minimize error associated with the design of the survey instrument. In addition, all instruments are reviewed by our Questionnaire Review Committee.
Overall the low response rates reported above mean that the makeup of the sample is largely determined by self-selection. We assume that people who choose to participate in a survey like this would tend to be more interested in transit, cycling, and pedestrianism than the general population. In this way, the study team interprets the sample as consistent with the mission of the study: estimate a bestcase scenario for community transit.
URBAN DESIGN METHODOLOGY 3
This chapter describes the methodology adopted in the development of the Streetscape Visualizations in the four Chicago neighborhoods under study.
The visualizations are one of the components included in the Research Transit Behavior Study, described in the previous Chapter 2. These visualizations develop a series of scenarios including potential improvements in the streetscape, and the implementation of new transportation amenities.
The selection of the different elements displayed in the visualizations is informed by existing literature about the influence of the built environment characteristics (streetscape design) in the transit, bike and walking experiences.
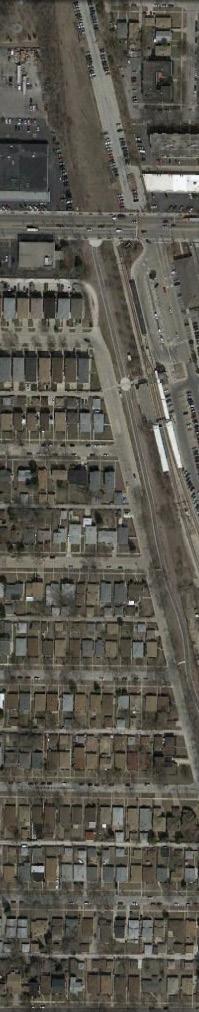
3.1. Urban fabric around CTA Damen, in Pilsen (right). The series of aerial images in this page (bellow) were used for the preliminary studies in street dimensions.
3.1 Asha Weinstein Agrawal, Marc Schlossberg & Katja Irvin (2008): How Far, by Which Route and Why? A Spatial Analysis of Pedestrian Preference, Journal of Urban Design, 13:1, 81-98
3.2 Gary Barnes, Kristin Thompson, Kevin Krizek (2005). A longitudinal analysis of the effect of bicycle facilities on commute mode share.
These urban design visualizations allow the residents to identify selected streets in their neighborhoods, and to speculate on the potential changes in their travel patterns under the improved scenarios. The technique is based on the development of realistic renderings to help respondents conceptualize the proposed changes in familiar urban scenes for them.
These urban design visualizations allow the residents to identify selected streets in their neighborhoods, and to speculate on the potential changes in their travel patterns under the improved scenarios. The technique is based on the development of realistic renderings to help respondents conceptualize the proposed changes in familiar urban scenes for them.
The following pages show the representation of the designed scenarios as included in the pre-test of the survey to the residents in the four selected areas.
These urban design visualizations allow the residents to identify selected streets in their neighborhoods, and to speculate on the potential changes in their travel patterns under the improved scenarios. The technique is based on the development of realistic renderings to help respondents conceptualize the proposed changes in familiar urban scenes for them.
In each one of the four selected neighborhoods, the team dened a focus area and developed two set of visualizations. The images are based on the street views collected in the initial site inventory, and they represent a series of “typical environments” easy to identify for the residents.
In each one of the four selected neighborhoods, the team dened a focus area and developed two set of visualizations. The images are based on the street views collected in the initial site inventory, and they represent a series of “typical environments” easy to identify for the residents.
The realistic three-dimensional visualizations depict the different levels of urban design improvements, and emphasize the enhanced conditions of both the roadways and the accompanying public spaces for transit users, pedestrians, and cyclists.
The set of images developed in each location includes:
The set of images developed in each location includes:
00 Current state.
The realistic three-dimensional visualizations depict the different levels of urban design improvements, and emphasize the enhanced conditions of both the roadways and the accompanying public spaces for transit users, pedestrians, and cyclists.
00 Current state.
A
Transportation improvements, Current level of users.
The set of images developed in each location includes:
B
3.1 Development of the Streetscape Scenarios
00 Current state.
Transportation improvements, Few more level of users.
A Transportation improvements, Current level of users. B
Transportation improvements, Few more level of users.
A Transportation improvements, Current level of users.
C
C
Transportation improvements, Much more level of users.
Transportation improvements, Much more level of users.
B Transportation improvements, Few more level of users.
D
D Transportation improvements, Landscape/urban furniture/kiosks, Current level of users.
C Transportation improvements, Much more level of users.
Transportation improvements, Landscape/urban furniture/kiosks, Current level of users.
E
E Transportation improvements Landscape/urban furniture/kiosks, Few more level of users.
Transportation improvements Landscape/urban furniture/kiosks, Few more level of users.
D Transportation improvements, Landscape/urban furniture/kiosks, Current level of users.
F Transportation improvements Landscape/urban furniture/kiosks, Much more level of users.
E Transportation improvements Landscape/urban furniture/kiosks, Few more level of users.
F Transportation improvements Landscape/urban furniture/kiosks, Much more level of users.
F Transportation improvements Landscape/urban furniture/kiosks, Much more level of users.
In addition to these realistic representation, the study will develop a series of technical representations of the existing and improved conditions in each area. The initial data collected in the initial inventory will be edited through a graphic computer aided design software application (AutoCAD) to produce a precise set of two-dimensional plans and sections of the pre-existing and proposed conditions. These prototypes of street designs will provide a measured representation of adequate dimension and treatment of each right of way, incorporating landscape and urban furniture elements to improve safety, orientation and visibility, climatic comfort, enjoyment, etc.
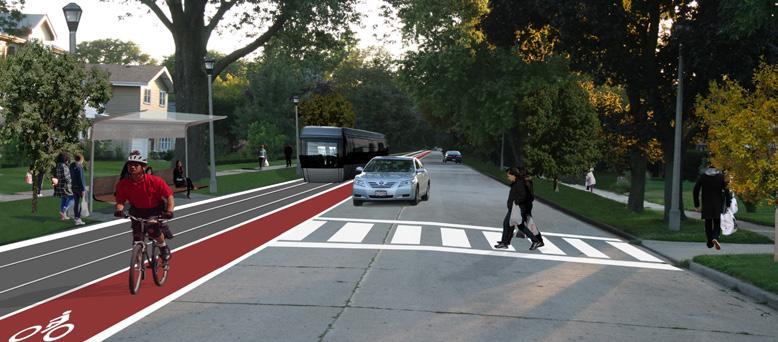
The survey was based in part on presenting respondents with “streetscape visualizations” to elicit their responses to proposed improvement in the transit, pedestrian, and cycling environments of their neighborhoods. These renders represent six different scenarios in two streetscapes in each of the four neighborhoods under study. This section describes the study’s approach to developing these visualizations. The selection of the different elements displayed in the streetscape visualizations is informed by existing literature about the influence of the built environment characteristics (streetscape design) in the transit, bike and walking experiences, as well as urban-design innovations evident in the Copenhagen case study (Appendix 1).
In addition to these realistic representation, the study will develop a series of technical representations of the existing and improved conditions in each area. The initial data collected in the initial inventory will be edited through a graphic computer aided design software application (AutoCAD) to produce a precise set of two-dimensional plans and sections of the pre-existing and proposed conditions. These prototypes of street designs will provide a measured representation of adequate dimension and treatment of each right of way, incorporating landscape and urban furniture elements to improve safety, orientation and visibility, climatic comfort, enjoyment, etc.
In addition to these realistic representation, the study will develop a series of technical representations of the existing and improved conditions in each area. The initial data collected in the initial inventory will be edited through a graphic computer aided design software application (AutoCAD) to produce a precise set of two-dimensional plans and sections of the pre-existing and proposed conditions. These prototypes of street designs will provide a measured representation of adequate dimension and treatment of each right of way, incorporating landscape and urban furniture elements to improve safety, orientation and visibility, climatic comfort, enjoyment, etc.
The visualizations incorporate elements that have a positive effect in multimodality, while targeting: (1) safety, both in the interactions with heavy traffic and crime related, (2) density of users walking, cycling, or commuting by transit, and (3) design of attractive, comfortable, and fully accessible streetscapes. This last factor includes: sidewalk quality (smooth and wide sidewalks), attractiveness of the route (presence of trees, landscape features, or buildings), the absence of long waits at traffic lights, traffic control devices to aid pedestrians crossing the street or the presence of heavy traffic, the presence of other people out walking, having shops or businesses to stop in or to look at, having benches or other places to sit, and having a friend or neighbor along the route.1 For bicyclists, the existence of bike lanes, bike signals, and bike racks in proximity to public transit are important factors;2 and for transit riders, the presence of shelters and safe access to the vehicles.
The visualizations focus on the inclusion of elements to serve
Detail Area Pilsen, Damen Station
Detail Area Skokie, Skokie Station
Detail Area Pilsen, Damen Station
Detail Area Cicero, Cermak Station. Image 02.
Detail Area Skokie, Skokie Station
Detail Area Pilsen, Damen Station
Detail Area Cicero, Cermak Station. Image 02.
Detail Area Skokie, Skokie Station
Detail Area Pilsen, Damen Station
Figure
Figure 3.3. Cicero, Cermak Station.
Figure 3.4. Skokie, Skokie Station.
Figure 3.2. Pilsen, Damen Station
3.3 Vikas Mehta (2009): Look Closely and You Will See, Listen Carefully and You Will Hear: Urban Design and Social Interaction on Streets, Journal of Urban Design, 14:1, 2964
3.4 Cervero, R. & Gorham, R. (1995) Commuting in transit versus automobile neighborhoods, Journal of the American Planning Association, 61(2), pp. 199–219.
3.5 Ibid. pp. 199–219.
movement more than stationary uses. For this reason, only a few elements known to increase social interaction in the public realm (seating, shade and shelter, information about uses – signs, public art, advertisement signs on the sidewalk, magazine and newspaper dispensing boxes, bicycle stands, trashcans, light poles, sign posts) have been selected.3 Similarly, the visualizations are not targeting changes in the diversity of land use, or the density of the built environment, two important indicators on walkability parameters.4, 5 This was determined principally by the purpose of the research project: assess impacts of improvements in the environment for non-automotive transportation while keeping land uses fundamentally constant.
The development of the visualizations has followed a fourstage process:
1. Visual inventory and mapping analysis of the existing conditions in the selected areas. This phase included a visit to and site documentation of the focus areas in each neighborhood through an extensive photographic inventory.
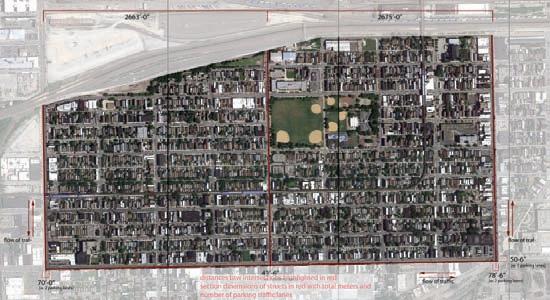
A 1.5-mile buffer around the four CTA selected stations defines the four neighborhoods in the Chicago metropolitan area. In each buffer, there is a focus area used to better delineate an area that could be easily covered by foot (1/4 to ½ mile buffer), which also designates the location of the residences targeted in the survey. The streetscape visualizations are located in this smaller sample area, and render two distinct street intersections that represent a series of “prototypical environments”. Their location in the close proximity of the CTA station ensures easy accessibility and exposure to commuters, and it increases the familiarity with the streetscape represented.
The initial inventory includes the mapping of the 1.5-mile buffer around the CTA station using GIS data facilitated by the city of Chicago and Cook County. This information provided more precise data about the public right of way (roadways, bike lanes, existing residential on-street parking), and information regarding land use and census data.
2. Design conceptualization and development of the streetscape scenarios.
Electricity box
Mailbox
Phone box
Trash bin
Newspaper box
Bench
Fire hydrant
Road sign
Street lamp
Parking meter
Bike racks
This phase included the selection of the eight streetscapes, two per neighborhood, and the conceptualization of the design improvements to be rendered in each site. A literature review about the impact of streetscape design on walking and cycling behavior guided the conceptualization of the images. A selection of elements widely recognized to have positive effects in people’s definition of desirable urban environments was included with two levels of intensity: a) transportation improvements only, and b) those improvements combined with landscape enhancements and the inclusion of other amenities. The proposed designs focus on the adequate dimension and treatment of each right of way, incorporating landscape and urban furniture elements to improve safety, orientation and visibility, climatic comfort, and the overall aesthetic qualities of the areas. The streetscapes include a generous tree canopy, and continuous planters to facilitate stormwater collection. Regarding bicycle facilities, the designs show, when possible, a solution that incorporates the right of way between the sidewalk and the parking lane. Finally, the images render a dedicated lane for the automated transit shuttle, and include transit stops, and bike racks in their proximity.
The density of pedestrians, bicyclists and transit riders was identified as other important component in the perception of a safe environment. That variable was developed independently
Figure 3.5. Existing condition Plan (right), section (above), in 54th/Cermak (Cicero).
with three different thresholds of intensity: current level of users, a few more, and many more users. The original images were taken on a Sunday morning, with low levels of users, in order to facilitate the transformations for more dense scenarios. Most of the images retain low levels of traffic, an important condition in the perception of safety for pedestrians, bicyclists and transit riders.
3. Representation of the designed scenarios in the survey to the residents.
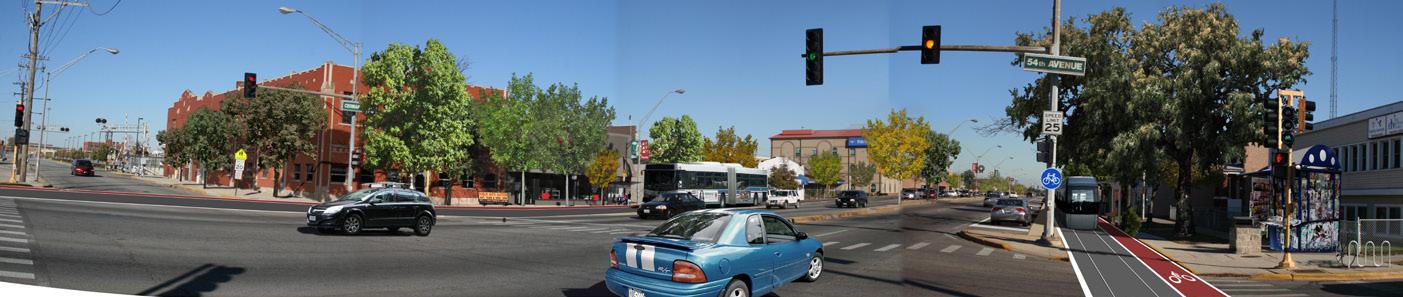
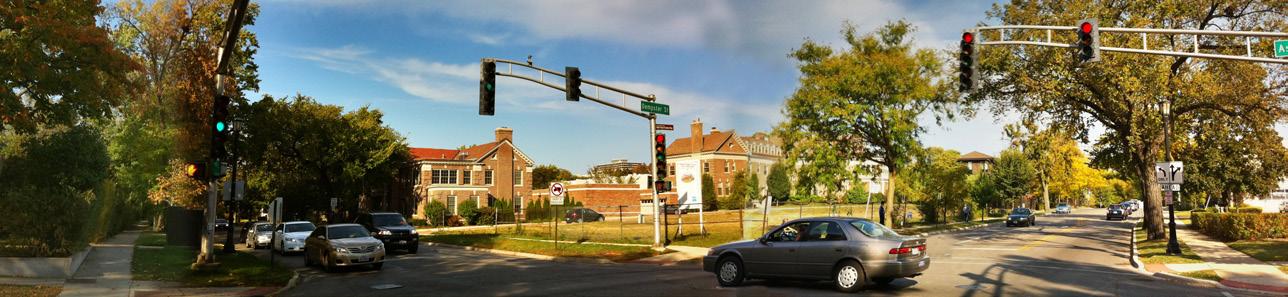
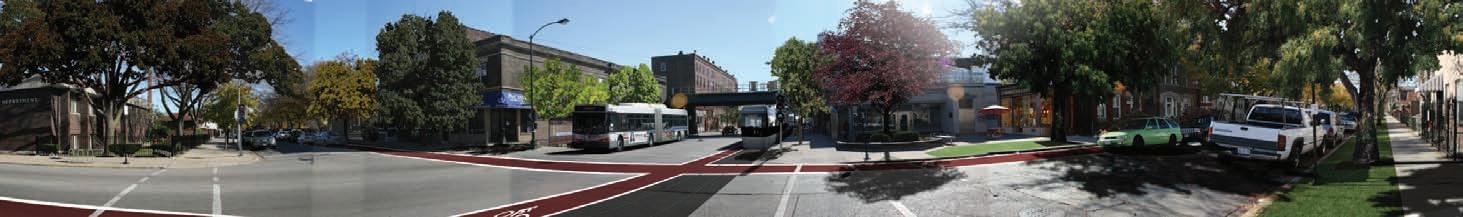
Each location is displayed in seven different conditions, using a photographic panorama taking on site as the current condition. The images aim to be realistic representations of feasible scenarios including different densities of users, and physical improvements:
00. Current state.
A. Transportation improvements, current level of users.
B. Transportation improvements, somewhat greater level of users.
C. Transportation improvements, much greater level of users.
D. Transportation improvements, landscape/urban furniture/ kiosks, current level of users.
E. Transportation improvements, landscape/urban furniture/ kiosks, somewhat greater level of users.
F. Transportation improvements, landscape/urban furniture/ kiosks, much greater level of users.
The inclusion of these images in the survey facilitates the visualization of the proposed improvements in the physical environment. The different scenarios capture the enhanced conditions of the roadways and the accompanying public spaces for transit users, pedestrians, and cyclists. This way, the residents can assess the impact of the different scenarios when they are questioned on their preferences regarding mode choice under those hypothetical conditions.
The technique used for these visualizations is a realistic collage over imagery taken on the site visits. The images were
Bike racks
Personal rapid transit
Bench
Fire hydrant
Road sign
Street lamp
Parking meter
Bike racks
developed in Photoshop, a software from the Creative Suite package for image treatment.
4. Additional set of graphic representations.
In each one of the eight streetscapes, the data collected in the initial inventory were edited through a graphic computer aided design software application (AutoCAD) to produce a precise set of two-dimensional plans and sections of the current condition, and the best-case scenario of improvements. The goal of this step is to assess the feasibility of the proposed transformations in the existing right of way. This is an important consideration, as the incorporation of a dedicated transit lane and bike lanes may require the elimination of on-street parking or alternative measures affecting the traffic lanes or the sidewalks. These were not included in the survey.
Figure 3.6. Proposed condition: 54th/Cermak (Cicero). Plan (right) and section (above).
Residential Land use
Mixed Land use
Institutional Land use
Industrial Land use
Commercial Land use
Utilities & Transportation
Space Land use
Figure 3.8. Location (above) and Land Use (right) of the 1.5-mile radius buffer around CTA Station Hoyne/Damen.
Figure 3.9. Existing transit options
Demographics
Families average 3.5-4 members Vehicles/Household: 0 - 1.0 close station 1 - 1.5 otherwise
Income family average 45.000 [NE subarea 65,000-75.000]
Lower car ownership
3.2 CTA Station Hoyne/Damen (Pilsen, Chicago)
Damen is one stop on the “Pink Line”, at 2010 S. Damen Av. The service frequency varies from 8 to 14 minutes. There is indoor bike parking available. The station offers connections with the CTA buses numbers 21 and 50.
The station serves the neighborhood of Pilsen, in the Lower West Side of Chicago. The area, traditionally occupied by Czech and other Slavic population, is home today to a significant Mexican community. The focus area developed the urban design scenarios in the proximity of the transit station. This avoided the industrial area on the south along the Sanitary Canal, and the development in the Northeast, close to the UIC Campus.
The site was selected to showcase transportation and transit related behavior in a mixed-use area and a low-middle income socioeconomic composition.
The 1.5 mile-radius buffer around the CTA Station includes the other 5 stations in the Pink Line, and one in the Blue Line. The
3.11 and 3.12.
density of stations may affect the choice of the selected station as the destination for the commuters in the selected area. In order to ensure the familiarity with the area for the survey respondents, the two locations selected for the visualizations are in close proximity to the station.
The two rendered streetscapes are:
Image 01. Intersection of W Cullerton St and S Damen Av.
Site Choice: Proximity to the CTA Station on the North side. The small plaza close to the station entry provides a valuable open space with capacity to accommodate an small kiosk.
Image 02. Intersection S Damen Av and W21st St
Site Choice: Proximity to the CTA Station on the South side. In both cases, the street right of way poses challenges for the incorporation of a bike lane and community transit vehicle without disturbing the on-street parking.
Figures
Aerial images zooming in the CTA Station (above) and S Damen Av and W21st St (bellow).
Figures 3.13 and 3.14. Series of images from the neighborhood around the CTA Station compiled during the site visit.
Figure 3.10. 1.5-mile radius buffer around CTA Station Hoyne/Damen (Google Earth).
Current State
CTA Station Hoyne / Damen (Pilsen, Chicago)
Transportation Improvements
Current level of users
Transportation Improvements
Few more level of users
Transportation Improvements
Much more level of users
Transportation Improvements
Amenities
Current level of users
Transportation Improvements
Amenities
Few more level of users
Transportation Improvements
Amenities
Much more level of users
Site 1: Intersection of W Cullerton St and S Damen Av.
Figures 3.15 to 3.21. Scenarios for Site 1 at CTA Station Damen
Current State
CTA Station Hoyne / Damen (Pilsen, Chicago)
Transportation Improvem.
Current level of users
Transportation Improvem.
Few more level of users
Transportation Improvem.
Much more level of users
Transportation Improvem.
Current level of users
Transportation Improvem.
Amenities
Few more level of users
Transportation Improvem.
Amenities
Much more level of users
Improvements
Site 2: Intersection of S Damen Av. and W21st St.
Figures 3.22 to 3.28. Scenarios for Site 2 at CTA Station Damen
Residential Land use
Mixed Land use
Institutional Land use
Industrial Land use
Commercial Land use
Utilities & Transportation
Space Land use
Figure 3.29. Location (above) and Land Use (right) of the 1.5-mile radius buffer around CTA Station 54th th/Cermak.
Figure 3.30. Existing transit options
Demographics
Families average 3.5-4 members
Vehicles/Household: 2– 2.5
Income family average
[close station 45,000-55.000]
[towards E > 75.000]
[towards W < 45,000]
3.3 CTA Station 54th/Cermak (Cicero)
This stop is the last stop stops in the “Pink Line”, at 2134 S. 54th Av., Cicero. It is at grade level. The service frequency varies from 8 to 14 minutes. There is indoor bike parking available, and park & ride. The station offers connections with the CTA buses numbers 21 and N60, and the Pace System 322, 304 and 305.
The station serves Cicero, a town with a large Mexican and Latino population. Unity Jr. High School, one of the largest schools in the country is located immediately north of the station. The car oriented design of 22nd Av., the main East-West arterial, establishes a clear discontinuity between the residential neighborhoods North and South of the line. The focus area avoids the industrial areas, and the western neighborhoods with higher income.
The site was selected to showcase transportation and transit related behavior in an area with predominantly residential land use and a low-middle income socioeconomic composition. The 1.5 mileradius buffer around the CTA Station includes the other 3 stations, two in the Pink Line, and one in the Blue Line.
In terms of land use, the selected station, and the area of focus are dominantly residential in comparison with the more commercial or industrial surroundings in the other stations.
The two rendered streetscapes are:
Image 01. Intersection of S 54th Av and W Cermak Road.
Site Choice: Proximity to the CTA Station, and one of the main collector in the area running E_W.
The street section has the necessary right of way to implement additional bike lanes and a dedicated lane for a transit vehicle.
Image 02. Intersection S 54th Av and W22nd Pl.
Site Choice: Generic residential street in the neighborhood. The school serves as a district landmark, increasing the familiarity of the residents with this area.
The street right of way of 28’ is a challenge for the incorporation of bike lanes without disturbing the on-street parking.
Figures 3.32 and 3.33. Aerial images zooming in the CTA Station (above) and S 54th Av and W22nd Pl (bellow).
Figures 3.34 and 3.35. Series of images from the neighborhood around the CTA Station compiled during the site visit.
Figure 3.31. 1.5-mile radius buffer around CTA Station 54th/Cermak (Google Earth).
CTA Station 54 th / Cermak (Cicero)
Current State
Transportation Improvements
Current level of users
Transportation Improvements
Few more level of users
Transportation Improvements
Much more level of users
Transportation Improvements
Amenities
Current level of users
Transportation Improvements
Amenities
Few more level of users
Transportation Improvements
Amenities
Much more level of users
Site 1: Intersection of S 54th Av. and W Cernak Road.
CTA Station 54 th / Cermak (Cicero)
Current State
of
Transportation Improvements
Current level of users
Transportation Improvements
Few more level of users
Transportation Improvements
Much more level of users
Transportation Improvements
Amenities
Current level of users
Transportation Improvements
Amenities
Few more level of users
Transportation Improvements
Amenities
Much more level of users
Residential Land use
Mixed Land use
Institutional Land use
Industrial Land use
Commercial Land use
& Transportation
Space Land use
3.4 CTA Station Davis (Evanston)
Figure 3.51. Existing transit options
Demographics
Families average 3-3.5 members Vehicles/Household 1.0 – 2.0
Higher use of bike
Davis is a stop on the “Purple Line”, at 1612 Benson Avenue, in downtown Evanston. The service frequency varies from 7 to 14 minutes. Davis is one of the four test sites for the Active Transit Station Signs (ATSS) program. The ATSS signs provide real-time transit and traffic information on a demonstration basis. They display a countdown of the minutes until the next departing train, travel times to destination, fare information, service disruption or delay messages or any message the CTA chooses to program into the signs.
The Davis Street Stop of the Metra System in the Union Pacific/ North Line is located in the close proximity of the “L” station. The station offers connections with the CTA buses numbers 93, 201, N201, and 205, and the Pace System 208, 213 and 250.
The focus area covers both low dense residential areas towards the south, and the more mixed use and high density downtown surrounding the station. The site was selected to showcase transportation and transit related behavior in a mixed-use area, and a middle-high income socioeconomic composition.
Figure 3.50. Location (above) and Land Use (right) of the 1.5-mile radius buffer around CTA Station Davis.
Figures 3.53 and 3.54. Aerial images zooming in the CTA Station (above) and Lake St and Oak Ave (bellow).
Figures 3.55 and 3.56. Series of images from the neighborhood around the CTA Station compiled during the site visit.
The 1.5 mile-radius buffer around the CTA Station includes other 6 stations in the same CTA line, but this is the only one with a Metra stop [line Union Pacific/North Line-UP-N]. The density of stations may affect the choice of the selected station as the destination for the commuters in the selected area. In order to ensure the familiarity with the area for the survey respondents, the two locations selected for the visualizations focus on an area with higher density [Image 1], and a residential area in the proximity of an institutional anchor [Image 2].
The two rendered streetscapes are:
Image 01. Intersection of Chicago Av and Church St.
Site Choice: Proximity to the CTA Station on the Northeast side. Chicago Av provides some extra right of way to imagine the potential implementation on a dedicated transit lane.
Image 02. Intersection Ashbury Av and Dempster St
Site Choice: Prototypical residential area, in the proximity of an institutional building to ensure the exposure of the site to a larger number of residents.
The modification of the right of way is compromised by left turn lanes; no on-street parking is available.
Figure 3.52. 1.5-mile radius buffer around CTA Station Davis (Google Earth).
CTA Station Davis (Evanston)
Current State
Transportation Improvements
Current level of users
Transportation Improvements
Few more level of users
Transportation Improvements
Much more level of users
Transportation Improvements
Amenities
Current level of users
Transportation Improvements
Amenities
Few more level of users
Transportation Improvements
Amenities
Much more level of users
Figures 3.57 to 3.63. Scenarios for Site 1 at CTA Station Davis
Site 1: Intersection of S Chicago Av. and Church St.
* Improvements
CTA Station Davis (Evanston)
Current State
Transportation Improvements
Current level of users
Transportation Improvements
Few more level of users
Transportation Improvements
Much more level of users
Transportation Improvements
Amenities
Current level of users
Transportation Improvements
Amenities
Few more level of users
Transportation Improvements
Amenities
Much more level of users
Figures 3.64 to 3.70. Scenarios for Site 2 at CTA Station Davis
Site 2: Intersection of Dempster St and Ashbury Av.
Residential Land use
Mixed Land use
Institutional Land use
Industrial Land use
Commercial Land use
Utilities & Transportation
Space Land use
3.5 CTA Station Skokie (Skokie and Morton Grove)Grove)
Demographics
Higher car dependence
Skokie is one of the two stops on the “Yellow Line”, at 5005 W. Dempster Street. It is at grade level. The service operates every 15 minutes from 6.30 am to 11.15 pm during the weekends, and daily from 5 am to 11.15 pm with varied frequency between 15 to 10 minutes. There is indoor bike parking available, and park & ride. The station offers connections with the CTA buses numbers 54A and 97, and the Pace System 250 and 626. It is also the Greyhound bus Skokie Terminal.
The station serves the Villages of Skokie and Morton Grove: both rank highly in suburban living quality. I-95, runing N_S, breaks the continuity of the urban fabric, and compromises the security of the connections for pedestrians and cyclists. The two focus areas include low density residential neighborhoods northwest and southwest of the transit station, and explore opportunities to transform the nature of Dempster Avenue, the main collector running E_W.
The site was selected to showcase transportation and transit related behavior in an area with predominantly residential land use, and a middle-high income socioeconomic composition.
Figure 3.71. Location (above) and Land Use (right) of the 1.5-mile radius buffer around CTA Skokie.
Figure 3.72. Existing transit options
Figures 3.74 and 3.75. Aerial images zooming in the CTA Station (above) and Crain St, from Terminal Av (bellow).
The 1.5 mile-radius buffer around the CTA Station does not include other stations. The suburban condition of both subareas, and the lack of transit options is characterized by the high rate of car dependency by the residents.
Figures 3.76 and 3.77. Series of images from the neighborhood around the CTA Station compiled during the site visit.
The two rendered streetscapes are:
Image 01. Crain St.
Site Choice: Generic residential street in the proximity to the CTA Station, on the other side of the tracks.
The street right of way challenges the incorporation of bike lane and community transit vehicle without disturbing the onstreet parking.
Image 02. Suffield Ct.
Site Choice: Generic residential street in the neighborhood of Morton Grove.
The street section has the necessary right of way to implement additional bike lanes and a dedicated lane for a transit vehicle.
Figure 3.73. 1.5-mile radius buffer around CTA Station Skokie (Google Earth).
Current State
Transportation Improvements
Current level of users
Transportation Improvements
Few more level of users
CTA Station Skokie (Skokie)
Figures 3.78 to 3.84. Scenarios for Site 1 at CTA Station Skokie
Transportation Improvements
Much more level of users
Transportation Improvements
Amenities
Current level of users
Transportation Improvements
Amenities
Few more level of users
Transportation Improvements
Amenities
Much more level of users * Improvements
Site 1: Crain St.
Current State
Transportation Improvements
Current level of users
CTA Station Skokie (Morton Groove)
Transportation Improvements
Few more level of users
Transportation Improvements
Much more level of users
Transportation Improvements
Amenities
Current level of users
Transportation Improvements
Amenities
Few more level of users
Transportation Improvements
Amenities
Much more level of users
* Improvements Figures 3.85 to 3.91. Scenarios for Site 2 at CTA Station Skokie
* Improvements
Site 2: Suffield Ct.
PERCEPTION OF ALTERNATIVES 4
The neighborhoods were selected to represent two broad conditions of land use and two broad conditions of household income (Table 4.1). Table 4.2 describes selected land-use and transportation characteristics associated with the neighborhoods. Skokie respondents were dominantly residents of single family homes, while singlefamily residents were between 21 and 35 percent in the other neighborhoods. Cicero, which was chosen for its lower density and greater auto orientation than Pilsen, was nonetheless lower on the single-family home metric than Evanston (which was chosen for its more urban character). Parking availability went along with single family development patterns: majorities in Skokie had at least two offstreet parking spots, while majorities in Evanston and Pilsen had one or fewer. Cicero’s parking availability was between these two extremes. Home ownership was high in Skokie, moderate in Evanston, and low (under 40%) in both Pilsen and Cicero.
Current mode shares by neighborhood are noted in Table 6.2. The majority of respondents in all neighborhoods had access to a working bicycle: somewhat surprisingly, this number reached its high in Pilsen rather than in college-oriented Evanston.
Evanston was the most highly educated locale, with over 80 percent of its residents having completed college (Table 4.3). The parallel number for Cicero was under 18 percent. Cicero had the lowest income of the study neighborhoods, with a majority of households earning less than $30,000 annually. Latino respondents constituted majorities in both Cicero and Pilsen; African American respondents were most likely to live in Cicero.
Please think of driving or riding in a car, including parking if necessary.
Q65. Driving a car for this trip is quick.
Q66. Driving a car for this trip is safe.
Q67. Driving a car for this trip is convenient.
Q68. Driving a car for this trip is worth it even if it costs more.
Q69. People like me often drive for [TRIP PURPOSE] trips.
Q70. Overall, driving a car is a good option for this trip.
The survey contained three principal sets of outcome measures: the trip diary for the respondents’ revealed travel behavior; the stated preference experiments to elicit mode-choice behavior under varying conditions of transportation and urban-design improvements; and perceptions regarding the status quo and its potential improvement. This section considers the third outcome. Its basis was a set of questions as follows:
Please think of using public transportation, including getting to the bus or the train.
Q71. Using public transportation for this trip is quick.
Q72. Using public transportation for this trip is safe.
Q73. Using public transportation for this trip is convenient.
Q74. Public transit is a low-cost option for this trip.
Q75. People like me often use public transportation for [TRIP PURPOSE] trips.
Q76. Overall, public transit is a good option for this trip.
Please think of cycling to your destination.
Q77. Cycling for this trip is quick.
Q78. Cycling for this trip is safe.
Q79. Cycling for this trip is convenient.
Q80. The low cost of cycling is an important benefit for me.
Q81. Cycling for this trip provides me with important benefits like exercise or fresh air.
Q82. People like me often cycle for [TRIP PURPOSE] trips.
Q83. Overall, cycling is a good option for this trip.
Walking was not included as a separate mode because the intention was to gauge perceptions regarding travel to destinations outside the neighborhood. Walking is implicit, however, in the responses regarding public transportation, since much transit access is pedestrian.
4.1 Results Overall and by Neighborhood
Respondents were asked to give their perceptions regarding the status quo (Figure 4.1) and those regarding the full deployment of pedestrian, transit, and cycling improvements. This full deployment (Figure 4.2) image depicted improvements including a community transit vehicle and station, bike lane, considerably higher pedestrian use, pedestrian crossings, a vegetation buffer between pedestrians and traffic, urban furniture, shade trees, and a bike lane and signals.
4.1 Neighborhood Selection Scheme
4.2 Selected Land-Use and Transportation Characteristics of Respondents by Neighborhood
Total Respondents
Table
Table
Table 4.3 Selected Sociodemographic Characteristics of Respondents by Neighborhood
Respondents
Cicero Pilsen
Evanston Skokie
The increase in respondents’ evaluation of the transit and cycling environment was greater than their decreased assessment of driving in the under the full-deployment case (Table 4.4). Respondents agreeing that public transit or cycling was a good option for the trip went up by 11 and 18 percentage points respectively; by contrast the positive assessment of driving in the new environment declined by just over 1 percentage point. The slight decline of the desirability of driving may be a function of the increased quality of the alternative options, greater completion for space with pedestrians, cyclists, and transit users, or both. The largest improvements were in perceptions of cycling safety and public transit speed, both reasonable given the visible improvements of the addition of community transit and a bike lane. These together with perceived improvements in the convenience of transit and cycling and the cost of transit, help explain results in the stated preference experiments suggesting significant gains in these modes with the transit and urban-design improvements.
Figure 4.1: Evanston base case
Figure 4.2: Evanston full deployment
Table 4.4 Respondent Perceptions of Base Case and Full-Deployment Case for their Neighborhoods
These results can be better understood with a neighborhoodby-neighborhood analysis. Table 4.5 breaks down the results above by the four neighborhoods, presenting respondents evaluation of the status quo scenario and the change in perceptions associated with the full deployment. Several themes emerge from this table. First, people’s perception of current transportation options in their neighborhoods aligns with the logic of neighborhood selection, with lower income and more urban living associating with more favorable perceptions of alternatives to the car. In the denser Pilsen and Evanston fewer than half of respondents view driving as a good option for the trip under consideration; this rises to over half for the more suburban areas of Cicero and Skokie. By contrast, transit was a seen as a good option by strong majorities in both Cicero and Pilsen, in part a function of the lower incomes in these regions. Cycling was viewed as a good option
Table 4.5 Perceptions of Base Case and Change with Full Deployment by Neighborhood
by around one-third of residents of Evanston (higher income, higherdensity), Pilsen (lower-income, lower-density) and Cicero (lowerincome, lower density). Residents of suburban Skokie, with neither the lower-income population nor the physical form conducive to cycling, evaluated it much less highly than the other three neighborhoods.
Cycling was viewed as quite unsafe currently, with only about one quarter of respondents perceiving it as safe. This stood in contrast with driving or transit, which were uniformly perceived as safe across
Table 4.6 Respondents by Commute Location
the neighborhoods, with at least 75% in each neighborhood rating these modes as safe. Yet the perceived danger associated with cycling was in large part a function of the lack of cycling facilities currently; addition of these facilities led to jumps of at least 20 percentage points in all neighborhoods, and nearly 35 points in Evanston.
Neighborhoods that give a lower evaluation to the status quo seem to have greater latitude to respond more markedly to improvements. For example, under current circumstances, public transit is seen as a good option for the trips studied for under 40% of the residents of affluent and suburban Skokie; for the lower-income neighborhoods of Pilsen and Cicero, the number is over 70%. But the response to the full-deployment scenario was much greater in Skokie, with over a 25 percentage-point increase.
4.2 Results by Commuter Characteristics
Commuters to Chicago’s Loop differ markedly in their transportation preferences from other commuters (the former group forming the majority in the sample - Table 4.6). They consider driving to be a good option for their trips at about half the rate of other commuters, and value transit more highly, with 85% of them indicating that public transit is a good option for their trips under the base case (Table 4.7). As a consequence of this high current valuation of transit, there seems to be little potential for growth, even under the full set of alternative designs and policy options. By contrast, public transit’s positive evaluation increases nearly 14% among the majority of travelers who are not currently Loop commuters. Loop commuters are less likely than other travelers to see cycling as a good option for their trip than others under the base case, which is probably in part a function of the difficult environment that the Loop poses for cycling.
Table 4.7 Respondent Perceptions of Base Case and Full-Deployment Case by Age and Work Location
Yet Loop commuters perceive improvements in cycling similarly to non-Loop commuters; in fact the impact on perceived safety of the full set of improvements was greater among the Loop commuters, with an over 30 percentage point increase in the number of respondents viewing cycling as safe and convenient. Overall significant increases in respondents’ evaluation of the cycling option were registered, with around 18 percentage point increases for Loop- and non-Loop commuters. Nonetheless, cycling challenges for Loop commuting remain, and the bike is seen as a good option by fewer Loop than nonLoop commuters even after all improvements have been taken into account.
Table 4.8 Respondent Perceptions of Base Case and Full-Deployment Case by Income and Gender
for this trip provides me with important benefits like exercise or fresh air
Marked differences were observed between younger and older respondents (Table 4.7). Respondents up to age 35 viewed the car as a good option for their trip at a much lower rate than their older counterparts (58% to 40% in the base case). Their evaluation of transportation alternatives was considerably higher in the base case than that of older respondents. They perceived improvements in cycling safety in much greater numbers than older respondents: the improvements depicted increased their assessment of cycling as a safe option by over 40 percentage points, compared to 25 for older
respondents.
Differences between lower- and higher-income commuters were in the expected direction: lower income commuters evaluated transit and cycling more highly in the base case (Table 4.8). Overall the two groups registered similar responses to the changes depicted.
The genders split primarily on cycling safety (Table 4.8), with women perceiving the bike as a less safe option then men. Yet women responded to improvement to the cycling environment markedly: the number of women perceiving cycling as safe increased nearly 35 percentage points with the full deployment, as opposed to as 23 percentage point improvement among the men.
Results here are designed to complement the results of the stated preference experiment by highlighting people’s perceptions of the modal changes. Overall, the urban design and transportation improvements were evaluated highly, with large increases in the numbers evaluating transit or cycling positively. The largest gains tended to be in categories of current deficiency, such as cycling safety or transit in auto-oriented areas. Marked response to cycling improvements in particular suggest considerable growth potential for this mode with urban environmental enhancements.
ACTIVITY-BASED MODELING
5.1 Summary of the Stated Preference Results
The purpose of the research—testing the impact of far-reaching improvements in the walking, cycling, and transit environments on people’s mode choice—implied an investigation among options that do not yet exist. In this context, revealed preference methods—by which people’s valuation of transportation attributes are inferred from their actual choices—are not up to the task. For this reason, survey respondents were subjected to a stated-preference experiment designed to elicit their preferences for currently hypothetical transportation options. In the stated preference (SP) part of the survey respondents were asked to indicate, for six hypothetical scenarios, the mode they would have chosen for their trip under these scenarios. The options were conveyed by a combination of graphical representations of the urban environment and quantitative descriptions of the attributes of hypothetical trips.
The SP portion of the research was used to estimate an activitybased model of mode choice. Utilities from this model were then used to revise initial parameters used in the agent-based model. In this way, the empirical estimation of the activity-based model was combined with the capacity of the agent- based model to simulate the evolution of the system over time.
Five modes were available to choose from in the SP experiment:
• Drive
• Community transit to CTA
• Walk to CTA
• Cycle to CTA
• Cycle all the way
The six scenarios presented various attributes of the different travel options including:
• Community transit travel time to the CTA station
• Community transit headway
• Driving time to the destination
• Parking cost at the destination
While these variables were randomly changed among the six
scenarios, two variables that are represented by the images were consistently linked to a specific scenario. Each scenario was described by a worksheet (Appendix 2) , as described in Table 5.1.
Some variables varied according to the residential location of the respondent but did not vary among the six scenarios. These residential-location-specific variable included:
• Walk time to the CTA station
• Cycle time to the CTA station
• Cycle time to destination
• CTA travel time from station to station
• CTA headway
The following presentation of the results of the SP questions first examines at overall aggregate results and then breaks them down by neighborhood and by the worksheet representing presence of people and urban amenities.
Image 5.0 Example of Worksheets #1 and #6
Table 5.1 Distribution of Scenarios
5.2 Choice by the Actual Mode of the Tour
Respondents indicated their current choice of mode for their main tour of the day. The main modes were defined as auto driver, auto passenger, bus, train, walk, and cycle. In cases where a variety of modes were used in the tour, the main mode of the tour was defined as train in case a train was used in any of the segments of the tour. If a train was not used and a bus was used, the main mode of the tour was defined as bus. If no public transport was used and a bike was used, the main mode of the tour was defined as bike, and subsequently auto driver, auto passenger and walk. These actual choices were compared against their stated preference for the main mode of the tour. Differences between actual and stated are analyzed here as an indicator of the contemplated improvements in the transit, pedestrian, and cycling environments to shift mode choice.
Figure 5.1 shows for each main mode (the different columns) of the tour the percentages of the SP mode chosen as well as the SP share for all respondents. Table 5.2 provides the detailed data for this figure. As can be seen in the figure and table, only 52% of the drivers and 42% of the car passengers chose to drive in the SP choice experiments overall. This represents a fairly dramatic reduction in auto use under the modeled improvements. However, it is important to understand that stated preference are likely to include various type of response biases, so part of these results may reflect choice bias under which respondents seek to provide the “right” answer; some respondents may even answer strategically to provide evidence that transit investments are worthwhile. However, there may be some other types of bias with opposite direction. In the next remainder of this section, we try to explain the bias and anomalies results and to estimate the scale of the bias. While we can’t estimate the bias exactly we believe the following paragraphs provides a good estimate of the extent of this bias and use these estimates in our final forecasts of the impacts of the transit and urban design improvements.
Overall 37% of the drivers and 43% of the auto passengers chose CTA in the SP experiments, and additional 11% of the drivers and 16% of the auto passengers chose to cycle all the way in the SP experiments. Those who walk or cycled all the way mostly chose to
5.1: SP mode choice (percentage) by revealed preference main mode of the tour (RP), all worksheets
Bike-train
Walk-train
Shuttle-train
Drive
Table 5.2 Stated-Preference by Current Mode (percent, all Worksheets all Neighborhoods)
Main Mode for Current Travel
Mode in Stated-Preference Experiments
cycle in the SP, as walking was not provided as an option, and bus users mostly chose CTA. Interestingly, some people who currently use public transportation or non-motorized modes chose to drive in the SP, but these figures are much smaller than drivers who chose transit. Seventeen percent of current bus users chose to drive in the stated preference experiment. This result was paradoxical since the SP experiment represented significant improvement in the transit environment. It was assumed in the experiment that CTA rail travel would offer the highest level of transit service, and for this reason, an exclusive bus to one’s destination was not offered as an option. It may be, however, that for a number of travelers and destinations, “bus all
Figure
Figure 5.2: Comparison of RP and SP choices (percentages)
RP for All Neighborhoods SP Average for All Worksheets and Neighborhoods Revealed Preference
the way” would offer the best level of service. Some current bus users may have indicated a preference for driving as a consequence of the lack of this mode in the SP experiments.
Somewhat more perplexing, 11% of train users, 13% of current pedestrians, and 4% of cyclists chose to drive in the SP experiment. These results clearly show another type of bias actually indicating the SP results may bias driving share upward. It may be that these people would prefer driving currently but are not able to for financial or other constraints. The hypothetical nature of the SP world allows them to choose their preferred mode without regard to these constraints.
Despite these anomalies, these results suggest that the community transit service providing quick and frequent service to collect passengers from near their home to the CTA station has the potential to switch significant numbers of travelers from car to public transport. To emphasize the potential contribution of the community transit service to attract transit users, Figure 5.2 compares the overall actual mode share with the SP mode share. Overall while 36% indicate auto use in the travel diary (32.5% as auto drivers and 3.5 as auto passenger), auto use in the SP choice was only 26%. Public transport use in the travel diary was 58% (50% train and 8% bus) while CTA choice in she SP was
Table 5.3 Procedure for Estimating and Correcting for Bias (Percent of all Travelers)
62%. In 27% of the choice experiments respondents chose the new community transit service to get to CTA, 29% chose to walk to CTA, and 6% chose to cycle to CTA. This represents a significant increase in CTA use by introducing the community transit and urban environment improvement. It should be noted that we may have overlooked some transit users in the SP experiment by not offering the bus service. This indicates that when planning new service care should be taken not to omit service which is not well covered by the new service. Finally, 6% use non-motorized travel in the travel diary (4% cycle and 2% walk), while in the SP 12% chose to bike all the way.
5.3 Analysis of and Correction for Bias
In order to get an estimate of the magnitude of the bias in the stated-preference experiments, and thus to provide a good estimate of the impact of the community transit, we applied the following procedure. We used the agent-based model version that applies the stated preference model parameters to estimate the shares of the different modes under current conditions, i.e., no community transit and no improvements in urban amenities, and compared these estimates with the revealed preference choices. These estimates present the bias in the SP survey and model. We added the bias to the estimates
obtained by the SP model to provide our best estimate of the impact of the community transit services and urban amenities improvements on mode choice. Table 5.3 shows this procedure, the bias estimate, and the community transit and drive mode shares corrected for the bias for each neighborhood separately.
The first row in this table shows the RP share of each mode in each neighborhood. The second row shows the estimated mode share under current conditions using the agent-based model applying the activity-based SP model coefficients. So, for example while in Pilsen the RP driving share is 24.9%, the model only estimates it as 22.6%. The difference of -2.3% is the bias estimate shown in the third row. The negative bias indicates that the model underestimates the drive mode, a product of the sources of biases discussed above. This bias of -2.3% is then added to the drive share estimate obtained from the model applied to the scenarios with community transit and urban amenities (Row 4). Given no significant differences in the level of urban amenities on the SP results, we took the average figure of 14.7%. The results (16.9% shown in Row 5) provides a good estimate of the share of the drive mode in the improved scenario corrected for bias. As can be seen adjusting for bias, the community transit managed to decrease the drive share by 7.9% (Row 6), while if we would not have corrected for bias we would have assumed a 10.2% reduction from stated preferences (Rows 7 and 8). The other columns in this table provide the same analysis for the drive and CTA for all four neighborhoods. The differences between these two, is exactly the bias we estimated. As can be seen, the bias can be either negative or positive because of the different and opposite direction of the potential biases discussed above. As can be seen from Table 5.3 large biases were observed in Skokie, showing that the SP model overestimated driving and underestimated CTA in this neighborhood. In all other cases, the bias was relatively small (up to 3.7%) with the exception of Pilsen where it underestimated CTA by 6.8%. Trying to explain the larger bias in Skokie, we could not find a specific reason, but as bias can result from various factors, it may simply be arbitrary.
If we look at the results overall all neighborhoods (the right most two columns) we see that overall the model slightly biased the drive mode upward by 3% and CTA downward by 5%. After adjusting for bias our best estimate is that the community transit will decrease car share from its current 36% to 22% and increase CTA share from its
current 50% to 67%.
The next sections break these results down by neighborhood and urban environmental characteristics. Results by neighborhood are presented first, followed by the impact of the two variables with special interest to this study: land use amenities and the presence of people in the street on switching from car to public transport and nonmotorized modes.
5.4 Mode Choice by Neighborhood
Figure 5.3 shows the SP mode choice by neighborhood with the supported data shown in Table 5.4. The results show that under the contemplated changes CTA attracts more passengers in the lowincome neighborhoods (74% in Cicero and 66% in Pilsen) than in the high-income neighborhoods (56% in Evanston and 52% in Skokie). The neighborhood density has some effect as well; transit was selected more frequently in the more urban Evanston than the more suburban Skokie. This effect was not observed, however, in the two lowerincome neighborhoods, with the lower-density Cicero outperforming the higher-density Pilsen in stated-preference for transit. On the other hand, the “cycle all the way” mode did attract mostly passengers
Cicero
Pilsen Evanston Skokie
Figure 5.3: Stated preference mode by neighborhood
Table 5.4 Stated Preference Mode by Neighborhood
Table 5.5 SP Choice (Percentage) by the Tour Main Mode in Cicero
Table 5.6 SP Choice (Percentage) by the Tour Main Mode in Pilsen
Table 5.7 SP Choice (Percentage) by the Tour Main Mode in Evanston
Table 5.8 SP Choice (Percentage) by the Tour Main Mode in Skokie
from both high-density neighborhoods unrelated to income (18% in Evanston and 17% to Pilsen compared to 7% in Cicero and 5% in Skokie).
Tables 5.5 to 5.8 show for each neighborhood and for each current main mode the percentage of each SP mode choice. Overall, in Cicero 63% of the current drivers and 72% of auto passengers chose non-auto modes (CTA and cycle all the way). In Pilsen 54% of the drivers and 67% of the car passengers chose non-auto modes. In Evanston 55% of the drivers chose non-auto modes, but interestingly only 8% of the car passengers chose non-auto modes, while the other 92% chose to drive. This may indicate that those passengers are choice carpoolers, i.e., they do have an option to drive or will make it available if they will not be able to carpool. Finally, in Skokie 34% of the drivers and 42% of the car passengers chose non-auto modes. The most interesting results are regarding drivers who shift to CTA and bikes. The highest shift of drivers was obtained in Cicero, interestingly even more than in Pilsen with similar low-income level but with higher density. It may be that in the lower-density areas the community transit has more potential to help, where in higher-densities there is already some better level of public transport service. However, in the high-income areas, more drivers shifted in denser Evanston than in Skokie. This indicates that these improvements may be most effective in low-income low-density areas.
5.5 Mode Choice by Worksheet
One of the main purposes of the research was to assess the extent to which improvement in urban amenities and presence of the people in the urban space affect mode choice. As mentioned above
this was presented by the different figures that accompanied the different worksheets.
Figure 5.4 shows the mode share chosen in the SP experiment for each of the worksheets alongside the actual choice. As can be seen, the differences in mode choice by worksheet are not significant, either practically or statistically. Trying to analyze the effect of urban amenities and presence of people in the urban environment separately also showed no significant different in mode choice by these two variables. Thus while individuals studied responded markedly to the transportation and urban design improvements overall (by indicating significant modal shifts), they seemed uninterested in (or perhaps did not perceive) the finer-grained distinctions between levels of pedestrian usage or urban amenities that the various worksheets presented.
Figures 5.5 to 5.8 show these results for each neighborhood separately together with the RP choice for each neighborhood. These results show that while there are differences in the attractiveness of the community transit and the urban amenities improvements between the neighborhoods, in no neighborhood did people seem to distinguish between the levels of pedestrian usage or urban amenities that the various worksheets presented.
Figure 5.4: SP mode choice by worksheet (in all the neighborhoods and all respondents)
Figure 5.5: SP choice by worksheet in Cicero
Figure 5.6: SP choice by worksheet in Pilsen
Figure 5.7: SP choice by worksheet in Evanston
More detailed results for the SP experiment, showing results for each neighborhood by each actual mode chosen, are included at the end of this chapter, under Section 5.7. Detailed Results for the Stated Preference Experiment. Tables 5.10 to 5.17 show these data by actual numbers and Tables 5.18 to 5.25 show them in percentages.
5.6 Model Estimation Results
A mode-choice model was estimated on the basis of the results of the SP experiment. The purpose of the model is to estimate the utility of each element of the trip to the individual travelers; these utilities were then used to revise the agent-based model of mode choice. The model is specified as a multinomial logit (MNL), where the utility of each alternative response is specified as:
Where Ui is the utility of mode i for a given traveler; Vi is the systematic component and ei is its random component. The systematic component of the utility can be written as:
Figure 5.8: SP choice by worksheet in Skokie
Where Xi is a vector of attributes for alternative i, with some of them interacting with traveler characteristics, and b is a vector of coefficients. In the MNL model, ei is Gumbel distributed, independently and identically across alternatives, and the probability that alternative i will be chosen is
∈ = L i i i V V i p ) exp( ) exp( ) ( µ µ
Where μ is the scale parameter, and L is the set of available alternatives.
Table 5.9 provides the model estimation results showing the estimated coefficients with the corresponding t-statistics under it in parentheses. The coefficients represent the impact of a unit change in the independent variable on the utility of the indicated mode. For example, an additional minute of driving time reduces the utility of the driving mode by 0.043. These utilities can be thought of as an
index of the desirability of a particular choice to a particular individual; they are used to generate the probability that the individual selects that choice with the above formula.
All the time coefficients are significant and negative, indicating that for any mode, additional travel time in that mode is a deterrent to its selection. People are most sensitive to the wait time for the CTA with
a coefficient of -1.49 for the headway. This is a very large coefficient and may include some effect of transfers that many riders have to take, as there was no separate variable for number of transfers. People are also quite sensitive to the walk time to CTA, indicating that walk is an option only to those living close to the station. In terms of the new community transit service, the results show that people are quite sensitive to its headway, showing the importance of having this service run frequently. Interestingly, though, the travel time on the community transit was not significant and is not included in the model. Given no congestion at the neighborhood end, the variations in travel time are not significant enough to affect the choice. Alternatively, while people may care about the travel time on the community transit, those living farther from the train station may be more likely to select the community transit option. This would tend to moderate the negative utilities of travel time on community transit.
Time traveling in CTA has a coefficient of -0.025, showing from all times this is the least sensitive; each additional minute of travel on the train is less of a deterrence to its selection than other time-related variables in the model.
The driving time coefficient is higher at -0.043, most likely as car users are usually of higher income level, and cycle time also has a higher coefficient, -0.042 for cycle all the way. Interestingly, riders are much more sensitive to cycle time when they cycle only to the station with a coefficient of -0.095. This may be because cyclers who cycle all the way may view it more as a sport and enjoy it, while those cycling only to the station view it just as a travel mode to get to the station.
Parking cost is also highly significant showing the strong impact of parking pricing on driving, and if the person has free parking at her destination this further reduces her probability to use CTA. The results show a very strong inertia effect, i.e., travelers tend to choose the mode they chose in their actual trip: car users are most likely choose to drive, CTA users are most likely to choose CTA, and cyclists are most likely to choose to cycle.
The person’s activity at his destination also has an effect on mode choice: people who travel for work or school are more likely
to cycle all the way, and people who travel to school are less likely to drive compared to other modes. People who have stopped for an additional activity which is not work-related on their way are less likely to drive. This may be given the concern regarding finding parking for these stops.
In terms of socio-economic characteristics, if the person is a full time worker he is more likely to drive, and with more vehicles per drivers in the household she will be less likely to cycle. Finally, those going to the loop are less likely to cycle.
The results also indicate a strong neighborhood effect, and most likely to drive are residents of Skokie with high income and low density (this is the reference neighborhood with coefficient of zero). Second least likely to drive are residents of Cicero who have low density and low income. Residents of both high-density neighborhoods, Pilsen and Evanston, have the lowest probability to drive unrelated to the income level. This is a very important result showing the effect of type of neighborhood on mode choice: all things equal residents of highdensity neighborhoods are less likely to drive and more likely to use public transport and non-motorized modes.
Overall, the SP results suggest that providing frequent community transit service connecting peoples’ home to high-quality regional rail transit can significantly induce people to shift from car to public transport and to bike. While responses to the SP may be subject to biases of various types, the following section seeks to control for them by modeling mode change before and after the improvements contemplated. The SP data are also important to identify the most important variables that can affect such shift. The results show that the most important factor for the community transit service is its frequency. Supplemental policies can augment the effectiveness of community transit. In particular, parking cost is a strong determinant of mode choice and can be used as an accompanying measure to induce shift to non-auto modes. The urban amenities features and presence of people using transportation alternatives, however, did not have an impact, though it may be that respondents were not able to visually discern between the scenarios presented. Finally, there is a strong neighborhood effect, showing that residents of high-density land-use
are less likely to drive, and most likely to drive are residents of the low density and high income Skokie. Finally, there is also a strong inertia effect where people tend to choose their current mode of travel.
It is interesting to compare the SP results with estimated mode shift presented in Table 5.3. The highest shifts away from car and toward CTA were obtained in Skokie followed by Cicero, the two low density neighborhoods where people are most likely to drive initially. This is an important finding: the community transit can mostly have an impact in low-density areas where people are more likely to drive without it. In the higher density neighborhoods where people are more likely to use transit, the community transit is expected to have a lower impact. This effect is unlikely to continue into very low-density areas, however. In the greater metropolitan context, Skokie and Cicero may be examples of medium-density areas that constitute the most amenable territories for automated community transit.
5.7 Detailed Results for the Stated Preference Experiment
Table 5.10 to 5.17. Results for SP Experiment (Numbers), per Neighborhood and by actual Mode
Neighborhood2
Neighborhood2 Pilsen
Pilsen
Neighborhood2
Neighborhood2
Pilsen
Pilsen
Neighborhood3 Evanston
Neighborhood4
Neighborhood4 Skokie low dense
Table 5.18 to 5.25. Results for SP Experiment (Percentage), per Neighborhood and by actual Mode
Neighborhood2 Pilsen
Pilsen
Pilsen
AGENT-BASED MODELING
6.1 Regional Transportation Authority Mapping and Statistics. (2012). Work Trip Flows Retrieved 4/6, 2012, from <http://www.rtams. org/rtams/ctppHome.jsp>
6.1 Mode Choice Modeling and the Last-Mile Problem
To be able to explore scenarios that do not yet exist, we relied on simulation modeling. This facilitated investigations into mode choice based on interaction between travelers and their residential location relative to the rail station that served as the nucleus of each study area. To this end, we built a prototype agent-based model of commuters living within a 1.5-mile (2.4 km) radius from a transit station in their neighborhood. In the current modeling round we focused on commuters for whom transit is a feasible and attractive choice because they live near a transit station and they work or study in the downtown area. The neighborhoods modeled are part of a larger metropolitan area, which is not explicitly represented but is inferred in the time it takes commuters to get downtown. Commuters have a choice of various transportation modes to travel to work, and their decision is based on their preference for travel time, transportation cost, and perceived safety. The neighborhood fabric, parameters, and commuting modes are modeled after four neighborhoods in the Chicago metropolitan area in Illinois, USA, which experiences fairly low transit ridership despite its relatively high-quality service (5.1% bus, 4.7% local train, and 5.7% commuter train 1). The four neighborhoods vary along two important dimensions influencing mode choice: land-use composition (low-density and primarily residential use versus higher density and mixed use), and income level (lower versus higher).
Transportation mode choice is most typically modeled using discrete choice models (e.g., logit models), based on Random Utility Theory. This modeling approach involves estimating the utility function for each available mode, which requires choosing variables to be included in the utility function and its functional form (which is usually linear), and estimating the parameter values with maximum-likelihood estimation. Household survey data and data from transportation network analyses are usually used to estimate these utility functions reflecting travelers’ preference of modes. Recent advances in travel demand modeling has expanded this approach to activity-based modeling, where the demand for travel is derived from the demand for activities. The activity-based approach is used to estimate the individuals’ entire daily activity pattern, including activities in which the individual participates, the timing and location of these activities,
6.2 Zhang, L., & Levinson, D. (2004). An Agent-Based Approach to Travel Demand Modeling: An Exploratory Analysis. Journal of the Transportation Research Board(1898), 28-38.
6.3 Batty, M. (2005). Cities and Complexity: Understanding Cities with Cellular Automata, AgentBased Models, and Fractals. Cambridge: MIT Press
6.4 Iacono, M., Levinson, D., & ElGeneidy, A. (2008). Models of Transportation and Land Use Change: A Guide to the Territory. Journal of Planning Literature, 2(4), 323-340.
6.5 Lu, Y., Kawamura, K., & Zellner, M. L. (2008). Exploring the Influence of Urban Form on Work Travel Behavior with AgentBased Modeling. Transportation Research Record: Journal of the Transportation Research Board(2082), 132-140.
6.6 McDonnell, S., & Zellner, M. L. (2011). Exploring the Effectiveness of Bus Rapid Transit: A Prototype Agent-Based Model of Commuting Behavior. Transport Policy 18(6), 825-835.
and the mode the individual takes to travel to and between these activities. When data are not available because of the hypothetical or speculative nature of the choices, or when interactions among commuters and their environment affect travel decisions iteratively, the traditional approaches are limited in exploring potential outcomes. These limitations led this research to an iterative agent-based approach while structuring utilities of modes and probabilities of their selection according to the traditional logit model. Specifically, we sought to build in the potential for a feedback loop to influence commuters’ mode choices over time: in a number of circumstances, individuals’ propensity to select a mode may be motivated by their observation of others choosing that mode, in part due to people’s perceptions of safety.
Agent-based models have been used in a variety of urban transportation studies, and particularly to examine the link between land use and transportation behavior. e.g.,2,3,4,5,6 These computational models feature agents as commuters whose attributes (e.g., income level, vehicle ownership) influence their transportation preferences (e.g., how much they value monetary cost) and thus influence mode selection. Agents may interact with each other and with the various transportation modes and/or the pedestrian environment, affecting each other’s choices. Relevant interactions in our model include responses to pedestrian and bike traffic as they evolve over time, triggered by streetscape quality and transit options that improve neighborhoods’ pedestrian and biking environment. Congestion and infrastructure capacity is the focus of many studies. By contrast, our model focuses on the adoption of alternative modes over short distances to the rail station, where congestion would not significantly influence the time of the trip. (Congestion in our model influences mode choice in the travel time assumed for each mode outside of the neighborhood.) We used the model to explicitly represent assumptions about mode choice where data are absent because the transit environment we envision does not yet exist. We thus started with a theoretical rather than a data fitting modeling process. We used data to compare simulation results to observed mode share patterns as reported by transportation agencies, and in this way determine if our theory was enough to explain existing mode shares in the various neighborhoods. As we encountered
6.7 Wilensky, U. (1999). NetLogo. Evanston, IL: Center for Connected Learning and Computer-Based Modeling, Northwestern University. Retrieved <http://ccl. northwestern.edu/netlogo/>
discrepancies, we advanced the theory by reformulating the model with possible explanatory mechanisms for the differences. Once we matched observations, we used the model to examine how different transit improvement scenarios might fare against each other and to identify important factors that may influence the results. In particular, we sought to illustrate how supportive public policies (e.g., increasing driving or parking costs) in combination with the physical improvements may alter the potential of the transformative transportation vision. Our model is not designed as an accurate forecasting tool but rather as in initial test of the high-end potential of such new approach to improve transit use.
In the following sections, we describe the details of our model, followed by a discussion of the simulations and insights derived from the scenarios tested. We conclude with implications for policy and directions for future work, including the analysis of ongoing empirical data collection and recommendations for future empirical research. A permanent link of the model can be found at http://www.openabm. org/model/4055/version/1/view
6.2 The Model
We built our agent-based model using Netlogo,7 representing commuter agents choosing a mode that minimizes the disutility of their trip, with the variables comprising their utility function being monetary cost, time, and safety. In this section we describe the model’s agents and landscape, their attributes, and the decision rules by which they interact and change. We model our agents and environment after four neighborhoods in the Chicago Metropolitan Region with access to a train station of the Chicago Transit Authority (CTA) system.
Our model represents six modes: (1) walk to train, (2) bike to destination, (3) bike to train, (4) bus to destination, (5) drive to destination, and (6) community transit to train. We excluded other modes (e.g., carpooling or driving to station) because they would increase the computational complexity of the model without adding insight into our question of how community transit would support transit and encourage commuters to shift from driving all the way to
work. Other modes are also variations on the six we implemented; in the case of carpooling, for example, driving all the way to work would be a close approximation. All modes reflect frequencies and commute times for travel to work and school in the Chicago “Loop” during morning rush hour.
The model is informed by the literature and publicly available data on commuter behavior, land use, and transit service, and commuters’ preferences for different aspects of transportation (summarized in Table 6.1, and detailed in each section below).
Figure 6.1: Location of the four Chicago neighborhoods: Skokie, Evanston, Cicero and Pilsen. CTA train network in color.
Figure 6.2: Comparison aerial image and model.
Sample block. Households in blue, roads in black, sidewalks in grey, vacant lots in dark brown, alleys in beige.
6.2.1 Neighborhood Landscape
Our model has a landscape that is a two-dimensional square grid with a street network centered on a train station. Each neighborhood represents the area that is within walking and biking distance of a particular CTA train station (a radius of 1.5 miles or 2.4 km).
6.8 Cook County. (2001). Cook County GIS MapCenter Retrieved 4/3, 2011, from https://secure. cookcountyil.gov/gis/metadata. php
Each neighborhood is defined by a select number of factors that differentiate the neighborhoods’ physical layout (Table 6.1). In the case of Evanston, the proximity to Lake Michigan locates over one-quarter of the 1.5-mile radius circle in water; to reflect this in the model, this area is blank and impassable. Each individual land parcel occupies one cell in the lattice, and together the parcels form blocks. We used the median lot width and block dimensions derived from an analysis of a dataset of lots provided by Cook County 8 for each neighborhood to define the corresponding cell size and block size in the model (Table 6.1). We use median, rather than average, values to reduce distortion introduced by other land use types with significantly larger lots (e.g., industrial). The simulated urban block includes the sidewalk (one cell wide) in addition to residential parcels. Every block is surrounded by streets that are one cell wide (Figure 6.2). To mirror a street network with wider arterials, every fourth street is two cells wide, with spacing centered so the streets that lead to the train stations are arterials. A line of cells cutting horizontally through the middle of a block simulates alleyways, which are present in almost every block in Chicago and its environs. Alleys are public spaces that cannot be built on, and representing them in our model allows us to account for this additional space (Figure 6.2).
Figure 6.3: Simulated landscape for (a) Skokie, (b) Evanston, (c) Cicero, (d) Pilsen. Residential areas in green, industrial areas in white, commercial areas in red, low density areas outlined in purple (Evanston), Lake Michigan in blue (Evanston)
6.9 U.S. Census Bureau. (2010) H3 - Occupancy Status Retrieved 9/8/2012 <http://factfinder2. census.gov/faces/nav/jsf/pages/ index.xhtml>
6.10 Regional Transportation Authority Mapping and Statistics. (2012). Work Trip Flows Retrieved 4/6, 2012, from <http://www. rtams.org/rtams/ctppHome.jsp>
Households may be located only on block cells that border sidewalks and are not covered by alleys. These cells are assigned a random number of households drawn from a truncated normal distribution 9,10 to recreate approximate densities in each neighborhood. In Evanston, approximately one-third of the entire area population lives within half a mile of the Davis station (10% of the land area). Due to this difference with the other three neighborhoods, the model randomly populates the landscape adjacent to the station with densities higher than those further away from the station (Table 6.1). Skokie and Evanston have a fairly continuous urban fabric with small areas dedicated to nonresidential uses, whereas Cicero and Pilsen have larger industrial sites that break up the residential areas (Figures 6.1 and 6.3). Overall, 39% of the Cicero neighborhood is devoted to industrial and infrastructural uses and has only arterial roads. In Pilsen the corresponding number is 60% of the landscape. To reflect these differences among the four neighborhoods, our model assigns non-residential lots randomly in Skokie and Evanston, but recreates large non-residential areas, and the corresponding street network distortion, in Cicero and Pilsen (Figure 6.3, Table 6.1).
(a)
(b)
(c)
(d)
6.11 Google. (2012). Google Maps Retrieved 8/2, 2012, <https:// maps.google.com/>
6.12 Chicago Transit Authority. (2012). Route & System Guides, and System Brochure Map. Retrieved 8/2, 2012, from <http://www. transitchicago.com/>
6.13 Ibid.
6.14 Ibid.
6.15 Pace Suburban Bus. (2012). Fare Information Retrieved 8/2, 2012, from http://www.pacebus.com/ sub/schedules/fare_information. asp
6.2.2 Travel Setup
Although the model generates all commuting households, only a fraction of these households commute to the inner central area of Chicago, the central business district that contains the area known as the Loop. Each household is assumed to have one downtown commuter. When the model generates the households, it randomly decides which households will have commuters who travel to the Loop and which will travel to other areas in the Chicago region. Non-Loop commuters are randomly assigned a mode of travel based on current mode shares1, and will not change their travel mode during a simulation. The purpose of these simulated trips is to provide background traffic that can affect the decision-making of the Loop commuters through perceptions of safety based on pedestrian and biking traffic (Section 6.2.4.3).
Each neighborhood has four exit points where the 1.5-mile radius intersects the main arterials. The exit closest to the Loop is the one that drivers and cyclists take in their downtown commute, while the three others connect them to non-Loop destinations.
Times, speeds, and transfers for transit for Loop commuters were estimated using goroo.com, a site operated by Chicago’s Regional Transportation Authority; driving and biking estimates were from Google Maps. 11 Speeds for all modes are average speeds, which include traffic signals, congestion during rush hour, and transit stops. Bus and train headways were estimated using published schedules. 12 Train fare in all neighborhoods was $2.25. 13 Bus fares vary with the number of transfers. The fare for Pilsen, Cicero, and Skokie was set at $2.25 based on the published fare charts14. The fare was higher in Skokie because of service provided by PACE, the suburban bus authority. 15 Although PACE also serves locations in Cicero and Evanston, CTA buses provided the commute with the shortest overall time to the Loop.
6.2.2.1 Train layout
In Chicago, the train station entrances are either at or near street intersections. Train stations in our model are thus located on a street intersection at the center of the simulated landscape. In denser areas like Pilsen and Evanston, more than one station may be found within the neighborhood. For the purposes of comparability across
Figure 6.4: Conceptual bus and shuttle network. Bus lines in blue, shuttle lines in red, CTA station in green.
neighborhoods to address the last-mile problem, we selected the station at the center of the 1.5-mile radius and excluded any other stations that might have been covered in the same area.
6.2.2.2 Buses
Although more than two lines typically run through each neighborhood, only a few lines take commuters to the Loop with one transfer or less, and they tend to run close to the CTA stations. We thus model two bus lines in each neighborhood running north to south and west to east on the arterials that go through the middle of the neighborhood (Table 6.1, Figure 6.4), within two blocks of each station, and with stops spaced every two blocks, the typical spacing in Chicago.16 We assume buses have no capacity constraints, meaning that buses can meet transit demand without limit. This assumption stems from the problem definition of representing a best-case scenario for transit use.
6.2.2.3 Community Transit
6.16 Chicago Transit Authority. (2012). Route & System Guides, and System Brochure Map. Retrieved 8/2, 2012, from <http://www. transitchicago.com/>
6.17 Royal, D., & Miller-Steiger, D. (2008). National Survey of Bicyclist and Pedestrian Attitudes and Behavior; Volume II: Findings Report. In U. S. Department of Transportation & National Highway Traffic Safety Administration (Eds.).
This study is designed primarily to evaluate the impact of a form of transit that does not yet exist: a driverless neighborhood shuttle that would run frequently during rush hour and transport commuters to and from the train station. When this option is active in the model, the service runs every three minutes from the four corners of the neighborhood towards the station (Figure 6.4), picking up commuters at each stop along the way (except in Evanston, where community transit only runs through the land area). This layout minimizes duplication with bus routes. We expect that households furthest from the CTA station would have a stronger incentive to take transit than those more close by, because the ten-minute maximum travel time including waits provides a significant advantage to community transit users towards the edge of the 1.5 mile periphery. The community transit is free of cost, so the monetary cost of the trip using a shuttle to get to the train and then taking the train to the Loop is only the train fare (Table 6.1).
6.2.3 Commuter Agents
As mentioned earlier, our model assumes one commuter (agent i) per household traveling for their primary activity of the day, defined as the work or school commute. Commuter agents are heterogeneous.
6.18 Royal, D., & Miller-Steiger, D. (2008). National Survey of Bicyclist and Pedestrian Attitudes and Behavior; Volume II: Findings Report. In U. S. Department of Transportation & National Highway Traffic Safety Administration (Eds.).
6.19 Federal Highway Administration. (2011). 2007 Transportation Profiles. Census 2000 and 20052007 ACS Retrieved 7/17, 2012, from <http://www.fhwa.dot. gov/planning/census_issues/ american_community_survey/ products/2007_transportation_ profiles/index.cfm>
6.20 Moore, R. (2010). Parking Not Getting any Cheaper - and Unlikely to Do So: Colliers International.
They are randomly assigned a unique set of attributes (independent of one another) that influence their mode choice: automobile and bike ownership, parking cost at the destination, location within the neighborhood, and departure time.
Household bike availability is fixed at 56% across all neighborhoods, corresponding to data for the National Highway Traffic Safety Administration region that includes Illinois 18 (Table 6.1). Neighborhood-specific automobile ownership data are readily available from the Federal Highway Administration 19 (Table 6.1). Car owners are assigned a parking cost value drawn randomly from a normal distribution derived from the average daily parking rate in the Loop 20 and a standard deviation based on an informal survey of 2011 parking garage rates in the Loop (Table 6.1). Departure times are drawn from a normal distribution over a 120-minute rush hour period, with the mean at 60 minutes (i.e. the middle of the rush hour period) and a standard deviation of 12 minutes. Times are rounded to the nearest minute.
Agents are assigned preferences or weights for each aspect of utility derived from different aspects of their travel mode: monetary cost (wm,i), in-vehicle commuting time (wt,v,x,i) and out-of-vehicle commuting time (wt,o,x,i) for a particular mode x, and safety (ws,i). Agents then use these preferences and assigned travel attributes (e.g., parking cost, travel times, etc.) to calculate the (dis)utility for each mode choice x (ux,i). Based on these estimates, they choose the mode that renders the highest utility (or lowest disutility) for their commute. During their commute, agents gather information that will feed into their utility estimates at subsequent time steps in the simulation. The following section describes the order of events within a simulation, including the details for the utility calculation.
6.2.4
Processes and Order of Events
The model creates a new bus at the frequency established by the headway parameter. At each time step, households with a departure time corresponding to the time step start a new trip. Non-loop commuters travel by the mode assigned at setup. Loop commuters choose a mode based on the probabilities computed from
6.21 Bureau of Transportation Statistics. (2011). Table 4-23: Average Fuel Efficiency of U.S. Light Duty Vehicles Retrieved 3/20, 2011, <http://www.bts. gov/publications/national_ transportation_statistics/html/ table_04_23.html>
the utilities derived from the available modes (section 6.2.4.1). Agents that choose a mode involving walking move to a sidewalk cell in front of their house; those biking or driving move to a road cell in front of the house. Loop commuters in transit will record how many other pedestrians and cyclists are in their vicinity, updating their perceivedsafety score (section 6.2.4.3). We assume that agents will perceive a friendlier environment with greater street activity from non-drivers. Driving agents advance one cell per time step, while all other agents advance a portion of this distance, proportional to the speed of each mode (Table 6.1). The number of minutes each time step represents is a function of the block sizes in each neighborhood (Table 6.1). Agents and transit vehicles determine where to move based on a way-finding algorithm described in section 6.2.4.2. The simulation ends when the rush hour period is over and all agents have reached their destination. Then, agents reset variables and store data about the previous trip. The simulation continues into the next day, and information about the number of non-driving agents encountered feeds back into the new day’s mode choice. Each run lasts ten days, well after mode share has settled into a stable pattern.
6.2.4.1 Mode (Dis)utility
The model uses a logit framework to estimate the utility of mode x to each commuter i, ux,i (see equation 6.3 below). Probabilities of each commuter i taking mode x are then calculated from these utilities (equation 6.4). In all cases, the total utility of the trip (which does not include the benefits of accessing the destination) is negative, meaning that agents seek to minimize the disutility of their travel.
The money score (mx,i) is the monetary cost of taking mode x in dollars. For driving, gas is assumed at $4 per gallon, and fuel efficiency at 22.6 mpg21. In addition to gas, driving costs also include parking. For bus and train, monetary costs only include the corresponding fares. Other modes are free (Table 6.1).
Times are estimated in minutes for agent i using mode x, accounting for both in-vehicle (tv,x,i) and out-of-vehicle time (to,x,i). Times are calculated using distances unique to the agents’ location in the neighborhoods and average speeds listed on Table 6.1. Driving
6.22 Chowdhury, S. J., & Ceder, A. (2012). Interchange Attributes Influencing Public-Transport User’s Intention to Use Routes with Transfers.
6.23 Wilson, N. H., & Ferreira, J. (2006). Improving the Understanding of Transfer Behavior in Urban Public Transport Networks: New England University Transportation Center, Massachusetts Institute of Technology.
times are measured from when agents leave their houses and reach the center of the Loop (the intersection of State Street and Madison Street in Chicago, which is the center of the city’s grid system). Bicycling times are measured the same way as driving, but five minutes are added to the actual commute time to represent time spent taking bikes in and out of storage areas. Bus times are calculated measured from the moment agents board a bus at the closest bus stop to their houses to when they reach the center of the Loop. Train time is measured from the moment when agents board a train at the neighborhood station to when they reach the center of the Loop. Out-of-vehicle time is measured from when agents leave their houses to when they reach a transit stop for mode x and the time they spend waiting to board the transit vehicle and for each transfer, estimated as half of the headway time for that mode. A transfer penalty of five minutes per transfer is added to out-of-vehicle time beyond the actual time the transfer takes to represent the inconvenience of transferring modes. 22,23 We do not consider congestion or transit delays within the neighborhood, since we are modeling the best situation for alternative transportation.
The final component of utility is safety (sx,i), i.e., how agent i perceives the built environment being welcoming to walking or biking. We assume that the presence of other pedestrians and cyclists will reduce the perception of risk for these modes. Since we are modeling optimal conditions, we do not consider the effect of poor weather on perceived safety. We assume drivers are not affected by the built environment, given that they are not directly exposed to it; thus the safety score for driving is always 0. For all other modes the score is composed of three parts, weighted equally (due to lack of data), and all ranging between 0 and 1, where the smaller the score the higher the perception of safety:
(6.1)
Where:
l = streetscape improvement level;
fi,t-1 = presence of other pedestrians or cyclists in on previous day, dx,i = duration of exposure to the built environment with mode x
The streetscape improvements (l) apply equally to all agents,
Figure 6.5: Streetscape conditions: (a) current; (b) some improvement and pedestrian and cyclist presence, and (c) ideal level of improvements with higher pedestrian and cyclist presence.
and define a policy scenario (see section 6.4). A value of 1 represents the current conditions (e.g., Figure 6.5a), 0.5 represents some improvements (e.g., Figure 6.5b), and 0 (e.g., Figure 6.5c) represents the ideal level of streetscape environment. The score for pedestrian/ cyclist presence (fi,t-1) is initialized as 1 at the start of the simulation, and decreases over the course of the run as the encounters with other pedestrians feed back into the decision each day (see Section 6.2.4.3). Waiting for transit, walking or biking all increase the exposure to the built environment. Longer times spent in these activities are associated
(a)
(b)
(c)
with lower perceptions of safety. Perceptions of environment safety can be improved with streetscape improvements and/or pedestrian and cyclist presence, represented in equation 6.1. To obtain a score for dx,i that enables comparisons across factors, time is normalized with respect to the range of exposure times in all modes. Overall, the safety score component can range from 0 (maximum safety) to 1 (minimum safety).
Commuter agents compute the utility they would derive from each mode x by calculating the average of the raw scores for each dimension (money, times, and safety), weighted by agents’ normalized preference for each dimension, based on a review of studies of US metropolitan areas (Table 6.1):
(6.3)
Commuters use the utilities for each mode to compute the probability of choosing mode x (px,i) over all modes, as in traditional mode choice logit models:
(6.4)
Agents then draw a random number that will determine the mode they choose, based on px,i. This is to overcome the problem that notwithstanding the fact that logit’s assignment of modes is probabilistic, agents are integral and need to be assigned a single mode for simulation purposes. For example, an agent who has a 75% probability of driving based on the logit model above would be assigned a single mode, and there would be a 75% probability that that mode would be the automobile.
6.2.4.2
Way-finding
Transit, car drivers, and cyclists only move on street cells. Pedestrians move only on sidewalks and across intersections. As mentioned above, our model does not explicitly consider the interactions between street, bike and pedestrian traffic within the neighborhood, where congestion is assumed to be low. We focus instead on interactions that could potentially feed back into mode choice, primarily those encouraging walking and biking through an
increased sense of community surveillance. Commuters and transit vehicles follow a simple way-finding algorithm: (a) they determine the adjacent cell closest to their destination, excluding the cell from which they previously moved, (b) they move to that new cell, and (c) they repeat until they reach their destination.
Commuters walking to transit move to the CTA station, bus stop, or community transit stop closest to their home cell. In the latter cases, when they reach their bus or community transit stop they wait until their form of transit reaches an adjacent cell. Non-loop walking commuters move to a randomly selected cell in the neighborhood.
Buses move in straight lines starting furthest from the loop. Community transit goes from its starting locations in the corners of the landscape toward the train station at the center. When buses and shuttles go by their respective stops, they board any commuters waiting at the stop.
Loop commuters driving and biking all the way move toward the Loop-exit cell. Non-Loop drivers are not explicitly modeled, since they do not affect safety feedback of other Loop commuters. Loop commuters biking to the train move to a cell adjacent to the train station. Non-Loop cyclists move toward one of the four neighborhood exits or to a randomly selected road cell in the neighborhood with equal probability.
Commuting beyond the neighborhood exit points and CTA stations is implicit, i.e. it affects mode choice via estimated commuting times (Table 6.1).
6.2.4.3 Safety Feedback
We assumed that as non-driving agents see other non-drivers along their commute, they feel safer and more inclined to walk or bike. Our model implements this assumption by updating the safety feedback score (fx,i) for Loop commuters according to the number of agents they come across that are walking, biking, or waiting for transit during their commute each day. They then use the updated score to choose the mode the next day (see section 6.2.4.1). Because there is little empirical data to support a specific implementation of this
(a)
(b)
6.6: Viewshed for (a) pedestrians and cyclists in transit, and (b) for pedestrians waiting at transit stops (commuter in purple, red arrow = 1 block).
feedback mechanism, we did not have a basis to formulate a function linking the number of people encountered and associated perception of safety. Instead, we assumed two thresholds of satisfaction (low and high) that correspond to two general levels of pedestrian and cyclist presence that commuters would be aware of, and that would feed back into their perceived safety scores.
At the start of every minute all moving Loop commuters count the number of other agents walking, biking, or waiting for transit within one block ahead of them. Loop commuting pedestrians waiting at transit stops look one block all around them (Figure 6.6). If at least 30 agents are encountered, a higher satisfaction threshold is reached. If the agent counts at least 10 other non-drivers, but less than 30, a lower satisfaction threshold is met. At the end of the day, agents calculate the proportion of time during the commute that each satisfaction threshold was reached and update the safety feedback variable as follows:
(6.5)
where:
ti = agent i’s time of exposure to the built environment in mode x;
th,i = agent i’s time of exposure in which the higher satisfaction threshold was met;
tl,i = agent i’s time of exposure in which the lower satisfaction threshold was met.
Agents only save the score for the last day.
6.3 Understanding and Calibrating the Model
Our model is designed to illustrate the ways in which the suggested landscape and transit improvements may promote shifts from driving to transit, cycling, or pedestrianism. It is not designed as an accurate forecasting tool. With this model we sought to recreate the general patterns of mode share observed in the four neighborhoods of reference, and to explain general patterns reported in the literature.
Figure
Table 6.1 Default Model Paramaters
We thus conducted two types of tests with our model. The first set of tests involved examining the impacts of some model assumptions on the results, to fine-tune the default values for model parameters. Once these were completed, we introduced neighborhood-specific modifications to the model to address the remaining discrepancies between simulations results and empirical data. These tests allowed us to better understand how the mechanisms in the model generated the resulting mode choice in each scenario. We describe these structural
Table 6.1 Default Model Paramaters (cont.)
18 minutes, no transfers
31 minutes, 1 transfer 29 minutes, no transfers 18 minutes, no transfers 31 minutes, 1 transfer 23 minutes, no transfers
changes below.
6.3.1 General Calibration
6.24 Regional Transportation Authority Mapping and Statistics. (2012). Work Trip Flows Retrieved 4/6, 2012, <http://www.rtams. org/rtams/ctppHome.jsp>
To validate our model, we tested its capacity to generate current observed mode shares as reported by RTAMS24. The largest discrepancy to start with pertained to cycling; initial results suggested higher rates of biking than what is observed in our neighborhoods, due to its free cost and relatively favorable times (similar to transit). While this suggests there is a high potential for increases in bike use, existing barriers prevent this potential from being realized in the US, such as people’s physical capacity and cultural attitudes, and supporting infrastructure both in the built environment and in the work environment facilities at work. In order to account for the discrepancy between modeled and actual cycling, we applied a biking penalty of -1, a fixed amount that lowers the bike and bike-to-train utilities. Adding this bike penalty resulted in lower shares compared to reported data, but allowed for biking to appear as a choice and at higher levels in neighborhoods closer to the Loop, which is consistent with observations.
6.3.2 Neighborhood-specific Calibration
While the modeling results were reasonable for biking in all neighborhoods, the model still showed discrepancies greater than 10% compared to the RTAMS data for bus, train and driving in several neighborhoods. The differences between modeled results and empirical data formed the basis for a new round of calibration, based on possible explanations for the discrepancies in each neighborhood. In Pilsen, bus ridership data is higher than the share produced by our model. We thus included a greater number of bus lines to the Loop, reflecting the greater bus connectivity due to its proximity to the downtown area. Some of these additional routes also offered faster times than other lines, and no transfers (Figure 6.7). Once taking the bus became more convenient for Pilsen agents, results came to within roughly eight percentage points of the RTAMS data (Table 6.2).
In Evanston, train ridership is higher than the initial model produced. A possible explanation is the presence of a regional commuter Metra train station immediately adjacent to the Davis CTA station, which greatly reduces commuting times to the Loop due to express services
Figure 6.7: Revised Pilsen bus network (bus lines in red; CTA station in green).
Table 6.2 Comparison between final calibration and empirical data on mode share for the four Chicago neighborhoods25
Note: Train includes walk to train, bike to train and bus to train; bike RTAMS data corresponds to “Other” category, which includes biking
6.25 Regional Transportation Authority Mapping and Statistics. (2012). Work Trip Flows Retrieved 4/6, 2012, <http://www.rtams. org/rtams/ctppHome.jsp>
during rush hour. We thus revised the model parameters in Table 6.1 to account for the quicker Metra times from the station to the Loop (26.5 minutes) but greater headway (11 minutes) and the higher Metra fare ($4.25). While additional drivers switched to the train, train use was still nine percentage points lower than the empirical data and driving seven percentage points too high, prompting us to further revise the model, this time to represent the extensive bus network shuttling commuters to the Davis station. In a sense, Evanston already has an established network with a similar function to the proposed driverless shuttles. The base scenario for Evanston thus includes community transit going to the train station running every eight minutes like CTA buses, instead of three minutes like the proposed shuttle, and with the regular CTA bus fare. With the combined bus to train and the Metra data setups, overall results came within 7% of the RTAMS data (Table 6.2).
6.4 Scenarios and Simulation Results
With the baseline case defined, we used the model to test a range of policy scenarios to identify the isolated and combined effects of streetscape improvements, monetary disincentives, and the provision of community transit to the neighborhood transit station. Street improvements are abstractly defined in two levels (Figure 6.5), the lower level corresponding to non-motorized transportation improvements only (e.g., providing crosswalks, bike lanes). Ideal streetscape improvements would add amenities (e.g. landscaping, streetscape
furniture, information kiosks). Improvements are activated five days into a simulation, so that an initial equilibrium state is established; the final results can be attributed solely to the improvements. Community transit scenarios include the enhanced shuttle service to the transit stations. Finally, monetary incentives are represented as reduced transit fares ($0.25 for bus or train), increased gas price similar to European cities ($9 per gallon), and increased parking costs (additional $20 to assigned baseline).
We organize the analysis of our results around two main questions:
1. What kinds of policies are most effective at reducing driving? In particular, under what conditions are shuttles most effective at reducing driving?
2. How do policy effects vary with distance from transit station?
6.4.1 Policy Effectiveness
Overall, community transit and urban design improvements in combination were quite effective at shifting downtown commuters to non-automotive modes. This was most pronounced outside of Evanston, with a reduction in auto use relative to the base case was between 12 and 21 percentage points (Table 6.2, Figure 6.8). With a current effective community transit service provided by CTA buses and a more pedestrian-oriented environment, Evanston showed lower improvements. Reductions in driving were considerable when the three sets of changes—urban design improvements, cost scenarios, and community transit—were considered in combination. In this maximalist scenario, reductions in driving of between 23 and 40 percentage points among downtown drivers were realized for most neighborhoods, and an 18 percentage point reduction in Evanston. Policies to raise the cost of driving relative to other modes are notoriously difficult to implement politically; notwithstanding this challenge, results presented here highlight the importance of these measures for maximum effect and provide some basis for optimism regarding their potential impact.
Less dense neighborhoods (Cicero and Skokie) were more sensitive to higher parking costs, streetscape improvements and community transit service than the denser neighborhoods (Pilsen and
Ideal improvements
Shuttles
Cost scenarios
Shuttles and ideal improvements
Ideal improvements and cost scenarios
Shuttles and cost scenarios
Shuttles, ideal improvements, and cost scenarios
Evanston), suggesting that where environments are more urban in character with these elements present to some extent, there may be fewer gains to be realized.
Evanston is the least responsive to community transit service, due to its high level of bus service towards the CTA and Metra stations. Streetscape improvements have a larger effect, but smaller than in other neighborhoods due to the high-density around the stations and shorter distances from the Lake, which decreases the time of exposure to the street environment. The higher density in central Evanston would also explain why community transit service and street improvements seem to serve different populations: shuttles would likely target residents living further away but close to community transit routes, while streetscape improvements target commuters who have to spend more time walking across the neighborhood. As a result, the effects of applying each policy independently add up in the combination scenario. Increasing driving costs, on the other hand, duplicates some
Reduction in Driving Reduction in Driving
Reduction in Driving Reduction in Driving Skokie Evanston Cicero Pilsen
Figure 6.8: Reductions in driving share under different improvement scenarios in (a) Skokie, (b) Evanston, (c) Cicero, and (d) Pilsen.
of the effect of combining streetscape improvements and community transit service, but by itself accounts for a larger share of driving reductions. Such policy would therefore be most effective in this kind of neighborhood. The extensive bus coverage, higher density and fragmented urban fabric in Pilsen likely reduce the impact of providing community transit. Combining this transit option with streetscape improvement, however, helps overcome the barriers of discontinuous residential areas. Such combination has a similar effect to increasing driving costs, while combining all three policies suggests overlapping target populations. Cost policies could focus on lower fares, with streetscape improvements to further reinforce a shift towards transit.
Skokie’s and Cicero’s greater response to policy combinations (costs, streetscape improvements and community transit service) compared to other neighborhoods may be explained by low density, lower access to the Loop, and thus fewer transportation options that result in higher driving mode shares to start with (Table 6.2). In this context, location with respect to the transit station and community transit routes likely has a greater influence on mode choice, so that diverse policies may more effectively complement each other as they target different locations within the neighborhood. For example, greater pedestrian and cyclist traffic is most likely to be accomplished by streetscape improvements close to the train station and community transit stops because at low densities pedestrian and cyclist presence is more noticeable at the confluence of neighborhood trips. Community transit service, on the other hand, is more likely to influence agents living farther away from the station, but only if they live close to a transit stop; in a low-density neighborhood, accessibility is reduced. Those who cannot adequately be served by the community transit because they are far from a shuttle stop and do not live close enough to the station to use transit regularly might shift from driving only if the latter becomes too expensive. Cicero’s fragmentation (and thus lower accessibility in some areas) might explain the lower reductions in driving brought about by scenarios increasing driving cost, relative to Skokie’s continuous urban fabric as represented in the model. In higher-density neighborhoods with greater transportation choices, there is less geographical differentiation, so that different kinds of policies would influence overlapping populations. Combining policies,
therefore, would result in redundant rather than complementary effects.
We anticipated that streetscape and transportation improvements would generate the positive feedback of pedestrian and biking presence in the streets to support a widespread shift in mode share from driving to other modes. This did not happen, however. Reasons for the low impact of safety feedback can be attributed to the mechanisms that we used in our model to represent this influence. We built these mechanisms based on simplifying working assumption about how we expected commuters to respond to the presence of people on the streets, and to improvements in the built environment. Our model is a first attempt to make explicit the assumptions of how pedestrians and cyclists may assess their environment. There is little data to support these assumptions, however, particularly about the weights we attributed to each factor in the safety feedback. We conducted sensitivity tests to see the effect of these assumptions, which showed that increasing the concern for safety would only increase driving, where safety is not a concern.
6.4.2 Distances from Station
Our model allows us to disaggregate results based on location with respect to the transit station at the center of each simulated neighborhood. We examine the reductions in driving for agents located at 0 to 0.5 mile, 0.5 to 1 mile, and 1 to 1.5 miles from the station. Simulations suggest that living closer to the station encourages alternative modes of transportation in all neighborhoods, while driving is favored the further away commuters live from the transit station. Policy combinations promote greater shifts from driving in commuters living farther away from the station. The exception is Pilsen, which presents higher accessibility due to its proximity to the Loop and its wider bus coverage (Figure 6.9). Examining independent policies provides additional insights regarding their locational effect in the different neighborhood types.
Improving the streetscape has a more widespread effect on Pilsen, likely as a consequence of broader bus connectivity, land use fragmentation and proximity to the Loop; improvements can have
Shuttles
Cost scenarios
Shuttles and ideal improvements
Ideal improvements and cost scenarios
Shuttles and cost scenarios
Shuttles, ideal improvements, and cost scenarios
a direct impact attracting bus riders and cyclists throughout the neighborhood. In Evanston, the high connectivity close to the station makes the streetscape improvement less relevant than further out. Conversely, in Cicero the low density and fragmentation prevents the streetscape improvement from reducing ridership at greater distances from the station. In Skokie, we see a similar declining trend as distance increases, with the exception of lower driving reductions close to the station. A possible explanation is that those commuters closer to the station are already taking transit, while those living further out are captive drivers.
Except for Evanston, community transit contributed to widespread decline in driving. Overall, effects were more variable for commuters living close to the station, suggesting that final choice may be more influenced by randomness due to initial choices and location. More systematic decreases in driving are obtained for commuters living further away from the station. In Pilsen, the effect of distance is reduced by the presence of buses.
Skokie Evanston Cicero Pilsen
Figure 6.9: Reductions in driving share by improvement scenarios and distance from the station.
Cost policies have a widespread effect in Cicero and Pilsen, whose proximity to the Loop might provide more options when driving expenses increase. Evanston’s commuters closer to the train station are already well served by a bus and transit system, so the costs of driving are felt more by those living far from the station, who are thus encouraged to shift due to the better access to transit. In Skokie, on the other hand, the transit options are not as good, so that shifts are greater in commuters living closer to the station, but those living far from the station must depend on driving.
The combination of policies produces the greatest differential impact in Evanston and Skokie, incentivizing relatively more commuters living far from the station to reduce driving. The greater distances to the Loop reduce the options for those living far from the station, so that improvements encourage shifts and higher costs further discourage driving. Based on the observations above, however, the greater limitations in Skokie result in greater number of captive drivers far from the station. The effects of policy combinations are more widespread in Cicero and Pilsen, rather than localized by distance to the station. Cicero’s proximity to the Loop allows for driving to be a viable option until driving costs increase, in which case complementary improvements support a shift to transit. Pilsen’s high bus connectivity and its proximity to downtown increase accessibility by transit and bicycle, reducing the influence of distance to a neighborhood station.
6.5 Policy Implications
In its current form, our model recreates mode shares similar to the ones observed in the four neighborhoods of reference, and provides a reasonable explanation for these values and justification of the parameter values chosen. With this in place, the model allowed us to conduct an investigation about the potential effectiveness of a service that does not yet exist, and to understand the influence of decisionmaking mechanisms for which data is not available. Potentially, our model could be used to transfer the lessons learned here, both from understanding the effects on the four neighborhoods simulated, and from the ability of the model to represent other neighborhoods
defined by their land use and density, location with respect to a central business district, and income level.
Our model suggests that the policies explored could effectively reduce driving and shift commuters to other forms of transportation. Community transit has a significant impact and may prove to be a robust alternative in low-density neighborhoods that have few transportation options to downtown areas. In areas already offering a good coverage and reliable provision of bus service to train stations, shuttles would be redundant and less effective. If bus service, however, is unreliable, infrequent or not even available, a dedicated community transit service may support significant shifts to transit. These shifts may be reinforced when streetscape improvements target areas close to community transit stops. Policies that increase the cost of driving can reinforce the benefits of improving the provision of public transportation, particularly if limited space in denser neighborhoods requires eliminating on-street parking to allow for bike and community transit lanes.
While the positive feedback of pedestrian and cyclist presence did not have the impact we had anticipated, their influence could potentially help shift the pattern towards greater use of alternative modes if drivers, for example, are also discouraged from driving as biking and pedestrian presence increases. It will become relevant, then, to model drivers explicitly. Alternatively, transportation and streetscape quality and people’s presence may have different kinds of impact; once a minimum level of safety is reached, further physical improvements and street activity may not add to the perception of safety but to the perception of attractiveness for pedestrian and bike use. Future steps involve implementing these concepts into model mechanisms and appropriate parameter values to examine how to promote a more significant mode shift away from driving in response to streetscape and transportation improvements. This insight suggests that if safety were an issue, improvements alone are unlikely to promote the desired shifts from driving.
Mixed-use neighborhoods contain attractions for commuters on their way to work. Our current version of the model does not allow commuters to make stops during their trip. Including this possibility will involve a form of activity-based modeling, where travel decisions
will be based on activities and schedules. The household survey will provide initial data for this purpose. In concert, the various sets of models will allow further investigation into the dynamics of mode choice in significantly altered environments of urban transportation and land use.
7.1 Axtell, R.; Axelrod, R.; Epstein, J.; Cohen, M. D. (1996) Aligning Simulation Models: A Case Study and Results. Computational and Mathematical Organization Theory, 1 (1996), pp. 123-141.
ALIGNING THE ACTIVITY-BASED AND THE AGENT-BASED MODELS 7
We conducted a “docking” exercise to align the activity-based model estimated based on the SP data and the agent-based model. This process is recommended in modeling practice to see if different models can produce similar results, and thus enhance the insights derived from the results of each individual approach, provide direction for further tests and, if applicable, for the integration of modeling approaches1. After completing the activity-based model, we modified the agent-based model to reflect the parameter values and modes of the activity-based model. The modifications included: (a) updating the modes available to match the modes in the activity-based model; (b) adding a generic non-Loop destination; (c) adjusting the distribution of demographic characteristics of the agents to reflect the survey data; and (d) updating the utilities for each mode using the coefficients derived from the stated-preference choice experiments for the activitybased model.
The purpose of this experiment was to examine if the adapted agent-based model could recreate the stated preference average for all of the worksheets. We use the average for all worksheets since there was no significant difference between each individual worksheet (Section 5). We adjusted parameter values to produce the best fit between the outcomes of the agent-based model and the stated preference survey results. With the best-fitted model we ran a scenario without community transit to examine how the mode shares compared to the current mode shares reported in the survey, and analyze the impact of the proposed community transit service. As described in section 5.3, this procedure also eliminated the estimated bias from the modeled impacts.
7.1 Model Modifications
7.1.1
Modes Available
The initial agent-based model had six possible modes (drive, bus all the way, walk to the train, community transit to the train, bike to the train, and bike all the way), but we updated the options to correspond to the modes that were available in the choice experiments, which eliminated the option to take the bus all the way to the agent’s destination.
7.1.2 Destinations, Times of Travel and Parking Costs
The survey data provided detailed information on the locations of trip destinations. Our first agent-based model focused on agents whose main destination was the Loop. To capture a broader range of the commuting population (and to include markets with potential to grow in transit use) the second model incorporated the potential commute to non-Loop destinations accessible by transit (defined as within 3 miles of a CTA station).
Given the paucity of data for each neighborhood, we divided work destinations into two main categories: downtown (the Loop and the adjacent neighborhoods of the West Loop, South Loop, River North, and Streeterville) and other (everywhere else, including those staying within the starting neighborhood for their main activity). The train system in the Chicago region is centered on the downtown, and thus travel times from each neighborhood can be readily described with a normal distribution around a mean value. For all other destinations, there is greater variability in commute times from each neighborhood, even though all destinations are close to train stations. The model thus uses a normal distribution to generate times of travel to these destinations, but with a higher standard deviation to reflect the greater variability in times of travel, compared to the original agentbased model.
Free parking is assigned to agents in the adapted model based on the proportion of survey respondents with access to such benefit. For agents who pay for parking, its cost is drawn from a normal distribution similar to that estimated from the survey data.
7.1.3 Demographic Data
Initial model assumptions about bicycle and automobile ownership per household were updated with survey data. Additionally, the likelihood of an agent being a full- or part-time worker, trip purpose and importance, and associated mode preference for the type of trip are assigned to agents based on survey responses.
7.1.4 Utilities
Free
parking
is
assigned
to
agents
in
the
adapted
model
based
on
the
proportion
of
survey
respondents
with
access
to
such
benefit.
For
agents
who
pay
for
parking,
its
cost
is
drawn
from
a
normal
distribution
similar
to
that
estimated
from
the
survey
data.
7.1.3
Demographic
data
Initial
model
assumptions
about
bicycle
and
automobile
ownership
per
household
were
updated
with
survey
data.
Additionally,
the
likelihood
of
an
agent
being
a
full or
part time
worker,
trip
purpose
and
importance,
and
associated
mode
preference
for
the
type
of
trip
are
assigned
to
agents
based
on
survey
responses.
7.1.4
Utilities
Utility functions in the agent-based model were updated to reflect the constants and coefficients from the activity-based model (Table 7.1). The only exception is the neighborhood-specific constant. In the activity-based model, this constant is meant to capture differences among the neighborhoods that are not represented by the other coefficients, including aspects of the built environment, spatial distribution, street network, and densities that may affect the modal split. Given that the agent-based model explicitly represents these characteristics we do not use these constants in the modified utility functions.
The new utility setup also eliminated all of the safety components, biking penalties and transfers from the previous agent-based model. The time spent waiting for transit is counted as part of the community transit and train headways. Transit transfers are accounted for as invehicle travel time. The shuttle headway was increased to 4 minutes, from 3 minutes in the original agent-based model.
Utility
functions
in
the
agent based
model
were
updated
to
reflect
the
constants
and
coefficients
from
the
activity based
model
(Table
7.1).
The
only
exception
is
the
neighborhood specific
constant.
In
the
activity based
model,
this
constant
is
meant
to
capture
differences
among
the
neighborhoods
that
are
not
represented
by
the
other
coeff icients,
including
aspects
of
the
built
environment,
spatial
distribution,
street
network,
and
densities
that
may
affect
the
modal
split.
Given
that
the
agent based
model
explicitly
represents
these
characteristics
we
do
not
use
these
constants
in
the
modified
utility
functions.
Agents now choose a mode based on the following modespecific utility function u for mode q, where q = w for walking, q = b for biking all the way, q = r for train, q = c for biking to the train, q = d for driving all the way, and q = s for community transit to train :
The
new
utility
setup
also
eliminated
all
of
the
safety
components,
biking
penalties
and
transfers from
the
previous
agent based
model.
The
time
spent
waiting
for
transit
is
counted
as
part
of
the
community
transit and
train
headways.
Transit
transfers
are
accounted
for
as
in vehicle
travel
time.
The
shuttle
headway
was
increased
to
4
minutes,
from
3
minutes
in
the
original
agent based
model.
Agents (i) now use the following function to calculate the utility (U) for each mode (q):
Agents
(i) now
use
the
following
function
to
calculate
the
utility
(U)
for
each
mode
(q): ����! = ∑����!,!
Where:
β =
an
index
of
parameters
X =
an
index
of
attributes
for
agent
i and
for
mode
q
Where:
β = = an index of parameters
X = an index of attributes for agent i and for mode q
The
agent based
model
replicates
the
distribution
of
respondents
in
terms
of
destination,
demographics
and
preferences
(Table
7.1),
and
agents
plug
in
their
preferences
and
assigned
scores
for
each
dimension
of
utility
of
travel
into
the
mode specific
functions,
and
then
choose
a mode
probabilistically
based
on
the
(dis)utility
derived
from each
The agent-based model replicates the distribution of respondents in terms of destination, demographics and preferences (Table 7.1), and agents plug in their preferences and assigned scores for each dimension of utility of travel into the mode-specific functions, and then choose a mode probabilistically based on the (dis)utility derived from each mode (Section 6.2.4.1). At the end of the first simulated day, the main mode taken the previous day (m) is updated from the revealed preference to reflect the simulated choice for the first day.
7.2 Calibration
Running the agent-based model adapted with the activitybased model coefficients, distributions and utility functions resulted in an overall underestimation of driving and biking, and overestimation of community transit use. Several factors could explain the discrepancy between the two models, originating in the explicit spatial representation of each neighborhood, which the activity-based model assumes.
The stylized physical environment represented in the agentbased model aimed at recreating similar densities (high/low, uniform/ varied), street grids (regular and complete/fragmented), and differences in lot and block sizes. Pilsen presents large industrial areas traversed only by major arterial roads, and high-density residential areas. Cicero presents similar fragmentation due to industrial sites, but residential areas are lower in density. Skokie is represented as a uniformly lowdensity residential area with a complete street network, even if in actuality there is some fragmentation introduced by highways and railroads. Evanston has much higher density close to the station, an area covered by lake water, and a fully connected street network. One consequence of this spatial explicitness is that, while the spatial layout does not affect the time for driving or biking all the way because they are derived directly from survey data, it does affect the time it takes for agents to reach the station walking or biking because these are computed by the model based on location and street network. In addition, the assignment of demographic characteristics and origin and destination to each agent will affect the mode choice, which remains
Table 7.2 Reference and Final Best Fit Coefficients
Figure 7.1: Stated preference (SP) results from the survey against mode shares produced by the modified agent-based model.
implicit in the activity-based model. It is likely that respondents living closer to transit stations go to destinations that allow them to take advantage of transit options, while those living farther away from the station have access to a car and are more motivated to driving it, or their destination prevents them from using transit. Randomizing origin and destination and demographics rather than selectively pairing them may thus lead to underestimation of driving and overestimation of alternatives.
We attempted to reconcile the model results with the stated preference survey results by adjusting the various mode-specific constants within 2 units of the original value, and in this way account for the explicit representation of space in the agent-based model. We increased the values for the constants of modes that had been underestimated by the model (driving and biking all the way) to make them more attractive, and reduced the constants for all other modes that were overestimated (shuttles to the train, walking to the train, and biking to the train) to make them less attractive. We ran the model with all possible coefficient combinations (in 1 unit intervals) to find the best fit to the activity-based model for each neighborhood and overall for all four neighborhoods (Table 7.2).
The best fit brings the mode shares within 8% of the shares reported in the survey, while the overall fit brings the results within 14% (Figure 7.1).
7.3 Impact of Community Transit
Running the model with and without community transit using the best fit constants for each neighborhood shows that adding the shuttles can lead to noticeable reductions in driving Figure 7.2): 8 percentage points in Pilsen, 15.9 percentage points in Cicero, 28.4 percentage points in Skokie, and 7.2 percentage points in Evanston (Figure 7.2). This corresponds with the general trends that emerged from the original agent-based model.
The ability of the first model to replicate the trends of the activity-based model provides additional confidence in the first model’s
Figure 7.2: Combined model results using the neighborhood best fit coefficients comparing and testing the effect of community transit
ability to adequately represent relevant processes of modal choice that remain implicit in the activity-based model. The details of mode choice may not be as important, however, as the fact that a shuttle service is provided, and that its impact would be more noticeable in lower-density neighborhoods like Skokie and Cicero. Nevertheless, the models can provide plausible explanations for these effects, and recommendations for the design of pilot applications. The recommendations drawn from the first model thus still hold, as well as the recommendations for future directions in both research and policy design.
CONCLUSIONS 8
Basing itself on three forms of analysis—survey research, activity-based modeling, and agent-based modeling— this study has sought to investigate the potential for far-reaching improvements in the transit, pedestrian, and cycling environments of neighborhoods to trigger a shift of commuting modes away from the automobile. The three analytical approaches were used as a check against one another, and were ultimately combined into a single model designed to explore both impacts of potential changes and alternatives for implementation the contemplated improvements.
Within the context of the four neighborhoods studied, the analysis suggests the potential for significant modal shifts. Larger shifts are foreseen in neighborhoods that are less transit-oriented to begin with, though there is probably a limit to this phenomenon: neighborhoods studied were limited to those within the city limits or in first-ring suburbs.
A comparative analysis with Copenhagen, chosen as a world leader in cycling, pedestrianism, and transit use was informative in many ways. The city achieves remarkable levels of uses of non-automotive transportation modes, a product of high levels of service, together with supportive land-uses, urban designs, and associated policies, particularly in pricing. This research contemplated a much narrower set of feasible improvements in U.S. metropolitan context. Not surprisingly, these policies are not anticipated to lead to Copenhagenlevel outcomes. But findings suggest that significant gains may be realized nonetheless.
The automated vehicle system conceived of here was a fixedroute, fixed-schedule, bus-like vehicle circulating frequently around neighborhoods and delivering passengers to the regional rail station. More research is needed to investigate the implications of alternative configurations of such a system. Options may include flexibly routed or scheduled vehicles and a mix of single-party and multiparty vehicles. Scheduling alternatives for a flexible system may include real-time or advance service requests. Service may be exclusively focused on transit access, or may deliver passengers all the way to their destinations under certain conditions. Research is also needed on the regulatory and institutional environment that such systems would face, including currently existing regulations that may impede adoption and the implications of different institutional models of service delivery.
The vision of automated travel over roadways seems considerably closer in technological terms at the conclusion of this work than it did at its outset. Yet progress will not be merely a function of advancing technology. Rather, policies directed at shaping the deployment of the technology and the institutions that are built to enable it will shape, in large measure, the directions that the technology serves. Research and development directed at deploying the technology to improve alternatives to the private car can be an important part of this mix. Results of this study should assist policy makers in deciding whether and in what way to proceed in these directions.
APPENDICES A
A1.1 Frederiksberg Kommune, The History of Frederiksberg. Frederiksberg Kommune. Web. 10 Oct. 2010. <http://www. frederiksberg.dk/OmKommunen/ English/HistoryOfFrederiksberg. aspx>.
An element of the current project was a comparison of US case studies with a global leader in transit, cycling, and pedestrianism. This comparison was designed to establish an ambitious goal for the transformation of US metropolitan areas and to learn about the approach of another region to urban design and transportation planning. Selected for this purpose was the city of Copenhagen, Denmark. More specifically, the study focused on a close-in urbanized suburb roughly compable to the four Chicago neighborhoods studied. Frederiksberg is its own municipality with its own constitution, but lies completely within the city limits of Copenhagen. Frederiksberg is approximately 9 km2, and has a population of 92,000. It is the densest municipality in Denmark, with 10,477 residents per square kilometer (4,044 per square mile).1
Table A1.1 Socio-demographic characteristics 2
Average disposable income for families living in Frederiksberg (2008)
Average disposable income for families living in Denmark (2008)
275,000 DKK ($52,000 USD)
290,000 DKK ($55,000 USD)
Average family size in Frederiksberg 1.63 people
Figure A1.1 Map showing Frederiksberg municipality in relation to city center and Copenhagen city limits
Figure A1.2 Frederiksberg Central Metro Station
Table A1.2 Chicago mode shares for work trips, 2008 7
Residents of Frederiksberg have a total of 22,761 cars, less than 1 car for every 4 people living in the municipality. In comparison, in nearby Ørestad city there is more than 1 car for every 2 people. Car ownership in the City of Chicago is similar, to Ørestad, with one car for every 2.3 people.4
Table A1.3 Car Ownership
Transit Pass Holders 5
A1.5 Munck, Jeppe. “Metro Ridership.” Message to the author. Metro Communications Department. 19 Oct. 2010. E-mail.
Figure A1.4 Modal Split: (a) All trips shorter than 5km taken in 2006; (b) All trips taken in 2006; (c) All trips taken in 2003
Figure A1.3 Bike users in Frederiskberg
Table A1.4 Transit Pass Holders
Byernes trafikarealer
Hæfte 0
Vejplanlægning i byområder
A1.5 “Traffic rules for urban areas.” Denmark Planning Authority
A1.2 The Danish Approach to Transportation Guidelines, Regulations and Standards
The resources available to all municipalities in Denmark for the planning of transit environments are available in Danish at www. vejrejler.dk. These are used at the beginning of all projects at the Department of Road and Park for the Frederiksberg municipality and provide guidelines for road design, pedestrian pathways, bicycle lanes and public spaces.
These resources offer the primary outline and content of this document, with supporting material from Gehl Architects, a firm based out of Copenhagen that specializes in Danish urban planning principles. Urban design techniques used in Copenhagen were adapted for incorporation into the illustrated scenarios presented to survey respondents in the current study.
Figure
Figure A1.6 At intersections along major roads, rather than providing a direct path for cars to turn in and out of side streets, pedestrian walkways and bicycle lanes continue straight through, creating a curb for cars rather than cyclists and people. Frederiksberg, Denmark
Seamless integration between metro and bus network
Designated bicycle lanes separated from car traffic
High volume bicycle parking facilities for metro users
High quality paving and ample space for pedestrians
Figure A1.7 Users can quickly and comfortably transition from pedestrians to bicyclists to bus or metro users at Forum Metro Station. Frederiksberg, Denmark
Prioritize Pedestrians First, then Bicyclists, Transit Users, and Finally Cars, not the Other Way Around Equal Access 8
The planning of the city’s transit and pedestrian system must fully take into account whether changes being considered will help give all disability groups a satisfactory, safe and accessible journey. This means well designed exchange places for switching between transport modes, and avoiding stairs and large elevation increases whenever possible.
Freedom, Convenience and Comfort
A1.8 Vejplanlægning I Byområder, Road Planning in Urban Areas. Copenhagen, Denmark: Vejdirektoratet, Denmark’s Road Directorate, Oct. 2000. PDF. 7.1
After several decades of actively restructuring the priority of transportation planning towards pedestrians, bicyclists and transit users, Frederiksberg has become a valuable model for the efficacy and ease-of-use of its transportation network. The foundation for these improvements is an approach to transportation in terms of establishing freedom, convenience and comfort for all residents within the city. The approach has inspired the term ‘mobility oriented design’ 9
Integrate Transportation Networks
Figure A1.12 Overlap of bicycle lane network and train and metro network. Copenhagen, Denmark
Figure A1.10 Seats designated for bicyclists on the metro. Copenhagen, Denmark
Figure A1.8 Metro users can bring their bike on the metro for free. Frederiksberg central station
Figure A1.9 Elevators for disabled users, strollers, and bicycles. Frederiksberg central station
Figure A1.11 Direct access to metro from bus and bicycle lanes. Fansanvej station
- trafikveje og - lokalveje.
Figure A1.13 Road network (Vejplanlægning I Byområder Figure 1)
Figur 1. Vejnettet
Carriageways
Traffic calming for local roads
Figure A1.14 Path network (Vejplanlægning I Byområder Figure 4)
Figur 4. Stinettet
Main paths
Trafikvejene Trafikvejene omfatter samtlige veje i kommunens overordnede vejnet. De betjener den gennemkørende biltrafik, trafikken mellem kommunen og omverdenen, mellem de enkelte bysamfund, og mellem de enkelte kvarterer i den større by.
Create a Safe and Efficient System for Streets
The Speed Differential Network10 System of Categorizing Roads
Figur 5. Separat sti Local roads Local paths
Carriageways cover all roads in the municipality’s primary network. They serve through-traffic, traffic between the municipality and the inner-city, and between each urban community within the greater city area.
Local roads are all other roads in the municipality. They serve local areas and individual homes, workplaces, institutions and shops.
System of Categorizing Paths
Figur 2. Trafikvej
A1.10 Vejplanlægning I Byområder, Road Planning in Urban Areas. Copenhagen, Denmark: Vejdirektoratet, Denmark’s Road Directorate, Oct. 2000. PDF. 2
Main paths commonly run along carriageways and are almost always separated physically from street traffic by a small curb for bicyclists and another curb for pedestrians. This is necessary as a matter of safety for pedestrians and bicyclists along roads with higher speed traffic. They can also be fully separated paths that identify a desired route for high speed bicycle traffic (ie: the green route in Frederiksberg)
9
Local paths lie in traffic calmed areas. They allow bicycle access to destinations within these areas. It is less necessary for bicycle lanes to have curbs on these roads since automobile traffic moves slower and there are fewer safety issues for bicyclists.
paths are separated by a grade change.
local roads there is less of a need for designated bicycle lanes as cars can only move at safe speeds. Here, pedestrians and cyclists have priority to the street space.
Figure A1.15 Carriageway showing safety of all road users. Both bicycle and pedestrian
Frederiksberg, Denmark
Figure A1.16 On
Frederiksberg, Denmark
A1.17 The green route cuts through primary destinations in Frederiksberg municipality and provides a safe route for pedestrians.
A1.19 Well designed and maintained public restrooms are an important amenity for pedestrians. Frederiksberg, Denmark
A1.3 The Pedestrian Environment Walkability
Figure A1.21: Share of trips in 2006 that are comprised of walking to and from destinations: 25% 11
At one point or another, all trips begin and end with walking. Thus, strong pedestrian networks, pedestrian walkways, crossings atgrade, attractive transit entrances and waiting areas are an essential starting point. The pedestrian network in Frederiksberg provides direct access to all local destinations, including schools, work, and transit stations, and offers choices of pleasant and interesting routes. Examples of adopted design principles follow on the following pages.
Figure
Frederiksberg, Denmark
Figure A1.18 Active ground floors offer inviting streetscapes for pedestrians along Værnedamsgade. Frederiksberg, Denmark
Figure
Figure A1.20 The park network provides opportunities to escape the noise of the city as well as alternate pedestrian routes. Frederiksberg, Denmark
Figure A1.22 Pedestrian and bicycle path for high speed travel along the border of the CBD. Frederiksberg, Denmark
Figure A1.23 Signage to show continuation of pedestrian path along the Green Route. Frederiksberg, Denmark
A Network of Walkways
Clarity 12
A1.12 Vejplanlægning I Byområder, Road Planning in Urban Areas. Copenhagen, Denmark: Vejdirektoratet, Denmark’s Road Directorate, Oct. 2000. PDF. 5.1.6
A1.13 Ibid. 5.1.5
A1.14 Ibid. 5.1.4
Figure A1.24 Wide, at-grade crossing for pedestrians returning to Frederiksberg from the CBD. Frederiksberg, Denmark
The pedestrian network should be uncluttered and easy to navigate in. Its structure should be consistent with the city’s structure.
Coherence 13
Network parts must hang together. Lack of consistency will act as a detour and reduce the use of the network.
The pedestrian network should be based on a registration of existing high quality walkways, and an assessment of the opportunity to provide the context often missing between existing paths with high quality pedestrian environments such as active ground frontages and well-landscaped features.
Direct Routes 14
Cyclists and pedestrians are very sensitive to detours, and paths will only be used properly if they are the shortest route between starting points and goals. Detours should be minimized both horizontally and vertically. Stairs and long steep ramps are strong deterrents, especially for the disabled.
Figure A1.25 School children are provided safe bicycle paths along Gammel Kongevej. Frederiksberg, Denmark
Figure A1.26 Speed bump before and after crossing ensures safety of pedestrians. Frederiksberg, Denmark
Figure A1.27 Pedestrian walkways and bike lanes continue through intersections to secondary roads. Frederiksberg, Denmark
A1.15 Vejplanlægning I Byområder, Road Planning in Urban Areas. Copenhagen, Denmark: Vejdirektoratet, Denmark’s Road Directorate, Oct. 2000. PDF. 4.1.7
A1.16 Ibid. 5.1.9
A1.17 Ibid. 5.8.4
A1.18 Ibid. 5.1.3
Safety and Efficiency for Pedestrians Routes to School 15
Under the Road Traffic Act 3, police and road authorities must consult schools to take measures to protect children as bicyclists and pedestrians against the dangers of vehicular traffic on their way to and from school. This is one of the many tasks of the road authority in securing traffic safety, and one that require great care in planning and design of traffic systems. Planning of the city’s roads and paths must to the greatest extent possible be coordinated with the school district planning commission.
Lighting 16
The design of pedestrian routes and their environments must ensure that they can be lit properly.
Speed Dampening 17
• Speed dampening can be achieved through
• Bumps before and after a crossing
• Construction of the crossing on a raised surface
• Shifting of traffic lanes
• Narrowing of traffic lanes
Minimize Obstructions18
The number of intersections, crosses and grade changes should be as small as possible. Pedestrians and bicyclists should rarely need to go up or down a curb during a direct path of travel.
Experience of Travel
Ground Floor Frontages
Det Visuelle Miljø chap 10 (the visual environment)
Routes that offer varied experiences, are more attractive and feel shorter than others. This can be achieved through spatial variety, consideration of sensory experiences, and active ground floor frontages. Routes should run along streets with many activities in the ground floor and varied facades.
Mixed Use
Including a mix of uses in the ground floors of buildings in an urban context allows for more interesting experiences for pedestrians, and the opportunity to meet basic shopping needs along pedestrian routes.
Scale and Rhythm
Humans walk at a speed of 5km/hr.
Ground floors with many doors and a many small units create a stimulating experience for pedestrians, rather than for cars.
Appeal to Many Senses
All our senses are activated when we are close to buildings that provide interesting impressions and opportunities.
på figur 5 viser et fodgængerområde i en bymidte. Skitsen indeholder betegnelser for de fleste af de elementer som kan indgå i et fodgængerområde.
følgende afsnit beskrives de enkelte elementer, deres dimensioner og geometriske udformning i øvrigt.
Speed bump and street bend to slow traffic
Design Specifications for Pedestrian Areas
Pedestrian Area Design Elements19
Traffic should be calmed at entry points into pedestrianized areas. Basic parking facilities at periphery of pedestrian areas should be provided for handicap automobile users and bicycle users. Crossover points between, pedestrians, cyclists, and cars should be handled with care, and speed dampening devices should be applied where necessary to ensure safe conditions for all users.
Designated pedestrian only street
5. Geometriske elementer
A1.29 Street design (1)
Signalled Crossings 20
It should be emphasized that signal regulating a crossing does not necessarily lead to improved security. Signal crossings should be used when one of the following applies
• Particular accident risk
• High intensity of light users and long waits
• A strong need for speed dampening.
Pavings 21
Fodgængerarealerne i gågader, på torve og pladser etc. bør udformes i harmed bebyggelsen omkring dem. De bør være smukke, og samtidig funktionelle, nemme og behagelige at færdes i - og der skal være tilstrækplads til de gående.
A1.22 Forudsætninger for den geometriske udformning, Prerequisites for Street Dimensions. Copenhagen, Denmark: Vejdirektoratet, Denmark’s Road Directorate, Oct. 2000. PDF. 3.5
For reasons of mobility-impaired, wheelchair users, people with prams and recurring fashion phenomena such as high-heeled shoes, it is important that pavement is smooth and slip resistent in wet conditions. Pavings can also denote when “something happens” for example, a change in materials can indicate an entrance to a courtyard, public space, bus stop, seating option etc.
Pedestrian sidewalk geometry22
A1.5 Fodgængerområder figure 23
Table
Figure
A1.30 The Green Route provides a safe, two-way bicycle road with access to all primary destinations in Frederiksberg.
A1.32 A separate system of lights and pathways give bicyclists clarity. Blue pathways in intersections warn drivers of cyclists.
A1.33 Turning lanes prevent backups on
and allow through-cyclists to continue without obstruction.
A1.4 The Bicycle Environment Assumptions for Planning
24
The bicycle path network must:
• Be safe and secure
• Be accessible
Figure A1.34 Share of trips in 2006 that are comprised of bicycling to and from destinations: 34% 26
A1.24 Vejplanlægning I Byområder, Road Planning in Urban Areas. Copenhagen, Denmark: Vejdirektoratet, Denmark’s Road Directorate, Oct. 2000. PDF. 4.1
A1.25 ITDP and Gehl Architects. Our Cities Ourselves: The Future of Transportation in Urban Life. New York, NY, 2010. Print.
“The municipality estimates that for every 10% of the population that bicycles to work and school every day, the city reaps significant economic savings. Estimates include healthcare savings of DKK 59 million (USD 10 million, EUR 8 million) annually while boasting the labour market with 57.000 more workdays and adding 61.000 extra years of life (Municipality, 2007). Because of a good bicycle network and a developed bike culture, Copenhageners continue bicycling even in winter.” 25
Figure
Figure A1.31 All primary destinations in Frederiksberg provide ample parking for bicyclists.
Figure
Figure
bicycle lanes
Figure A1.35 Bicycle network
Roads with separated bicycle lanes
The green route (two-way bicycle path)
Figure A1.36 Road with separated bicycle lanes. Frederiksberg, Denmark
A1.37 The Green Route twoway bicycle path. Frederiksberg, Denmark
A1.27 Vejplanlægning I Byområder, Road Planning in Urban Areas. Copenhagen, Denmark: Vejdirektoratet, Denmark’s Road Directorate, Oct. 2000. PDF. 5.1.6
A1.28 Ibid. 5.1.5, 5.3.1
A1.29 Ibid. 5.1.2
A Network of Bicycle Routes
Clarity 27
The bicycling network should be uncluttered and easy to navigate in. Its structure should be consistent with the city’s structure. Trails should be located such that they bring cyclists through hallmarks that give them context for their location in a city.
Coherence 28
Network parts must hang together. Lack of consistency will act as a detour and reduce the use of the network.
It is important to create a main bike lane system, with high quality lanes along busy roads, but it is equally important to establish local paths in areas connecting to the main network, which can typically happen with smaller funds.
Connected 29
The bicycle and pedestrian network should take careful consideration to connect pedestrian and bicycle destinations such as
• Schools
• Child care centers
• Shopping centers
• Metro and train stations
• Bus stops
Bicycle parking should also be provided at each of these destinations to accommodate cyclists.
Figure
Figure A1.38 Cars must go over a speed-bump in order to cross bicycle route while cyclists continue forward without delay. Frederiksberg, Denmark
A1.39 Light posts along the Green Route both identify route and provide safety for cyclists. Frederiksberg, Denmark
Figure A1.40 Waiting areas for busses that lie outside of bicycle paths reduce conflicts between pedestrians and bicyclists. Frederiksberg, Denmark
Safety and Efficiency for Bicyclists Methods of Ensuring Safety for Bicyclists30
• Construction of separated bicycle paths along busy roads
• Adjustment of car speed
• Careful consideration and securing of points where pedestrians and bicyclists cross paths with car traffic
• Securing of points of conflict between bicyclists and pedestrians (ie bus stops on roads with bike paths)
Minimize Obstacles and Obstructions 31
The number of intersections, crosses and grade changes should be as small as possible. Bicyclists should rarely need to go up or down a curb during a direct path of travel.
Lighting 32
The design of bicycle routes and their environments must ensure that they can be lit properly.
A1.30 Vejplanlægning I Byområder, Road Planning in Urban Areas. Copenhagen, Denmark: Vejdirektoratet, Denmark’s Road Directorate, Oct. 2000. PDF. 5.1.1
A1.31 Ibid. 5.1.3
A1.32 Ibid. 5.1.9
A1.33 Ibid. 5.1.10
Snow Removal 33
Bicycle paths should have a smooth and solid surface that is maintained continuously. Continual maintenance is necessary to ensure safety, security and accessibility. Poorly maintained paths can be equally as dangerous as poorly maintained roads.
Figure
trafik
Design Specifications
Principal Section34, 35
On main roads with fast moving traffic, bicycle lanes should be separated from cars and pedestrians by a curb or clear physical barrier.
Parking should as a rule be placed on the outside of bicycle lanes, between cyclists and moving cars. This way, parked cars serve as a buffer between moving cars and soft road users.
Types of Bike Lane35
1. Car-free paths: the Green Route
2. Separated lanes: Carriageways will often constitute the most direct routes to the main traffic destinations, and therefore be frequented by many cyclists and pedestrians. Where it is not possible to devise a convincing alternative, bike lanes along carriageways should be constructed as separate trails, or the roads should be converted to local roads through traffic calming devices.
3. Bicycle strips: on local roads, or roads where traffic is limited, a bicycle strip can be established by a continuous edge line on the pavement. This should refer to space where cars cannot park in the designated area. If there is parking on the street, it should be positioned on the outside of the bicycle lane.
A1.35 Vejplanlægning I Byområder, Road Planning in Urban Areas. Copenhagen, Denmark: Vejdirektoratet, Denmark’s Road Directorate, Oct. 2000. PDF. 5.1.1
A1.36 Forudsætninger for den geometriske udformning, Prerequisites for Street Dimensions. Copenhagen, Denmark: Vejdirektoratet, Denmark’s Road Directorate, Oct. 2000. PDF. 3.5
Bicycle Lane Geometry36
A minimum width bicycle lane of 2 m can hold 2000 cyclists/ hour. For each additional meter, the capacity increases by 1500 cyclists.
In pedestrian areas where there are no cars, bicycle lanes should be a minimum of 1.85 m wide and preferably 2.5 m wide. Clear height should be 2.5 m.
Figure A1.41 Street design (2)
A1.42 Above-ground information system displays live information on waiting times for the metro. Frederiksberg, Denmark
and comfortable
A1.5 The Public Transportation Environment Assumptions for Planning
37
The transit network must be:
Figure A1.46 Share of trips in 2006 that involve transit use: 12% 39
A1.37 Vejplanlægning I Byområder, Road Planning in Urban Areas. Copenhagen, Denmark: Vejdirektoratet, Denmark’s Road Directorate, Oct. 2000. PDF. 6.1
A1.38 ITDP and Gehl Architects. Our Cities Ourselves: The Future of Transportation in Urban Life. New York, NY, 2010. Print.
“Some trips are too long to make walking or cycling a viable option. As growing traffic from private cars and trucks slows down buses, cities need to intervene to improve their public transit systems. Mass transport can move millions of people quickly and comfortably using a fraction of the fuel and street space required by automobiles”.
38
Figure
Figure A1.43 Free internet
seating encourage bus use by all demographics. Frederiksberg, Denmark
Figure A1.44 Driverless metro provides frequent service and free bicycle access. Frederiksberg, Denmark
Figure A1.45 Elevators at metro stations provide easy access for wheel chair users and cyclists. Frederiksberg, Denmark
Experience of Use
Transit Stations 40
Bus stops and transit stations should provide shelters and bike racks. Transit stations should be positive environments for pedestrians to move through and to linger, they should act as vital public spaces within a city’s framework.
Frederiksberg Central Station
3,628,555 riders in 2009
The way a metro is experienced by users has a large effect on ridership. Frederiksberg Central Station provides several amenities.
• Attractive entrance and exit points
• Positive scale and climatic conditions
• Cafe seating and public seating for informal gathering
• High volume of bicycle parking
Lindevang Station
1,073,237 riders in 2009
With a comparable density of surrounding residential units, Lindevang Station has significantly fewer metro users.
• Users exit into parking lot and busy street
• Poor interchange with bus network
• Few opportunities for sitting or informal gathering
Table A1.6 Metro ridership from the four stations in Frederiksberg in 2009 41
A1.40 Vejplanlægning I Byområder, Road Planning in Urban Areas. Copenhagen, Denmark: Vejdirektoratet, Denmark’s Road Directorate, Oct. 2000. PDF. 6.1.2
A1.41 Munck, Jeppe. “Metro Ridership.” Message to the author. Metro Communications Department. 19 Oct. 2010. E-mail.
Figure A1.47 Frederiksberg Central Station
Figure A1.48 Lindevang Station
Figure A1.49 Forum Metro Station. Frederiksberg, Denmark
Transit Level of Service
Convenience 42
Routes should have high frequency, so that the wait will be short. The community transit that was modeled for four Chicago neighborhoods as part of this study was desinged to provide similar levels of service.
Table A1.7 Frequency of service running through Frederiksberg 43
- 10:00
- 18:00
Vanløse Station
Station Flintholm Station
Central Fasanvej Station
A1.42 Vejplanlægning I Byområder, Road Planning in Urban Areas. Copenhagen, Denmark: Vejdirektoratet, Denmark’s Road Directorate, Oct. 2000. PDF. 6.1.2
A1.43 “Køreplan.” Københavns Metro. Web. 8 Oct. 2010. <http:// www.m.dk>.
Figure A1.50 Forum Metro Station. Frederiksberg, Denmark The Frederiksberg Metro Line, time to down town
Affordability
Transit Costs44
Transit fares for one-time payers
2 zones (minimum, all downtown travel)
3 zones (outer areas of city + airport)
Each zone extra increases ticket price by 10 DKK
Transit fares for pass holders
Cost of 1 month 2 zone transit pass
Cost of 1 month 3 zone transit pass
Students recieve 60% discount on monthly cards
Other options
Cost of a 10 trip clipcard for 2 zones
Cost of a 10 trip clipcard for 3 zones
20 DKK (Approx. $3.70)
30 DKK (Approx. $5.50)
Chicago: $2.25
Chicago: $55-$500
320 DKK (Approx. $60)
450 DKK (Approx. $84)
130 DKK (Approx. $24)
170 DKK (Approx. $32)
A1.44 “Priser og Billeter.” Københavns Metro. Web. 8 Oct. 2010.<http:// www.m.dk>.
Figure A1.51 Frederiksberg Central Station. Frederiksberg, Denmark
Table A1.8 Travel Costs Comparison
A1.45 Vejplanlægning I Byområder, Road Planning in Urban Areas. Copenhagen, Denmark: Vejdirektoratet, Denmark’s Road Directorate, Oct. 2000. PDF. 6.1.2
Accessibility
The overall transit network must provide good accessibility to major traffic targets in the city and reasonable accessibility to all traffic targets.45
Morrison, Joshua I. Field Survey. Oct. 2010. Raw data. Conducted in Frederiksberg Denmark.
Figure A1.52 Distance to retail concentrations from Frederiksberg Central Station (Field survey)
Fisketolv
Frederiksberg
Access to transit
12 min catchment area
6 min catchment area
Figure A1.53 Distance to metro stations by walking (Field survey) 6 min catchment area
Figure A1.54 Distance to metro stations by bicycling (Field survey)
Access to transit
12 min
9 min
-peak: 11 min
8 min
-peak: 14 min
8 min
-peak: 9 min
4 min
-peak: 6 min
10 min
-peak: 13 min
A1.55 Distance to metro station by bus - test rides (Field survey)
Test rides
A1.56 Distance to metro stations by bus (Field survey) Peak travel 6 min catchment area Off-peak travel 6 min catchment area
Figure
Figure
TRAVEL DIARY
Travel Diary: Main Tour-Tour #1 and Tour #2 and #3
TRAVEL DIARY
This collection of information is voluntary and will be used to gauge potential travel‐behavior response to far‐reaching improvements in the pedestrian, cycling, and transit environments of neighborhoods. Public reporting burden is estimated to average 1 hour and 45 minutes per response, including the time for reviewing instructions searching existing data sources, gathering and maintaining the data needed, and completing and reviewing the collection of information. Please note that an agency may not conduct or sponsor, and a person is not required to respond to, a collection of information unless it displays a currently valid OMB control number. The OMB control number for this collection is 2125‐0629 Send comments regarding this burden estimate or any other aspect of this collection of information, including suggestions for reducing this burden to: Information Collection Clearance Officer, Federal Highway Administration, 1200 New Jersey Avenue, SE, Washington, DC 20590.
Please complete the travel diary on WEEKDAY, MONTH, DAY, YEAR. If you did not take any trips on the date assigned, please complete the diary on the next weekday that you did commute.
1. Please start your day at 4:00 A M What was the address of your location at that time? Please provide either an address or an intersection.
2. Please note what this location was—your home, workplace, etc.
1 Home
2 Workplace
3 Some other place → PLEASE SPECIFY:
Main Tour—Tour #1
Now think about the main activity of your day. If you went to work on this day, that is probably your main activity. Otherwise, it could be going to school or doing some shopping or leisure activity. For example, if you went to the office for one hour and then spent the rest of the day shopping, your main activity would be shopping.
3. What was the address of your main activity? Please provide either an address or an intersection. If your main activity took place at multiple locations, please choose the address that you consider to be the most important of the day.
4. What was this location?
7 Some other location → PLEASE SPECIFY:
5. How many stops did you make along the way to your main activity?
1 0 stops
2 1 stop
3 2 stops
4 More than 2 stops → PLEASE SPECIFY HOW MANY:
The following questions address your travel to and from these stops. If you made more than two stops on the way to your main activity, please select the two that you view as the most important for you and discard the rest. For example, if you stopped to drop your kids off at school, to buy some supplies for the office, and to visit your mother, you might select the stop to drop your kids off and the stop to visit your mother and would throw out the stop for supplies.
Please answer the following questions with regard to your main trip of the day, including up to two stops you may have made along the way.
6. What was the address of this destination? Please provide either an address or an intersection.
destination?
8. Time you left to go to this location:
9. Time you arrived at this location:
10. Please give your best estimate of about how long the trip was in miles.
11. How did you get there?
PLEASE SELECT ALL THAT APPLY.
12. If you drove, how much did you pay to park for this trip? $
13. If you drove, how much did you spend on highway tolls for this trip?
Now please tell us about the return trip from your main activity to your final destination for the day.
14. How many stops did you make from your main activity location to your final destination for the day?
1 0 stops
2 1 stop
3 2 stops
4 More than 2 stops → PLEASE SPECIFY HOW MANY:
The following questions address your travel to and from these destinations. If you made more than two stops on the way to your final destination, please select two of the stops and discard the rest. For example, if you stopped to get gas, to buy some supplies for the office, and to visit your mother, you might select the stop for gas and the stop to visit your mother and would throw out the stop for supplies.
15. What was the address of this destination?
Please provide either an address or an intersection.
a. TRIP SEGMENT #1 (First stop)
b. TRIP SEGMENT #2 (Second stop, if applicable)
c. TRIP SEGMENT #3 (Final stop, if applicable)
17. Time you left to go to this location:
18. Time you arrived at this location:
19. Please give your best estimate of about how long the trip was in miles.
21. If you drove, how much did you pay to park for this trip?
22. If you drove, how much did you spend on highway tolls for this trip?
If the only travel you did on this day was to and from your main activity, then you are finished completing the travel diary. Thank you!
If you took any trips either before or after your travel to your main activity, we would like you to tell us about them in the sections on Tours #2 and #3.
Tours #2 and #3
23. Other than this tour to and from your main activity for the day, did you go out before or after that trip on this day? 1 Yes 2 No →END. Thank you!
24. How many times did you go out besides your trips to and from your main activity? ...... times
If you went out more than two times aside from your main activity, please select two of these tours that include the most important activities you did to tell us about.
25.
26. What modes of transportation did you use to get there and back? PLEASE SELECT ALL THAT APPLY.
27. Time you left to go to this location:
28. Time you arrived at this location:
29. Time you arrived back at your final destination:
30. How many total stops did you make on your way there and back? (For example, if you made one stop on the way there and two stops on the way back, then you made three stops total.)
Thank you for completing the
Worksheets #1 to #6 (per site)
CTA
Station Hoyne/Damen (Pilsen, Chicago)
Intersection of W Cullerton St and S Damen Av.
WORKSHEET #1
The interviewer will give you values to fill in this worksheet. These are the choices you’d have available to you for a trip in the new environment we’ve sketched in image #1. Please think about how you might get to your current destination in this new environment.
Figure A2.1 Worksheet #1. CTA Station Hoyne Damen. Pilsen, Chicago. Image A
WORKSHEET #2
The interviewer will give you values to fill in this worksheet. These are the choices you’d have available to you for a trip in the new environment we’ve sketched in image #2. Please think about how you might get to your current destination in this new environment.
Figure A2.2 Worksheet #1. CTA Station Hoyne Damen. Pilsen, Chicago. Image B
WORKSHEET #3
The interviewer will give you values to fill in this worksheet. These are the choices you’d have available to you for a trip in the new environment we’ve sketched in image #3. Please think about how you might get to your current destination in this new environment.
Figure A2.3 Worksheet #1. CTA Station Hoyne Damen. Pilsen, Chicago. Image C
WORKSHEET #4
The interviewer will give you values to fill in this worksheet. These are the choices you’d have available to you for a trip in the new environment we’ve sketched in image #4. Please think about how you might get to your current destination in this new environment.
Figure A2.4 Worksheet #1. CTA Station Hoyne Damen. Pilsen, Chicago. Image D
WORKSHEET #5
The interviewer will give you values to fill in this worksheet. These are the choices you’d have available to you for a trip in the new environment we’ve sketched in image #5. Please think about how you might get to your current destination in this new environment.
Figure A2.5 Worksheet #1. CTA Station Hoyne Damen. Pilsen, Chicago. Image E
B Transportation Improvements
WORKSHEET #6
The interviewer will give you values to fill in this worksheet. These are the choices you’d have available to you for a trip in the new environment we’ve sketched in image #6. Please think about how you might get to your current destination in this new environment.
C Transportation Improvements
D Transportation Improvements
E Transportation Improvements
F
Figure A2.6 Worksheet #1. CTA Station Hoyne Damen. Pilsen, Chicago. Image F
APPENDIX 3
PRE-SURVEY COMMUNICATION WITH POTENTIAL
Recruitment Letter
Dear Resident:
RESPONDENTS
Survey Research Laboratory (MC 336)
600 College of Urban Planning and Public Affairs Hall
412 South Peoria Street
Chicago, Illinois60607
We are writing to ask for your help with a study for the U.S. Department of Transportation that is being conducted by the University of Illinois at Chicago (UIC). The study is about how people in your area travel, and how those choices are affected by opportunities in your neighborhood and beyond. We are interested in talking with people who travel in all sorts of ways including driving, bicycling, and taking public transit.
Your household was chosen to take part in this study because of where your home is located within the Chicagoland area. Enclosed you will find a form letter with a few questions that an adult from your household can complete to express interest in participating. Once you return the letter to us in the enclosed, postage-paid envelope, we will determine your eligibility based on your answers. If you are eligible, we will mail you a packet of information that includes a travel diary, some images, and additional information about this research study. We will also ask you to participate in a telephone interview that asks questions about what you’ve recorded in your travel diary. Participation is voluntary and you are free to withdraw at any time. To express our appreciation for your time and effort contributing to this research, we will mail you a $50 check upon completion of the phone interview.
We will keep all of the information about you strictly confidential. Your answers to the interview will be connected to a unique case-id number and will not be connected to your phone number or address. Your phone number and address will never be used except to contact you, and to mail your check after your phone interview. Once you return the letter, if you are eligible, you will receive a study packet within 2-3 weeks from UIC. If you don’t hear from us, you are not eligible to participate.
I am the principal investigator of this study, and I am a professor and researcher at UIC. All data collection is being managed by the Survey Research Laboratory (SRL) here at UIC. You can access more information about this study on this website: http://www.srl.uic.edu/1107FAQ-1.htm
Thank you for your help.
Sincerely,
Dr. Moira Zellner Assistant Professor Urban Planning and Policy
Recruitment Letter
Survey Research Laboratory, University of Illinois at Chicago
2. Please give the location (either the street address or cross-streets) of your work or school: Street _________________________________________________________________________ City, State, ZIP _________________________________________________________________
3. In a typical week, how many times do you go to your nearest Chicago Transit Authority (CTA) rail station, or within half a mile of that station?
0 times
Less than 1 time
Between 1 and 2 times 3 or more times
This collection of information is voluntary and will be used to gauge potential travel-behavior response to far-reaching improvements in the pedestrian, cycling, and transit environments of neighborhoods. Public reporting burden is estimated to average 1 hour and 45 minutes per response, including the time for reviewing instructions searching existing data sources, gathering and maintaining the data needed, and completing and reviewing the collection of information. Please note that an agency may not conduct or sponsor, and a person is not required to respond to, a collection of information unless it displays a currently valid OMB control number. The OMB control number for this collection is 2125-0629. Send comments regarding this burden estimate or any other aspect of this collection of information, including suggestions for reducing this burden to: Information Collection Clearance Officer, Federal Highway Administration, 1200 New Jersey Avenue, SE, Washington, DC 20590. Response Letter
600 College of Urban Planning and Public Affairs Hall 412 South Peoria Street Chicago, Illinois60607
We want to express our appreciation for your interest in participating in this research study on transit behavior. Your contribution to this important project will help to ensure that it is a success. We have received funding from the U.S. Department of Transportation to study how people in your area travel, and how those choices are affected by opportunities in your neighborhood and beyond.
Enclosed you will find a travel diary which we need you to complete on DATE. Soon after you complete the diary, an interviewer will call you to ask you questions about your travel on DATE. You will use the enclosed images during the telephone interview, and the interviewer will ask you how your decisions to get from place to place might change based on changes in your neighborhood. To express our appreciation for your time and effort contributing to this research, a $50 check will be mailed to you upon completion of the travel diary and 75% of the phone interview.
Your participation in this research study is completely voluntary. The instructions for filling out the travel diary are inside the booklet. A consent information document describing the study is also enclosed for you to keep for your records.
All information you supply is confidential. Your responses will be combined with those of approximately 800 others, and analyzed as a group. We will destroy your contact information at the conclusion of the study.
If you have questions about completing the travel diary or about the telephone interview, please call Anne Diffenderffer at (312) 413-0492 or e-mail her at afulle2@uic.edu. You can also find an FAQ about this study on this website: http://www.srl.uic.edu/1107FAQ-1.htm
If you have questions about the research study in general, please call Dr. Moira Zellner at (312) 996-2149 or email her at mzellner@uic.edu
We greatly appreciate your contribution to this important study, and hope that you will choose to participate.
Moira Zellner, Ph.D. Anne Diffenderffer,
M.P.A.
Principal Investigator SRL Senior Project Coordinator
Survey Research Laboratory, University of Illinois at Chicago
Consent Information for Participation in Research Transit Behavior Study
You are being asked to be a subject in a research study about how you travel from place to place.The study is being directed by Moira Zellner, Ph.D, and colleagues, along with the Survey Research Laboratory at the University of Illinois at Chicago.You have been asked to participate in this research because of where your home is located within the Chicagoland area.We ask that you read this form and contact us with any questions you may have before agreeing to be in the study.Your participation in this research is completely voluntary.
Why is this research being done?
The purpose of the study is to learn how people travel and how those choices are affected by opportunities in their neighborhood and beyond.
What procedures are involved?
If you are selected to participate in this study, you will complete the enclosed travel diary on the specified date.After you complete the diary, an interviewer will call you and ask you questions about your travel and what you recorded in your diary.This interview is expected to last approximately 30 minutes.
What are the potential risks and discomforts?
This study does not involve any risk or discomfort for participants, since the questions we ask are not of a personal or sensitive nature.
Are there benefits to taking part in the study?
Participating in the study is not expected to be of direct benefit to you.However, the information you supply will help researchers make recommendations about improvements to transportation systems in Chicagoland and beyond.
What about privacy and confidentiality?
With the exceptions noted below, the only people who will know that you are a research subject are Survey Research Laboratory staff who will separate your interview responses (with no identifying names) from your contact information.Your contact information will be kept in a locked cabinet at the Survey Research Laboratory.It will only be used for the purposes of contacting you for the telephone interview.When the results of the research are published or discussed in conferences, no information will be included that would reveal your identity as your responses will be combined with the responses of other research subjects in the study.All contact information will be destroyed upon completion of this study.
Will I be reimbursed for my participation in this study?
Upon completion of the study, you will receive a $50 check as expression of appreciation for your time and effort contributing to this study
Can I withdraw from the study?
You can choose whether to be in this survey component of the study or not.If you continue to volunteer to be in the study, you may withdraw at any time without consequences of any kind.You may also refuse to answer any questions you don’t want to answer and still remain in the study.
Who should I contact if I have questions?
The researcher conducting this study is Moira.If you have any questions about the study, you may contact her at any time by phone at (312) 996-2149 or by e-mail at mzellner@uic.edu
What are my rights as a research subject?
If you have any questions about your rights as a research subject, you may call the Office for Protection of Research Subjects at 312-996-1711.
Remember:Your participation in this research is voluntary.Your decision whether or not to participate will not affect any current or future relations you may have with the University.If you decide to participate, you are free to withdraw at any time without affecting that relationship.Please retain this document for your information and to keep for your records.
INTERVIEWER TRAINING MANUAL AND TELEPHONE SURVEY TEXT
TRANSIT BEHAVIOR STUDY, MAIN STUDY SRL #1107
Survey Research Laboratory, University of Illinois at Chicago
Updated January 2013
Project Coordinator: Anne Diffenderffer
Field Coordinator: Douglas Hammer
Overview: Study Purpose and Background. Sponsorship
The overall purpose of the project is to measure potential travel-behavior response to improvements in the pedestrian, cycling, and transit environments of four Chicago area neighborhoods – Cicero, Pilsen, Evanston, and Skokie. The transit improvements are inspired by the frequency and quality of service that might be made possible by automated (driverless) neighborhood transit, though the study will not seek to convey the automated aspect to respondents.
Of interest is the capacity of these improvements to generate the following kinds of shifts:
1. Modal shift of neighborhood trips from auto to other modes of transportation;
2. Increased use of regional public transit based on improved station access;
3. Shift of more remote non-work destinations to destinations within the neighborhood.
The four neighborhoods involved in this study represent different land-use and demographic characteristics that will ensure the generalizability of the research findings to a variety of urban conditions. As part of the survey, respondents will be asked to complete a travel diary and will be presented with images representing potential improvements to the pedestrian, cycling, and transit environments of their neighborhoods and will respond to scenarios regarding their travel under these altered conditions.
UPDATE: There were originally four neighborhoods involved in this study. We have enough completed interviews in Evanston, so we
will focus on the remaining three: Cicero, Pilsen, and Skokie. The client has given us additional funding to complete at least 150 interviews in each neighborhood. This means we need 3 more in Pilsen, 28 more in Skokie, and 48 more in Cicero for a total of 79 additional interviews. The information in this manual has been changed to reflect this.
The U.S. Department of Transportation funded this research. The principal investigators of this study are Dr. Moira Zellner, Assistant Professor of Urban Planning and Policy at UIC and Dr. Jonathan Levine, Professor and Chair of Urban and Regional Planning at the University of Michigan. They have contracted with SRL to complete the survey.
For questions about this study, respondents can be referred to
Anne Diffenderffer, Senior Project Coordinator
Survey Research Laboratory, UIC (312) 413-0492 afulle2@uic.edu
Sampling Design: Eligibility Requirements
We will use Address Based Sampling (ABS) for this study. Our vendor, Marketing Systems Genesys will provide us with addresses in the four neighborhoods identified above. The sample consists of 3,998 cases split across the three neighborhoods according to the response rates we have experienced so far – 2,791 were sent to Cicero, 262 were sent to Pilsen, and 945 were sent to Skokie. A recruitment mailing will be sent to these households asking them to participate in the study and offering a $50 incentive check for their cooperation. Any person that lives in the household and is over the age of 18 can complete and return the response letter to SRL to indicate that they are willing to participate in the study. We expect approximately 10% of the sample to be eligible and to return a response letter. We calculated the rates assuming 10 completes in each neighborhood on top of what we actually need to ensure that we hit our targets (i.e., 13 completes in Pilsen, 38 in Skokie, and 58 in Cicero). Once SRL receives the response letter and checks for eligibility, a study packet will be mailed to that person. The packet will include a travel diary that the person will be asked to complete on a randomly assigned weekday. SRL will follow-
up with a telephone interview at least one day after the date assigned to the respondent for completion of the travel diary. Interviews will be conducted in both English and Spanish and all study materials are available in both languages.
At the household screening stage, an eligible respondent simply needs to be English or Spanish speaking and an adult (18 years old or older) that lives at that sampled address. The response letter contains three screening questions. We ask whether the individual works or goes to school outside the home, what their work or school address is, and how many times during the week the individual travels to their nearest CTA rail station or within a half mile of that station.
The client would like respondents to either work or go to school somewhere within three miles of the CTA transit system, or they would like respondents to travel to their nearest CTA rail station or station area at least once per week. If a person responds that they neither work nor go to school outside the home and they do not travel at least once a week to their CTA rail station area, then that person will not be eligible for this study. Additionally, those individuals that do not work within three miles of the CTA system and do not travel at least once a week to their CTA station area will not be eligible. Respondents will be screened for eligibility before the telephone sample is compiled. (All the cases set up for telephone interviews will be eligible.)
Study Components
This study has a dual mode design that consists of two mailings and a telephone interview, programmed for Computer-AssistedTelephone-Interviewing (CATI) administration. This second phase of the main study is scheduled for 11 weeks, which almost six weeks to conduct the telephone interviews. All recruitment efforts will be done via mail at SRL’s Chicago office. We are interviewing in English and Spanish. We will have approximately 196 respondents to call and anticipate completing a maximum of 109 telephone interviews. Calling is scheduled to start on January 15, 2013 and the current end of call date is February 25, 2013.
The study will involve three major components:
1. A recruitment mailing that includes a(n):
a. Advance letter describing the study
b. Response letter that an individual interested in participating will complete and mail back to SRL
c. Postage-paid envelope
2. A study packet mailing that includes:
a. A cover letter
b. A consent information form
c. The travel diary
d. A booklet containing color images and worksheets that will be used during the phone interview
3. A 30-minute telephone interview
Respondents who complete the telephone interview will receive a $50 check. Checks are mailed from the UIC payroll office. We are telling respondents it will take up to four weeks to receive their check.
Recruitment Mailing
The recruitment mailing will be sent to all 3,998 households in the sample. The Data Reduction (DR) staff will be entering all the data returned in the response letter. DR will complete the first stage of eligibility screening because they will only enter response letter information of respondents that have confirmed they currently live at the sampled address. The Project Coordinator (PC) will be completing the next stage of eligibility screening to ensure that the respondents commute to an area within the city of Chicago or within 3 miles of a CTA station and/or that respondents travel at least once per week to their nearest CTA rail station or within a half mile of that station. Finally, Sampling will assign a random weekday on which the respondent will be asked to complete the travel diary. Sampling will also compile the CATI sample and mailing database for the study packets.
Study Packet Mailing
DR will mail the study packets once they receive the CATI sample from Sampling. These packets will be customized based on a respondent’s neighborhood location. All of the materials are the same in the packets for every neighborhood except for the images. The cover letter and the travel diary will both contain a date that is a randomly
selected weekday on which the respondent is to complete the travel diary. If the respondent does not take any trips on the date we assign, they are instructed to complete the diary on the next weekday that they do travel.
Respondents will also receive a booklet with a set of seven images and six worksheets in the packet. The images are labeled Image #0-Image #6. The images depict an intersection at the neighborhood CTA station. Here is a description of what the images contain:
Image #0 = Current state
Image #1 = Transportation improvements
Image #2 = Transportation improvements with a few people added
Image #3 = Transportation improvements with plenty of people added
Image #4 = Transportation improvements and other landscape/ urban furniture/kiosks
Image #5 = Transportation improvements and other landscape/ urban furniture/kiosks, with a few people added
Image #6 = Transportation improvements and other landscape/ urban furniture/kiosks, with plenty of people added
The worksheets are identical and contain a table with modes of transportation and some travel times and costs associated with each mode. The table contains 16 boxes that are blank and need to be filled in during the interview in order to answer a question. The client refers to these worksheets and this section of the interview as the “choice experiments.” Respondents will be presented with different scenarios on each worksheet that correspond to an image (e.g. Worksheet #1 corresponds to Image #1, etc.). The interviewer will walk the respondent through filling out the worksheet and once it’s complete, the respondent will be asked to look at the image and the information in the worksheet and choose the mode of transportation they would use for their trip given the scenario presented.
Telephone Interview
The telephone interview will be scheduled for at least one day after the respondent is to complete the travel diary. We budgeted to make up to 20 contact attempts for the main study and we budgeted for two attempts at refusal conversion.
The interview contains five sections:
• A brief screener that verifies the respondent is over the age of 18 and currently lives at the sampled address
• Questions about the household, the respondent, and the respondent’s commute
• A section that collects information recorded in the travel diary
• The six choice experiments
• Demographic questions
The travel diary is a tour based diary, meaning that instead of asking respondents to list their trips chronologically, we ask about their most important trip of the day – their main activity. Then we ask if any stops were made on the way to or from this activity along with some other questions on time, distance, mode of transportation, and costs. Once we’ve collected all the information about the main activity tour, we go on to ask whether there were any other tours that took place. For instance, if the respondent’s main activity was going to work, did they get home from work and then leave to go out to dinner somewhere. Other examples of additional tours might include a trip to the gym before work, taking the dog to the vet, or other roundtrip activities that did not take place on the way to or from their main activity.
The choice experiments are all based on the respondent’s commute to their main activity of the day. While we assume that most respondents will start the day at their home, we must account for the possibility that some people may start their day from a different location. Several of the variables in the choice experiment are based on distances from the respondent’s home to their neighborhood CTA station. For this part of the interview, we will ask respondents to think about the trip to their main activity of the day starting from their home,
regardless of where they may have actually started their trip that day.
Parts of the interview will require you to use Google maps to calculate distances from the respondent’s home to locations reported in the travel diary. This information will be used in the worksheets during the choice experiments. There will be some silence as you locate and enter this information. We have tried to provide scripts in the instrument to inform respondents of what’s happening, but it will be important for you to make sure you inform them of what’s happening at each step and communicate with them about whether they need more time, especially as they look at the worksheets to determine their answer.
Specific items in the telephone interview will be discussed in the QxQ section of this Appendix 4.
Instructions to Access Google Maps
There are three, possibly four, boxes on the worksheets used during the choice experiments that will be filled in based on data you enter from Google maps. These are Box D, H, L, and, possibly, E. Box A, B, C, F, and I are dependent on values that we know in advance of the telephone interview. To access Google maps, click on this link:
http://maps.google.com/maps?hl=en&tab=wl
1. In the upper left-hand part of the screen, there is a link to “Get Directions.” Click on that.
2. You can enter the respondent’s home in location A and their main activity destination in location B.
3. Click the box called “Get Directions.”
4. To enter the drive time, make sure the car icon is highlighted at the top. Always choose the time based on the route that takes the longest. If there is text that provides the length of time it will take in current traffic, disregard that and use the standard time.
5. To enter the cycle time, click on the bicycle icon at the top.
Again, select the longest time.
6. To enter the CTA travel time, select the bus icon at the top. We do not want to include the walk or bus time to the CTA station. Calculate the time it takes to get to the main activity location from the CTA station. When evaluating which time to select, use the longest time involving the train. We are only interested in trips involving CTA trains. If a route uses only buses or only METRA trains, then we CANNOT use that route. The CATI instrument will walk you through some steps to use an alternate address if the first trip you enter does not include an option involving the CTA train. In the event that Google Directions does not offer a public transit option that includes the train, follow the instructions on the screen. The instrument will skip out of the worksheet section and move on to demographic questions.
7. Box E is based on the parking cost reported in the first part of the interview. However, if a respondent pays $0 to park at work or school or does not know the daily parking rate, we have to determine a value to use during the choice experiments. There are three generic parking rates we will use and we need to determine which one to enter for a particular respondent. The rates are based on the main activity location and whether it falls in the central business district (CBD), the Rosemont/O’Hare area, or some other place in Chicagoland. The rates are:
a. CBD
b. Rosemont/O’Hare
c. Everywhere Else
The CATI instrument is programmed to alert you to the fact that you need to select a rate to use. In order to do this, use this link to access a map that has the CBD and Rosemont/O’Hare parking areas defined:
The Rosemont/O’Hare area is outlined in pink and the CBD is
outlined in blue. Enter the main activity location in the box at the top and click “Search Maps.” To see where the main activity location falls in relation to the parking areas, you may need to go to the drop down box (a box that has the word “Traffic” in it and an arrow pointing down) in the upper right-hand corner of the map and make sure the “Chicago parking” map is checked. You will choose the parking rate based on where the main activity location falls on this map.
Frequently Asked Questions
Below is a list of commonly asked questions you might hear from respondents.
Q. What is this study about? What is the purpose of the study?
A. This study is about how people in your area travel, and how those choices are affected by opportunities in your neighborhood and beyond.
Q. Who is paying for the research?
A. This study is funded by the U.S. Department of Transportation, which is a federal agency. The University of Illinois at Chicago (UIC) is conducting the study.
Q. How was I selected for the survey?
A. Your address was selected at random from households in four neighborhoods in the Chicago area. We sent information about this study to 7,700 households in Cicero, Pilsen, Evanston, and Skokie.
Q. Who can I call to verify the survey or get more information?
A. You may contact Anne Diffenderffer, who is the project coordinator at the University of Illinois at Chicago Survey Research Laboratory. She can be reached via e-mail at afulle2@uic.edu or by phone at (312)413-0492. She can answer your questions about the survey and refer you to the researchers who received the funding from DOT if needed.
Q. Is this the only survey request I will get from you / will you keep my number?
A. Yes, this is the only study request you will receive from us (unless you are randomly selected again as part of the sample for another study conducted by the UIC Survey Research Laboratory in the future). We will not add you to any lists or use your contact information for anything beyond calling you back for the interviews if you agree to participate in this particular study and sending you your incentive check.
Q. What is involved / How long will this take?
A. If you agree to participate, you will receive a study packet in the mail that includes a travel diary and an assigned date that you will complete the travel diary. Approximately two days after you complete the diary, you will receive a phone call from SRL to complete a telephone interview.
The interview should last approximately 30 minutes.
Q. Will my answers be kept confidential?
A. All information you give is kept strictly confidential. Your answers to the interview will be matched with a case i.d. number instead of your name. Any identifying information (such as your phone number or address) is kept in a separate file and destroyed one year after the end of the study. All reports or presentations based on the findings will present the data only in summary form – they will never identify individuals or households.
Q. How will my answers be private?
A. All data is stored in password protected files.
All personal identifying information is removed and will not be disclosed or released to anyone for any purpose other than persons directly involved with the study.
Q. Who is authorized to see my information?
A. The researchers and staff who work on this project may see your data, but remember that your answers will not be linked to your
name or other identifying information in the data set. Staff from the U.S. Department of Transportation, who is funding this research, or the University of Illinois Office for Protection of Research Subjects may see your data, but only if they audit our research. They too will protect your privacy.
Q. Will you add my name to any mailing lists?
A. No, you will not be added to any mailing lists.
Q. What will be done with the data/information you gather?
A. This study is being done by UIC researchers and the data will be used to write scholarly articles about how people travel from place to place and what affects those choices.
Q. Do I have to answer all the questions in the telephone interview?
A. It’s important that you answer as many questions as you can, but if there are any you don’t wish to respond to, simply skip those questions. Also, you may decide to stop the interview at any point.
Q. How do I give my comments about the study?
A. You may contact Anne Diffenderffer, the project coordinator at the University of Illinois at Chicago Survey Research Laboratory. Her phone number is 312-413-0492 and her email is afulle2@uic.edu.
Q. Why should I participate?
A. We want your input to be represented! It’s also important that we get as many households to participate as possible. Each household represents an important part of the study. The more interviews we complete, the more we will learn about how people travel.
Q. What are the questions like in the interviews?
A. There are some questions that ask about you, your household, and how you travel from place to place. We also ask questions about the information you recorded in the travel diary we sent you.
Q. Why should I participate? What am I going to get out of this?
A. Your input is important for the researchers to better
Disp.
Code
Disposition
understand how people travel from place to place. The information you supply will help researchers make recommendations about improvements to transportation systems in Chicagoland and beyond.
You will receive a $50 check for completing the telephone interview.
Q. Why are you sending people a $50 check?
A. We are sending each person who agrees to be mailed a study packet and complete the telephone interview a check for $50, to thank them for their time.
Q. Can anyone in my household participate in the study?
A. Only one person from your household can participate in the study. That person can be anyone that is age 18 or older.
Disposition Codes List
Table A 2.1 1107 Completion Codes
Explanation of Use
(01) Completed interview: English Complete phone interview with eligible English-speaking respondent.
(03) Completed interview except for worksheets: English
(04) Completed interview except for worksheets: Spanish
(10) Initial refusal to screener
Completed phone interview except worksheet section with eligible English-speaking respondent. Worksheets were not completed because R’s destination was not near the train line and/or there is no work or school address near the train to use instead.
Completed phone interview except worksheet section with eligible Spanish-speaking respondent. Worksheets were not completed because R’s destination was not near the train line and/or there is no work or school address near the train to use instead.
Respondent refused prior to completion of the phone front end to confirm eligibility for the study.
(11) Initial refusal English The eligible English-speaking respondent refuses the phone interview.
(12)
(20)
Initial refusal Spanish The eligible Spanish-speaking respondent refuses the phone interview.
Appointment/ partial to complete
This disposition is used for both appointments and partially completed interviews. There are two types of appointments: hard (or specific) appointments and soft appoints. A hardappointment means that a specific date and time has been set to call back. A softappointment means that we have either a best date/day of the week or a best time of the day to call back, but not both.
Always try to set up a hard appointment whenever possible, since this will improve the efficiency of our return attempts.
(21) Resending travel diary The respondent needs us to re-mail the travel diary before we can complete the phone interview.
(27) Attempting to locate Used if directory assistance or new/ second phone number have
(29) Initial duplicate
(30) No answer / busy
(31) Answering machine/ service
(32) Eligible respondent not available
(33) Unscreened respondent not available
(40) Final refusal to screener
Used for Spanish-speaking households; these cases are called back by a Spanish interviewer.
This disposition is used when a recording tells you that the phone number you have dialed has been temporarily disconnected.
Used if directory assistance or new/second phone number have not yet been tried.
The respondent indicates that he has already been interviewed on the study for this specific follow-up interview. Before the case is finalized, the sampling section must confirm that the case appears twice.
Used for telephone numbers that have never answered or that have always been busy. Always allow the phone to ring 7 times before you consider the result of a contact attempt to be a “no answer”. For busy signals, a case is redialed immediately and then again after 15 minutes have passed before being dispositioned.
If the message on the machine or the manner in which the service answers leads you to believe you have a wrong number, disposition the case accordingly. Messages can be left (no more than once per day).
This disposition is used when a respondent who has confirmed eligibility was not home, was busy, or for some other reason could not be interviewed at the time of contact. No appointment could be made.
This disposition is used when a respondent who has not confirmed eligibility was not home, was busy, or for some other reason could not be interviewed at the time of contact. No appointment could be made.
Respondent refused to complete the phone front end to confirm eligibility for the study.
(41) Final refused interview: English The eligible English-speaking respondent refused to complete interview. FINAL DISPOSITION.
(42) Final refused interview: Spanish The eligible Spanish-speaking respondent refused to complete interview. FINAL DISPOSITION.
(44)
(45)
Do not call refusal, unscreened
Do not call refusal, screened
INF/R who has not confirmed eligibility refused because he/she is registered with National Do Not Call List (and you were not able to explain we are exempt)
INF/R who has confirmed eligibility refused because he/she is registered with National Do Not Call List (and you were not able to explain we are exempt)
This disposition is used when there is a clear indication that the respondent will be unavailable to participate within the timeconfines of the survey period. This may be due to hospitalization, being away on vacation, etc.
Since study periods are sometimes extended, always try to find out when the respondent would be available.
This disposition is used when the eligible respondent is too hard of hearing, is permanently ill, is incapacitated, or for some other reason would never be able to be interviewed. It is not related to the time frame of the data collection effort.
(57) Attempting to locate After exhausting all locating procedures planned for the study, the R cannot be contacted.
(60) Other eligible
This disposition is used when the situation does not seem to be covered by any other category and you think there is a possibility that the case may be eligible. Situations covered by this disposition may include a household or feeling that a respondent was under the influence of drugs or alcohol when contacted. This category should not be used for refusals.
(70) Ineligible: Age The respondent is not 18 years of age or older.
(71) Ineligible: Address The respondent does not live at an address that is part of the sample.
(85) Deceased
(88) Ineligible foreign language
The respondent selected after screening has died by the time we call back to complete the interview.
This disposition is used if the respondent speaks a language other than English or Spanish.
(89) Final duplicate Sampling has confirmed that an “initial duplicate” case appears twice in the sample. This disposition is used only by a supervisor or with a supervisor’s authorization.
(90) Other ineligible
This disposition is used when the situation does not seem to be covered by any other category and you think the case is ineligible.
<4> ANSWERING MACHINE/ANSWERING SERVICE [#goto T181][goto T188]
<5> TEMPORARILY NOT IN SERVICE; CIRCUIT PROBLEMS [goto ck1]
<6> NONWORKING -- DISCONNECTED/FAST BUSY/NO RING [goto ck1]
<7> WRONG NUMBER; CHANGED TO NEW NUMBER [goto T100]
>hlo.2< YOU ARE CALLING [fill RNAM].
Hello. I am calling from the Survey Research Laboratory at the University of Illinois. My name is [fill INAM]. May I please speak to [fill RNAM]?
([fill RNAM] volunteered to be part of a study we are doing on how people in your area travel. We recently mailed him/her a packet of information about this study and are calling to conduct a short telephone interview with him/her.)
(Our interview will take about 30 minutes)
<1> YES, AND CONNECTED TO RESPONDENT
<2> NOT AVAILABLE
<3> NEVER ABLE TO INTERVIEW -- TOO HARD OF HEARING, PERMANENTLY ILL, OR FOR SOME OTHER REASON
<4> NO ONE THERE BY THAT NAME, R NO LONGER LIVES THERE
<5> LANGUAGE PROBLEM
<6> DECEASED
<7> OTHER
<8> NO ONE 18 OR OLDER LIVES IN HH
<9> REFUSED
I include the scripts for callback scenarios to illustrate that we HAVE to talk to respondents within 5 days of their completing the travel diary and that we have scripts that explain that to them. The client is concerned that if we conduct the interview much beyond that time period, the respondent will forget the details of their travel on that day.
>expl.2< R Is Eligible. Type "1" To Proceed.
(Based on your answers, you are eligible to be a participant in our study.)
If R Requests Callback:
"Please be aware that we will have to complete the interview no later than [fill months(DiaryLastCall_m)] [fill DiaryLastCall_d]. (Because you already completed the travel diary for [fill months(TDDATE_Next_m)] [fill
TDDATE_Next_d], and people tend to forget details after enough days have passed.)"
[else]
(Hello, I am calling from the Survey Research Laboratory at the University of Illinois and my name is [fill INAM].)
We are calling because you volunteered to participate in our study about how people in your area travel and we are calling to conduct a short interview about the packet and travel diary we recently sent you. Is this a good time? (Our interview will take about 30 minutes)
If R Requests Callback:
"Please be aware that your travel diary must be completed in order for us to complete the interview. And once you've filled out the diary, we will have to complete the interview no later than 5 days after the travel date that you describe in the diary. (Because people tend to forget details after enough days have passed.)"
If the diary is filled out for travel on [fill months(TDDATE_m)] [fill TDDATE_d], we will need to do the interview no later than [fill months (DiaryLastCall_m)] [fill DiaryLastCall_d].
If the diary is filled out for travel after [fill months(TDDATE_m)] [fill TDDATE_d], then we have 5 days after [u]that[n][blue] date to do the interview.)
[endif]
<1> PROCEED
<2> R PREFERS CALLBACK
<3> NEVER ABLE TO INTERVIEW -- TOO HARD OF HEARING, PEMANENTLY ILL, OR FOR SOME OTHER REASON
<4> DUPLICATE
<5> LANGUAGE PROBLEM
<6> OTHER
<9> REFUSED
SCREENER
R must be 18+ years of age to participate.
>Q3<
Just to confirm, are you 18 years of age or older?
<1> Yes [goto Q4]
<2> No
<7> NO CODED RESPONSE APPLICABLE (SPECIFY)[specify]
<8> DON'T KNOW
<9> REFUSED
@ [goto Inel70]
R must currently live at the sampled address. If they do not live at this address, they cannot participate in this study.
>Q4< Do you currently live at...
| Page
street: [fill ADDR]
city: [fill CITY]
zip: [fill ZIP]
<1> Yes [goto Q31p]
<2> No
<7> NO CODED RESPONSE APPLICABLE (SPECIFY)[specify]
<8> DON'T KNOW
<9> REFUSED
@ [goto Inel71]
Because the majority of this questionnaire relies on the study packet sent to the R, we want to make sure right at the beginning of the interview that they received the packet and that they have the materials in front of them. We also want to make sure they completed the travel diary before we begin.
>Q31p<
Now I'd like to ask you some questions about the packet that we sent you.
Did you receive the packet containing the travel diary and the images and worksheets?
<1> Yes [goto Q33]
<2> No
<3> DID NOT COMPLETE TRAVEL DIARY [goto NOPACKET1]
<4> RECEIVED DIARY BUT LOST IT [goto NOPACKET2]
<7> NO CODED RESPONSE APPLICABLE (SPECIFY)[specify]
<8> DON'T KNOW
<9> REFUSED
@
If R did not travel on the date we assigned, they are instructed to complete the diary on the next weekday that they do travel, so that’s why they are allowed to give us an alternate date here.
>Q33< Did you complete the diary for travel done on [fill months(TDDATE_m)] [fill TDDATE_d]?
<1> Yes [goto Q31]
<2> No
<3> DID NOT COMPLETE TRAVEL DIARY [goto NOPACKET1]
<7> NO CODED RESPONSE APPLICABLE (SPECIFY)[specify]
<8> DON'T KNOW
<9> REFUSED
>Q34< For which travel date did you complete the diary?
<1> Enter date
<3> DID NOT COMPLETE TRAVEL DIARY
<7> NO CODED RESPONSE APPLICABLE (SPECIFY)[specify]
<8> DON'T KNOW
<9> REFUSED
>Q31< Do you have the travel diary, images, and worksheets in front of you now?
<1> Yes [goto ENDS]
<2> No
<7> NO CODED RESPONSE APPLICABLE (SPECIFY)[specify]
<8> DON'T KNOW
<9> REFUSED
>Q32< Are you able to get them for our interview now?
<1> Yes [goto ENDS]
<2> No
<7> NO CODED RESPONSE APPLICABLE (SPECIFY)[specify]
<8> DON'T KNOW
<9> REFUSED
If the R has the packet and has completed the travel diary, but does not have them available (e.g. the R left them at work), we want to schedule a callback within 5 days of the date they completed the diary so that too much time doesn’t go by between the date the R completed the diary and the date we complete the phone interview – that’s why there is a date limit here and the additional wording if this is the last day they can complete the interview.
>NOPACKET1<
Will you be able to access the travel diary, images, and worksheets and complete the call sometime later today?
(Today is the last day that we can interview you about this travel diary.) [else]
Will you be able to access the travel diary, images, and worksheets and complete the call by [fill months(DiaryLastCall_m)] [fill DiaryLastCall_d]?
(We cannot interview you about this travel diary after [fill months DiaryLastCall_m)] [fill DiaryLastCall_d].)
<1> Yes (MAKE APPOINTMENT) [etc<skcb>]
<2> No
<7> NO CODED RESPONSE APPLICABLE (SPECIFY)[specify]
<8> DON'T KNOW
<9> REFUSED
We expect the R to receive a re-mailed packet and to complete the travel diary within two weeks. We will call them approximately two weeks and one day after the initial phone call to complete the interview.
We would like the opportunity to re-mail the packet to you at...
street: [fill ADDR]
city: [fill CITY]
zip: [fill ZIP]
It should arrive within about two weeks. We'll be asking you to fill out the diary for [fill months(TDDATE_Next_m)] [fill TDDATE_Next_d], and we'll be calling you back a day or so after that.
Please be aware that we will have to complete the interview no later than 5 days after the travel date that you describe in the diary. (Because people tend to forget details after enough days have passed.)
[If the diary is filled out for travel on [fill months(TDDATE_Next_m)] [fill TDDATE_Next_d],we will need to do the interview no later than [fill months(DiaryLastCall_m)] [fill DiaryLastCall_d].
If the diary is filled out for travel after [fill months(TDDATE_Next_m)] [fill TDDATE_Next_d], then we have 5 days after [u]that[n][blue] date to do the interview.)
Enter <1> To Continue
If R did not complete the travel diary before we call, we simply need to find out what date they expect to complete it and can call them back the day after that.
>NOPACKET3<
(Did Not Complete Travel Diary)
That's Ok, we can still do the study if you complete the travel diary for the next [fill TDDAY] ([fill months(TDDATE_Next_m)] [fill TDDATE_Next_d]).
We'll just make an appointment to call you back the day after that to do the survey.
Please be aware that we will have to complete the interview no later than 5 days after the travel date that you describe in the diary. (Because people tend to forget details after enough days have passed.)
(If the diary is filled out for travel on [fill months(TDDATE_Next_m)] [fill TDDATE_Next_d], we will need to do the interview no later than [fill months(DiaryLastCall_m)] [fill DiaryLastCall_d].
If the diary is filled out for travel after [fill months(TDDATE_Next_m)] [fill TDDATE_Next_d], then we have 5 days after [u]that[n][blue] date to do the interview.)
[else]
That's Ok, we can still do the study if you complete the travel diary for tomorrow ([fill months(TDDATE_Next_m)] [fill TDDATE_Next_d]).
We'll just make an appointment to call you back the day after that to do the survey.
Please be aware that we will have to complete the interview no later than [fill months(SMON)] [fill SDAY], which is when our study ends.
Enter <1> To Continue
>Inel70< [# Ineligible: not an adult]
I'm sorry. You are not eligible to participate in this study.
Thank you for your interest!
Enter <1> To Continue
@
>Inel71<
[# Ineligible: does not live at listed address]
I'm sorry. You are not eligible to participate in this study.
Thank you for your interest!
Enter <1> To Continue
@
>Refuse41<
I'm sorry. We will not be able to complete the interview without your travel diary information. Thank you for your time. We appreciate your willingness to participate.
Enter <1> To Continue
>Final55<
I'm sorry. We will not be able to complete the interview for that travel diary date, because it's too far in the past.
(We need to complete the interview no later than 5 days after the travel date described in the diary, because people tend to forget details after enough days have passed. Since you completed the diary for travel on [fill months (TDDATE_Next_m)] [fill TDDATE_Next_d], we would have needed to do the interview no later than [fill months(DiaryLastCall_m)] [fill DiaryLastCall_d].)
Thank you for your time. We appreciate your willingness to participate.
[else]
[# there is not enough time to mail the diary]
I'm sorry. We will not be able to complete the interview because there isn't enough time left to re-mail the packet to you.
(Our study ends on [fill months(SMON)] [fill SDAY]. And it would take us longer than that to put together another packet for you and get it to you.)
Thank you for your time. We appreciate your willingness to participate.
[else]
[# there is not enough time to complete the interview]
I'm sorry. We will not be able to complete the interview because there isn't enough time left in our study.
(Our study ends on [fill months(SMON)] [fill SDAY].)
Thank you for your time. We appreciate your willingness to participate.
Enter <1> To Continue[n]
[# Start of main QEX]
>Q5<
I am going to ask you a series of questions now about your household.
Including yourself, how many people live in your household for [u]eight or more[n] months during the year?
Make sure R does not include access to I-GO or ZIPcar vehicles in this question. They may include work vehicles, like company cars.
>Q9<
How many [u]working[n] motor vehicles are available to members of your household? Please include cars, trucks, and motorcycles.
DO NOT INCLUDE ACCESS TO ZIP CAR OR I-GO OR OTHER CAR-SHARING PROGRAM.
BUT MAY INCLUDE ANY WORK VEHICLES
| Page
<0-10>
<97> NO CODED RESPONSE APPLICABLE (SPECIFY)[specify]
<98> DON'T KNOW
<99> REFUSED
@
>Q10< Do you live in...
<1> A detached single-family home,
<2> An attached single-family home, such as a rowhouse or townhouse,
<3> A condominium, or <4> An apartment?
<5> OTHER (SPECIFY)[specify]
<8> DON'T KNOW
<9> REFUSED
@
>Q11< Do you own or rent the home you are now living in?
<1> Own
<2> Rent
<7> NO CODED RESPONSE APPLICABLE (SPECIFY)[specify]
<8> DON'T KNOW
<9> REFUSED
@
>Q12< How many parking spots are available [u]off-street[n], such as in a driveway or garage, to you, your household members, and your guests?
<0-10>
<97> NO CODED RESPONSE APPLICABLE (SPECIFY)[specify]
<98> DON'T KNOW
<99> REFUSED @
>Q13< How easy is it to park on the streets in your neighborhood? Is it...
<1> Extremely easy,
<2> Very easy,
<3> Moderately easy,
<4> Slightly easy, or
<5> Not at all easy?
<7> NO CODED RESPONSE APPLICABLE (SPECIFY)[specify]
<8> DON'T KNOW
<9> REFUSED @
>Q14<
This next series of questions is about you. Are you currently a licensed driver?
<1> Yes <2> No
<7> NO CODED RESPONSE APPLICABLE (SPECIFY)[specify]
<8> DON'T KNOW
<9> REFUSED
@ >Q15< Are you currently...
<1> Employed full-time, <2> Employed part-time, or <3> Not employed?
<7> NO CODED RESPONSE APPLICABLE (SPECIFY)[specify]
<8> DON'T KNOW
<9> REFUSED
@ >Q16< [if Q15 ne <1> and Q15 ne <2>goto Q22] [open Q16]
What is the city and ZIP code of your workplace?
(INTERVIEWER: zip code is optional)
<1> Specify city and ZIP code
<7> NO CODED RESPONSE APPLICABLE (SPECIFY)[specify]
<8> DON'T KNOW
<9> REFUSED
City: @city ZIP code: @zip (OPTIONAL)
>Q17< Which of the following statements best describes the parking options available to you at your workplace...
<1> There is no parking available at or near my workplace, <2> There is street parking available at or near my workplace, <3> There is parking available in a garage or parking lot at or near my workplace, or
<4> There is both street parking and parking available in a garage or parking lot at or near my workplace?
<7> NO CODED RESPONSE APPLICABLE (SPECIFY)[specify]
<8> DON'T KNOW
<9> REFUSED @
>Q18< [if Q17 ne <2> and Q17 ne <3> and Q17 ne <4>goto Q21] Which of the following statements best describes the cost of parking at your workplace...
<1> The parking is free at or near my workplace, <2> People who drive to work usually pay to park, or <3> People who drive to work have their parking paid for as a benefit of the job?
<7> NO CODED RESPONSE APPLICABLE (SPECIFY)[specify]
<8> DON'T KNOW <9> REFUSED
@
>Q20< [if Q18 ne <2>goto Q21]
Approximately how much would you say is the average daily parking cost at your workplace?
(Please estimate the cost per day and give us your best guess even if you don't drive to work.)
<1-50> Enter amount to the nearest dollar
<97> NO CODED RESPONSE APPLICABLE (SPECIFY)[specify]
<98> DON'T KNOW <99> REFUSED
@
>Q21< [if Q9 eq<0>goto Q22]
Do you ever use your vehicle during your work hours as part of your job?
[blue](Probe for apartment number; include it in the street field)[n] [blue](Include street direction = N/S/E/W, and type = St/Ave/Blvd/Place/Ct...)
Street: @street
[# (entering new cross-street address)]
[blue](Specify Intersection)[n] [blue](Include street direction = N/S/E/W, and type = St/Ave/Blvd/Place/Ct...)
(What street is this place located on?) @cross1
(And what street crosses that one at the nearest corner?) @cross2
City: @city
State: @state
ZIP Code: @zip (OPTIONAL)
>Q35_post< [# update a partial work/school address] [# (if chose "work or school address" and did not have full work/school address)]
>Q36< Is this location your...
<1> Home, <2> Workplace, or <3> Some other place? (SPECIFY ON NEXT SCREEN) [goto Q36a]
<8> DON'T KNOW
<9> REFUSED
@ [goto Q37i]
>Q36a< [blue](Enter Other Location)[n]
@ [@] [allow 50]
The travel diary is based on the R’s trip from their starting location to their “main activity” of the day. The main activity is going to be the regular commute to work or school for most people. Others may consider their main activity to be shopping/errands or some other trip. Once we’ve established the main activity, we ask questions about stops made on the way to and from this activity. We follow up by asking if they completed any other “tours” or round-trip activities on the day. For instance, if they came home from work and went back out to dinner or went back out to the grocery store.
>Q37i<
Now think about the main activity of your day. If you went to work on this day, that is probably your main activity. Otherwise, it could be going to school or doing some shopping or leisure activity. For example, if you went to the office for one hour and then spent the rest of the day shopping, your main activity would be shopping.
[blue]Enter <1> To Continue[n]
@
>Q37< What was the address of your main activity? Please provide either an address or an intersection. If your main activity took place at multiple locations, please choose the address that you consider to be the most important of the day.
<1> Home address ("[fill ADDR]") [if WSADDR ne <>]
<2> Work or School address ("[fill WSADDR]") [endif]
<3> SPECIFY NEW ADDRESS
<4> SPECIFY INTERSECTION
D‐28 | Page
<7> NO CODED RESPONSE APPLICABLE (SPECIFY) [specify]
<8> DON'T KNOW
<9> REFUSED
[# (entering new street address)]
[blue](Probe for apartment number; include it in the street field)[n] [blue](Include street direction = N/S/E/W, and type = St/Ave/Blvd/Place/Ct...)
Street: @street
[# (entering new cross-street address)]
[blue](Specify Intersection)[n]
[blue](Include street direction = N/S/E/W, and type = St/Ave/Blvd/Place/Ct...)
(What street is this place located on?) @cross1
(And what street crosses that one at the nearest corner?) @cross2
[# (entering new street or cross-street address, or *partial* work/school address)]
City: @city
[# (entering new street or cross-street address, or *partial* work/school address)]
State: @state [endif]
[# (entering new street or cross-street address, or *partial* work/school address)]
ZIP Code: @zip (OPTIONAL)
>Q37_post<
[# update a partial work/school address]
[# (if chose "work or school address" and did not have full work/school address)]
>Q38< What was this location?
<1> Workplace
<2> Other work-related place
<3> School
<4> Shopping or errands
<5> Social, entertainment, or dining
<6> Home
<7> Childcare provider
<8> Other (SPECIFY ON NEXT SCREEN) [goto Q38a]
<97> NO CODED RESPONSE APPLICABLE (SPECIFY)[specify]
<98> DON'T KNOW
<99> REFUSED
@ [goto Q39]
>Q38a<
D‐29 | Page
[blue](Enter Other Location)[n]
@
>Q39<
How many stops did you make along the way to your main activity?
<0-95> 0 to 95 stops <96> 96 or more stops
<97> NO CODED RESPONSE APPLICABLE (SPECIFY)[specify]
<98> DON'T KNOW
<99> REFUSED
@
To limit the amount of time it takes to collect travel diary information, we limit Rs to telling us about a maximum of two stops on their way to their main activity. If they made more stops than that, they need to pick the two most important stops and tell us about those.
>Q40i<
The following questions address your travel to your main activity location. You mentioned that you made [fill Q39] stops on the way to your main activity. Of these [fill Q39] stops, please select the [u]two[n] that you view as the most important for you, and discard the rest.
(For example, if you stopped to drop your kids off at school, to buy some supplies for the office, and to visit your mother, you might select the stop to drop off your kids and the stop to visit your mother and throw out the stop for supplies.)
[blue]Enter <1> To Continue[n]
@
>Q40a<
I will start by asking about the first segment of your trip.
What was the address of your first stop? Please provide either an address or an intersection.
<1> Home address ("[fill ADDR]")
[if WSADDR ne <>]
<2> Work or School address ("[fill WSADDR]")
<3> SPECIFY NEW ADDRESS
<4> SPECIFY INTERSECTION
<7> NO CODED RESPONSE APPLICABLE (SPECIFY) [specify]
<8> DON'T KNOW
<9> REFUSED
@ask
[# (entering new street address)]
[blue](Probe for apartment number; include it in the street field)[n] [blue](Include street direction = N/S/E/W, and type = St/Ave/Blvd/Place/Ct...)
Street: @street
[else]
[# (entering new cross-street address)]
[blue](Specify Intersection)[n]
[blue](Include street direction = N/S/E/W, and type = St/Ave/Blvd/Place/Ct...)
(What street is this place located on?) @cross1
(And what street crosses that one at the nearest corner?) @cross2
[# (entering new street or cross-street address, or *partial* work/school address)]
City: @city
[# (entering new street or cross-street address, or *partial* work/school address)]
State: @state
[# (entering new street or cross-street address, or *partial* work/school address)]
ZIP Code: @zip (OPTIONAL)
>Q40a_post< [# update a partial work/school address] [# (if chose "work or school address" and did not have full work/school address)]
>Q41a< What was this destination?
<1> Workplace
<2> Other work-related place
<3> School
<4> Shopping or errands
<5> Social, entertainment or dining
<6> Home
<7> Childcare provider
<8> Other (SPECIFY ON NEXT SCREEN) [goto Q41a2]
<98> DON'T KNOW
<99> REFUSED
@ [goto Q42a]
>Q41a2< [blue](Enter Other Location)[n]
@
>Q42a< What time did you leave to go to this location?
<1> Enter time
<7> NO CODED RESPONSE APPLICABLE (SPECIFY)[specify]
<7> NO CODED RESPONSE APPLICABLE (SPECIFY)[specify]
<8> DON'T KNOW
<9> REFUSED
[blue]ENTER TIME. USE 24-HOUR CLOCK.
| 4:00 AM = 0400 | 2:00 PM = 1400 |
| 5:00 AM = 0500 | 3:00 PM = 1500 |
| 6:00 AM = 0600 | 4:00 PM = 1600 |
| 7:00 AM = 0700 | 5:00 PM = 1700 |
| 8:00 AM = 0800 | 6:00 PM = 1800 |
| 9:00 AM = 0900 | 7:00 PM = 1900 |
| 10:00 AM = 1000 | 8:00 PM = 2000 |
| 11:00 AM = 1100 | 9:00 PM = 2100 |
| 12:00 PM = 1200 | 10:00 PM = 2200 |
| 1:00 PM = 1300 | 11:00 PM = 2300 | [n]
<0000-2359>
>Q44a< Please give us your best estimate of about how long the trip was in miles.
<0.1-96.9> Miles
<97> NO CODED RESPONSE APPLICABLE (SPECIFY)[specify]
<98> DON'T KNOW
<99> REFUSED
@
It is important for us to collect all the modes of transportation used by the R to get to their destination. If they walked to the bus and took the bus to the train, then you should select bus, train, and walking. Make sure if the R only says bus or train that you probe to find out if they walked to get their or if they rode their bike, etc.
>Q45a< [blue]ENTER A "1" FOR ALL THAT APPLY.[n]
| Page
What modes of transportation did you use to get there?
[blue]IF R SELECTS BUS OR TRAIN, PROBE:[N] (Please include how you got to the bus/train. For example, did you walk, drive, or ride your bike?)
@1 Car or other private vehicle as driver, @2 Car or other private vehicle as passenger, @3 Bus, @4 Train, @5 Walking, @6 Cycling, or @7 Some other way? (Please specify.)
@98 DON'T KNOW @99 REFUSED
>Q40b<
Now I'll ask about the second segment of your trip.
What was the address of your second stop? Please provide either an address or an intersection.
<1> Home address ("[fill ADDR]")
[if WSADDR ne <>]
<2> Work or School address ("[fill WSADDR]")
<3> SPECIFY NEW ADDRESS
<4> SPECIFY INTERSECTION
<7> NO CODED RESPONSE APPLICABLE (SPECIFY) [specify]
<8> DON'T KNOW
<9> REFUSED
[# (entering new street address)]
[blue](Probe for apartment number; include it in the street field)[n] [blue](Include street direction = N/S/E/W, and type = St/Ave/Blvd/Place/Ct...)
Street: @street
[# (entering new cross-street address)]
[blue](Specify Intersection)[n] [blue](Include street direction = N/S/E/W, and type = St/Ave/Blvd/Place/Ct...)
(What street is this place located on?) @cross1
(And what street crosses that one at the nearest corner?) @cross2
[# (entering new street or cross-street address, or *partial* work/school address)]
City: @city
[# (entering new street or cross-street address, or *partial* work/school address)]
State: @state
[# (entering new street or cross-street address, or *partial* work/school address)]
ZIP Code: @zip (OPTIONAL)
>Q40b_post< [# update a partial work/school address] [# (if chose "work or school address" and did not have full work/school address)]
>Q41b< What was this destination?
<1> Workplace
<2> Other work-related place
<3> School
<4> Shopping or errands
<5> Social, entertainment or dining
<6> Home
<7> Childcare provider
<8> Other (SPECIFY ON NEXT SCREEN) [goto Q41b2]
<98> DON'T KNOW
<99> REFUSED
@ [goto Q42b]
>Q41b2< [blue](Enter Other Location)[n]
@ [@] [allow 50]
>Q42b< What time did you leave to go to this location?
<1> Enter time
<7> NO CODED RESPONSE APPLICABLE (SPECIFY)[specify]
What modes of transportation did you use to get there?
[blue]IF R SELECTS BUS OR TRAIN, PROBE:[N] (Please include how you got to the bus/train. For example, did you walk, drive, or ride your bike?)
@1 Car or other private vehicle as driver, @2 Car or other private vehicle as passenger, @3 Bus, @4 Train, @5 Walking, @6 Cycling, or @7 Some other way? (Please specify.)
@98 DON'T KNOW @99 REFUSED
>Q42c<
Now I'll ask you about the final segment of your trip, the segment that took you to your main activity location. What time did you leave to go to this location? [else] [# if Q39 eq<0> or Q39=NCRA/DK/RF]
What time did you leave to go to your main activity location? [endif]
D‐35 | Page
<1> Enter time
<7> NO CODED RESPONSE APPLICABLE (SPECIFY)[specify]
>Q44c< Please give us your best estimate of about how long the trip was in miles.
<0.1-96.9> Miles
<97> NO CODED RESPONSE APPLICABLE (SPECIFY)[specify]
<98> DON'T KNOW
<99> REFUSED
@
>Q45c<
[blue]ENTER A "1" FOR ALL THAT APPLY.[n]
What modes of transportation did you use to get there?
[blue]IF R SELECTS BUS OR TRAIN, PROBE:[N] (Please include how you got to the bus/train. For example, did you walk, drive, or ride your bike?)
@1 Car or other private vehicle as driver, @2 Car or other private vehicle as passenger, @3 Bus, @4 Train, @5 Walking, @6 Cycling, or @7 Some other way? (Please specify.)
@98 DON'T KNOW @99 REFUSED
The questions about parking costs and highway tolls are asked two different ways through the travel diary depending on the Rs responses. If the respondent drove or was driven to their destination, they are asked about the costs they incurred. If they didn’t drive or didn’t ride in a car, then they are asked about the costs they would have incurred if they had driven.
>Q46_1<
Thinking about the entire trip to your main activity location, how much did you spend on parking? (Please give us your best estimate.)
If you had driven the entire way to your main activity location, making the same stops, how much would you have spent on parking? (Please give us your best estimate.)
<0-50> Enter amount to the nearest dollar
<97> NO CODED RESPONSE APPLICABLE (SPECIFY)[specify]
<98> DON'T KNOW <99> REFUSED
@
>Q47_1<
Thinking about the entire trip to your main activity location, how much did you spend on highway tolls? (Please give us your best estimate.)
<0-50> Enter amount to the nearest dollar
<97> NO CODED RESPONSE APPLICABLE (SPECIFY)[specify]
<98> DON'T KNOW
<99> REFUSED
@
>Q47_2<
If you had driven the entire way to your main activity location, making the same stops, how much would you have spent on highway tolls? (Please give us your best estimate.)
<0-50> Enter amount to the nearest dollar
<97> NO CODED RESPONSE APPLICABLE (SPECIFY)[specify]
<98> DON'T KNOW
<99> REFUSED
After we finish asking the R about their trip to their main activity and the stops along the way, we then repeat the series of questions and ask about their return trip FROM their main activity to their final destination for the day. Again we ask about stops made along the way. For most people, the final destination will be home. If they get home and go out again, that is covered later in the questionnaire.
>Q48p1i<
Now please think about your return trip from your main activity to your final destination for the day.
[blue]Enter <1> To Continue[n] @
>Q48p1<
What was the address of your final destination for the day? Please provide either an address or an intersection.
<1> Home address ("[fill ADDR]")
[if WSADDR ne <>]
<2> Work or School address ("[fill WSADDR]")
<3> SPECIFY NEW ADDRESS
<4> SPECIFY INTERSECTION
<7> NO CODED RESPONSE APPLICABLE (SPECIFY) [specify]
<8> DON'T KNOW
<9> REFUSED
[# (entering new street address)]
[blue](Probe for apartment number; include it in the street field)[n] [blue](Include street direction = N/S/E/W, and type = St/Ave/Blvd/Place/Ct...)
Street: @street
[# (entering new cross-street address)]
[blue](Specify Intersection)[n] [blue](Include street direction = N/S/E/W, and type = St/Ave/Blvd/Place/Ct...)
(What street is this place located on?) @cross1
(And what street crosses that one at the nearest corner?) @cross2
[# (entering new street or cross-street address, or *partial* work/school address)]
City: @city
[# (entering new street or cross-street address, or *partial* work/school address)]
State: @state
[# (entering new street or cross-street address, or *partial* work/school address)]
ZIP Code: @zip (OPTIONAL)
>Q48p2< What was this location?
<1> Workplace
<2> Other work-related place
<3> School
<4> Shopping or errands
<5> Social, entertainment, or dining
<6> Home
<7> Childcare provider
<8> Other (SPECIFY ON NEXT SCREEN) [goto Q48p2a]
<97> NO CODED RESPONSE APPLICABLE (SPECIFY)[specify]
<98> DON'T KNOW
<99> REFUSED
@ [goto Q48]
>Q48p2a< [blue](Enter Other Location)[n]
@
>Q48< How many stops did you make along the way to your final destination?
>Q49i< [if Q48 eq<0>goto Q51c] [if Q48 ge<97>goto Q51c] [# treat NCRA/DK/RF same as "0" and ask abt single trip segment]
The following questions address your travel to your final destination for the day. [if Q48 ge<3>]
You mentioned that you made [fill Q48] stops on the way back from your main activity. Of these [fill Q48] stops, please select the [u]two[n] that you view as the most important for you, and discard the rest.
| Page
(For example, if you stopped to drop your kids off at school, to buy some supplies for the office, and to visit your mother, you might select the stop to drop off your kids and the stop to visit your mother and throw out the stop for supplies.)
[blue]Enter <1> To Continue[n]
@
>Q49a<
I will start by asking about the first segment of your trip.
What was the address of your first stop? Please provide either an address or an intersection.
<1> Home address ("[fill ADDR]")
[if WSADDR ne <>]
<2> Work or School address ("[fill WSADDR]")
<3> SPECIFY NEW ADDRESS
<4> SPECIFY INTERSECTION
<7> NO CODED RESPONSE APPLICABLE (SPECIFY) [specify]
<8> DON'T KNOW
<9> REFUSED
[# (entering new street address)]
[blue](Probe for apartment number; include it in the street field)[n] [blue](Include street direction = N/S/E/W, and type = St/Ave/Blvd/Place/Ct...)
Street: @street
[# (entering new cross-street address)]
[blue](Specify Intersection)[n] [blue](Include street direction = N/S/E/W, and type = St/Ave/Blvd/Place/Ct...)
(What street is this place located on?) @cross1
(And what street crosses that one at the nearest corner?) @cross2
[# (entering new street or cross-street address, or *partial* work/school address)]
City: @city
[# (entering new street or cross-street address, or *partial* work/school address)]
State: @state
[# (entering new street or cross-street address, or *partial* work/school address)]
ZIP Code: @zip (OPTIONAL)
>Q50a<
What was this destination?
<1> Workplace
<2> Other work-related place
<3> School
<4> Shopping or errands
<5> Social, entertainment or dining
<6> Home
<7> Childcare provider
<8> Other (SPECIFY ON NEXT SCREEN) [goto Q50a2]
<98> DON'T KNOW
<99> REFUSED
@ [goto Q51a]
>Q50a2< [blue](Enter Other Location)[n]
@ [@] [allow 50]
>Q51a< What time did you leave to go to this location?
<1> Enter time
<7> NO CODED RESPONSE APPLICABLE (SPECIFY)[specify]
What modes of transportation did you use to get there?
[blue]IF R SELECTS BUS OR TRAIN, PROBE:[N] (Please include how you got to the bus/train. For example, did you walk, drive, or ride your bike?)
@1 Car or other private vehicle as driver, @2 Car or other private vehicle as passenger, @3 Bus, @4 Train, @5 Walking, @6 Cycling, or @7 Some other way? (Please specify.)
@98 DON'T KNOW @99 REFUSED
>Q49b<
Now I'll ask about the second segment of your trip. What was the address of your second stop? Please provide either an address or an intersection.
<1> Home address ("[fill ADDR]") [if WSADDR ne <>]
<2> Work or School address ("[fill WSADDR]")
<3> SPECIFY NEW ADDRESS
<4> SPECIFY INTERSECTION
<7> NO CODED RESPONSE APPLICABLE (SPECIFY) [specify]
<8> DON'T KNOW
<9> REFUSED
[# (entering new street address)]
[blue](Probe for apartment number; include it in the street field)[n] [blue](Include street direction = N/S/E/W, and type = St/Ave/Blvd/Place/Ct...)
Street: @street
[# (entering new cross-street address)]
[blue](Specify Intersection)[n] [blue](Include street direction = N/S/E/W, and type = St/Ave/Blvd/Place/Ct...)
(What street is this place located on?) @cross1
(And what street crosses that one at the nearest corner?) @cross2
[# (entering new street or cross-street address, or *partial* work/school address)]
City: @city
[# (entering new street or cross-street address, or *partial* work/school address)]
State: @state
[# (entering new street or cross-street address, or *partial* work/school address)]
ZIP Code: @zip (OPTIONAL)
>Q50b< What was this destination?
<1> Workplace
<2> Other work-related place
<3> School
<4> Shopping or errands
<5> Social, entertainment or dining
<6> Home
<7> Childcare provider
<8> Other (SPECIFY ON NEXT SCREEN) [goto Q50b2]
<98> DON'T KNOW
<99> REFUSED
@ [goto Q51b]
>Q50b2< [blue](Enter Other Location)[n]
@ [@] [allow 50]
>Q51b< What time did you leave to go to this location?
<1> Enter time
<7> NO CODED RESPONSE APPLICABLE (SPECIFY)[specify]
<7> NO CODED RESPONSE APPLICABLE (SPECIFY)[specify]
<8> DON'T KNOW
<9> REFUSED
[blue]ENTER TIME. USE 24-HOUR CLOCK.
| 4:00 AM = 0400 | 2:00 PM = 1400 |
| 5:00 AM = 0500 | 3:00 PM = 1500 |
| 6:00 AM = 0600 | 4:00 PM = 1600 |
| 7:00 AM = 0700 | 5:00 PM = 1700 |
| 8:00 AM = 0800 | 6:00 PM = 1800 |
| 9:00 AM = 0900 | 7:00 PM = 1900 |
| 10:00 AM = 1000 | 8:00 PM = 2000 |
| 11:00 AM = 1100 | 9:00 PM = 2100 |
| 12:00 PM = 1200 | 10:00 PM = 2200 |
| 1:00 PM = 1300 | 11:00 PM = 2300 | [n]
<0000-2359>
>Q53b< Please give us your best estimate of about how long the trip was in miles.
<0.1-96.9> Miles
<97> NO CODED RESPONSE APPLICABLE (SPECIFY)[specify]
<98> DON'T KNOW
<99> REFUSED
@
>Q54b<
What modes of transportation did you use to get there?
[blue]IF R SELECTS BUS OR TRAIN, PROBE:[N] (Please include how you got to the bus/train. For example, did you walk, drive, or ride your bike?)
@1 Car or other private vehicle as driver, @2 Car or other private vehicle as passenger, @3 Bus, @4 Train, @5 Walking, @6 Cycling, or @7 Some other way? (Please specify.)
@98 DON'T KNOW @99 REFUSED
>Q51c< What time did you leave to go to your final destination for the day?
<1> Enter time
<7> NO CODED RESPONSE APPLICABLE (SPECIFY)[specify]
Please give us your best estimate of about how long the trip was in miles.
<0.1-96.9> Miles
<97> NO CODED RESPONSE APPLICABLE (SPECIFY)[specify]
<98> DON'T KNOW <99> REFUSED
@
>Q54c< What modes of transportation did you use to get there?
[blue]IF R SELECTS BUS OR TRAIN, PROBE:[N] (Please include how you got to the bus/train. For example, did you walk, drive, or ride your bike?)
@1 Car or other private vehicle as driver, @2 Car or other private vehicle as passenger, @3 Bus, @4 Train, @5 Walking, @6 Cycling, or @7 Some other way? (Please specify.)
@98 DON'T KNOW @99 REFUSED
>Q55_1<
Thinking about the entire return trip from your main activity location, how much did you spend on parking? (Please give us your best estimate.)
<0-50> Enter amount to the nearest dollar
<97> NO CODED RESPONSE APPLICABLE (SPECIFY)[specify]
<98> DON'T KNOW <99> REFUSED
@
>Q55_2<
If you had driven the entire way from your main activity location, making the same stops, how much would you have spent on parking? (Please give us your best estimate.)
<0-50> Enter amount to the nearest dollar
<97> NO CODED RESPONSE APPLICABLE (SPECIFY)[specify]
<98> DON'T KNOW
<99> REFUSED
>Q56_1<
Thinking about the entire return trip from your main activity location, how much did you spend on highway tolls? (Please give us your best estimate.)
If you had driven the entire way from your main activity location, making the same stops, how much would you have spent on highway tolls? (Please give us your best estimate.)
This is the start of the section where we ask about other “tours” on the travel diary day. Here R should tell us about other round-trip activities they took either before their main activity or after. For example, did they drop their kids off at daycare and come home before they left for their main activity or did they go out to dinner after they got home from their main activity. This series of questions is similar to the questions about the main activity, but there are fewer of them and we ask for less detail.
>Q57< Other than this tour to your main activity for the day, did you go out before or after that trip on this day?
>Q58< [# DS: Test: Q58's new response options and the follow-up logic that uses them on How many times did you go out besides your trip to your main activity?
Again, if the R had more than 2 other tours on top of their main activity, we ask them to select the two most important of those tours.
>Q59a<
You mentioned that you went out [fill Q58] other times aside from your main activity. Of these [fill Q58] other trips, please select the [u]two[n] that include the most important activities. What was the destination of your second tour of the day?
<1> Workplace
<2> Other work-related place
<3> School
<4> Shopping or errands
<5> Social, entertainment or dining
<6> Home
<7> Other (SPECIFY ON NEXT SCREEN) [goto Q59a2]
<98> DON'T KNOW <99> REFUSED
@ [goto Q60a]
>Q59a2< [blue](Enter Other Location)[n]
@ [@] [allow 50]
Please note we ask about transportation modes there AND back in this question.
>Q60a<
What modes of transportation did you use to get there and back?
[blue]IF R SELECTS BUS OR TRAIN, PROBE:[N]
(Please include how you got to the bus/train. For example, did you walk, drive, or ride your bike?)
@1 Car or other private vehicle as driver, @2 Car or other private vehicle as passenger, @3 Bus, @4 Train, @5 Walking, @6 Cycling, or @7 Some other way? (Please specify.)
@98 DON'T KNOW @99 REFUSED
[@1] [default answer <0>] <0> No <1> Yes
[@2] [default answer <0>] <0> No <1> Yes
[@3] [default answer <0>] <0> No <1> Yes
[@4] [default answer <0>] <0> No <1> Yes
[@5] [default answer <0>] <0> No <1> Yes
[@6] [default answer <0>] <0> No <1> Yes
[@7] [default answer <0>] <0> No <1> Yes[specify]
[@98] [default answer <0>] <0> No <1> Yes
[@99] [default answer <0>] <0> No <1> Yes
>Q61a<
| Page
What time did you leave to go to this location?
<1> Enter time
<7> NO CODED RESPONSE APPLICABLE (SPECIFY)[specify]
<8> DON'T KNOW
<9> REFUSED
[blue]ENTER TIME. USE 24-HOUR CLOCK.
| 4:00 AM = 0400 | 2:00 PM = 1400 |
| 5:00 AM = 0500 | 3:00 PM = 1500 |
| 6:00 AM = 0600 | 4:00 PM = 1600 |
| 7:00 AM = 0700 | 5:00 PM = 1700 |
| 8:00 AM = 0800 | 6:00 PM = 1800 |
| 9:00 AM = 0900 | 7:00 PM = 1900 |
| 10:00 AM = 1000 | 8:00 PM = 2000 |
| 11:00 AM = 1100 | 9:00 PM = 2100 |
| 12:00 PM = 1200 | 10:00 PM = 2200 |
| 1:00 PM = 1300 | 11:00 PM = 2300 | [n]
<0000-2359>
>Q62a<
What time did you arrive at this location?
<1> Enter time
<7> NO CODED RESPONSE APPLICABLE (SPECIFY)[specify]
<8> DON'T KNOW
<9> REFUSED
[blue]ENTER TIME. USE 24-HOUR CLOCK.
| 4:00 AM = 0400 | 2:00 PM = 1400 |
| 5:00 AM = 0500 | 3:00 PM = 1500 |
| 6:00 AM = 0600 | 4:00 PM = 1600 |
| 7:00 AM = 0700 | 5:00 PM = 1700 |
| 8:00 AM = 0800 | 6:00 PM = 1800 |
| 9:00 AM = 0900 | 7:00 PM = 1900 |
| 10:00 AM = 1000 | 8:00 PM = 2000 |
| 11:00 AM = 1100 | 9:00 PM = 2100 |
| 12:00 PM = 1200 | 10:00 PM = 2200 |
| 1:00 PM = 1300 | 11:00 PM = 2300 | [n]
<0000-2359>
In addition to asking about departure and arrival times to and from the destination, we also ask what time they arrived back at their final destination to get a sense of how long the entire round trip activity took.
>Q63a< What time did you arrive back at your final destination?
<1> Enter time
<7> NO CODED RESPONSE APPLICABLE (SPECIFY)[specify]
How many total stops did you make on your way there and back?
(For example, if you made one stop on the way there and two stops on the way back then you made three stops total.)
<0-95> 0 to 95 stops
<96> 96 or more stops
<97> NO CODED RESPONSE APPLICABLE (SPECIFY)[specify]
<98> DON'T KNOW
<99> REFUSED
@
The questions are repeated if the R had 3rd tour.
>Q59b<
Now we'd like to ask you about your third tour of the day.
What was the destination of your third tour of the day?
<1> Workplace
<2> Other work-related place
<3> School
<4> Shopping or errands
<5> Social, entertainment or dining
<6> Home
<7> Other (SPECIFY ON NEXT SCREEN) [goto Q59b2]
<98> DON'T KNOW
<99> REFUSED
@ [goto Q60b]
>Q59b2< [blue](Enter Other Location)[n] @ [@] [allow 50]
>Q60b< What modes of transportation did you use to get there and back?
D‐50 | Page
[blue]IF R SELECTS BUS OR TRAIN, PROBE:[N] (Please include how you got to the bus/train. For example, did you walk, drive, or ride your bike?)
@1 Car or other private vehicle as driver, @2 Car or other private vehicle as passenger, @3 Bus, @4 Train, @5 Walking, @6 Cycling, or @7 Some other way? (Please specify.)
@98 DON'T KNOW @99 REFUSED
>Q61b< What time did you leave to go to this location?
<1> Enter time
<7> NO CODED RESPONSE APPLICABLE (SPECIFY)[specify]
How many total stops did you make on your way there and back?
(For example, if you made one stop on the way there and two stops on the way back then you made three stops total.)
<0-95> 0 to 95 stops <96> 96 or more stops
<97> NO CODED RESPONSE APPLICABLE (SPECIFY)[specify]
<98> DON'T KNOW
<99> REFUSED @
The next two sets of questions reference the respondent’s trip to their main activity only.
>Q65_i<
Now I'd like to talk about your travel from your starting location to your main activity for the day.
[blue]IF NECESSARY[n]
By "starting location" we mean your starting location for the day which you said was your START LOCATION
[blue]IF NECESSARY[n]
By "main activity" location we mean where you did your main activity for the day which you said was your MAIN LOCATION
For this trip, I'd like to read you some statements about the transportation modes that you took, and also those that you didn't take. When I ask you
| Page
about a mode of transportation, please think of using that mode for your entire trip.
For each statement I will ask you to tell me whether you strongly agree, agree, are neutral, disagree, or strongly disagree. All of the items will use the same response options. For each statement, please tell me which option best describes your response.
[blue]Enter <1> To Continue[n]
>Q65< Please think of driving or riding in a car, including parking if necessary.
"Driving a car for this trip is quick." Would you say you...
<1> Strongly agree, <2> Agree,
<3> Are neutral on this, <4> Disagree, or <5> Strongly disagree?
<7> NO CODED RESPONSE APPLICABLE (SPECIFY)[specify]
<8> DON'T KNOW
<9> REFUSED @
>Q66<
(Please think of driving or riding in a car, including parking if necessary.)
"Driving a car for this trip is safe." Would you say you...
<1> Strongly agree, <2> Agree, <3> Are neutral on this, <4> Disagree, or <5> Strongly disagree?
<7> NO CODED RESPONSE APPLICABLE (SPECIFY)[specify]
<8> DON'T KNOW
<9> REFUSED @
>Q67<
(Please think of driving or riding in a car, including parking if necessary.)
"Driving a car for this trip is convenient." Would you say you...
<1> Strongly agree, <2> Agree, <3> Are neutral on this, <4> Disagree, or <5> Strongly disagree?
<7> NO CODED RESPONSE APPLICABLE (SPECIFY)[specify]
<8> DON'T KNOW
| Page
<9> REFUSED
>Q68<
(Please think of driving or riding in a car, including parking if necessary.)
"Driving a car for this trip is worth it even if it costs more." (Would you say you...)
<1> Strongly agree, <2> Agree,
<3> Are neutral on this, <4> Disagree, or <5> Strongly disagree?
<7> NO CODED RESPONSE APPLICABLE (SPECIFY)[specify]
<8> DON'T KNOW
<9> REFUSED
>Q69< (Please think of driving or riding in a car, including parking if necessary.)
[if Q38 eq<1> or Q38 eq<2>]
"People like me often drive for work trips." [else]
[if Q38 eq<3>]
"People like me often drive for school trips." [else]
[if Q38 eq<4>]
"People like me often drive for shopping or errands trips." [else]
[if Q38 eq<5>]
"People like me often drive for social, entertainment, or dining trips." [else]
[if Q38 eq<6>]
"People like me often drive home." [else]
[if Q38 eq<7>]
"People like me often drive to go to their childcare provider." [else]
[if Q38 eq<8>] [# OTHER location]
"People like me often drive for '[fill Q38a]' trips." [else]
[if Q38 eq<97> or Q38 eq<98> or Q38 eq<99>] [# NCRA/DK/RF location]
"People like me often drive for trips like this." [endif 8]
(Would you say you...)
<1> Strongly agree, <2> Agree, <3> Are neutral on this, <4> Disagree, or <5> Strongly disagree?
<7> NO CODED RESPONSE APPLICABLE (SPECIFY)[specify]
<8> DON'T KNOW <9> REFUSED @
>Q70< (Please think of driving or riding in a car, including parking if necessary.)
"Overall, driving a car is a good option for this trip." (Would you say you...)
<1> Strongly agree, <2> Agree, <3> Are neutral on this, <4> Disagree, or <5> Strongly disagree?
<7> NO CODED RESPONSE APPLICABLE (SPECIFY)[specify]
<8> DON'T KNOW
<9> REFUSED
>Q71< Please think of using public transportation, including getting to the bus or train.
"Using public transportation for this trip is quick." Would you say you...
<1> Strongly agree, <2> Agree, <3> Are neutral on this, <4> Disagree, or <5> Strongly disagree?
>Q77< Please think of cycling to your destination.
"Cycling for this trip is quick." Would you say you...
<1> Strongly agree, <2> Agree, <3> Are neutral on this, <4> Disagree, or <5> Strongly disagree?
<7> NO CODED RESPONSE APPLICABLE (SPECIFY)[specify]
<8> DON'T KNOW
<9> REFUSED
@
>Q78< (Please think of cycling to your destination.)
"Cycling for this trip is safe." (Would you say you...)
<1> Strongly agree, <2> Agree, <3> Are neutral on this, <4> Disagree, or <5> Strongly disagree?
<7> NO CODED RESPONSE APPLICABLE (SPECIFY)[specify]
<8> DON'T KNOW
<9> REFUSED
@
>Q79< (Please think of cycling to your destination.)
"Cycling for this trip is convenient." (Would you say you...)
<1> Strongly agree, <2> Agree, <3> Are neutral on this, <4> Disagree, or <5> Strongly disagree?
<7> NO CODED RESPONSE APPLICABLE (SPECIFY)[specify]
<8> DON'T KNOW
<9> REFUSED
@
>Q80< (Please think of cycling to your destination.)
"The low cost of cycling is an important benefit for me." (Would you say you...)
<1> Strongly agree, <2> Agree, <3> Are neutral on this, <4> Disagree, or <5> Strongly disagree?
<7> NO CODED RESPONSE APPLICABLE (SPECIFY)[specify]
<8> DON'T KNOW
<9> REFUSED
@ >Q81< (Please think of cycling to your destination.)
"Cycling for this trip provides me with important benefits like
exercise or fresh air." (Would you say you...)
<1> Strongly agree, <2> Agree, <3> Are neutral on this, <4> Disagree, or <5> Strongly disagree?
<7> NO CODED RESPONSE APPLICABLE (SPECIFY)[specify]
<8> DON'T KNOW
<9> REFUSED
@
>Q82< (Please think of cycling to your destination.)
[if Q38 eq<1> or Q38 eq<2>]
"People like me often cycle for work trips." [else]
[if Q38 eq<3>]
"People like me often cycle for school trips." [else]
[if Q38 eq<4>]
"People like me often cycle for shopping or errands trips." [else]
[if Q38 eq<5>]
"People like me often cycle for social, entertainment, or dining trips." [else]
[if Q38 eq<6>]
"People like me often cycle to get home." [else]
[if Q38 eq<7>]
"People like me often cycle to go to their childcare provider." [else]
[if Q38 eq<8>] [# OTHER location]
"People like me often cycle for '[fill Q38a]' trips." [else]
[if Q38 eq<97> or Q38 eq<98> or Q38 eq<99>] [# NCRA/DK/RF location]
"People like me often cycle for trips like this." [endif 8]
(Would you say you...)
<1> Strongly agree, <2> Agree, <3> Are neutral on this, <4> Disagree, or <5> Strongly disagree?
<7> NO CODED RESPONSE APPLICABLE (SPECIFY)[specify]
<8> DON'T KNOW
<9> REFUSED
@
>Q83< (Please think of cycling to your destination.)
"Overall, cycling is a good option for this trip." (Would you say you...)
<1> Strongly agree, <2> Agree, <3> Are neutral on this, <4> Disagree, or <5> Strongly disagree?
<7> NO CODED RESPONSE APPLICABLE (SPECIFY)[specify]
<8> DON'T KNOW
<9> REFUSED
@
>Q84< [if Q45a@1 eq<1> or Q45a@2 eq<1>goto Q85]
[if Q45b@1 eq<1> or Q45b@2 eq<1>goto Q85]
[if Q45c@1 eq<1> or Q45c@2 eq<1>goto Q85]
Could you have chosen to drive or ride in a private vehicle such as a car, truck or motorcycle for this trip?
<1> Yes
<2> No
<7> NO CODED RESPONSE APPLICABLE (SPECIFY)[specify]
<8> DON'T KNOW
<9> REFUSED
@
>Q85< [if Q45a@3 eq<1> or Q45a@4 eq<1> or Q45a@5 eq<1> or Q45a@6 eq<1> or Q45a@7 eq<1>goto Q87_i]
[if Q45b@3 eq<1> or Q45b@4 eq<1> or Q45b@5 eq<1> or Q45b@6 eq<1> or Q45b@7 eq<1>goto Q87_i]
[if Q45c@3 eq<1> or Q45c@4 eq<1> or Q45c@5 eq<1> or Q45c@6 eq<1> or Q45c@7 eq<1>goto Q87_i]
Could you have chosen another form of transportation for this trip, such as public transit, walking, or cycling?
<1> Yes
<2> No
<7> NO CODED RESPONSE APPLICABLE (SPECIFY)[specify]
<8> DON'T KNOW
<9> REFUSED
Please note that the R should look at the improvements in the image and imagine those improvements to exist at BOTH ENDS of their trip – not only at their starting location. This set of questions is identical to the previous set but is asking them in the context of the improvements detailed in the image.
>Q87_i<
For the next part of the interview, you will need to look at the images enclosed in the packet you received about the study. You will also need the worksheets that were sent in the packet.
Now please look at image #6. This is a street in your neighborhood where we've sketched a number of improvements. I want you to imagine that these improvements
| Page
have been made at [u]both ends[n] of your trip. Consider how it would be for you to drive, take public transit, walk, or cycle in this different environment.
Thinking about the same trip from your starting location to your main activity of the day, please answer the following questions while keeping this different environment in mind. Please consider using the single mode of transportation I ask you about.
For each statement I will ask you to tell me whether you strongly agree, agree, are neutral, disagree, or strongly disagree. All of the items will use the same response options. For each statement, please tell me which option best describes your response.
[blue]Enter <1> To Continue[n]
@
>Q87<
Please think of driving or riding in a car in the [u]new environment[n], including parking if necessary.
"Driving a car for this trip is quick." Would you say you...
<1> Strongly agree,
<2> Agree,
<3> Are neutral on this,
<4> Disagree, or <5> Strongly disagree?
<7> NO CODED RESPONSE APPLICABLE (SPECIFY)[specify]
<8> DON'T KNOW
<9> REFUSED
@
>Q88<
(Please think of driving or riding in a car in the [u]new environment[n], including parking if necessary.)
"Driving a car for this trip is safe." Would you say you...
<1> Strongly agree, <2> Agree,
<3> Are neutral on this, <4> Disagree, or <5> Strongly disagree?
<7> NO CODED RESPONSE APPLICABLE (SPECIFY)[specify]
<8> DON'T KNOW
<9> REFUSED
@
>Q89< (Please think of driving or riding in a car in the [u]new environment[n], including parking if necessary.)
"Driving a car for this trip is convenient." Would you say you...
<1> Strongly agree, <2> Agree,
<3> Are neutral on this,
| Page
<4> Disagree, or <5> Strongly disagree?
<7> NO CODED RESPONSE APPLICABLE (SPECIFY)[specify]
<8> DON'T KNOW
<9> REFUSED @
>Q90<
(Please think of driving or riding in a car in the [u]new environment[n], including parking if necessary.)
"Driving a car for this trip is worth it even if it costs more." (Would you say you...)
<1> Strongly agree, <2> Agree, <3> Are neutral on this, <4> Disagree, or <5> Strongly disagree?
<7> NO CODED RESPONSE APPLICABLE (SPECIFY)[specify]
<8> DON'T KNOW
<9> REFUSED @
>Q91<
(Please think of driving or riding in a car in the [u]new environment[n], including parking if necessary.)
"Overall, driving a car is a good option for this trip." (Would you say you...)
<1> Strongly agree, <2> Agree, <3> Are neutral on this, <4> Disagree, or <5> Strongly disagree?
<7> NO CODED RESPONSE APPLICABLE (SPECIFY)[specify]
<8> DON'T KNOW
<9> REFUSED @
>Q92<
Please think of using public transportation in the [u]new environment[n], including getting to the bus or train.
"Using public transportation for this trip is quick." Would you say you...
<1> Strongly agree, <2> Agree, <3> Are neutral on this, <4> Disagree, or <5> Strongly disagree?
<7> NO CODED RESPONSE APPLICABLE (SPECIFY)[specify]
<8> DON'T KNOW
D‐62 | Page
<9> REFUSED
>Q93<
(Please think of using public transportation in the [u]new environment[n], including getting to the bus or train.)
"Using public transportation for this trip is safe." (Would you say you...)
<1> Strongly agree, <2> Agree,
<3> Are neutral on this, <4> Disagree, or <5> Strongly disagree?
<7> NO CODED RESPONSE APPLICABLE (SPECIFY)[specify]
<8> DON'T KNOW
<9> REFUSED
>Q94<
(Please think of using public transportation in the [u]new environment[n], including getting to the bus or train.)
"Using public transportation for this trip is convenient." (Would you say you...)
<1> Strongly agree,
<2> Agree,
<3> Are neutral on this,
<4> Disagree, or <5> Strongly disagree?
<7> NO CODED RESPONSE APPLICABLE (SPECIFY)[specify]
<8> DON'T KNOW
<9> REFUSED
>Q95<
(Please think of using public transportation in the [u]new environment[n], including getting to the bus or train.)
"Public transit is an affordable option for this trip." (Would you say you...)
<1> Strongly agree, <2> Agree,
<3> Are neutral on this, <4> Disagree, or <5> Strongly disagree?
<7> NO CODED RESPONSE APPLICABLE (SPECIFY)[specify]
<8> DON'T KNOW
<9> REFUSED
>Q96<
(Please think of using public transportation in the [u]new environment[n], including getting to the bus or train.)
"Overall, public transit is a good option for this trip." (Would you say you...)
<1> Strongly agree, <2> Agree, <3> Are neutral on this, <4> Disagree, or <5> Strongly disagree?
<7> NO CODED RESPONSE APPLICABLE (SPECIFY)[specify]
<8> DON'T KNOW
<9> REFUSED
@
>Q97< Please think of cycling to your destination in the [u]new environment[n].
"Cycling for this trip is quick." Would you say you...
<1> Strongly agree, <2> Agree, <3> Are neutral on this, <4> Disagree, or <5> Strongly disagree?
<7> NO CODED RESPONSE APPLICABLE (SPECIFY)[specify] <8> DON'T KNOW
<9> REFUSED @
>Q98< (Please think of cycling to your destination in the [u]new environment[n].)
"Cycling for this trip is safe." (Would you say you...)
<1> Strongly agree, <2> Agree, <3> Are neutral on this, <4> Disagree, or <5> Strongly disagree?
>Q99< (Please think of cycling to your destination in the [u]new environment[n].)
"Cycling for this trip is convenient." (Would you say you...)
<1> Strongly agree, <2> Agree,
| Page
<3> Are neutral on this, <4> Disagree, or <5> Strongly disagree?
<7> NO CODED RESPONSE APPLICABLE (SPECIFY)[specify]
<8> DON'T KNOW
<9> REFUSED @
>Q100<
(Please think of cycling to your destination in the [u]new environment[n].)
"Cycling for this trip provides me with important benefits like exercise or fresh air." (Would you say you...)
<1> Strongly agree, <2> Agree, <3> Are neutral on this, <4> Disagree, or <5> Strongly disagree?
<7> NO CODED RESPONSE APPLICABLE (SPECIFY)[specify]
<8> DON'T KNOW
<9> REFUSED @
>Q101<
(Please think of cycling to your destination in the [u]new environment[n].)
"Overall, cycling is a good option for this trip." (Would you say you...)
<1> Strongly agree, <2> Agree, <3> Are neutral on this, <4> Disagree, or <5> Strongly disagree?
<7> NO CODED RESPONSE APPLICABLE (SPECIFY)[specify]
<8> DON'T KNOW
<9> REFUSED
This section requires the R to use the six worksheets we sent to them in the packet. You will need to take some time to access Google maps and enter information collected from that program in order to calculate the values that need to be filled in on the worksheets. It is important to communicate to the respondent what is happening so they understand your silence.
>WSheets_start<
>Google_i<
In order to complete the next section, I need to calculate some values based on the answers you've given me during our interview. This will take me just a few minutes. Thanks for your patience as I bring up these values.
[blue]Enter <1> To Continue[n]
>Google_1< [blue]Get Google estimates...
1) Go to Google "Get Directions" site (Click on the help-file link) (Or go to www.google.com, click "Maps", and click "Get Directions")
2) Enter starting address into Google:
3) Enter destination address into Google:
Enter <1> To Continue
>Google_2< [blue]Get Google estimates...
Does Google show at least one public-transit estimate that uses a Google train?
<1> Yes [goto Google] <2> No [if WSADDR eq<> or Q37@ask eq<1> or Q37@ask ge<7>](SKIP OUT)[endif]
>Google_3< [blue]Get Google estimates...
Try again, this time with the work or school address as the destination:
1) Enter starting address into Google:
2) Enter destination address into Google:
Enter <1> To Continue
>Google_4< [blue]Get Google estimates...
Does Google now show at least one public-transit estimate that uses a Google train?
<1> Yes [goto Google] <2> No (SKIP OUT)
>Google<
[blue]Get Google estimates...
1) Type in Google's total driving estimate, in minutes (If more than one, type in the longest *time* estimate) @drive
2) Type in Google's total biking estimate, in minutes (If more than one, type in the longest *time* estimate) @bike
3) Type in Google's public-transit estimate, in minutes
[B]minus any travel time to the train station[n][blue] (If more than one, type in the longest *time* estimate that also involves a train ride)
@tran
To assign a parking cost, you must use the 2nd link in the help file to locate the respondent’s main activity location in relation to the two areas outlined on the map – the Central Business District and the Rosemont/O’Hare area. Knowing where the main activity location falls will help determine which parking cost to assign. This will only come up if the respondent reported that there are 0 parking costs at their work or school or that they don’t know what the parking costs are.
[# if no work or school parking cost, will assign parking cost based on general area)]
4) Indicate which of the three parking areas the main activity is in: (Since no specific parking cost for work or school was mentioned) (Click on the help-file link)
<1> Central Business District
<2> O'Hare area
<3> Other (suburbs etc)
>DesignNum_intro< [blue]Read in the first file used to determine the worksheet values
Enter a <1> to read in
Enter a <2> to try again to read in (after a warning about a problem reading in the DesignNum value) [endif] @
The error messages were included here so that you would be prepared for this if it happens. The programming has CASES retrieve external files that co ntain formulas that are used in determining the values on the worksheets. An error may occur while the program is retrieving these files if two interviewers are working and asking the system to retrieve a file at exactly the same time. All you need to do is back up and try again and it should work. The instructions for this are contained in the error message on the screen.
>DesignNum< [blue]PROBLEM:
There was a problem reading the DesignNum value from the external file. (Value read in = "[fill W_DesignNum_m]")
[u]Back up to the previous item (DesignNum_intro) and enter a "2" to try again to read in the value.[n][blue]
If you've already tried this, we'll have to stop the interview, fix the problem, and call the respondent back. (Notify a supervisor immediately.)
Press <1> To Send Case To SupHold [etc<skothr>]
>DesignNum_next< [blue]Read in the second file used to determine the worksheet values
Enter a <1> to read in
Enter a <2> to try again to read in (after a warning about a problem reading in the Design value) [endif]
@ >W_Design< [blue]PROBLEM:
There was a problem reading the Design value "[fill W_Design_m1]" from the external file. (Value read in = "[fill W_Design_m2]")
[u]Back up to the previous item (GetDesign_intro) and enter a "2" to try again to read in the value.[n][blue]
If you've already tried this, we'll have to stop the interview, fix the problem, and call the respondent back. (Notify a supervisor immediately.)
Press <1> To Send Case To SupHold [etc<skothr>]
@
>Q102_i<
You will need the worksheets we provided for the following exercise. I will start by giving you values to fill in on one of the worksheets. These are the choices you'd have available to you for this trip in the new environment we've sketched in image #1. In the image, you'll see a new kind of transit bus that could circulate frequently through your neighborhood and drop people off at the CTA station or station area. We'll call that the "Community Transit Bus." Please imagine that the improvements displayed in the image exist all along your route to the train station and think about how you might get to your main activity of the day in this new environment.
[blue]Enter <1> To Continue[n]
@
>Q102_1i<
I'm going to read the values for worksheet #1 now. Please fill in the boxes as I read them.
A) Box A = "[fill BOXA_1]" minutes [blue](Transit-bus time to station: 1st row, 2nd column)[n]
B) Box B = "[fill BOXB]" minutes [blue](Walking time to station: 1st row, 3rd column)[n]
C) Box C = "[fill BOXC]" minutes [blue](Biking time to station: 1st row, 4th column)[n]
D) Box D = "[fill BOXD]" minutes. Please enter this in all 3 spaces. [blue](CTA travel time, not including time to station or time waiting at station: 2nd row, columns 2 and 3 and 4)[n]
E) Box E = "[fill BOXE_1]" dollars
[blue](Parking cost when drive entire trip: 3rd row, 1st column)[n]
F) Box F = "[fill BOXF]" minutes. Please enter this in all 3 spaces. [blue](CTA frequency: 5th row, columns 2 and 3 and 4)[n]
[blue](Driving time for entire trip: 8th row, 1st column)[n]
I) Box I = "[fill BOXI_1]" minutes
[blue](Bus + CTA time for entire trip: 8th row, 2nd column)[n]
J) Box J = "[fill BOXJ_1]" minutes
[blue](Walk + CTA time for entire trip: 8th row, 3rd column)[n]
K) Box K = "[fill BOXK_1]" minutes
[blue](Bike + CTA time for entire trip: 8th row, 4th column)[n]
L) Box L = "[fill BOXL]" minutes
[blue](Biking time for entire trip: 8th row, 5th column)[n]
[blue]Enter <1> To Continue[n]
@
You can use your judgment to determine how long to wait while the respondent absorbs all the information on the worksheet. We recommend approximately 15 seconds, but use your best judgment and ask if the respondent needs more time.
>Q102_1i_2< I'm going to give you some time to review each worksheet and image before I ask the next question. Each column in worksheet #1 summarizes a different way of getting to your destination in the new environment that image #1 displays. Please keep in mind that the scenarios we present are hypothetical, so some of the costs and travel times may not be the same as what you reported earlier.
[blue]Wait about 15 seconds[n]
Are you ready for the question?
[blue]Enter <1> To Continue[n]
@
>Q102_1<
[blue](Image/Worksheet #1)[n]
Of the five types of transportation presented here, which mode would you select for your trip? Would you...
<1> Drive or be driven/dropped off by someone else,
<2> Take the "Community Transit Bus" to the CTA station/station area, <3> Walk to the CTA station or station area, <4> Cycle to the CTA station or station area, or
<5> Cycle to your destination?
<7> NO CODED RESPONSE APPLICABLE (SPECIFY)[specify]
<8> DON'T KNOW
<9> REFUSED
@
>Q102_1p< [allow int 1]
[# skip this follow-up question if Q102_1=RF (an NCRA gets just "What was the main factor in that choice?" and a DK gets "Why is that?")]
[if Q102_1 gt<8>goto Q102_2i]
[blue](Image/Worksheet #1)[n]
[if Q102_1 eq<1>]
So you would choose to drive or be driven or dropped off by someone else for this trip.
What was the main factor in that choice? [else]
[if Q102_1 eq<2>]
So you would choose to take the "Community Transit Bus" to the CTA station or station area for this trip.
What was the main factor in that choice? [else]
[if Q102_1 eq<3>]
So you would choose to walk to the CTA station or station area for this trip.
What was the main factor in that choice? [else]
[if Q102_1 eq<4>]
So you would choose to cycle to the CTA station or station area for this trip.
What was the main factor in that choice? [else]
[if Q102_1 eq<5>]
So you would choose to cycle to your destination for this trip.
What was the main factor in that choice? [else]
[if Q102_1 eq<7>]
What was the main factor in that choice? [else]
[if Q102_1 eq<8>] Why is that? [endif 7]
@ [specify] [goto Q102_2i]
The process is repeated for the remaining 5 worksheets. Only values in Box A, G, H, and I will change. The remaining box values will stay the same for all worksheets.
>Q102_2i<
Now I'm going to read the values for worksheet #2. Please fill in the boxes as I read them.
A) Box A = "[fill BOXA_2]" minutes
[blue](Transit-bus time to station: 1st row, 2nd column)[n]
B) Box B = "[fill BOXB]" minutes [blue](Walking time to station: 1st row, 3rd column)[n]
C) Box C = "[fill BOXC]" minutes [blue](Biking time to station: 1st row, 4th column)[n]
D) Box D = "[fill BOXD]" minutes. Please enter this in all 3 spaces. [blue](CTA travel time, not including time to station or time waiting at station: 2nd row, columns 2 and 3 and 4)[n]
E) Box E = "[fill BOXE_2]" dollars [blue](Parking cost when drive entire trip: 3rd row, 1st column)[n]
F) Box F = "[fill BOXF]" minutes. Please enter this in all 3 spaces. [blue](CTA frequency: 5th row, columns 2 and 3 and 4)[n]
H) Box H = "[fill BOXH_2]" minutes [blue](Driving time for entire trip: 8th row, 1st column)[n]
I) Box I = "[fill BOXI_2]" minutes [blue](Bus + CTA time for entire trip: 8th row, 2nd column)[n]
J) Box J = "[fill BOXJ_2]" minutes [blue](Walk + CTA time for entire trip: 8th row, 3rd column)[n]
K) Box K = "[fill BOXK_2]" minutes [blue](Bike + CTA time for entire trip: 8th row, 4th column)[n]
L) Box L = "[fill BOXL]" minutes [blue](Biking time for entire trip: 8th row, 5th column)[n]
[blue]Enter <1> To Continue[n]
@ >Q102_2< [blue](Image/Worksheet #2)[n]
Please look at image #2 and worksheet #2.
Of the five types of transportation presented here, which mode would you select for your trip? Would you...
<1> Drive or be driven/dropped off by someone else, <2> Take the "Community Transit Bus" to the CTA station/station area, <3> Walk to the CTA station or station area, <4> Cycle to the CTA station or station area, or <5> Cycle to your destination?
<7> NO CODED RESPONSE APPLICABLE (SPECIFY)[specify]
<8> DON'T KNOW
<9> REFUSED
@
>Q102_2p< [allow int 1]
[# skip this follow-up question if Q102_1=RF (an NCRA gets just "What was the main factor in that choice?" and a DK gets "Why is that?")]
So you would choose to drive or be driven or dropped off by someone else for this trip.
What was the main factor in that choice? [else]
[if Q102_2 eq<2>]
So you would choose to take the "Community Transit Bus" to the CTA station or station area for this trip.
What was the main factor in that choice? [else]
[if Q102_2 eq<3>]
So you would choose to walk to the CTA station or station area for this trip.
What was the main factor in that choice? [else]
[if Q102_2 eq<4>]
So you would choose to cycle to the CTA station or station area for this trip.
What was the main factor in that choice? [else]
[if Q102_2 eq<5>]
So you would choose to cycle to your destination for this trip.
What was the main factor in that choice? [else]
[if Q102_2 eq<7>]
What was the main factor in that choice? [else]
[if Q102_2 eq<8>] Why is that? [endif 7]
@ [specify] [goto Q102_3i]
>Q102_3i<
Now I'm going to read the values for worksheet #3. Please fill in the boxes as I read them.
A) Box A = "[fill BOXA_3]" minutes [blue](Transit-bus time to station: 1st row, 2nd column)[n]
B) Box B = "[fill BOXB]" minutes [blue](Walking time to station: 1st row, 3rd column)[n]
| Page
C) Box C = "[fill BOXC]" minutes [blue](Biking time to station: 1st row, 4th column)[n]
D) Box D = "[fill BOXD]" minutes. Please enter this in all 3 spaces. [blue](CTA travel time, not including time to station or time waiting at station: 2nd row, columns 2 and 3 and 4)[n]
E) Box E = "[fill BOXE_3]" dollars [blue](Parking cost when drive entire trip: 3rd row, 1st column)[n]
F) Box F = "[fill BOXF]" minutes. Please enter this in all 3 spaces. [blue](CTA frequency: 5th row, columns 2 and 3 and 4)[n]
H) Box H = "[fill BOXH_3]" minutes [blue](Driving time for entire trip: 8th row, 1st column)[n]
I) Box I = "[fill BOXI_3]" minutes [blue](Bus + CTA time for entire trip: 8th row, 2nd column)[n]
J) Box J = "[fill BOXJ_3]" minutes [blue](Walk + CTA time for entire trip: 8th row, 3rd column)[n]
K) Box K = "[fill BOXK_3]" minutes [blue](Bike + CTA time for entire trip: 8th row, 4th column)[n]
L) Box L = "[fill BOXL]" minutes [blue](Biking time for entire trip: 8th row, 5th column)[n]
[blue]Enter <1> To Continue[n]
@
>Q102_3< [blue](Image/Worksheet #3)[n]
Please look at image #3 and worksheet #3.
Of the five types of transportation presented here, which mode would you select for your trip? Would you...
<1> Drive or be driven/dropped off by someone else, <2> Take the "Community Transit Bus" to the CTA station/station area, <3> Walk to the CTA station or station area, <4> Cycle to the CTA station or station area, or <5> Cycle to your destination?
<7> NO CODED RESPONSE APPLICABLE (SPECIFY)[specify]
<8> DON'T KNOW
<9> REFUSED
>Q102_3p< [allow int 1]
[# skip this follow-up question if Q102_1=RF (an NCRA gets just "What was the main factor in that choice?" and a DK gets "Why is that?")]
So you would choose to drive or be driven or dropped off by someone else for this trip.
What was the main factor in that choice? [else]
[if Q102_3 eq<2>]
So you would choose to take the "Community Transit Bus" to the CTA station or station area for this trip.
What was the main factor in that choice? [else]
[if Q102_3 eq<3>]
So you would choose to walk to the CTA station or station area for this trip.
What was the main factor in that choice? [else]
[if Q102_3 eq<4>]
So you would choose to cycle to the CTA station or station area for this trip.
What was the main factor in that choice? [else]
[if Q102_3 eq<5>]
So you would choose to cycle to your destination for this trip.
What was the main factor in that choice? [else]
[if Q102_3 eq<7>]
What was the main factor in that choice? [else]
[if Q102_3 eq<8>] Why is that? [endif 7]
@ [specify] [goto Q102_4i]
>Q102_4i<
Now I'm going to read the values for worksheet #4. Please fill in the boxes as I read them.
A) Box A = "[fill BOXA_4]" minutes [blue](Transit-bus time to station: 1st row, 2nd column)[n]
B) Box B = "[fill BOXB]" minutes [blue](Walking time to station: 1st row, 3rd column)[n]
C) Box C = "[fill BOXC]" minutes [blue](Biking time to station: 1st row, 4th column)[n]
D) Box D = "[fill BOXD]" minutes. Please enter this in all 3 spaces. [blue](CTA travel time, not including time to station or time waiting at station: 2nd row, columns 2 and 3 and 4)[n]
E) Box E = "[fill BOXE_4]" dollars
D‐74 | Page
[blue](Parking cost when drive entire trip: 3rd row, 1st column)[n]
F) Box F = "[fill BOXF]" minutes. Please enter this in all 3 spaces. [blue](CTA frequency: 5th row, columns 2 and 3 and 4)[n]
H) Box H = "[fill BOXH_4]" minutes [blue](Driving time for entire trip: 8th row, 1st column)[n]
I) Box I = "[fill BOXI_4]" minutes [blue](Bus + CTA time for entire trip: 8th row, 2nd column)[n]
J) Box J = "[fill BOXJ_4]" minutes [blue](Walk + CTA time for entire trip: 8th row, 3rd column)[n]
K) Box K = "[fill BOXK_4]" minutes [blue](Bike + CTA time for entire trip: 8th row, 4th column)[n]
L) Box L = "[fill BOXL]" minutes [blue](Biking time for entire trip: 8th row, 5th column)[n]
[blue]Enter <1> To Continue[n]
@
>Q102_4< [blue](Image/Worksheet #4)[n]
Please look at image #4 and worksheet #4.
Of the five types of transportation presented here, which mode would you select for your trip? Would you...
<1> Drive or be driven/dropped off by someone else, <2> Take the "Community Transit Bus" to the CTA station/station area, <3> Walk to the CTA station or station area, <4> Cycle to the CTA station or station area, or <5> Cycle to your destination?
<7> NO CODED RESPONSE APPLICABLE (SPECIFY)[specify]
<8> DON'T KNOW
<9> REFUSED
@
>Q102_4p< [allow int 1]
[# skip this follow-up question if Q102_1=RF (an NCRA gets just "What was the main factor in that choice?" and a DK gets "Why is that?")]
So you would choose to drive or be driven or dropped off by someone else for this trip.
What was the main factor in that choice? [else]
[if Q102_4 eq<2>]
So you would choose to take the "Community Transit Bus" to the CTA station
or station area for this trip.
What was the main factor in that choice? [else]
[if Q102_4 eq<3>]
So you would choose to walk to the CTA station or station area for this trip.
What was the main factor in that choice? [else]
[if Q102_4 eq<4>]
So you would choose to cycle to the CTA station or station area for this trip.
What was the main factor in that choice? [else]
[if Q102_4 eq<5>]
So you would choose to cycle to your destination for this trip.
What was the main factor in that choice? [else]
[if Q102_4 eq<7>]
What was the main factor in that choice? [else]
[if Q102_4 eq<8>] Why is that? [endif 7]
@ [specify] [goto Q102_5i]
>Q102_5i<
Now I'm going to read the values for worksheet #5. Please fill in the boxes as I read them.
A) Box A = "[fill BOXA_5]" minutes [blue](Transit-bus time to station: 1st row, 2nd column)[n]
B) Box B = "[fill BOXB]" minutes [blue](Walking time to station: 1st row, 3rd column)[n]
C) Box C = "[fill BOXC]" minutes [blue](Biking time to station: 1st row, 4th column)[n]
D) Box D = "[fill BOXD]" minutes. Please enter this in all 3 spaces. [blue](CTA travel time, not including time to station or time waiting at station: 2nd row, columns 2 and 3 and 4)[n]
E) Box E = "[fill BOXE_5]" dollars [blue](Parking cost when drive entire trip: 3rd row, 1st column)[n]
F) Box F = "[fill BOXF]" minutes. Please enter this in all 3 spaces. [blue](CTA frequency: 5th row, columns 2 and 3 and 4)[n]
[blue](Driving time for entire trip: 8th row, 1st column)[n]
I) Box I = "[fill BOXI_5]" minutes
[blue](Bus + CTA time for entire trip: 8th row, 2nd column)[n]
J) Box J = "[fill BOXJ_5]" minutes
[blue](Walk + CTA time for entire trip: 8th row, 3rd column)[n]
K) Box K = "[fill BOXK_5]" minutes
[blue](Bike + CTA time for entire trip: 8th row, 4th column)[n]
L) Box L = "[fill BOXL]" minutes
[blue](Biking time for entire trip: 8th row, 5th column)[n]
[blue]Enter <1> To Continue[n]
@
>Q102_5< [blue](Image/Worksheet #5)[n]
Please look at image #5 and worksheet #5.
Of the five types of transportation presented here, which mode would you select for your trip? Would you...
<1> Drive or be driven/dropped off by someone else, <2> Take the "Community Transit Bus" to the CTA station/station area, <3> Walk to the CTA station or station area, <4> Cycle to the CTA station or station area, or <5> Cycle to your destination?
<7> NO CODED RESPONSE APPLICABLE (SPECIFY)[specify]
<8> DON'T KNOW
<9> REFUSED
@
>Q102_5p< [allow int 1]
[# skip this follow-up question if Q102_1=RF (an NCRA gets just "What was the main factor in that choice?" and a DK gets "Why is that?")]
So you would choose to drive or be driven or dropped off by someone else for this trip.
What was the main factor in that choice? [else]
[if Q102_5 eq<2>]
So you would choose to take the "Community Transit Bus" to the CTA station or station area for this trip.
What was the main factor in that choice? [else]
[if Q102_5 eq<3>]
So you would choose to walk to the CTA station or station area for this trip.
What was the main factor in that choice? [else]
[if Q102_5 eq<4>]
So you would choose to cycle to the CTA station or station area for this trip.
What was the main factor in that choice? [else]
[if Q102_5 eq<5>]
So you would choose to cycle to your destination for this trip.
What was the main factor in that choice? [else]
[if Q102_5 eq<7>]
What was the main factor in that choice? [else]
[if Q102_5 eq<8>] Why is that? [endif 7]
@ [specify] [goto Q102_6i]
>Q102_6i<
Now I'm going to read the values for worksheet #6. Please fill in the boxes as I read them.
A) Box A = "[fill BOXA_6]" minutes [blue](Transit-bus time to station: 1st row, 2nd column)[n]
B) Box B = "[fill BOXB]" minutes [blue](Walking time to station: 1st row, 3rd column)[n]
C) Box C = "[fill BOXC]" minutes [blue](Biking time to station: 1st row, 4th column)[n]
D) Box D = "[fill BOXD]" minutes. Please enter this in all 3 spaces. [blue](CTA travel time, not including time to station or time waiting at station: 2nd row, columns 2 and 3 and 4)[n]
E) Box E = "[fill BOXE_6]" dollars [blue](Parking cost when drive entire trip: 3rd row, 1st column)[n]
F) Box F = "[fill BOXF]" minutes. Please enter this in all 3 spaces. [blue](CTA frequency: 5th row, columns 2 and 3 and 4)[n]
H) Box H = "[fill BOXH_6]" minutes [blue](Driving time for entire trip: 8th row, 1st column)[n]
I) Box I = "[fill BOXI_6]" minutes [blue](Bus + CTA time for entire trip: 8th row, 2nd column)[n]
J) Box J = "[fill BOXJ_6]" minutes [blue](Walk + CTA time for entire trip: 8th row, 3rd column)[n]
K) Box K = "[fill BOXK_6]" minutes
[blue](Bike + CTA time for entire trip: 8th row, 4th column)[n]
L) Box L = "[fill BOXL]" minutes
[blue](Biking time for entire trip: 8th row, 5th column)[n]
[blue]Enter <1> To Continue[n]
@
>Q102_6< [blue](Image/Worksheet #6)[n]
Please look at image #6 and worksheet #6.
Of the five types of transportation presented here, which mode would you select for your trip? Would you...
<1> Drive or be driven/dropped off by someone else, <2> Take the "Community Transit Bus" to the CTA station/station area, <3> Walk to the CTA station or station area, <4> Cycle to the CTA station or station area, or <5> Cycle to your destination?
[# skip this follow-up question if Q102_1=RF (an NCRA gets just "What was the main factor in that choice?" and a DK gets "Why is that?")]
[if Q102_6 gt<8>gotoDidWSheets]
[blue](Image/Worksheet #1)[n]
[if Q102_6 eq<1>]
So you would choose to drive or be driven or dropped off by someone else for this trip.
What was the main factor in that choice? [else]
[if Q102_6 eq<2>]
So you would choose to take the "Community Transit Bus" to the CTA station or station area for this trip.
What was the main factor in that choice? [else]
[if Q102_6 eq<3>]
So you would choose to walk to the CTA station or station area for this trip.
What was the main factor in that choice? [else]
[if Q102_6 eq<4>]
So you would choose to cycle to the CTA station or station area for this trip.
What was the main factor in that choice? [else]
[if Q102_6 eq<5>]
So you would choose to cycle to your destination for this trip.
What was the main factor in that choice? [else]
[if Q102_6 eq<7>]
What was the main factor in that choice? [else]
[if Q102_6 eq<8>] Why is that? [endif 7]
@ [specify] [gotoDidWSheets]
>WSheets_end< [# End of worksheet/images section (skip target)]
>Q103i<
Thanks for going through this with me. We're almost done for today. Before we wrap up, I'd just like to ask you a few more questions about yourself. [blue]Enter <1> To Continue[n]
@
>Q103< [blue]INTERVIEWER: ASK ONLY IF NECESSARY[n]
(What is your gender?)
<1> Male
<2> Female
<7> NO CODED RESPONSE APPLICABLE (SPECIFY)[specify]
>Q105< What is the highest level of education you have completed?
<0> None, <1-8> Elementary school, <9-11> Some high school, <12> High school graduate/GED, <13> Some college, <14> Associates certificate/2 year program, <16> Bachelor's degree,
| Page
<17> Some graduate school, <18> Master's degree, or <19> Doctorate/advanced degree?
In order to ensure we get a diverse group of people for our study, I have a few more questions. Are you of Hispanic or Latino(a) origin?
<1> Yes
<2> No
<7> NO CODED RESPONSE APPLICABLE (SPECIFY)[specify]
<8> DON'T KNOW
<9> REFUSED
@
>Q107< [blue]ENTER A "1" FOR ALL THAT APPLY.[n]
What is your race? Would you say...
[blue]IF NECESSARY:[n]
(You may choose one or more)
@1 American Indian or Alaskan Native, @2 Asian, @3 Black or African American, @4 Native Hawaiian or Other Pacific Islander, or @5 White?
@97 OTHER (SPECIFY)
@98 DON'T KNOW
@99 REFUSED
>Q108<
The last of these questions are about income. Was your [u]total household income[n] for the year 2012, from all sources, before taxes, more or less than $30,000?
<1> More [goto Q111]
<2> Less [goto Q109]
<3> $30,000 exactly
<7> NO CODED RESPONSE APPLICABLE (SPECIFY)[specify]
<8> DON'T KNOW
<9> REFUSED
@ [goto QEND]
>Q109< Was it less than $20,000?
<1> Yes [goto Q110]
<2> No
<3> $20,000 exactly
<7> NO CODED RESPONSE APPLICABLE (SPECIFY)[specify]
<8> DON'T KNOW
<9> REFUSED
@ [goto QEND]
>Q110< Was it less than $10,000?
<1> Yes
<2> No
<3> $10,000 exactly
<7> NO CODED RESPONSE APPLICABLE (SPECIFY)[specify]
<8> DON'T KNOW
<9> REFUSED
@ [goto QEND]
>Q111< Was it more than $50,000?
<1> Yes [goto Q112]
<2> No
<3> $50,000 exactly
<7> NO CODED RESPONSE APPLICABLE (SPECIFY)[specify]
<8> DON'T KNOW
<9> REFUSED
@ [goto QEND]
>Q112< Was it more than $70,000?
<1> Yes [goto Q113]
<2> No
<3> $70,000 exactly
<7> NO CODED RESPONSE APPLICABLE (SPECIFY)[specify]
<8> DON'T KNOW
<9> REFUSED
@ [goto QEND]
>Q113< Was it more than $90,000?
<1> Yes
<2> No
<3> $90,000 exactly
<7> NO CODED RESPONSE APPLICABLE (SPECIFY)[specify]
<8> DON'T KNOW
<9> REFUSED
@
>QEND<
Thank you very much for taking the time to participate in our study. We
will mail you a $50 check to express our appreciation for your time and effort. I would just like to verify the spelling of your name and your mailing address.
We have your name listed as "[fill RNAM]" Is this correct?
<1> Yes
<2> No (Specify correct name spelling)
<7> NO CODED RESPONSE APPLICABLE (SPECIFY)[specify]
<8> DON'T KNOW
<9> REFUSED
Name: @name
And we have your address listed as "[fill ADDR] [fill CITY], [fill STAT] [fill ZIP]" Is this correct?
<1> Yes
<2> No (Specify correct address)
<7> NO CODED RESPONSE APPLICABLE (SPECIFY)[specify]
<8> DON'T KNOW
<9> REFUSED
[blue](Probe for apartment number; include it in the street field)[n]
Street: @street
City: @city
State: @state ZIP Code: @zip
>DB1< [blue]How much difficulty did the respondent have understanding the survey questions?
<1> No difficulty
<2> Just a little difficulty
<3> A fair amount of difficulty
<4> A lot of difficulty
@
>DB2< [blue]How would you rate the respondent's ability to answer questions using the travel diary?
<1> Excellent
<2> Good
<3> Fair
<4> Poor
<5> Very poor
>DB3< [blue]How would you rate the respondent's ability to fill in values for the six worksheets over the phone?
<1> Excellent
<2> Good
<3> Fair
<4> Poor
<5> Very poor
@
>DB4< [blue]How would you rate the respondent's ability to answer the questions based on the six completed worksheets?
<1> Excellent
<2> Good
<3> Fair
<4> Poor
<5> Very poor
@
>DB5< [blue]How confident are you that the data collected in the interview is valid?
<1> Very confident
<2> Somewhat confident
<3> Not too confident
<4> Not at all confident
3 Completed interview except for worksheets: English
4 Completed interview except for worksheets: Spanish
31 Answering service/ machine
32 Eligible respondent not available
33 Unscreened respondent not available
Completed phone interview except worksheet section with eligible English-speaking respondent. Worksheets were not completed because Respondent’s destination was not near the train line and/or there is no work or school address near the train to use instead.
Completed phone interview except worksheet section with eligible Spanish-speaking respondent. Worksheets were not completed because Respondent’s destination was not near the train line and/or there is no work or school address near the train to use instead.
This disposition was used for answering devices or answering services. X
This disposition is used when a respondent who has confirmed eligibility was not home, was busy, or for some other reason could not be interviewed at the time of contact. No appointment could be made.
This disposition is used when a respondent who has not confirmed eligibility was not home, was busy, or for some other reason could not be interviewed at the time of contact. No appointment could be made.
40 Final refusal to screener Respondent refused to complete the phone front end to confirm eligibility for the study.
41 Final refused interview: English
43 Refusal, mailed in response form without a name or phone number
44 Do not call refusal, unscreened
55 Not able to interview during survey period
56 Never able to interview
57 Unable to locate
The eligible English-speaking respondent refused to complete interview.
Respondent returned a response form with no name and/or phone number, so we were unable to contact by phone.
This disposition is used when a household member has cited the National Do Not Call list as a reason they do not wish to participate and we have explained that we are exempt from the list yet the household member still declines to participate. Household is unscreened.
This disposition is used when there is a clear indication that the respondent will be unavailable to participate within the timeconfines of the survey period. This may be due to hospitalization, being away on vacation, etc.
This disposition is used when the eligible respondent is too hard of hearing, is permanently ill, is incapacitated, or for some other reason would never be able to be interviewed. It is not related to the time frame of the data collection effort.
After exhausting all locating procedures planned for the study, the respondent cannot be contacted.
70 Ineligible: Age The respondent is not 18 years of age or older. X
71 Ineligible: Address
Ineligible, before we called
Ineligible, Evanston quota full
88 Ineligible foreign language
89 Final duplicate, respondent linked to two addresses/units
90 Other ineligible
Responded outside of data collection time period
The respondent does not live at an address that is part of the sample, and we did not try to re-contact a respondent at the sampled address.
Respondent either did not work or go to school within 3 miles of a CTA station or did not travel to their neighborhood station at least one time per week. X
This case was received after we had closed the Evanston cell.
This disposition is used if the respondent speaks a language other than English or Spanish.
Sampling has confirmed that a case appears in the sample more than once.
This disposition is used when the situation does not seem to be covered by any other category and you think the case is ineligible.
These cases returned a response letter either during the hiatus or after we had closed ended data collection. X
APPENDIX 6
SAMPLE RATE DEFINITIONS
Total sample: the total number of cases included in the initial mailing.
Returned: the total number of response packets that were returned to SRL.
Locatable: the total number of response packets that were returned from locatable addresses.
Eligible, before phone screener: the total number of cases deemed eligible prior to calling.
Total sample called: the total number of cases called.
Nonduplicates: the number of nonduplicate phone numbers.
Contact to screener: the total number of households that were contacted for the phone screener.
Cooperation to screener: the total number of households that completed the phone screener.
Eligible: the number of eligible respondents included following the phone screener.
Contact to final: the total number of respondents who were contacted for an interview.
Cooperation to final: the total number of respondents who completed an interview.
2 Survey Methodology
Table 2.1 Population Size & Percent Distribution, by Neighborhood..............................................................
Table 2.2 Final Disposition of Sample, Overall & by Neighborhood: Pretest....................................................
Table 2.3 Final Sample Numbers & Rates: Overall & by Neighborhood: Pretest..............................................
Table 2.4 Number of Cases, Initial Mailing Date, & Date Sample Was Ordered, by Geographic Area.............
Table 2.5 Cases Returned by Mail That Were Set up for Calling, by Mail Return, Study Packet Mailing, and Setup Dates .................................................................................................................................
Table 2.6 Final Disposition of Sample, Overall & by Neighborhood: Main Study ...........................................
Table 2.7 Final Sample Numbers & Rates, Overall & by Neighborhood .........................................................
Table 4.2 Selected Land-Use and Transportation Characteristics of Respondents by Neighborhood...............
Table 4.3 Selected Sociodemographic Characteristics of Respondents by Neighborhood...............................
Table 4.4 Respondent Perceptions of Base Case and Full-Deployment Case for their Neighborhoods...........
Table 4.5 Perceptions of Base Case and Change with Full Deployment by Neighborhood.............................
Table 4.6 Respondents by Commute Location .............................................................................................
Table 4.7 Respondent Perceptions of Base Case and Full-Deployment Case by Age and Work Location.......
Table 4.8 Respondent Perceptions of Base Case and Full-Deployment Case by Income and Gender..............
5 Activity-Based Modeling
Table 5.1 Distribution of Scenarios................................................................................................................
Table 5.2 Stated-Preference by Current Mode (percent, all Worksheets all Neighborhoods) .........................
Table 5.3 Procedure for Estimating and Correcting for Bias (Percent of all Travelers) .....................................
Table 5.4 Stated Preference Mode by Neighborhood ...................................................................................
Table 5.5 SP Choice (Percentage) by the Tour Main Mode in Cicero .............................................................
Table 5.6 SP Choice (Percentage) by the Tour Main Mode in Pilsen ..............................................................
Table 5.7 SP Choice (Percentage) by the Tour Main Mode in Evanston .........................................................
Table 5.8 SP Choice (Percentage) by the Tour Main Mode in Skokie .............................................................
Table 5.9 Model Estimation Results .............................................................................................................
Table 5.10 to 5.1 Results for SP Experiment (Numbers), per Neighborhood and by actual Mode...............
Table 5.18 to 5.25 Results for SP Experiment (Percentage), per Neighborhood and by actual Mode ...........
6 Agent-Based Modeling
Table 6.1 Default Model Parameters ...........................................................................................................
Table 6.2 Comparison between final calibration and empirical data on mode share for the four Chicago neighborhoods. Note: Train includes walk to train, bike to train and bus to train; bike RTAMS data corresponds to “Other” category, which includes biking ...............................................................
7 Findings of Agent-Based and Activity-Based Models in Conjunction
Table 7.1 Parameters for the Combined Model ...........................................................................................
Table 7.2 Reference and Final Best Fit Coefficients ......................................................................................
Appendix 1. Basis of Comparison: Copenhagen, Denmark
Appendix 2. Travel Diary and Stated-Preference Experiment
Table A 2.1 1107 Completion Codes
1 Executive Summary
Figure 1.1 Location of the four Chicago neighborhoods: Skokie, Evanston, Cicero and Pilsen. CTA train network in color............................................................................................................................
2 Survey Methodology
Figure 2.1 Geographic boundaries of the Areas of Study in the four neighborhoods......................................
3 Urban Design Methodology
Figure 3.1 Urban fabric around CTA Damen, in Pilsen.....................................................................................
Figure 3.73 1.5-mile radius buffer around CTA Station Skokie (Google Earth)...................................................
Figures 3.74 and 3.75 Aerial images zooming in the CTA Station and Crain St, from Terminal Av ...................
Figures 3.76 and 3.77 Images from the neighborhood around the CTA Station compiled during the site visit..
Figure 3.78 to 3.84
Figure 3.85 to 3.91
4
Scenarios for Site 1 at CTA Station Skokie.....................................................................
Scenarios for Site 2 at CTA Station Skokie.....................................................................
Perceptions of Alternatives
Figure 4.1 Evanston base case.......................................................................................................................
Figure 4.2 Evanston full deployment..............................................................................................................
5 Activity-Based Modeling
Figure 5.0 Example of Worksheets #1 and #6 ...............................................................................................
Figure 5.1 SP mode choice (percentage) by revealed preference main mode of the tour (RP), all worksheets..
Figure 5.2 Comparison of RP and SP choices (percentages).............................................................................
Figure 5.3 Stated preference mode by neighborhood.....................................................................................
Figure 5.4 SP mode choice by worksheet (in all the neighborhoods and all respondents)................................
Figure 5.5 SP choice by worksheet in Cicero...................................................................................................
Figure 5.6 SP choice by worksheet in Pilsen....................................................................................................
Figure 5.7 SP choice by worksheet in Evanston...............................................................................................
Figure 5.8 SP choice by worksheet in Skokie..................................................................................................
6 Agent-Based Modeling
Figure 6.1 Location of the four Chicago neighborhoods: Skokie, Evanston, Cicero and Pilsen. CTA train network in color............................................................................................................................
Figure 6.2 Comparison aerial image and model..............................................................................................
Figure 6.4 Conceptual bus and shuttle network..............................................................................................
Figure 6.5 Streetscape conditions: (a) current; (b) some improvement and pedestrian and cyclist presence, and (c) ideal level of improvements with higher pedestrian and cyclist presence..............................
Figure 6.6 Viewshed for (a) pedestrians and cyclists in transit, and (b) for pedestrians waiting at transit stops (commuter in purple, red arrow = 1 block).....................................................................................
Figure 6.7 Revised Pilsen bus network.............................................................................................................
Figure 6.8 Reductions in driving share under different improvement scenarios in (a) Skokie, (b) Evanston, (c) Cicero, and (d) Pilsen......................................................................................................................
Figure 6.9 Reductions in driving share by improvement scenarios and distance from the station......................
7 Findings of Agent-Based and Activity-Based Models in Conjunction
Figure 7.1 Stated preference (SP) results from the survey against mode shares produced by the modified agent-based model ......................................................................................................................
Figure 7.2 Combined model results using the neighborhood best fit coefficients comparing and testing the effect of community transit ..........................................................................................................
Appendix 1. Basis of Comparison: Copenhagen, Denmark
Figure A1.1 Map showing Frederiksberg municipality in relation to city center and Copenhagen city limits.........
Figure A1.2 Frederiksberg Central Metro Station................................................................................................
Figure A1.3 Bike users in Frederiskberg............................................................................................................
Figure A1.4 Modal Split: (a) All trips shorter than 5km taken in 2006; (b) All trips taken in 2006; (c) All trips taken in 2003...............................................................................................................................
Figure A1.5 “Traffic rules for urban areas.” Denmark Planning Authority..........................................................
Figure A1.6 At intersections along major roads, rather than providing a direct path for cars to turn in and out of side streets, pedestrian walkways and bicycle lanes continue straight through, creating a curb for cars rather than cyclists and people. Frederiksberg, Denmark ...................................................
Figure A1.7 Users can quickly and comfortably transition from pedestrians to bicyclists to bus or metro users at Forum Metro Station....................................................................................................................
Figure A1.8 Metro users can bring their bike on the metro for free. Frederiksberg central station.....................
Figure A1.9 Elevators for disabled users, strollers, and bicycles. Frederiksberg central station............................
Figure A1.10 Seats designated for bicyclists on the metro. Copenhagen, Denmark.............................................
Figure A1.11 Direct access to metro from bus and bicycle lanes. Fansanvej station.............................................
Figure A1.12 Overlap of bicycle lane network and train and metro network. Copenhagen, Denmark.................
Figure A1.13 Road network. (Vejplanlægning I Byområder Figure 1) ................................................................
Figure A1.14 Path network. (Vejplanlægning I Byområder Figure 4) ..................................................................
Figure A1.15 Carriageway showing safety of all road users. Both bicycle and pedestrian paths are separated by a grade change. Frederiksberg, Denmark ....................................................................................
Figure A1.16 On local roads there is less of a need for designated bicycle lanes as cars can only move at safe speeds. Here, pedestrians and cyclists have priority to the street space. Frederiksberg, Denmark ..
Figure A1.17 The green route cuts through primary destinations in Frederiksberg municipality and provides a safe route for pedestrians. Frederiksberg, Denmark .....................................................................
Figure A1.18 Active ground floors offer inviting streetscapes for pedestrians along Værnedamsgade. Frederiksberg, Denmark ...........................................................................................................................................
Figure A1.19 Well designed and maintained public restrooms are an important amenity for pedestrians. Frederiksberg, Denmark .....................................................................................................................
Figure A1.20 The park network provides opportunities to escape the noise of the city as well as alternate pedestrian routes. Frederiksberg, Denmark .........................................................................................
Figure A1.21 Share of trips in 2006 that are comprised of walking to and from destinations: 25% ..........................
Figure A1.22 Pedestrian and bicycle path for high speed travel along the border of the CBD. Frederiksberg, Denmark ............................................................................................................................................
Figure A1.23 Signage to show continuation of pedestrian path along the Green Route. Frederiksberg, Denmark ...
Figure A1.24 Wide, at-grade crossing for pedestrians returning to Frederiksberg from the CBD. Frederiksberg, Denmark ............................................................................................................................................
Figure A1.25 School children are provided safe bicycle paths along Gammel Kongevej. Frederiksberg, Denmark........
Figure A1.26 Speed bump before and after crossing ensures safety of pedestrians. Frederiksberg, Denmark..............
Figure A1.27 Pedestrian walkways and bike lanes continue through intersections to secondary roads.Frederiksberg, Denmark.............................................................................................................................................
Figure A1.29 Street design (1)...................................................................................................................................
Figure A1.30 The Green Route provides a safe, two-way bicycle road with access to all primary destinations in Frederiksberg ......................................................................................................................................
Figure A1.31 All primary destinations in Frederiksberg provide ample parking for bicyclists.......................................
Figure A1.32 A separate system of lights and pathways give bicyclists clarity. Blue pathways in intersections warn drivers of cyclists
Figure A1.33 Turning lanes prevent backups on bicycle lanes and allow through-cyclists to continue without obstruction .........................................................................................................................................
Figure A1.34 Share of trips in 2006 that are comprised of bicycling to and from destinations: 34%..........................
Figure A1.36 Road with separated bicycle lanes. Frederiksberg, Denmark.................................................................
Figure A1.37 The Green Route two-way bicycle path. Frederiksberg, Denmark..........................................................
Figure A1.38 Cars must go over a speed-bump in order to cross bicycle route while cyclists continue forward without delay. Frederiksberg, Denmark.............................................................................................................
Figure A1.39 Light posts along the Green Route both identify route and provide safety for cyclists. Frederiksberg, Denmark ............................................................................................................................................
Figure A1.40 Waiting areas for busses that lie outside of bicycle paths reduce conflicts between pedestrians and bicyclists. Frederiksberg, Denmark......................................................................................................................
Figure A1.41 Street design (2)...................................................................................................................................
Figure A1.42 Above-ground information system displays live information on waiting times for the metro. Frederiksberg, Denmark.......................................................................................................................
Figure A1.43 Free internet and comfortable seating encourage bus use by all demographics. Frederiksberg, Denmark
Figure A1.44 Driverless metro provides frequent service and free bicycle access. Frederiksberg, Denmark.................
Figure A1.45 Elevators at metro stations provide easy access for wheel chair users and cyclists. Frederiksberg, Denmark ............................................................................................................................................
Figure A1.46 Share of trips in 2006 that involve transit use: 12% ............................................................................
Figure A1.47 Frederiksberg Central Station ..............................................................................................................