YING
Sustainablity Design SUSTAINABLITY DESIGN SHANDONG,
YIHAN, ZHAO YUETONG, LI MAN 2016 MA
JINAN
6_2_DAYLIGHTING 6_3_SUN PATH, VENTILATION & LIGHT 7_SOCIETY 7_1_YING YIHAN 7_2_LI MAN 7_3_ZHAO YUETONG 8_PHILOSOPHIES 8_1_WHOLE SYSTERM MAP 8_2_ITEM, ELEMENT, PROPORTION 8_3_INVENTORY & LCA CHART 8_4_BRAINSTORMING 8_5_EVALUATE & SOLUTION 9_METHODOLOGIES 9_1_RESEARCH 9_2_OBDERVE & STRATEGY 9_3_LIFE’S PRINCIPLES 9_4_STRATEGY 10_WEBSITE 10_1_ENVIRONMENTAL ORGANIZATION 11_EPILOGUE 1_CLIMATE 1_1_LOCATION DIAGRAM 1_2_CLIMATE ZONE 1_3_CLIMATE SUMMARY 1_4_WIND SPEED/DIRECTION 2_LAND 2_1_HARDINESS ZONE MAP 2_2_SOIL & AGRICUTURAL 3_PSYCHROMETRIC CHRT 3_1_COMFORTABLE ZONE 3_2_PSYCHROMETRIC CHART 4_WATER SYSTERM OF D&I 10-11 4_1_LOCATION DIAGRAM 4_2_WATER INFORMATION 5_ORIENTATION FOR WINDS & PASSIVE COOLING 5_1_SITE PLAN 5_2_CURRENT & IMPROVED ORIENTATION 5_3_STACK VENTILATION 6_MASSING STRATEGIES FOR PASSIVE HEATING 6_1_SUN PATH INDEX OF CONTENTS 02-05 06-07 08-09 12-14 15-18 19-32 33-37 38-41 42 43
Localisation Diagram
Jinan, formerly romanized as Tsinan, is the capital of Shandong province in Eastern China. The city is located in the middle of Huabei Plain.

The downtown area is located in Quancheng Square. In the city, there are 3 main railway station and an international airport arround the site.
Six main attractions are recommended to you, helping you know the city better.
2 // JINAN // LOCATION DIAGRAM
SOURCE http://map.qq.com/
Climate & Context Diagram -
Jinan
Climate Zone Diagram

CLIMATE
Hot summer and cold winter, big annual temperature gap, concentrated rainfall, four distinct seasons, less annual precipitation, strong continental climate
TEMPERATURE
In winter, under the control of continental climate, the average temperature in the coldest month is below 0˚C in the south.
PRECIPITATION
Precipitation here increases from south to north, the annual precipitation is around 200-400 mm, 300~600 mm in the north. Most precipitation concentrates in summer and another three seasons has almost no rain. It also has occasional snowfall in winter.
https://en.wikipedia.org/wiki/Jinan
3 JINAN // CLIMATE ZONE DIAGRAM // SOURCE
Town Annual Climate Summary


SEMI-HUMID CONTINENTAL MONSOON CLIMATE
It has a clear monsoonal character and four distinct seasons. It is dry with less rain in spring, rainy with high temperature in summer, cooler in autumn and much cold in winter.
Average annual rainfall is 672.7mm; The annual peak in July with an average of 201.3 mm.Rains of Jinan in summer are more frequent than other northern cities, in addition to topography that it is embraced on three side by mountains and back-flow and gathering of hot air, contributes to high temperature and moist heat in summer.
1 2 4 3
1. Average Relative Humidity of Jinan, Shandong (%)
2. Average Precipitation of Jinan, Shandong (mm)

3. Average High/Low Temperature of Jinan, Shandong (˚C)
4. Average Wind Speed of Jinan, Shandong (m/s)
SOURCE http://data.cma.cn/

4 // JINAN // TOWN ANNUAL CLIMATE SUMMARY
Wind Speed/Diretion

Dominant wind direction most are southwest/northeast ( then east/ north and south, rare northwest ) Summer prevailing southwest/south/southeast wind, form hot and humid summer, concentrated precipitation, more thunderstorm weather

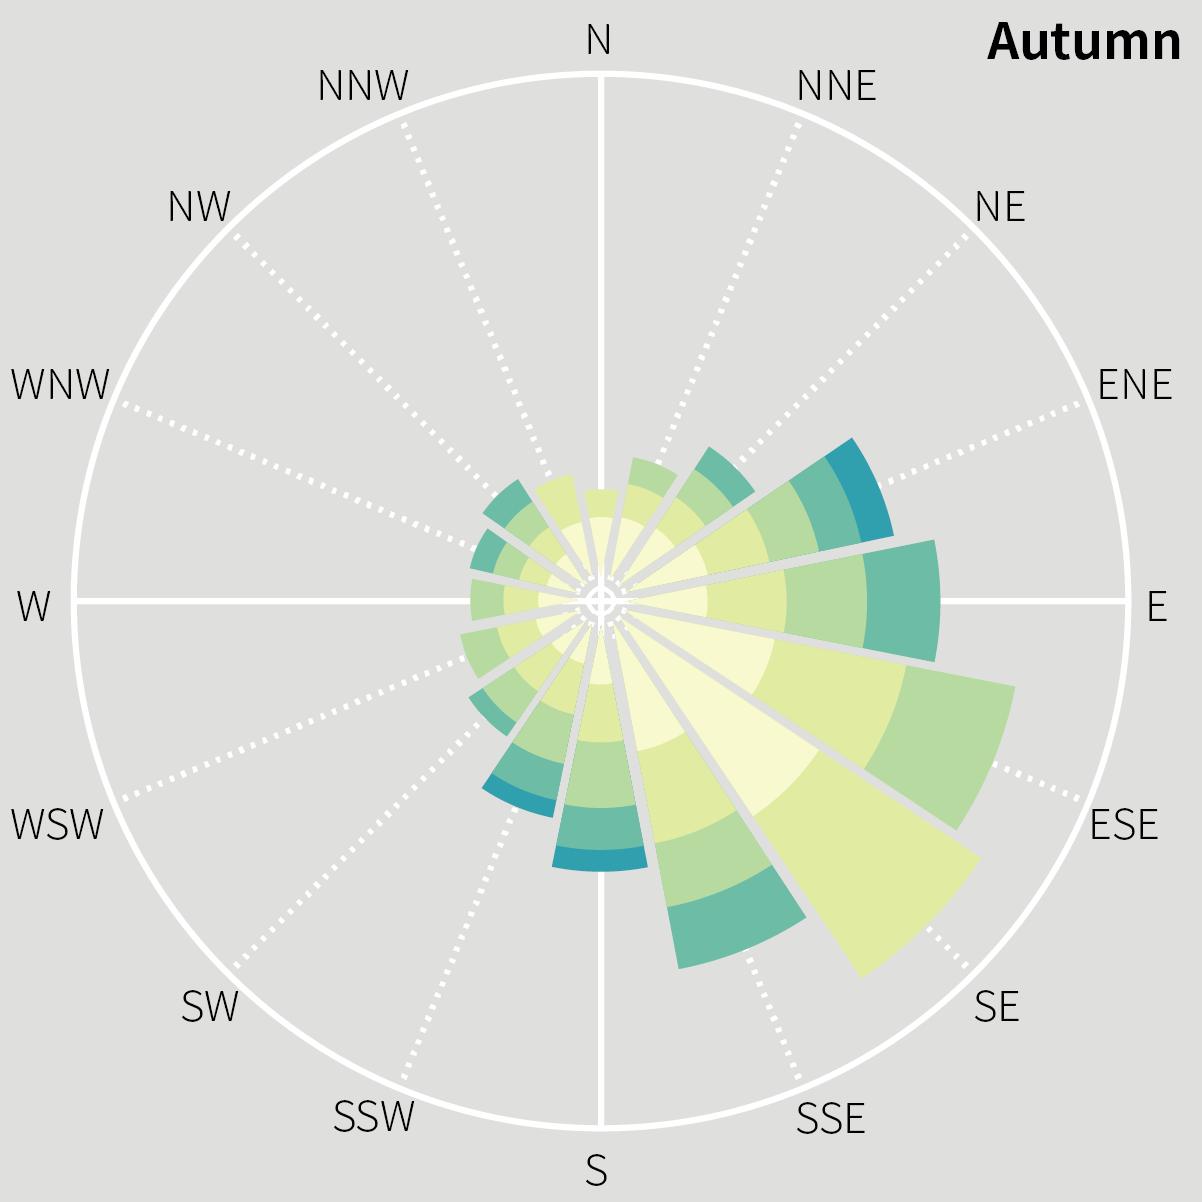
Spring/Autumn transition season of winter monsoon and summer monsoon, variable wind direction. Dry and windy in spring and cooler in autumn Winter prevailing northwest/north/northeast wind, dry and cold in winter with sunny and less rainy weather

http://data.cma.cn/

5 JINAN // TOWN ANNUAL CLIMATE SUMMARY // SOURCE
Hardiness Zone Map
The average annual minimum temperatures in China vary widely in different regions, ranging from -25˚C to 20˚C. As is shown in the map, different colors represent different temperature regions: the more bluish, the colder; reddish, warmer. The temperature of each zone is the annual average minimum temperature adaptation for the plant cultivation.
Plant hardiness zone map can be used as a guide for plant introduction. From the map, crops planted in most area of Jinan can tolerate a minimum temperature of −15˚C to -12.2˚C while planted in the middle of Jinan only can withstand a minimum temperature of -12.2˚C to -9.4˚C, which means crops planted here can tolerate the temperature under −15˚C and above. If the temperature under −15˚C, crops shouldn’t be planted here.
SOURCE
1. Hardiness Zone (https://en.wikipedia.org/wiki/Hardiness_zone)

2. Hardiness Zone Map of Jinan, Shandong Province (http://www.plantmaps.com/interactive-china-plant-hardiness-zone-map-celsius.php)

6 // JINAN // HARDINESS ZONE MAP
Land
Soil & Agricultural
Agriculture in Shandong province is very developed because it has fine weather and good soil. It is also called ‘One of the world’s three biggest garden’. Jinan is the core area of the garden, which named ‘China vegetable basket’.


The available area of soil is accounted for 70.72% in Jinan and most of the soil is brown type which has long age, clear layer, deep soil, rich covered diluvium and high curing degree. Brown soil is suitable for farming because it can keep water and fertilizer, and has active soil microbial in the exuberant.
The soil pH is around 6.5 to 8.5 which means crops, peanut, potato, etc. are suitable to plant here.


SOURCE
Distribution of Soil pH in Shandong Province (http://www.hjkx.ac.cn/hjkx/ch/reader/create_pdf.aspx?file_no=20061215&flag=&journal_id=hjkx&year_id=2006)
Geochemical characteristics and environmental quality of soil elements in Jinan City (http://geochina.cgs.gov.cn/ch/reader/create_pdf. aspx?file_no=20150124&flag=1&journal_id=geochina&year_id=2015)
Photograph from Google
7 JINAN // SOIL & AGRICULTURAL //
Wheat
Sesame Sorghum bicolor
Corn Cotton Potato
Millet
Peanut Soybean
Comfortable Zone
This is an annual psychrometric chart of Jinan, Shandong, China, showing comfort indoors plot of a year.

The time that human being feel comfortable and not be affected by any factors -such as sun shading of windows, natural ventilation cooling, humidification- is around 6.6%, which means the comfortable time is 577 out 8760 hours a year.
Climate consultant 6.0 (B8)
8 // JINAN // PSYCHROMETRIC CHART
COMFORTABLE LEGEND COMFORT INDOORS NOT COMFORTABLE 7% 93% PSYCHROMETRIC CHART
SOURCE
Relative Humidity
Psychrometric Chart

City: Jinan Time: Sept.23,2016
Relative Humidity: 53% Dry Bulb temperature (lowest): 71°F/21.6˚C Dry Bulb temperature (highest): 85°F/29.4˚C
Dew Point Dew Point - Comfortable Zone
Wet Bulb Temperature Dry Bulb Temperature 60.4 ˚F
From the psychrometric chart we can get: Wet Bulb temperature: 60.4°F - 72°F (15.8˚C - 22.2˚C)
Dew point: 53.6°F - 66.4°F
53% 71 ˚F 85 ˚F
72 ˚F 66.4 ˚F 53.6 ˚F
SOURCE http://data.cma.cn/site/index.html https://en.wikipedia.org/wiki/Dew point
9 JINAN // PSYCHROMETRIC CHART//
1 设计创意学院三期 D&I 2 设计创意学院二期 D&I 3 设计创意学院创意工场 D&I Innovation Factory 4 同济建筑设计院停车场 TJAD parking lot 5 同济建筑设计院 TJAD 6 上海设计之都办公室 SPCD Office 7 同济联合广场C楼 Tongji United Plaza C 8 同济君禧大酒店 Kingswell Hotel Tongji 4 上海市建设工程检测行业协会培训中心 Shanghai Construction Engineering Testing Industry Association Training Center 4 1 2 3 5 6 7 8 9 10 // WATER SYSTREM // D&I This map shows the locations of D&I and surrounding area Location Diagram WATER
This is the feed/drain water line map of D&I and surrounding area. This map shows that how feed water and rain water come and go in this area.


11 D&I // WATER SYSTERM //
Water Information Diagramt
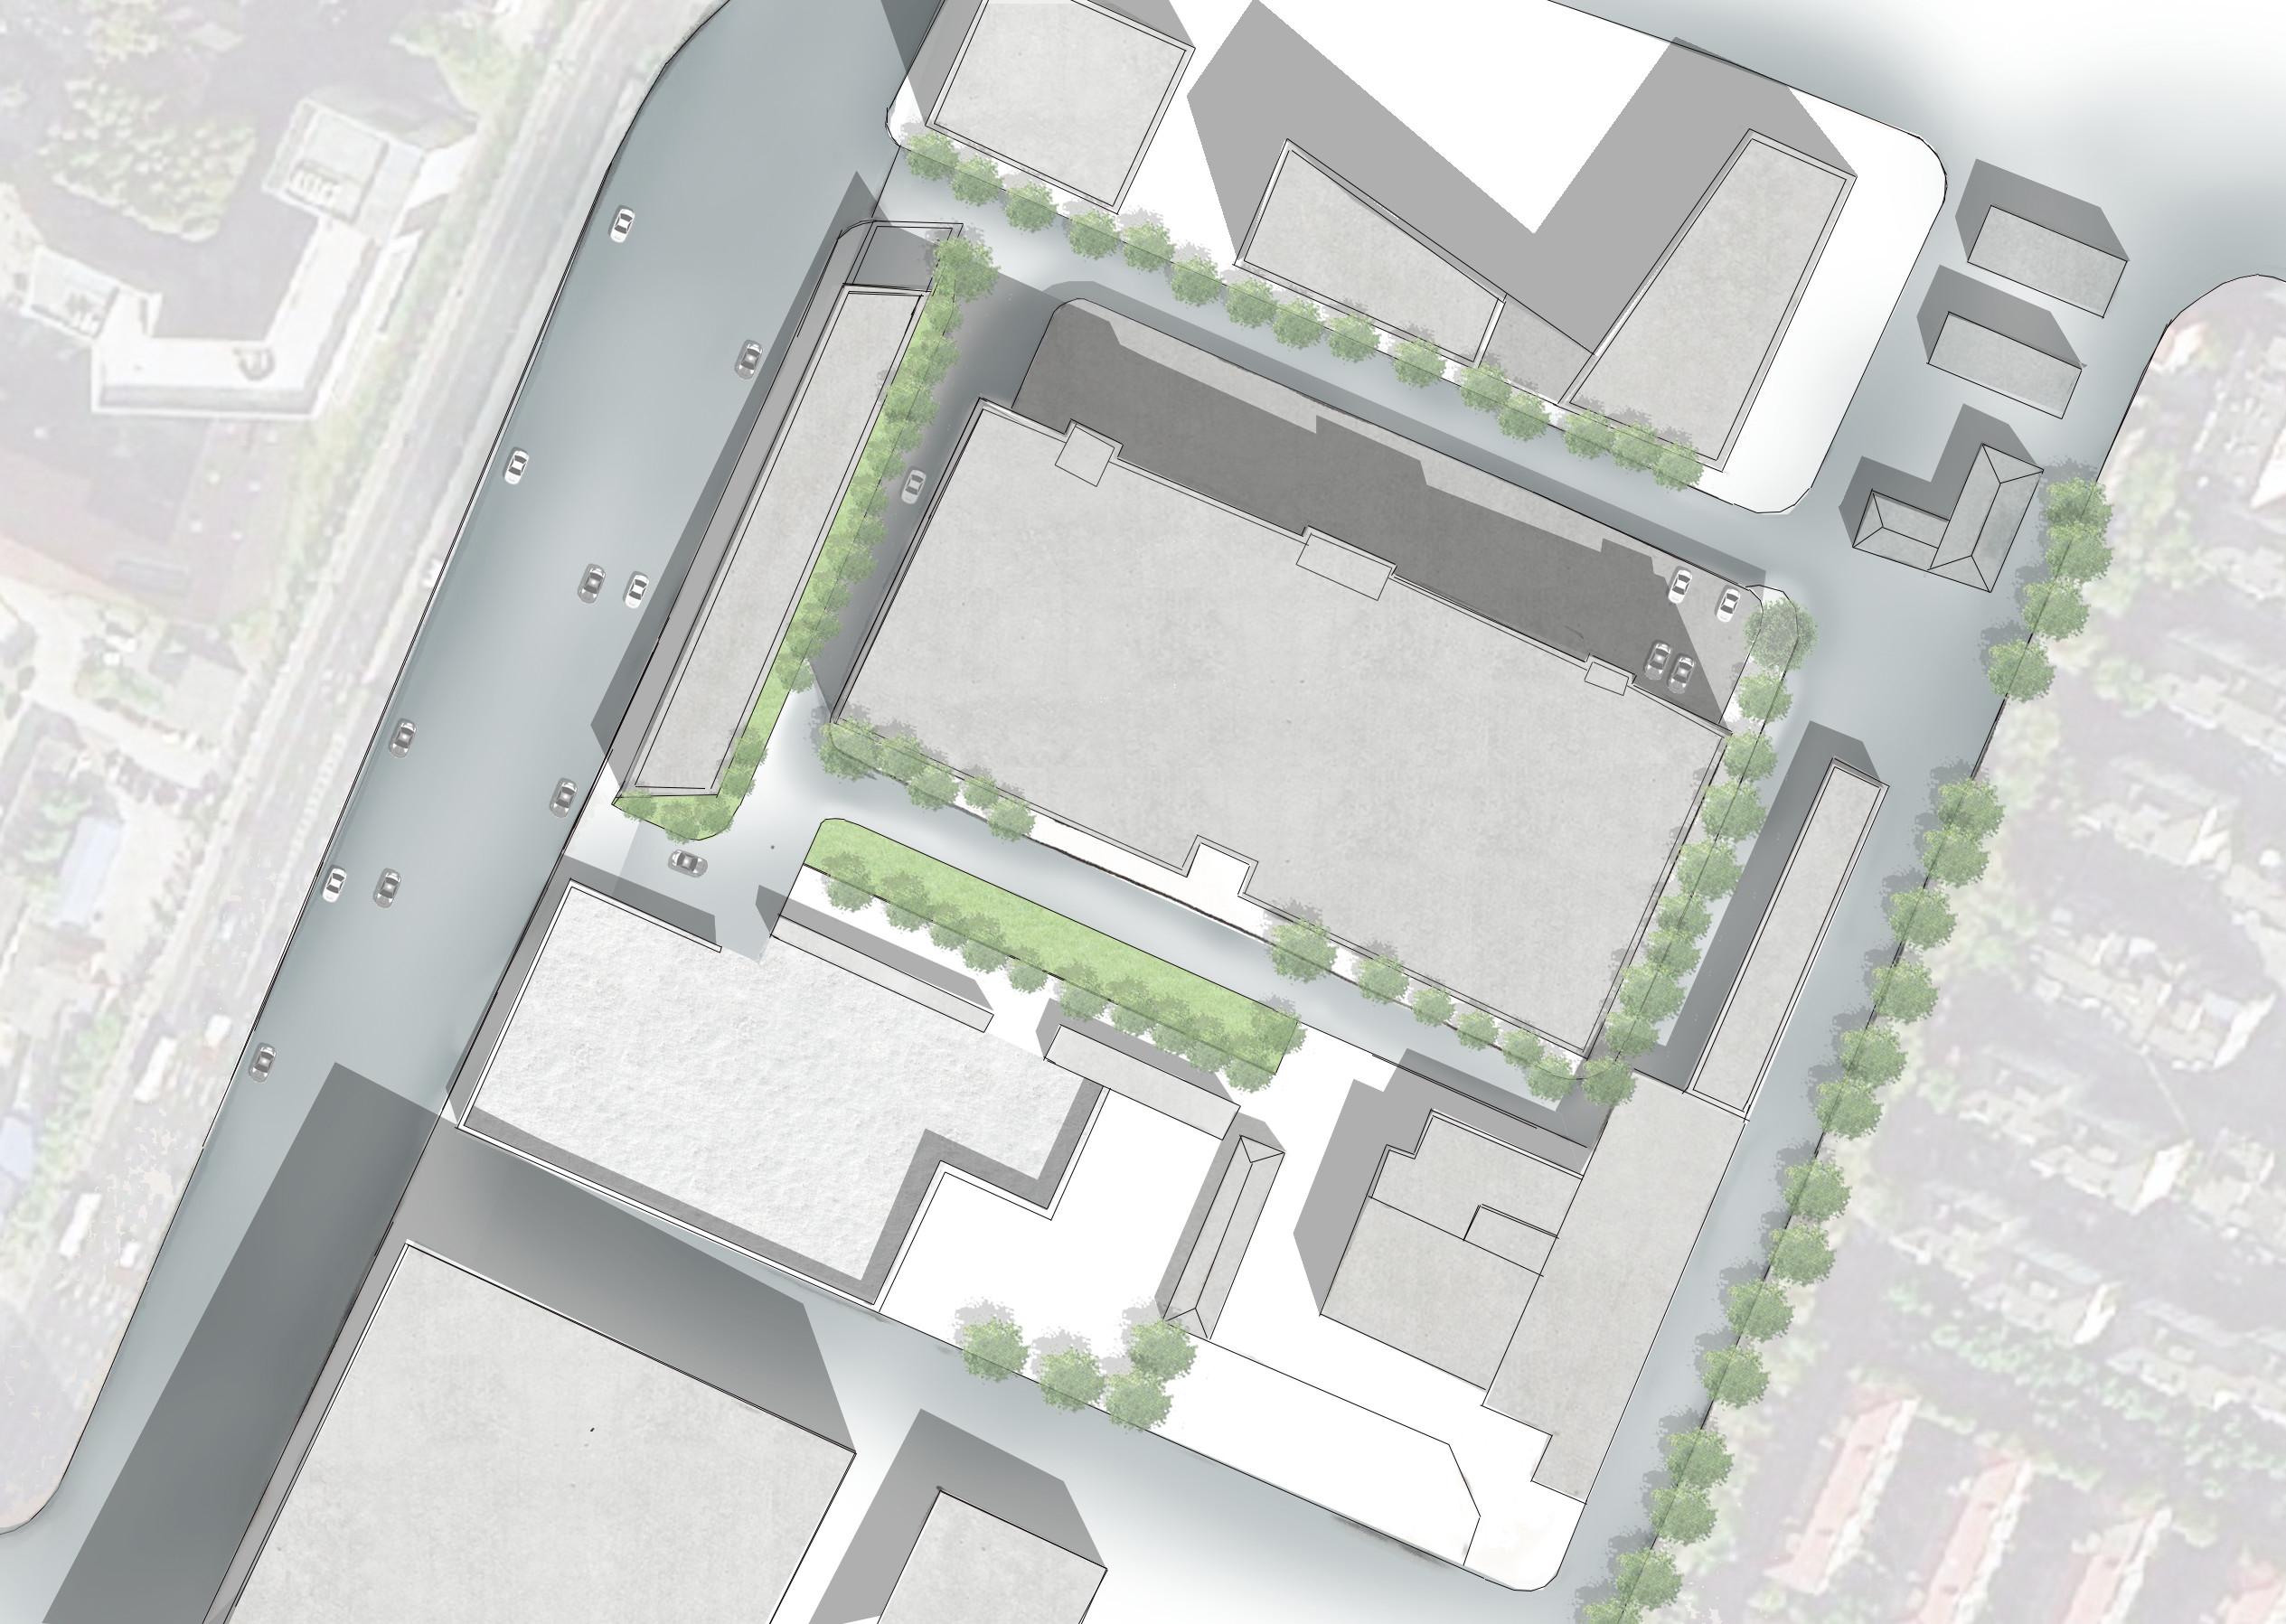
Hengshengbanshan Residence, build in the new town of east Jinan, is located on the north side of Shidong Road, southwest side of Snow Mountain, neighboring Shandong Provincial Institute of Land Surveying and Maping, Convinience Supermarket.
The building we choose is Hengshengbanshan Redidence 3#, highlighting in yellow square of the Aerial view below and marking in red of the right map.


12 // JINAN // SITE PLAN
SOURCE http://map.qq.com/
Site Plan Orientation For Winds & Passive Cooling
1 2
Current and Imroved Orientation

The current orientation of Hengshengbanshan Building is southwest.
In winter, southwest wind in Jinan has highest frequency and fastest velocity of the whole year. It seems like the current orientation is quite good. However, during China Thermal Partition map, we find that Jinan, Shandong Province belongs to cold area, which means warmer southeast wind can help the building keep a certain amount of heat in winter. When summer comes, the southeast wind can bring cooler wind.
So we adjust the orientation and let the building faces the southeast instead of southwest. And after adding three windows (the yellow one), ventilation gets imoroved and stagnant corners disappears. There are more mixings here.

1. Current Orientation of Hengshengbanshan
2. Improved Orientation of Hengshengbanshan
SOURCE http://sustainabilityworkshop.autodesk.com/buildings/ massing-orientation-daylighting

13 JINAN // SITE PLAN//
Stack Ventilation
Stack ventilation uses temperature differences to move air. Hot air rises because it is lower pressure. After wind ventilation, stack ventilation is the most commonly used form of passive ventilation.
Stack ventilation and Bernoulli’s principle can be extremely effective and inexpensive to implement. Typically, at night, wind speeds are slower, so ventilation strategies driven by wind is less effective.
Therefore, stack ventilation is an important strategy.
1. Wind Rose Map of Jinan


2. Stack Ventilation (elevation)

3. Stack Ventilation (plan)
SOURCE http://sustainabilityworkshop.autodesk.com/buildings/ stack-ventilation-and-bernoullis-principle

// JINAN // SITE PLAN 14
1 3 2
Land
Massing Strategies for Passive Heating

Sun Path
Sun path is regular. We find the whole year data of sun path, do analysis work and choose four typical days to show the track and height of sun at noon.This is the basis of sun path, solar gains and day lighting indicating 1. Diagram of Sun Path and Sun Light of Hengshengbanshan in Jinan 2. Sun path in equinox and solstice day and the height of the sun at noon


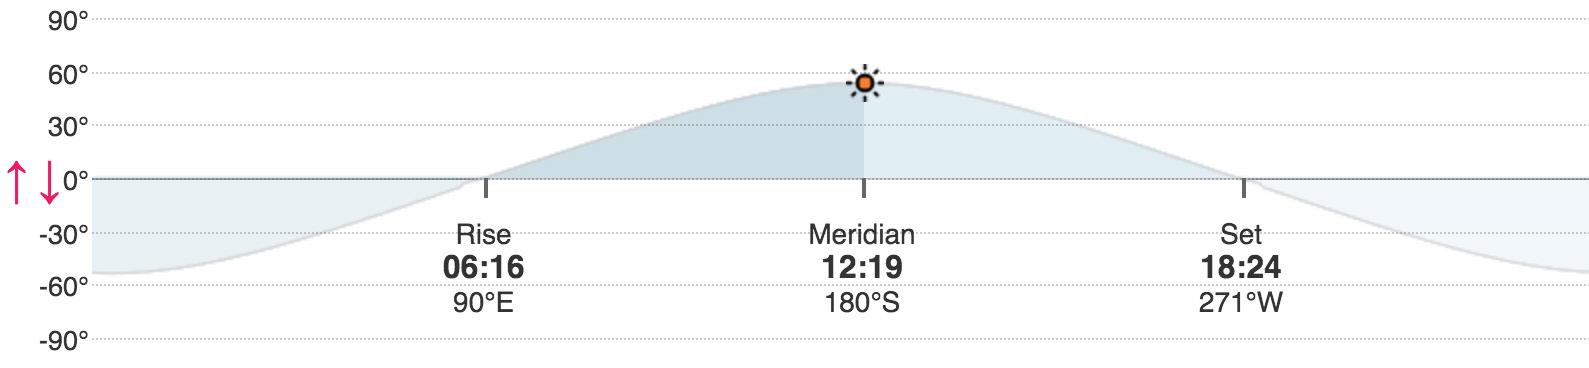

SOURCE http://www.timeanddate.com/sun/china/ jinan?month=9&year=2016

15 JINAN // MASSING STRATEGIES FOR PASSIVE HEATING //
1 2 53˚ 30˚ 54˚ 77˚ Vernal Equinox Winter Solstice Autumn Equinox Summer Solstice
Sun Path
This digram shows the range and extreme value point of sun path and sun light of Hengshengbanshan in Jinan throughout the year.

// JINAN // MASSING STRATEGIES FOR PASSIVE HEATING 16
Massing Strategies for Passive Heating

Daylighting
In summer, we get the maximum angle of the height of the sun. Usually, it happens on summer solstice day, the angle can reach 70˚(or even larger, for example, 77˚). Thus, we get short daylighting in the room at noon.

In winter, we get the minimum angle of the height of the sun. Usually, it happens on winter solstice day, the angle can reach nearly 30˚. Thus, we get long daylighting in the room at noon.
http://www.timeanddate.com/sun/china/ jinan?month=9&year=2016
17 JINAN // MASSING STRATEGIES FOR PASSIVE HEATING //
SOURCE
Winter Solstice
Summer Solstice
Sun path, light & Ventilation
From digram1, we can see the southwest side of Residence 3# gets most heat and daylight of the whole day because it can get the highest height of sun at noon, the least solar gain is from the north orientation.

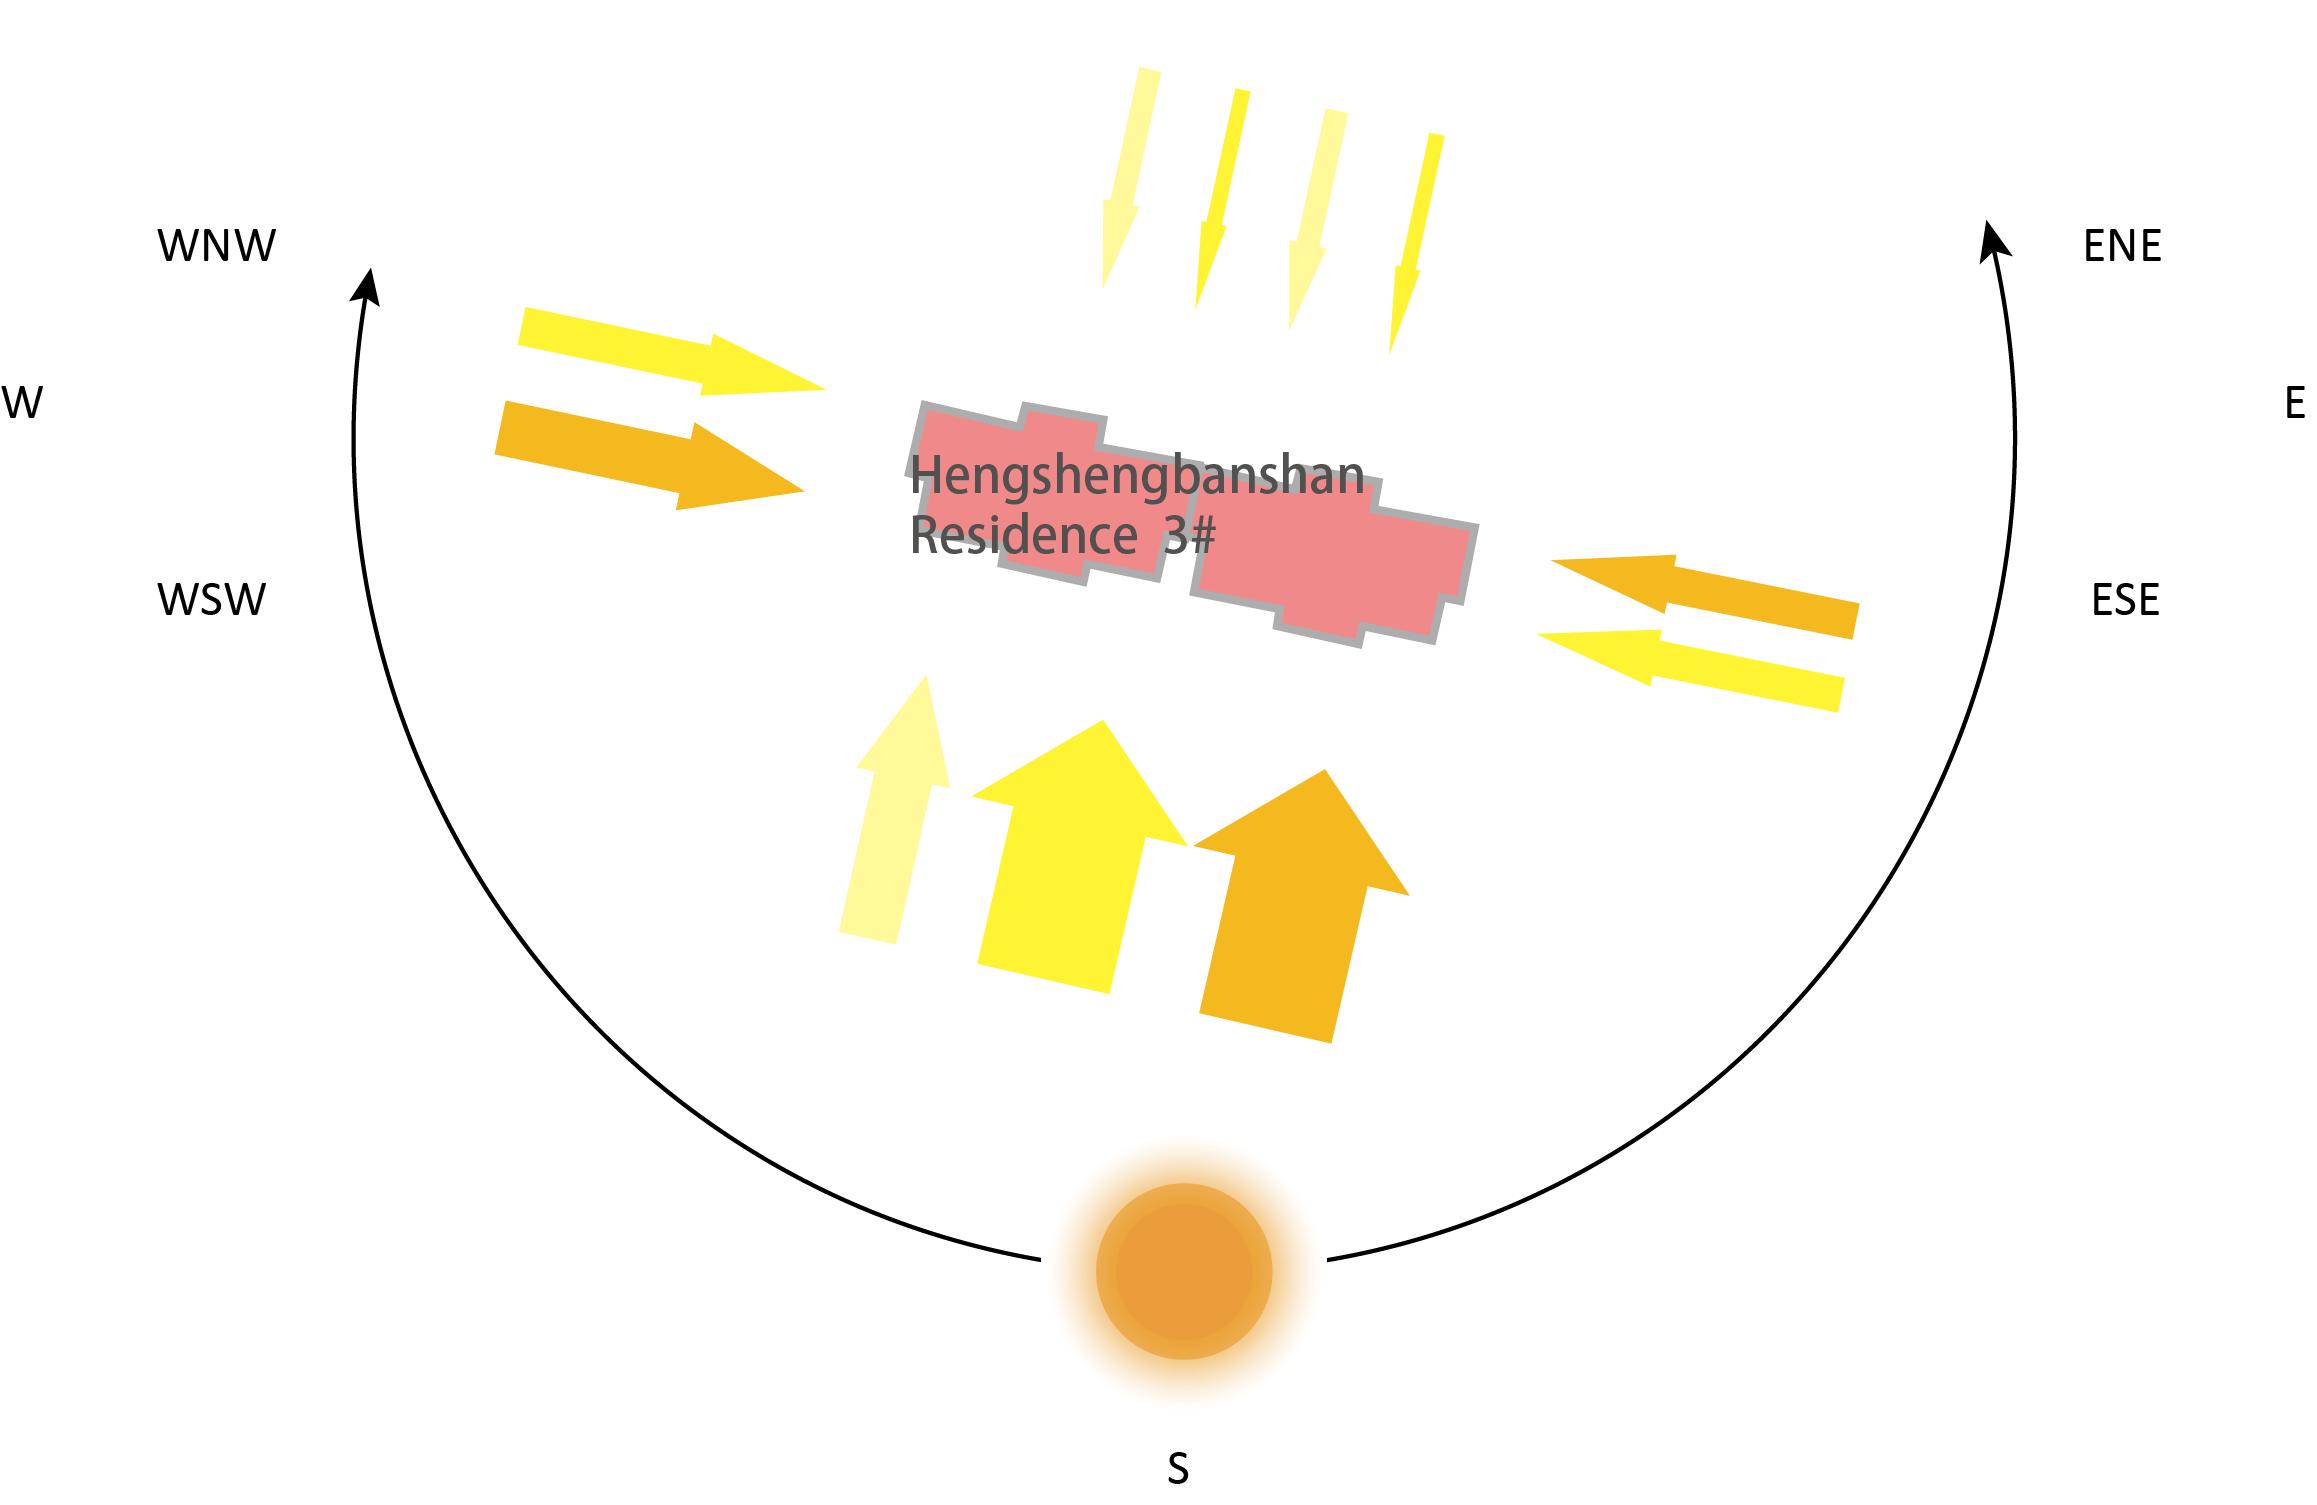
The building has windows on the southwest side and the northeast side, so this two orientation may have glare during the day.
Digram2 shows solar gains, natural ventilation and openings. The higher the building, more frequent the wind.
There is a large area on the top of the building, so it can get more heat from the solar to keep warm (to remain the building temperature in a proper range).
1 2 |

// JINAN // MASSING STRATEGIES FOR PASSIVE HEATING 18


SOCIETY
Carbon FoodPrint Calculator

The test result is that if everyone lived the same lifestyle as me, we would require the regenerative capacity of 1 planet each year.
My footprint is 1.9 global hectares because I'm still a student, having no car and any income. The largest part is Goods, the second is Food.
SOURCE http://www.footprintnetwork.org/en/index.php/gfn/page/ calculators

// SOCIETY // CARBON FOODPRINT CALCULATOR 28
Carbon FoodPrint Calculator

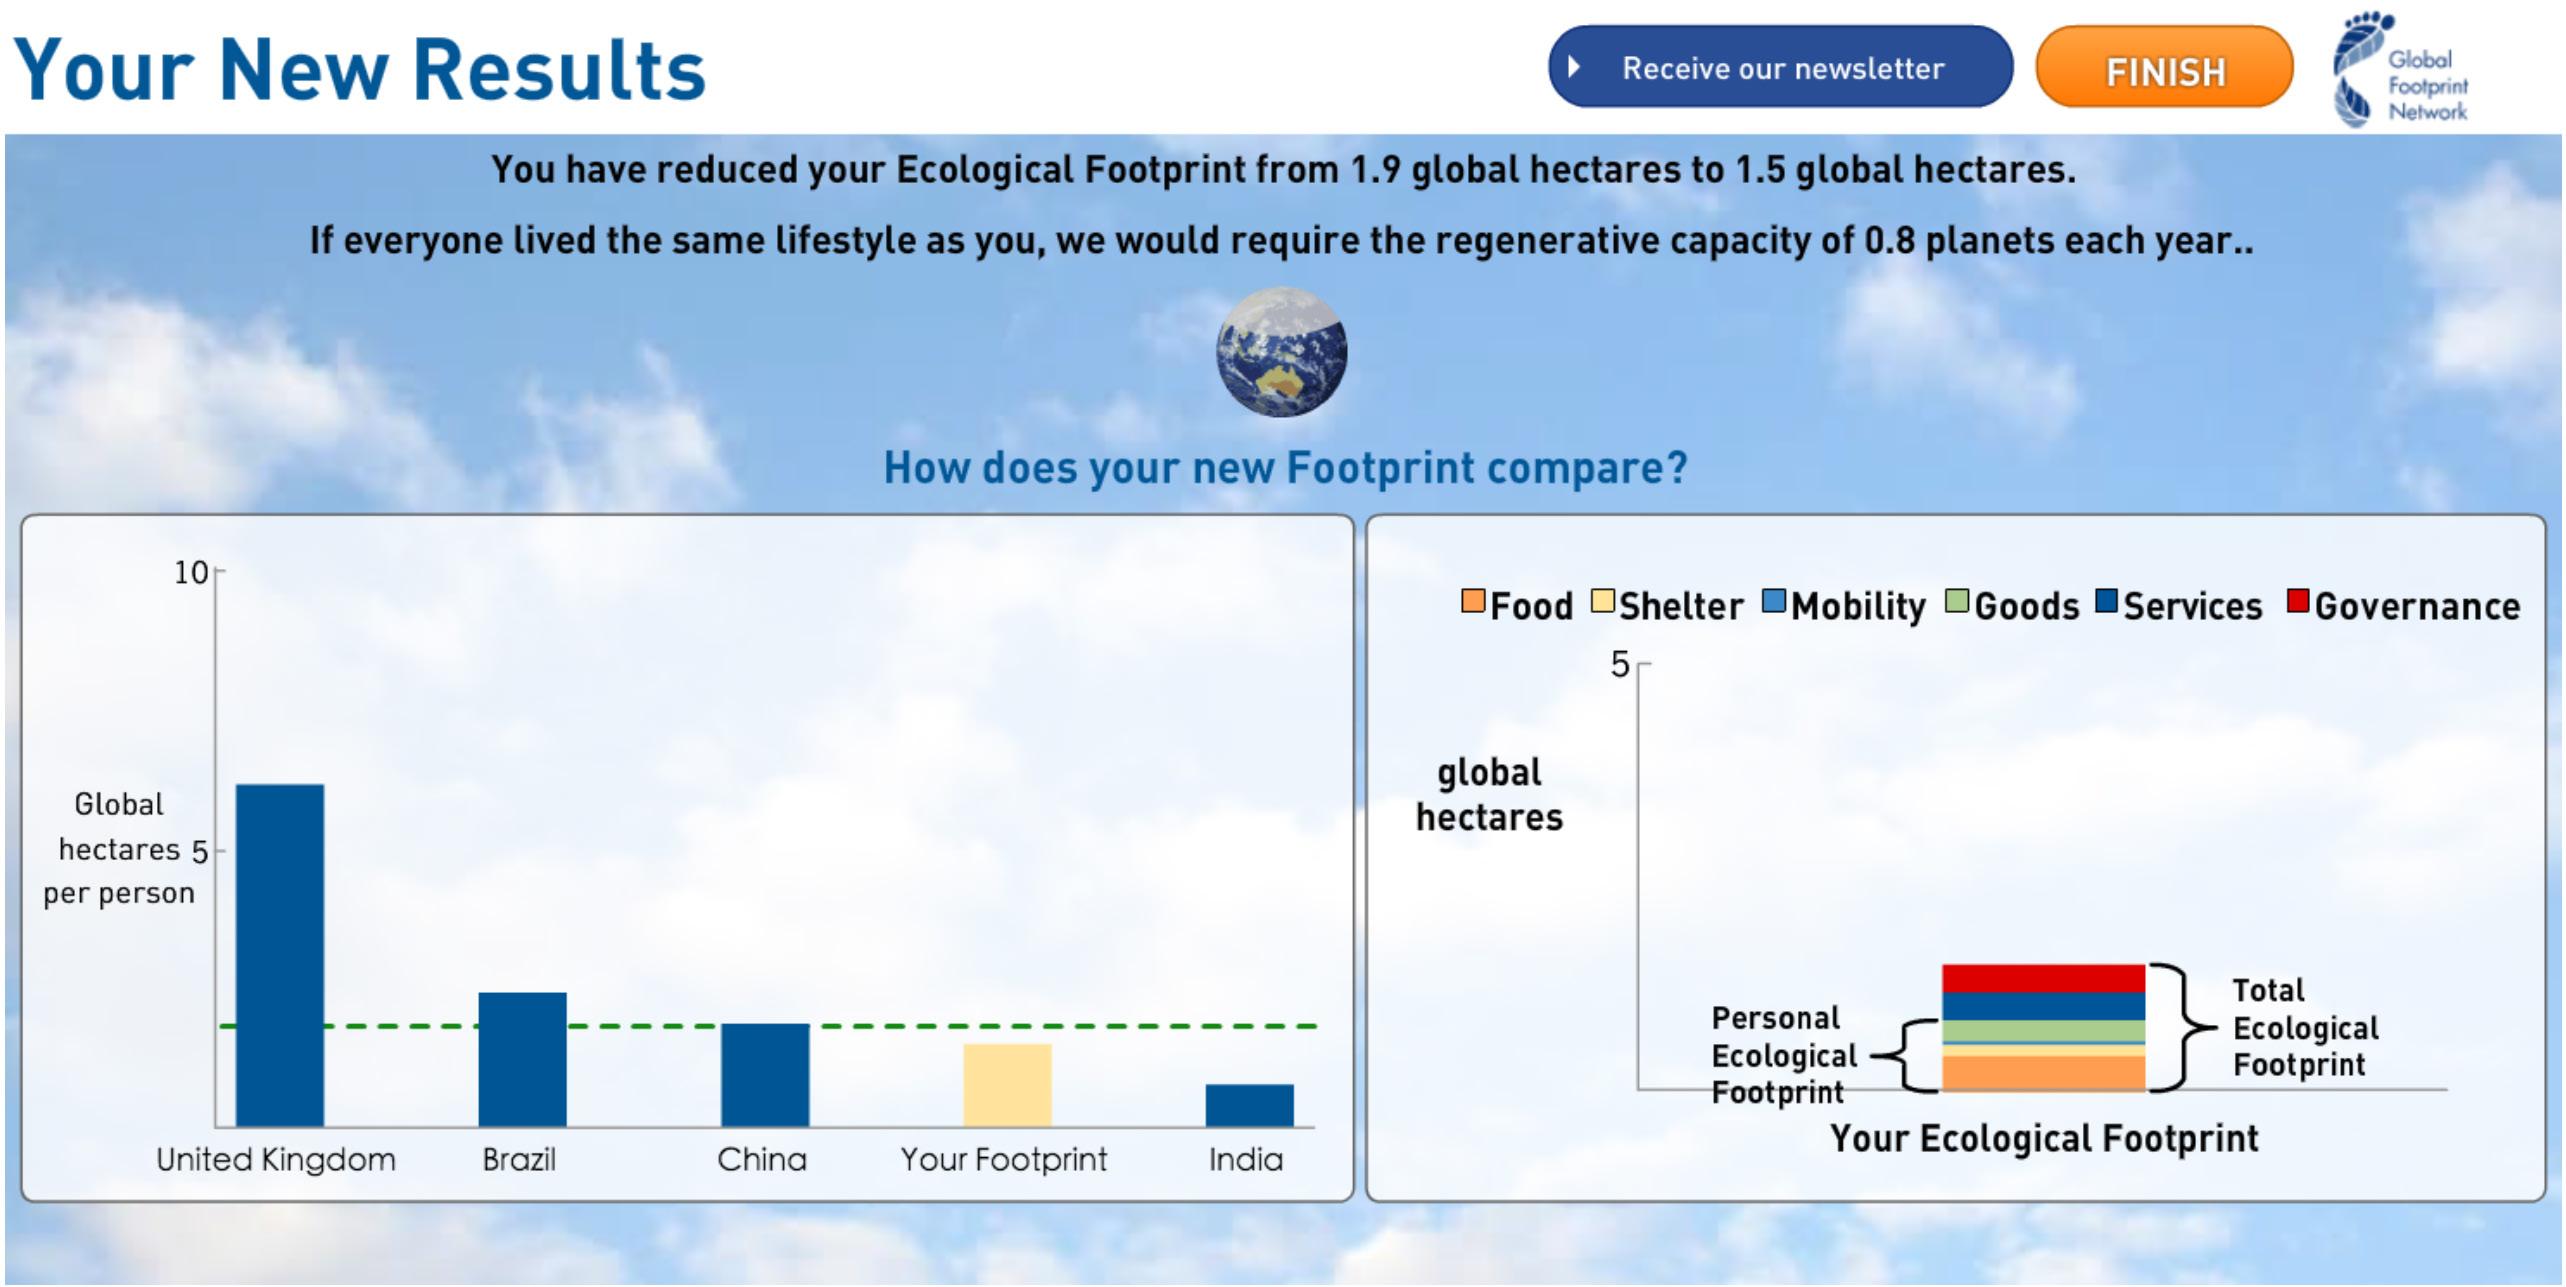
From the calculator I find a way to change my footprint.
My current ecological footprint is 1.9 global hectares. If I want to reduce my footpring by 20%, my eating habit and buying habit should be improved. So I adjust four aspects of my habit (showing on the right side) and lower my global hectares to 1.5.
Thus my new results is if everyone lived the same lifestyle as me, we would require the regenerative capacity of 0.8 planets each year. And my new footprint is below average footprint of china. That’s cool!
SOURCE
29 SOCIETY // CARBON FOODPRINT CALCULATOR //
http://slaveryfootprint.org/my-footprint#results
This week, I pay much attention to my diet. I choose to eat less meat, more vegetables and grains. Moreover, I buy no cloth, no maintenance and have no entertainment.
Then my result is if everyone lived the same lifestyle as me, we would require the regenerative capacity of 0.7 planet each yeaer. Besides, to support my lifestyle, it takes 1.3 global hectares of the Earth's productive area.

SOURCE http://www.footprintnetwork.org/en/index.php/gfn/page/
Eating (CNY)
(CNY)
Day 1 Day 2 Day 3 Day 4 Day 5
Morning juice, flapjack mushroom, tofu milk, bread milk, bread mushroom, tofu Noon rice, fish, lettuce rice, fried egg, beef tomato, noodle, egg pork wonton tomato, noodle, egg Evening soybean steambread tomato, noodle, egg pork wonton pork, lettuce milk sandwich Buying
Cloth - - - -Entertainment - - - -Maintenance - - - - -
calculators // SOCIETY // CARBON FOODPRINT CALCULATOR 30
Carbon FoodPrint Calculator
The test result is that there are 18 slaves work for me to meet my daily needs. Althrough my score are lower than three average score- score for other women my age, score for others from Shanghai, score for mother of 2 from U.K.- one is too many.


During the test, I just find that I have too many electronic products which may have been replaced by the smart phone and I also buy four phones during the past five years. Maybe I should reduce the purchase of electronic products.

SOURCE http://slaveryfootprint.org/my-footprint#results 31 SOCIETY // CARBON FOODPRINT CALCULATOR //
Slavery Footprint
Documentation of Clothing

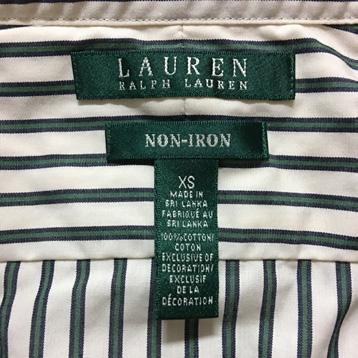
Garments that I have on are mostly produced in Southeast Asia. I choose one Gap Shirt, one Polo Shirt and one Nike T-Shirt, they are made in India, Sri Lanka and Vietnam. From the word map we can see that all three country are very far away from Shanghai (the city I live in), China.


INDIA
SRI LANKA VIETNAM
// SOCIETY // CARBON FOODPRINT CALCULATOR 32
PHILOSOPHIES
Whole Systerm Map of Electric Kettle
This is the whole systerm map of electric kettle. An electric kettle is used to boilig cold water. Due to the tradition of drinking tea, almost every family in China has at least one electric kettle at home. It is very efficient and useful.
Every single product can do impacts on the environment in many aspects, during the process of production.

SOURCE http://slaveryfootprint.org/my-footprint#results
33 PHILOSOPHIES //
OF
KETTLE //
WHOLE SYSTERM MAP
ELECTRIC
Item, Element and Proportion
We take the electric kettle apart and find out the items, materials and the proportion of each kind of the material.

The length of the color tape is used to represent the proportion of each element. From the color tape, we can see that the kettle is mainly made up of three types of materials - plastic, rubber and matel.

// PHILOSOPHIES // ITEM, ELEMENT AND PROPORTION 34
Inventory of Electric Kettle & LCA Chart

To sum up all the impacts of electric kettle’s life cycle, we create an inventory of everything within the kettle boundaries that causes an environmental impact. After understanding the product and the system, we make a sheet on the right to show some lifecycle phases and get our electric kettle data.
Then we use product data and environmental data to calculate the okala millipoints and make a bar chart to tell the impacts that each lifecycle phase does to the environment.
Based on our calculations, we can see that Disposal is the most important impact to our environment, then comes the Production, and it should be reduce more. So we would like to set these two parts as our goals.

35 PHILOSOPHIES // VENTORY OF ELECTRIC KETTLE & LCA CHART //
SOURCE Okala guide
White, Phillip; Steve Belletire and Louise St. Pierre. “Okala: Learning Ecological Design.” 2007.
Brainstorming
During the brainstorming, we propose three ways to reach our goals.
1. During the Production (and Manufacture) process, we can use clean energy, such as solor energy, wind energy or biogas energy.
2. During the Production (and Manufacture) process, we can half size the kettle in order to reduce boiling times and water (and materials) waste. Add insulation layer and using all-round heating mode are another two ways of reduce boiling times and water waste, it can improve efficiency.
3. During the Disposal process, we can re-cycle some parts of the kettle, such as copper wire, rubber ring.

// PHILOSOPHIES // BRAINSTORMING 36
Evaluate and Solutions Choosing
After brainstorming, we recalculate the okala millipoints. Half size the container of the kettle is more useful than adding insulation layer or using all-round heating mode in reducing production okala millipoints and Disposal okala millipoints because the other two plans need more materials.
The result came to be almost half lower than the existing product in the use part. And plan 2 we try to find ways to reduce the impact of production and transport part, the total points of plan 2 is the lowest of the three plans.


37 PHILOSOPHIES // EVALUATE AND SOLUTIONS CHOOSING //
METHODOLOGIES
Research
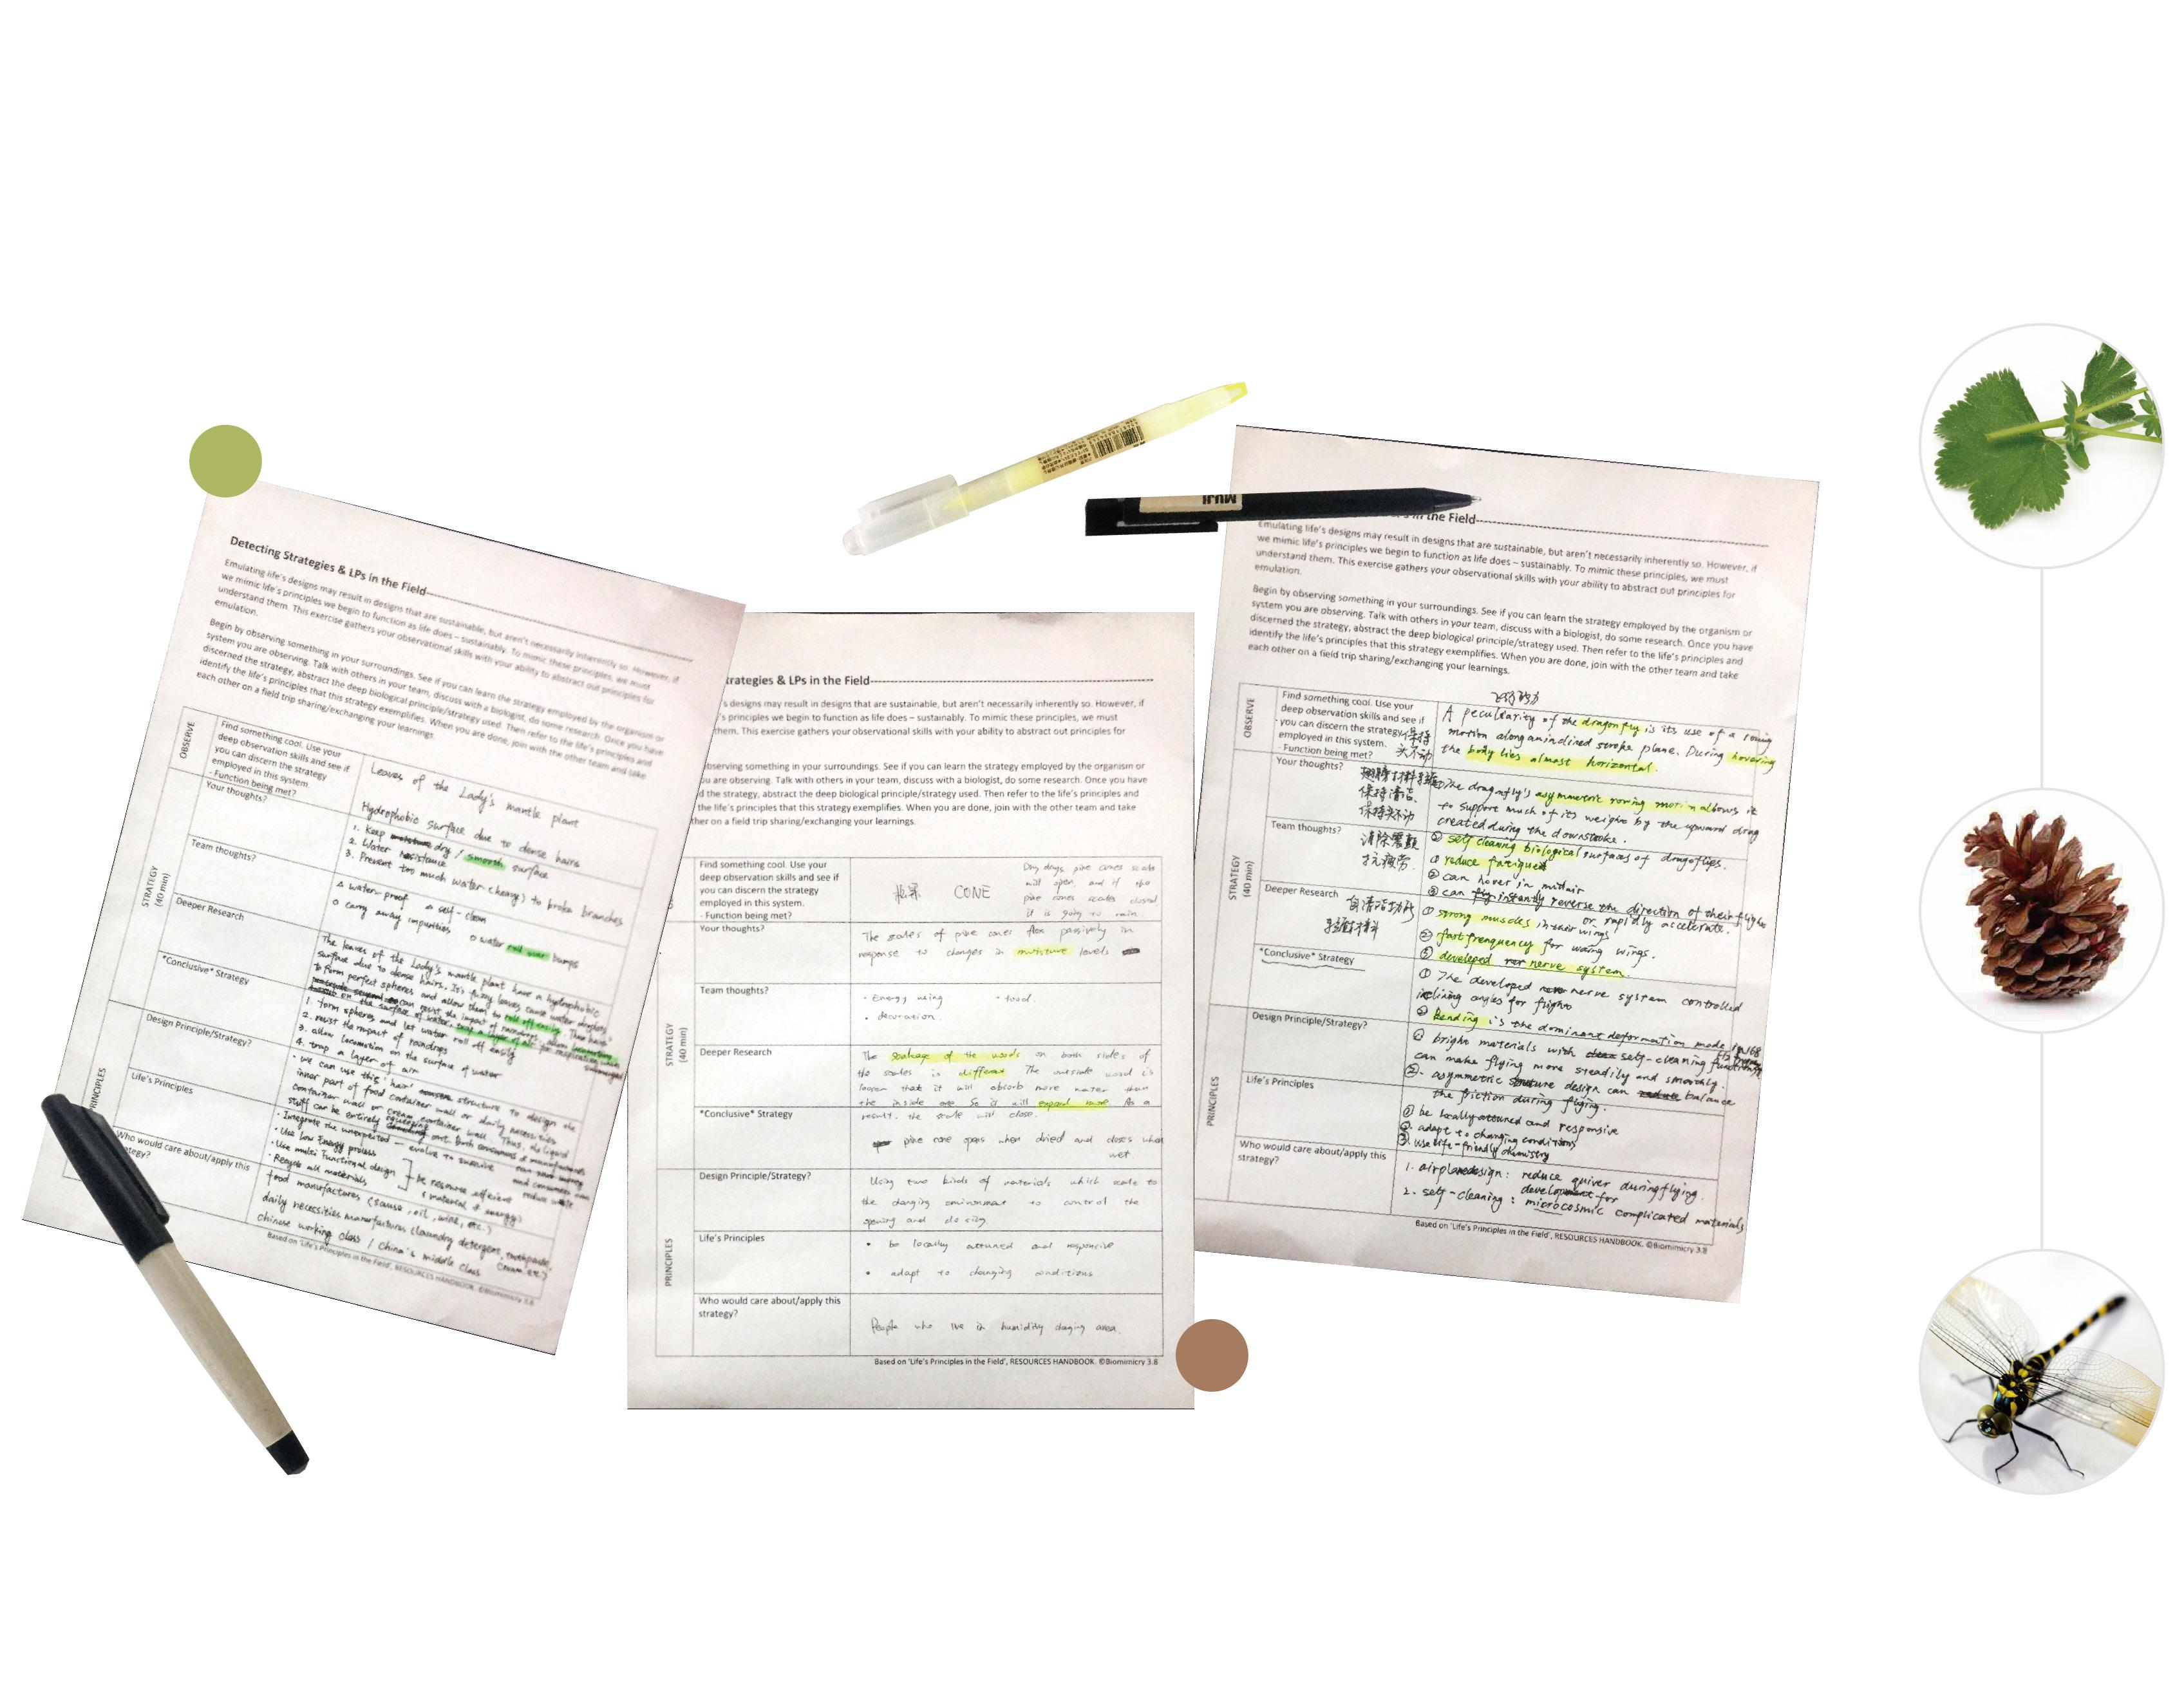
Before designing with Life’s Principals, we try to find some cool creatures as our research objects on the ‘ask-nature’ website.
Then we choose Lady’s mantle plant, pinecone and dragon fly. After discussion, each of us have a basic idea of three objects. We fill in three entire charts and pick the pinecone out as the final object.
// METHODOLOGIES // RESEARCH 38
SOURCE
https://asknature.org/
Observe & Strategy
Observe
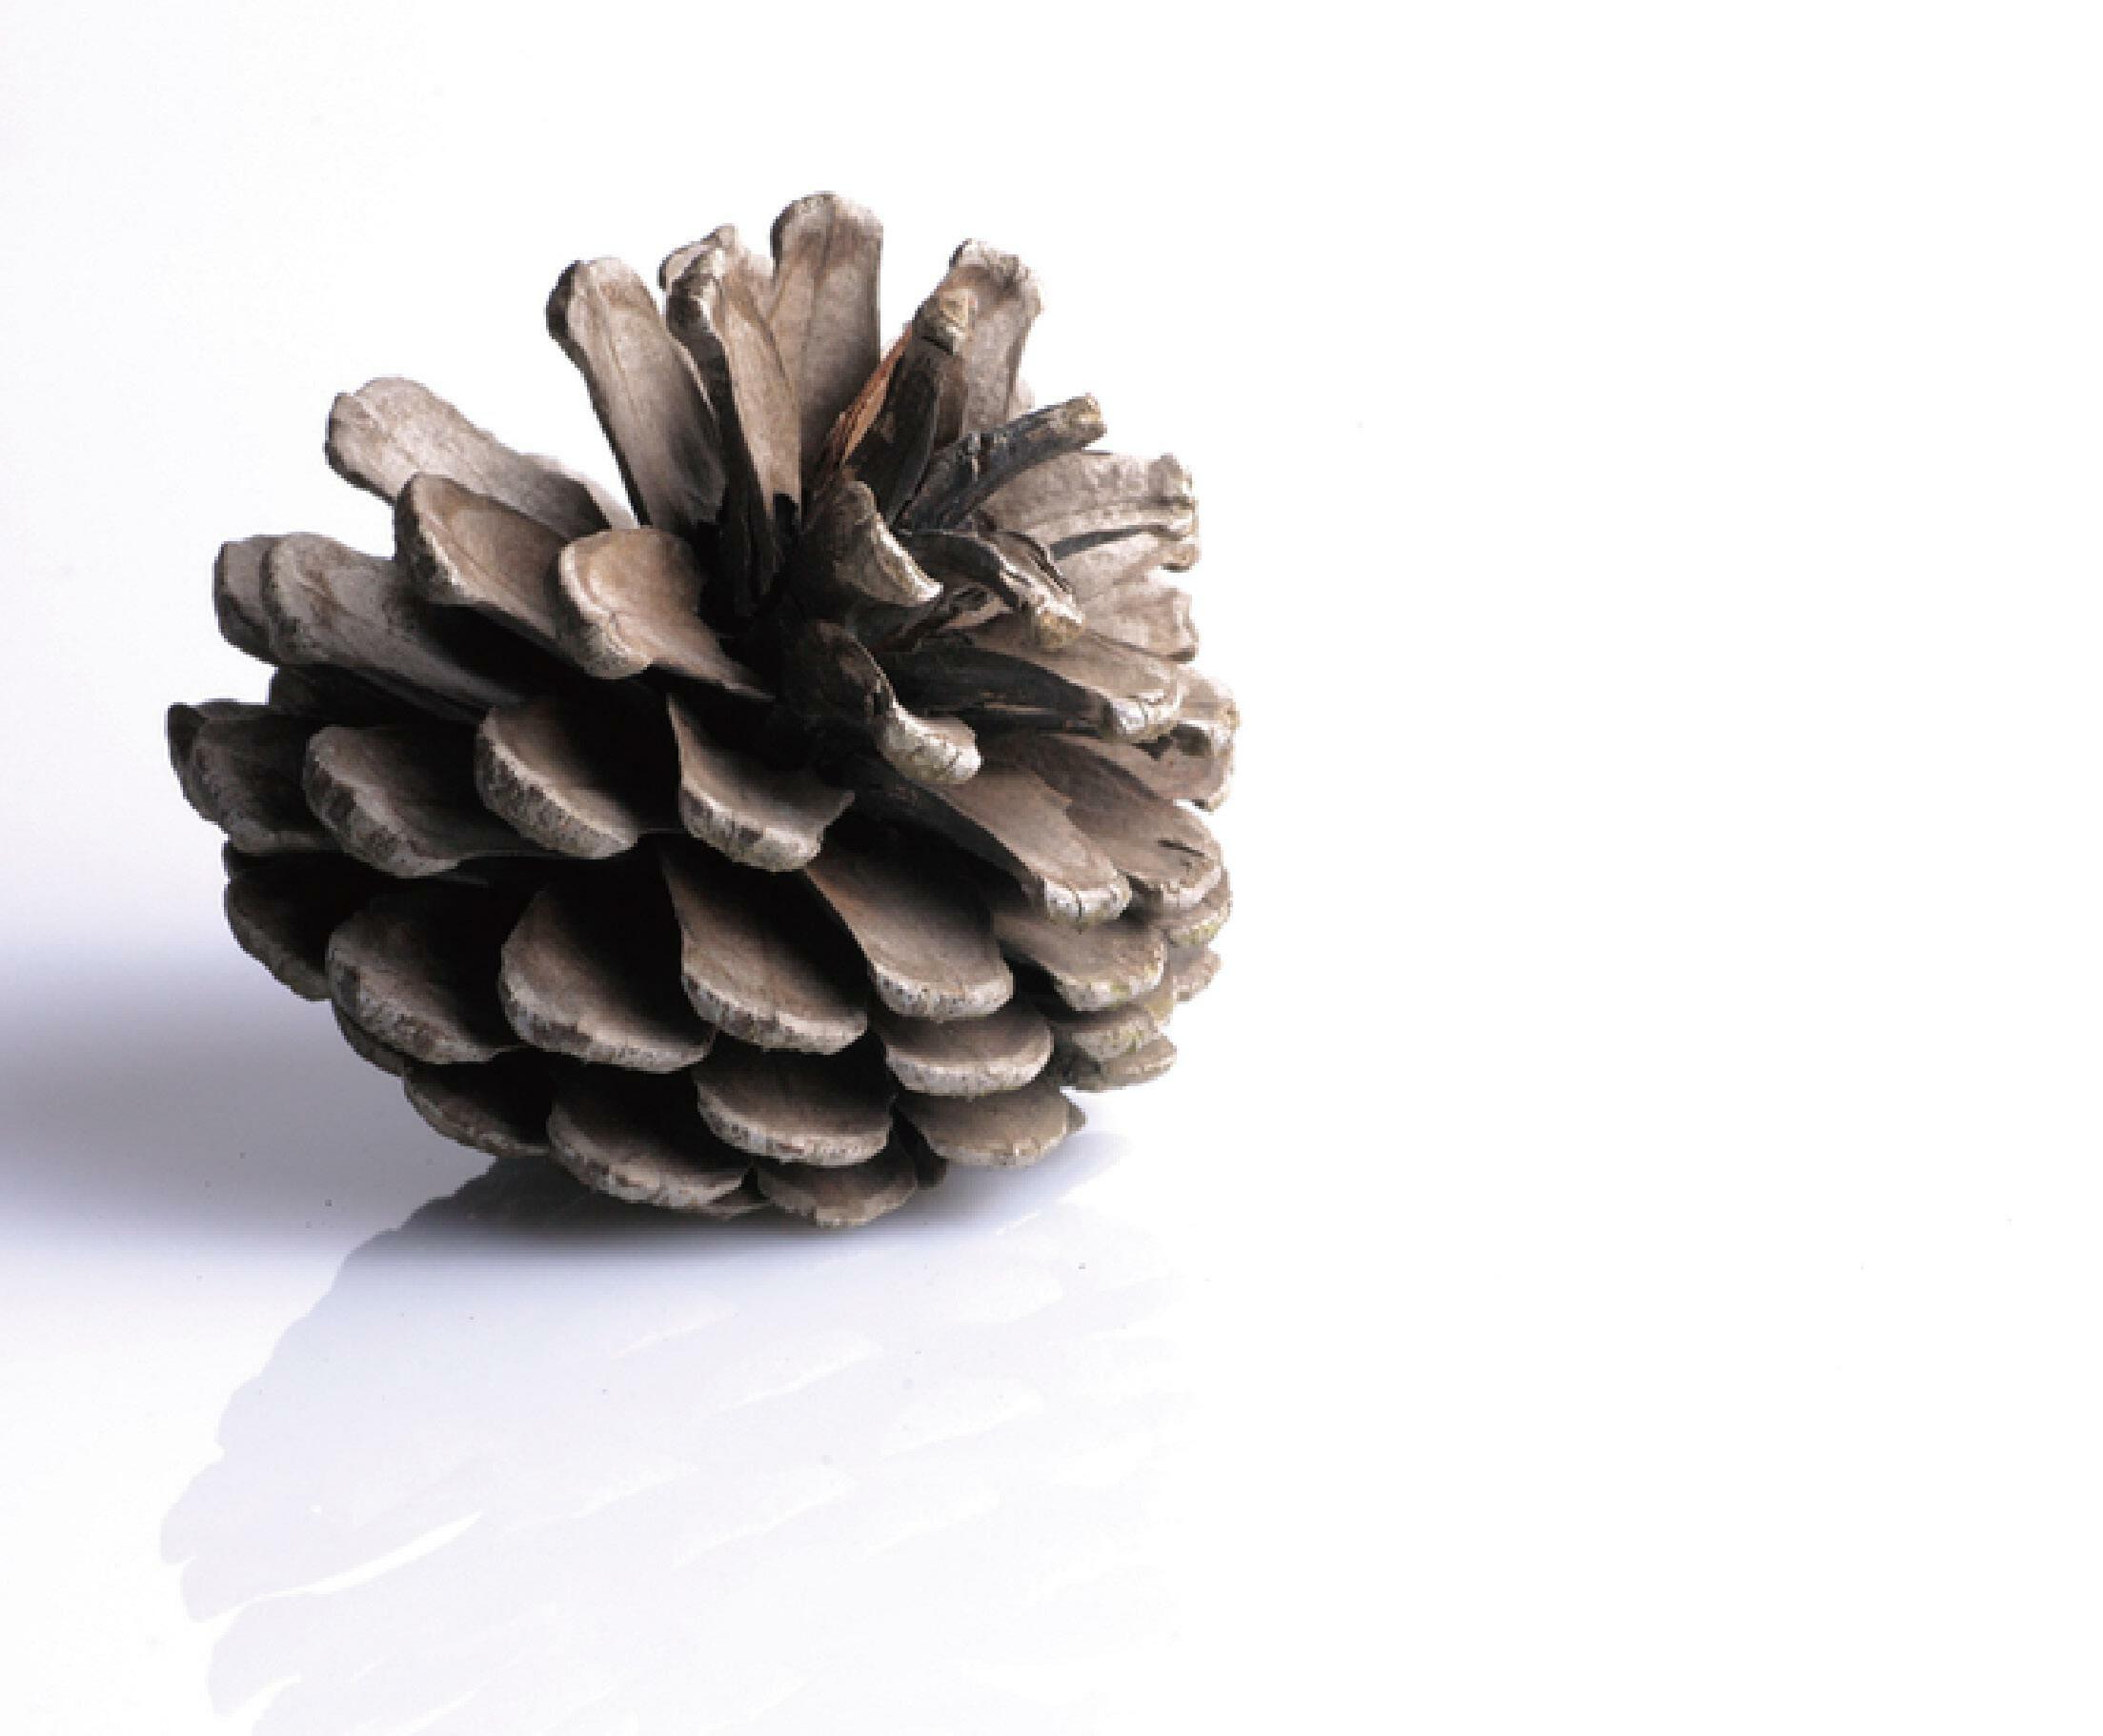
Dry days, pine cones scales will open; on the contrary, if the pine cones scales closed, it is going to rain.
Strategy
Ying's thought: The scales of pine cone flex passively in response to change in mositure levels.
Zhao's thought: The function of pine cone can be use as fuel and decoration; it is also the food of squirrel, the form of its appearance is easy for squirrel to eat.
Li's thought: Pine corn is the raw materials of leather and paint industry, its shell can be made into dye, activated carbon, etc.
Deeper Research
The soakage of the woods on both sides of the scales is different. The outside wood is looser that it will absorb more water than the inside one. So it will expand more. As a result, the scale will close.
Conclusive Strategy
The scale of pine cone will change over humidity of the environment; when wet, it closed;dry, open.
39 METHODOLOGIES // OBSERVE //
Life's Principles

// METHODOLOGIES // LIFE PRINCIPLE 40
Strategy
Each small piece of pinecone consists of two layers. When wet, the outer layer extend longer than the inner part, so the scale bend inward and the pinecone shut down. When dry, it return to the original state and the pinecone open.
Thus, we think that we can use two kinds of materials, which scales are changing over the environment, to control the opening and closing.
Who would care about/apply this strategy? People who live in the humidity-changing area.

41 METHODOLOGIES // STRATEGY //
https://www.iucn.org/ https://www.worldanimalprotection.org/ http://www.foe.org.hk/


http://www.nyc.gov/ http://www.cpvs.org.cn/ http://www.cnrec.org.cn/ http://www.eedu.org.cn/

http://www.greenpeace.org/usa/ http://www.tnc.org.cn/ http://www.cecc-china.org/


WEBSITE // WEBSITE // ENVIRONMENTAL ORGANIZATION 42
Environmental Organization
EPILOGUE
After finishing of these intensive tasks for sustainable design course we have a insight of environmental design from a new perspective. At first, we have chosen our hometown as a research place to explore the site, climate, including its rainfall and wind, hardiness zone and comfortable zone and so on. Then we shrink the range into a block of buildings to research the ventilation and solar heat of the buildings and then to promote its air circle and sun exposure. Only in this step we began to realize the nature environment condition has a big effect on specific environmental design. Then we made a research on water and sewage system around our collage. Then we moved into a more microcosmic and specific level from the macroscopical environment to do some design and research. We even looked back ourselves to explore individual behaviors’ impact on environment. We are designers for environment, products and even systems, but surprised to find that we did leave so many carbon footprints and resource waste that harms the planet. When it comes task8 we made LCA of a certain product to draw the outline of the whole product system to assess its sustainable level aiming at a more scientific design method, and in the meanwhile we got a new methodology to guide design that has nothing to do with its outlook and market. At the end we return to nature to discover life principals and strategies to get nature design skills. The secrets of design stems actually from the nature and environment we live in.
43 EPILOGUE //
