13 minute read
DESIGN FOR ECONOMY


RS MEANS
RS MEANS
Advertisement
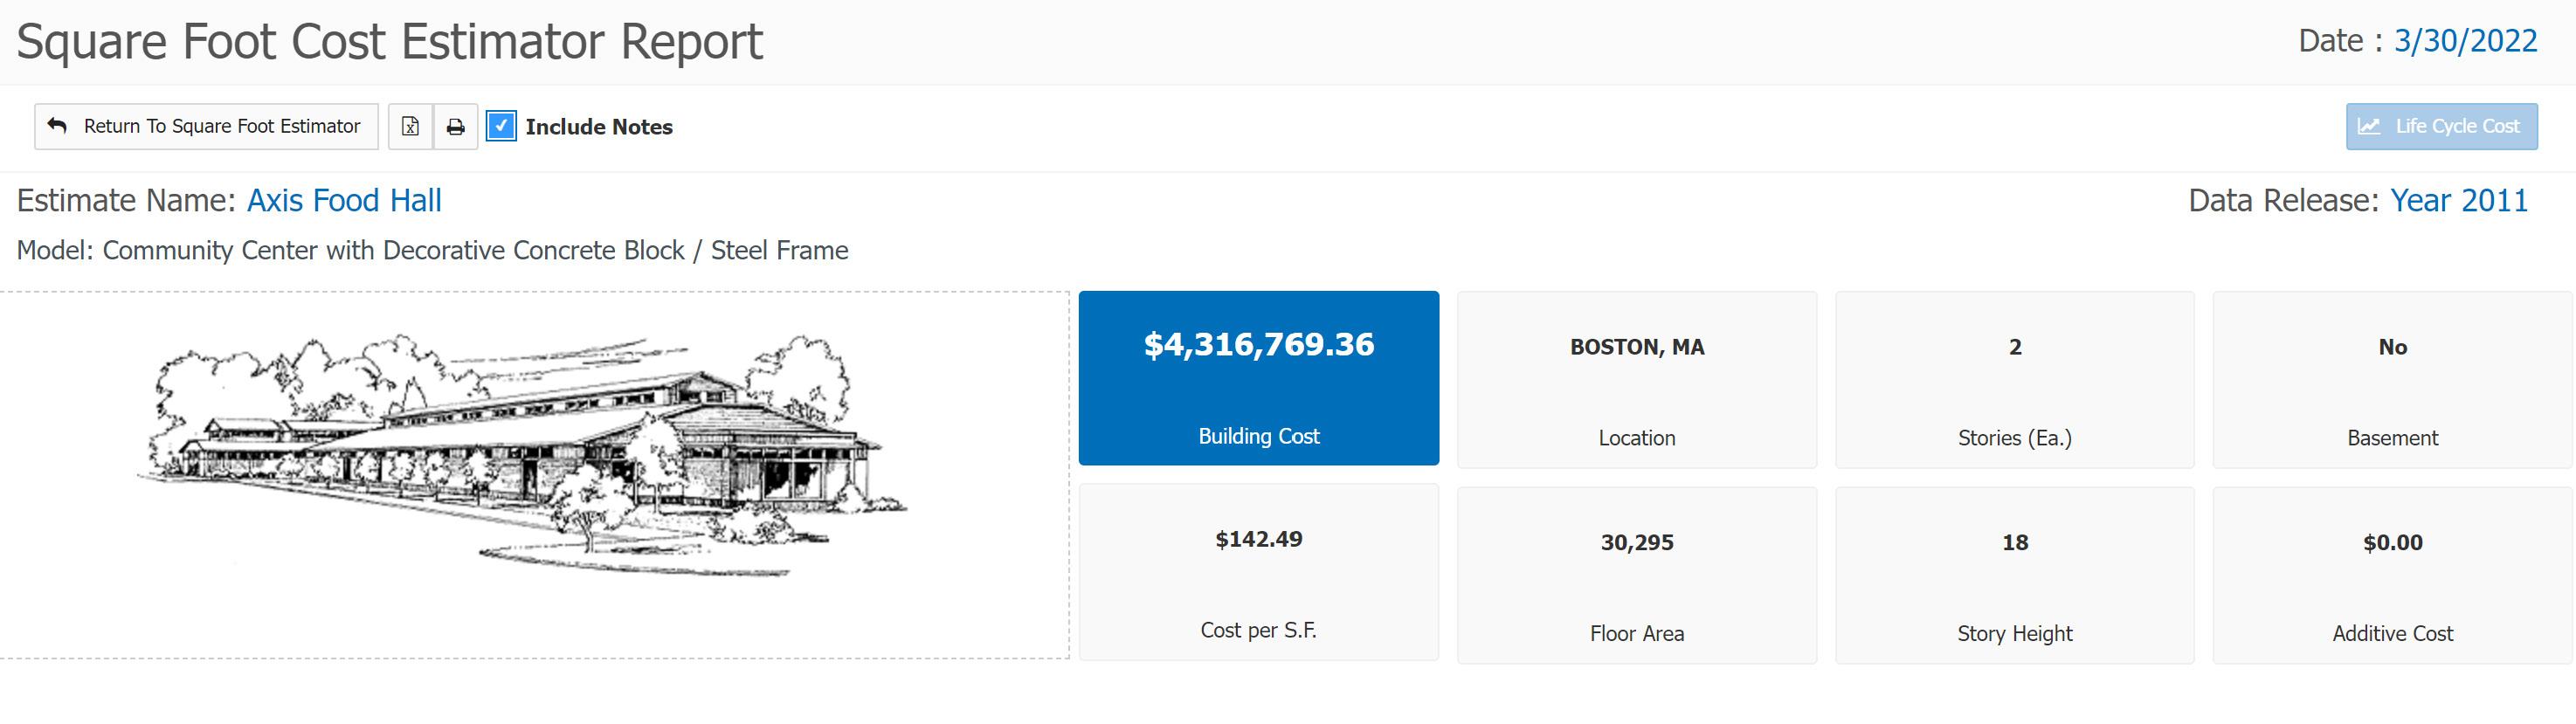
The RS Means Square Foot Cost Estimator tool was used for the Axis project to determine an estimate for construction costs on the project. It was used as materials were selected to help understand the impact on the overall cost.
Overall, the project was determined to be budgeted at $4.3M for total building costs, equaling about $142.49/SF for the Food Hall building. This estimate was based off of material prices for Boston, MA, near the site in Braintree and Weymouth.
Calculations were also made to understand the overall cost for the size of the building as well, at two stories high, and 18 feet high per level, with an overall square footage of 30, 295 SF.
IMAGE: RS Means Data, 2022
DESIGN FOR ECONOMY
CIRCULATION
CIRCULATION RATIO
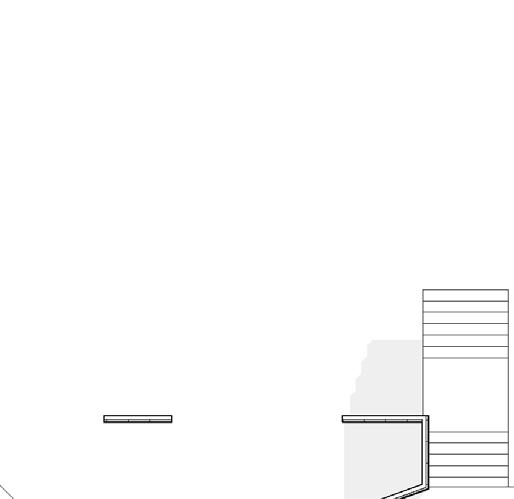
The Axis Food Hall will be a place for local businesses and restaurants and community gathering in a variety of forms, including a Food Hall, indoor and outdoor seating, an event hall, and a bar.
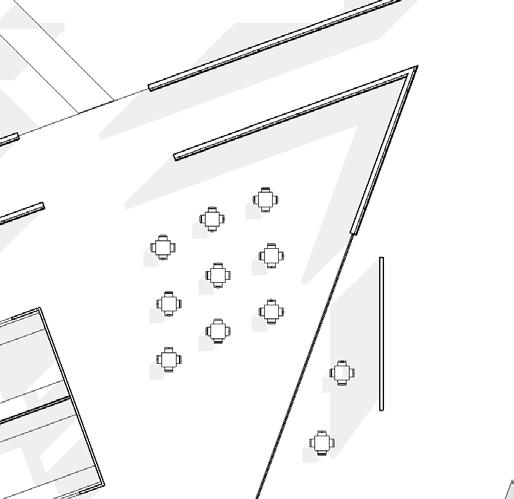
The building is unique in that the main site circulation path goes directly through the building to create a dynamic entrance.
The circulation ratio started at 50% but after further analysis, it was edited down to 25% by adjusting some circulation paths to be used both as circulation and seating areas for a dual use. Circulation space is also be used as waiting space for vendor booths.

VENDOR
SECT. 2
ELEV. 2 VENDOR


TOWN LAWN
VENDOR SECT. 1
VENDOR
VENDOR VENDOR
VENDOR
RESTROOM
RESTROOM ELEV.
STOR.
ELEV. 1 VENDOR
VENDOR
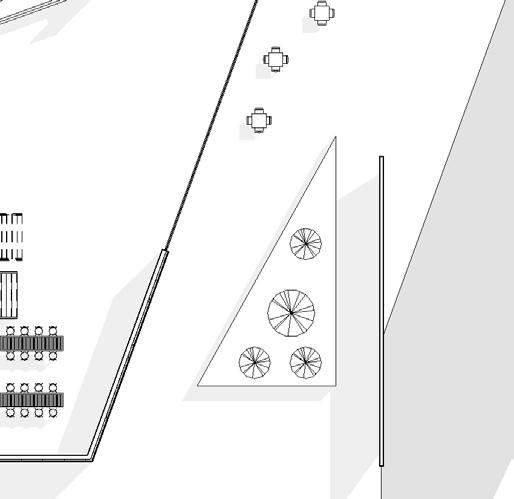
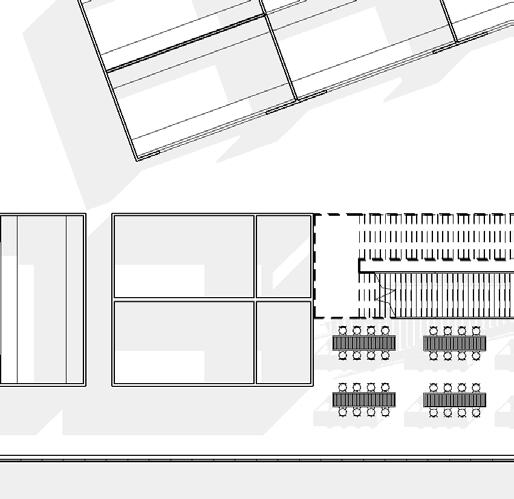
IMAGE: Axis Food Hall Floor Plan
FLOOR PLAN -FOOD HALL -LEVEL 1
INDOOR SEATING
RIVERWALK SEATING

DESIGN FOR ECONOMY
HEAT MAPS
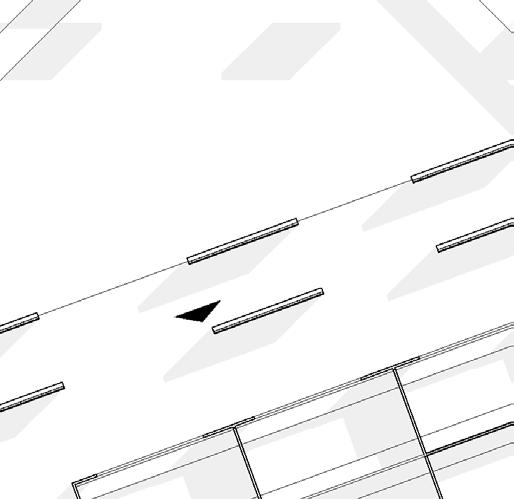
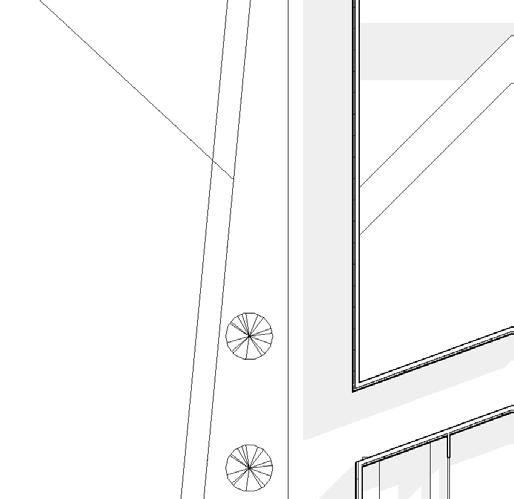
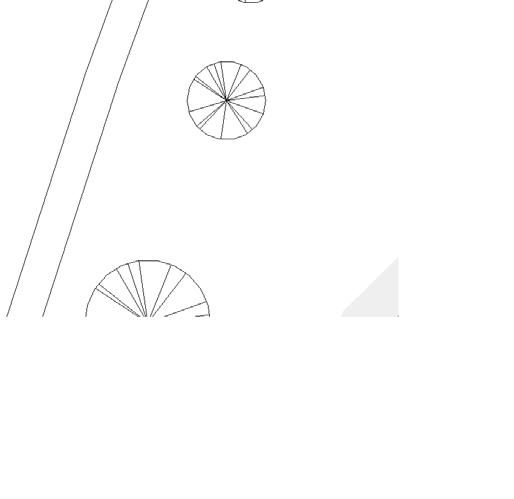
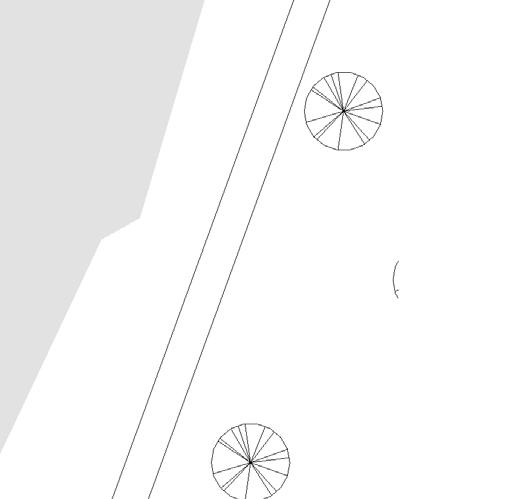
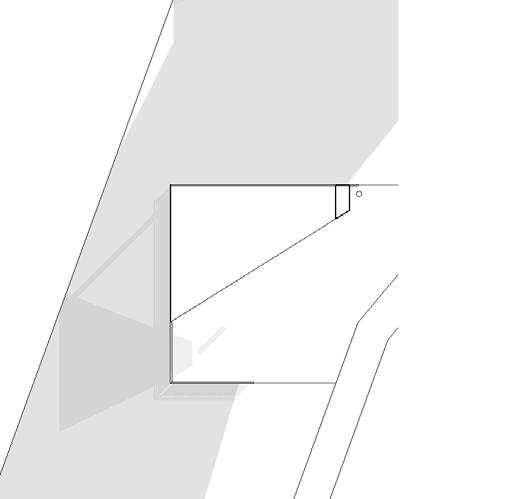
DAYTIME MAP
The main public circulation route is shown in Red, starting from a south entrance, and leading to the central path circulation. Secondary paths of circulation flow around the vendor booths, to the outdoor seating, and to the central stairs to the second floor of the building.
SECT. 2
ELEV. 2
TOWN LAWN
SECT. 1
High Traffic
Moderate Traffic
Low Traffic High Traffic
Moderate Traffic
ELEV. 1
IMAGE: Axis Food Hall Heat Map
Low Traffic NIGHTTIME MAP At nighttime, the vendor booths will be closed, and the main circulation will Low Traffic route through the building from the south No Traffic entrance to secondary outdoor entrances.
Low Traffic
No Traffic
SECT. 2
ELEV. 2
TOWN LAWN
SECT. 1
ELEV. 1 RIVERWALK SEATING
RIVERWALK SEATING
DESIGN FOR ECONOMY
REGIONAL MATERIALS
BUILDING MATERIALS
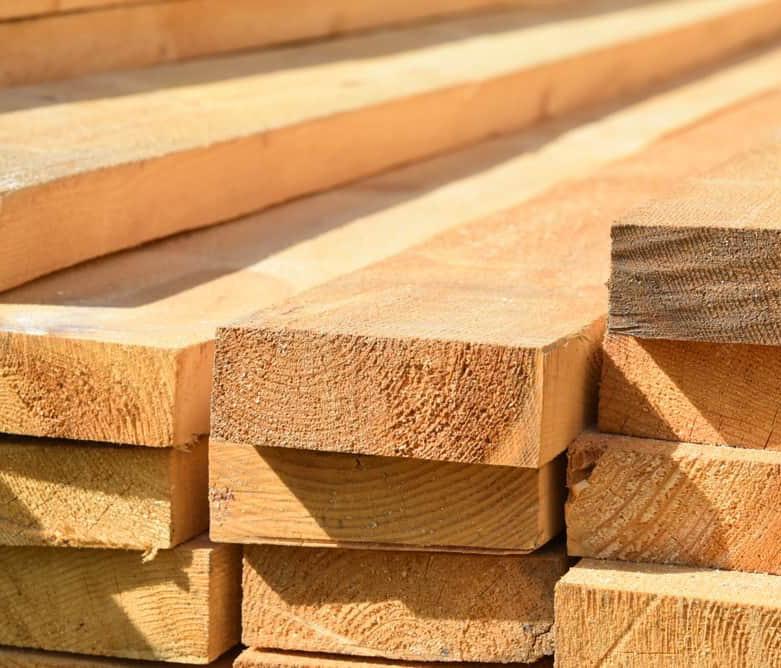
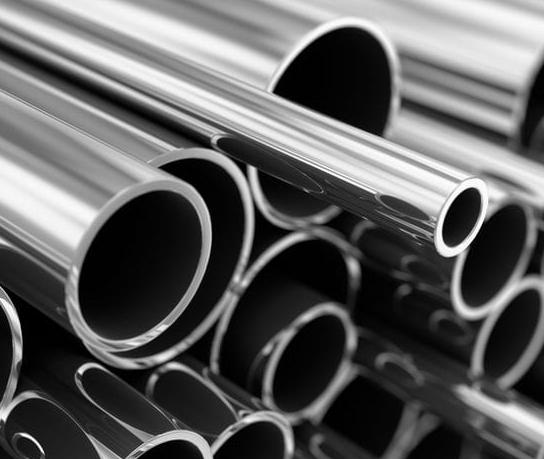
The Axis Food Hall focused in on the local building materials of steel, concrete and wood, to be used in various capacities.
These three materials were economical to use because of their locality to the site, and ease of access. They were also economical because they were able to be used in multiple facets of the building -- as structural materials as well as cladding and interior finish materials.
ECONOMY STRATEGIES
There were multiple cost effective strategies used at the Axis Food Hall to be conscious of the design for economy. The design tried to pair down and focus on a smaller material palette in order to minimize the cost of material as well as types of installation required.
The strategy was also implemented to merge the main site circulation path with the building itself in order to cut down on overall circulation, and provide multiple uses at one building. While the building’s primary use will be for local vendors and community events, it will also serve as an outdoor circulation path and connection to the Town Lawn.
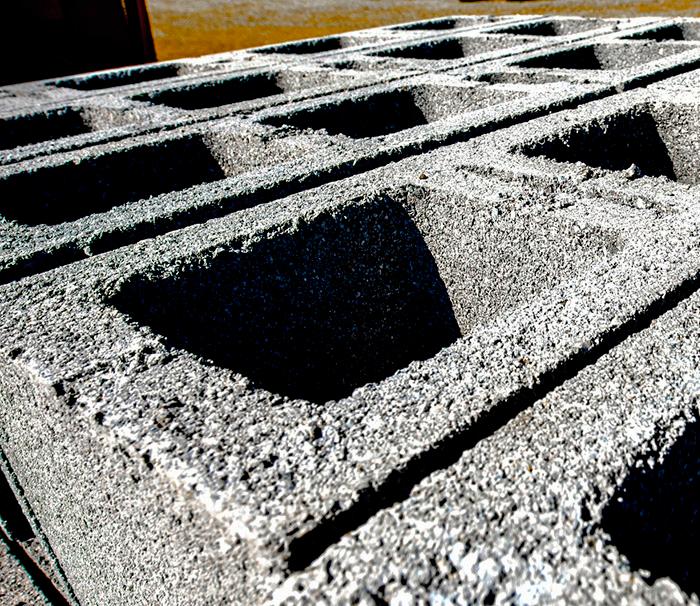
IMAGE: Concrete material, Hassiotis, Christopher, 2018 IMAGE: Wood material, Home Stratosphere, 2021 IMAGE: Steel material, Advanced Refractory Metals, 2022
IMAGES: Sourced from RS Means
DESIGN FOR ECONOMY
LIFE CYCLE ASSESSMENT - CONCRETE + CARPET
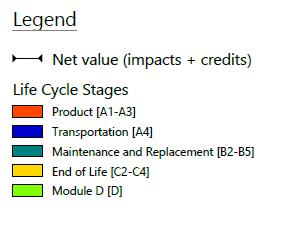
LIFE CYCLE STAGE ANALYSIS
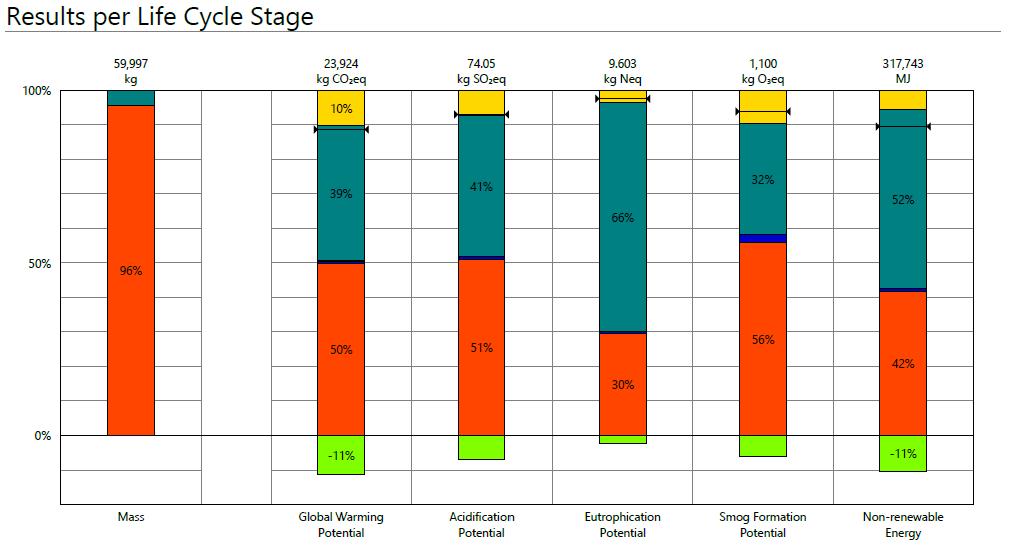
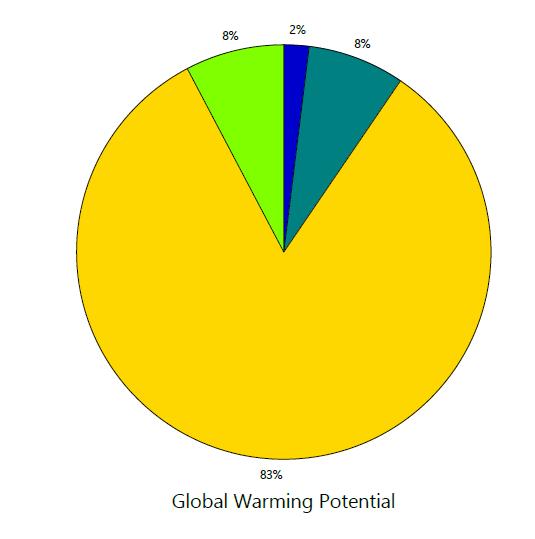
The Life Cycle Stage chart compares the carbon footprint at each stage along the lifespan for the Concrete and Carpet flooring.
Overall, it’s highest global warming potential percentage is in the product category, followed closely by maintenance and replacement. Creating the concrete and carpet product itself will cause the highest impact during its life cycle stages, causing the highest impact in global warming potential and smog formation potential.
There will also be a high impact to eutrophication potential during the maintenance and replacement stage it’s life cycle.
There are some opportunities for recyclability as shown by the small percentage at the Module D Segment.


DESIGN FOR ECONOMY
LIFE CYCLE ASSESSMENT - CONCRETE + CARPET
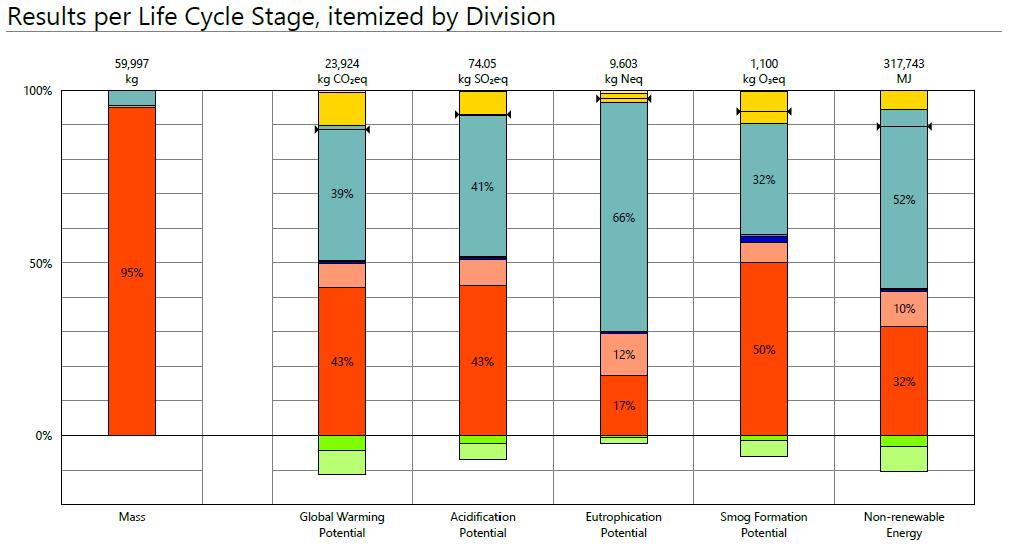
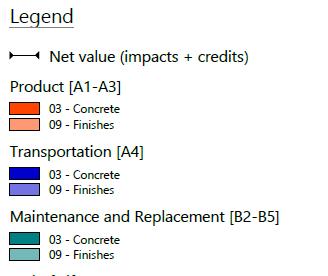
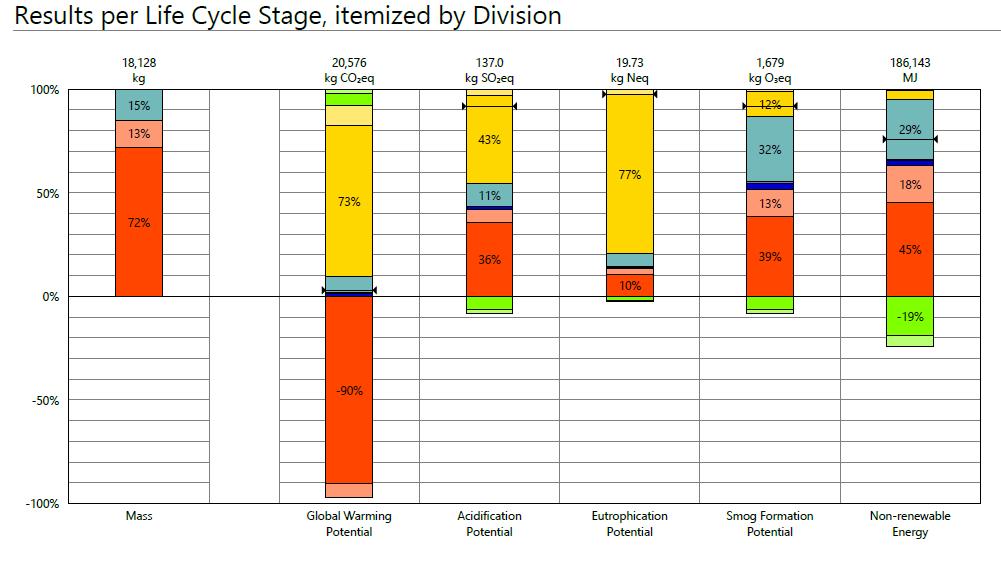
ANALYSIS BY DIVISION
In the Itemized chart, the higher percentage of concrete product shows the amount of embodied carbon, versus how wood sequesters carbon.
Overall, in breaking down the concrete and carpet flooring system, the concrete will have a significantly higher global warming impact that than the carpet finish, especially in the smog formation potential, global warming potential and acidification potential categories.
In contrast, the carpet finish will have a higher impact than the concrete in the maintenance and replacement segment and the end of life segments. But, it will have more opportunity for recyclability shown in the module D segment.
The highest percentage shown is in the maintenance and repairs segment, because of the maintenance and upkeep required for this product through its life cycle.
DESIGN FOR ECONOMY
LIFE CYCLE ASSESSMENT - WOOD + ENGINEERED WOOD PLANK
LIFE CYCLE STAGE ANALYSIS
The Life Cycle Stage chart compares the carbon footprint at each stage along the lifespan for Wood and Engineered Wood Flooring system.
Overall, it’s highest global warming potential percentage is in the end of life segment, followed by much smaller percentages in maintenance and replacement and module D.
The wood and engineered wood flooring system will have it’s highest impact in end of life stage in the global warming potential and eutrophication potential segments. The product stage will also have a high impact in the non-renewable energy and smog formation potential segments.
In contrast, the product stage will have a negative impact in the global warming potential segment.

DESIGN FOR ECONOMY
LIFE CYCLE ASSESSMENT - WOOD + ENGINEERED WOOD PLANK
ANALYSIS BY DIVISION
Overall, the structural wood portion of the flooring system will have a higher impact than the engineered wood finish, specifically in the product stage. This is followed by a smaller impact the engineered wood finish will have in the maintenance and replacement stage.
In the global warming potential segment, the wood product is shown at a negative value because of it’s ability to sequester carbon and is able to absorb carbon, giving it a lower footprint.
The highest percentage in the chart comes in the End of Life cycle because of the binders chemical processing and the composition of wood product materiality.
There is some potential for recyclability for the wood and wood finish as shown by the Module D percentage.
DESIGN FOR ECONOMY
EPD - FLOOR CONCRETE
CAST-IN-PLACE CONCRETE -2500PSI
These charts show the comparison of the EPD for Cast-in-Place Concrete Structural Flooring with a 2500 PSI.
1 - BOXPLOT CHART
In analyzing the boxplot chart for cast-inplace concrete it can be found that the Baseline for embodied carbon will fall at 340 kgCO2e, and the achievable target falls at 235.5 kgCO2e of embodied carbon.
2 - COMPARE BY PRODUCT
In comparing by product, it is found that there is a range of embodied carbon options between 231 kgCO2e from CEMEX at the low end and 380 kgCO2e also from CEMEX at the high end.
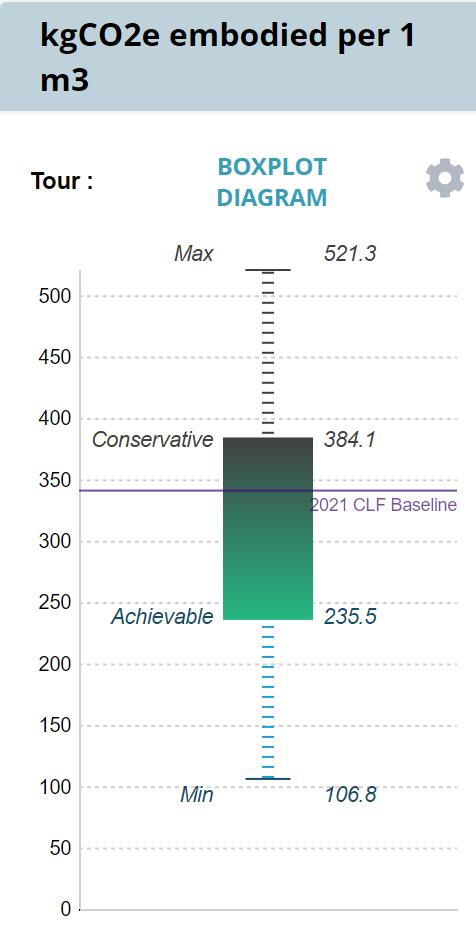
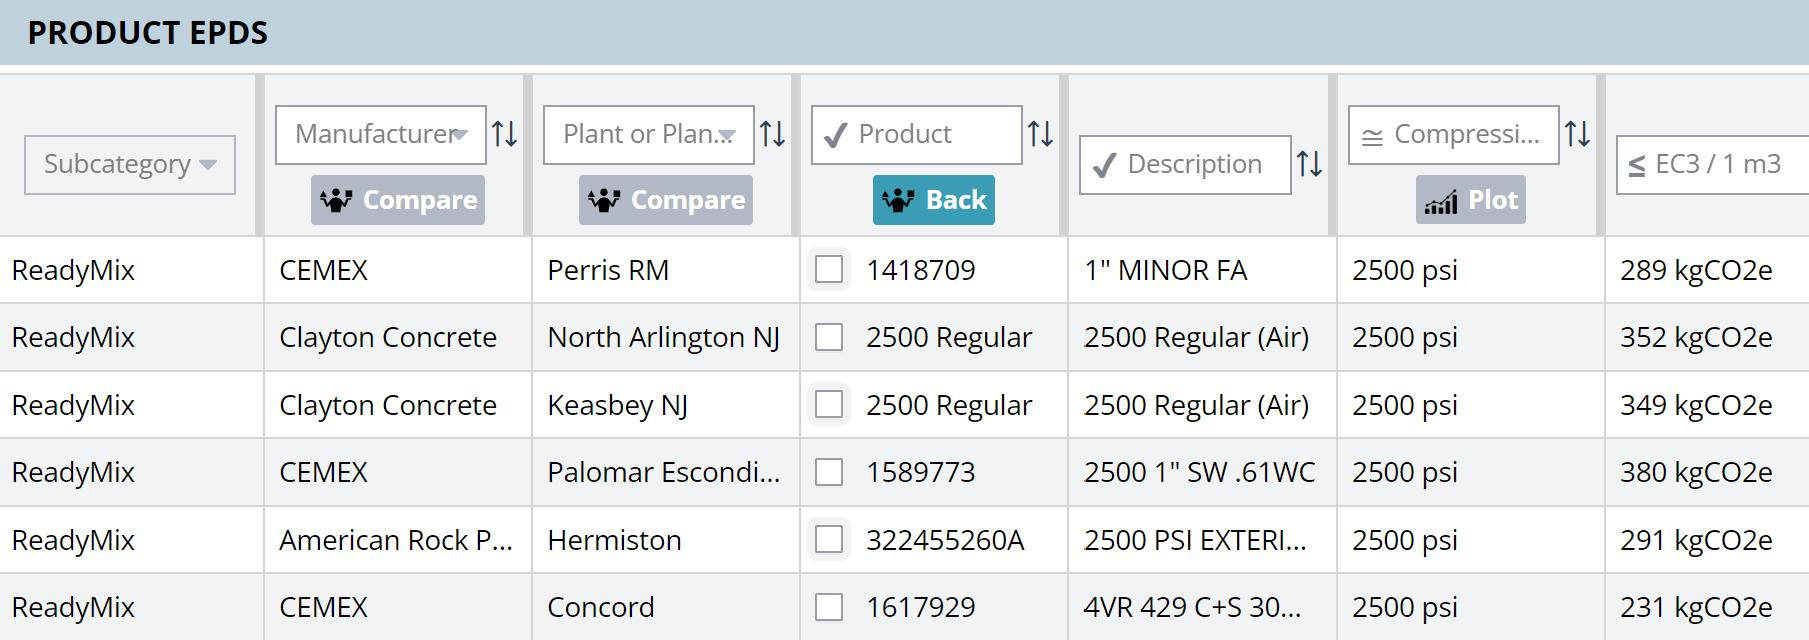
IMAGE 2
IMAGE 1
DESIGN FOR ECONOMY
EPD - FLOOR CONCRETE
CAST-IN-PLACE CONCRETE -2500PSI
These charts show the comparison of the EPD for Cast-in-Place Concrete Structural Flooring with a 2500 PSI.
1 - COMPARE BY MANUFACTURER
In comparing by manufacturer it appears that many of the products have similar embodied carbon ranges. The manufacturer with the lowest achievable target for embodied carbon is Firth at 217 kgCO2e.
2 - COMPARE BY PLANT
After comparing by plant, there is a larger range of embodied carbon that can be observed. The plant with the lowest achievable target for embodied carbon is South-San-Francisco Central Concrete at 243 kgCO2e.
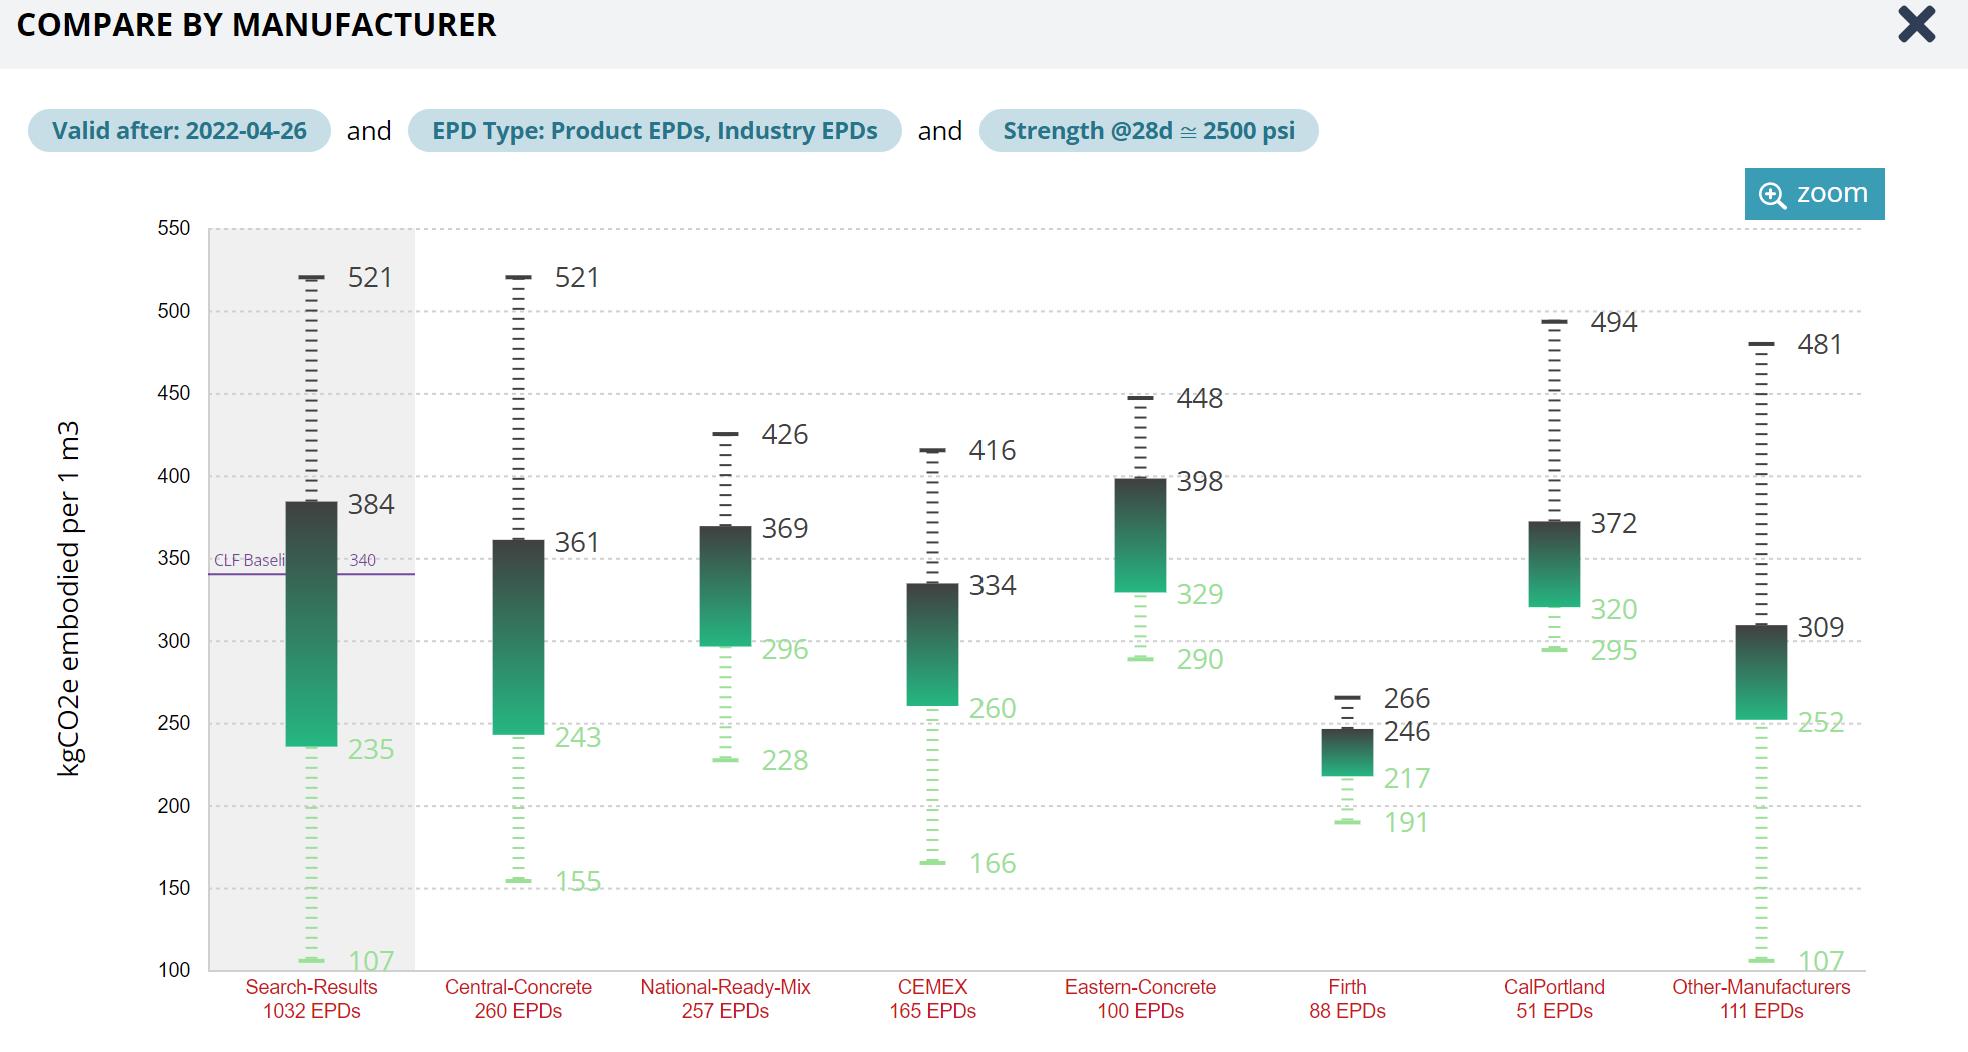
IMAGE 1

IMAGES: Charts created with EC3
DESIGN FOR ECONOMY
EPD - FLOOR WOOD
LVL STRUCTURAL WOOD
These charts show the comparison of the EPD for Composite Wood Structural Flooring with LVL Wood.
1 - BOXPLOT CHART
The boxplot chart for LVL structural wood has similar findings to the chart for castin-place concrete. It can be found that the Baseline for embodied carbon will fall at 400 kgCO2e, and the achievable target falls at 230.3 kgCO2e of embodied carbon.
4 - COMPARE BY PRODUCT
In comparing by product, there is a wide range of embodied carbon options, ranging between 9.12 kgCO2e from Saint-Gobain Weber and 361 kgCO2e from Metsa Wood.
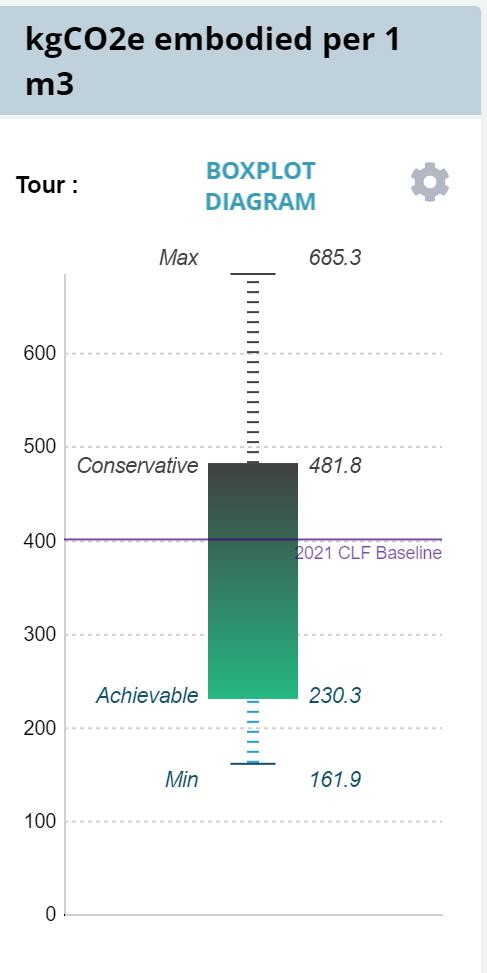
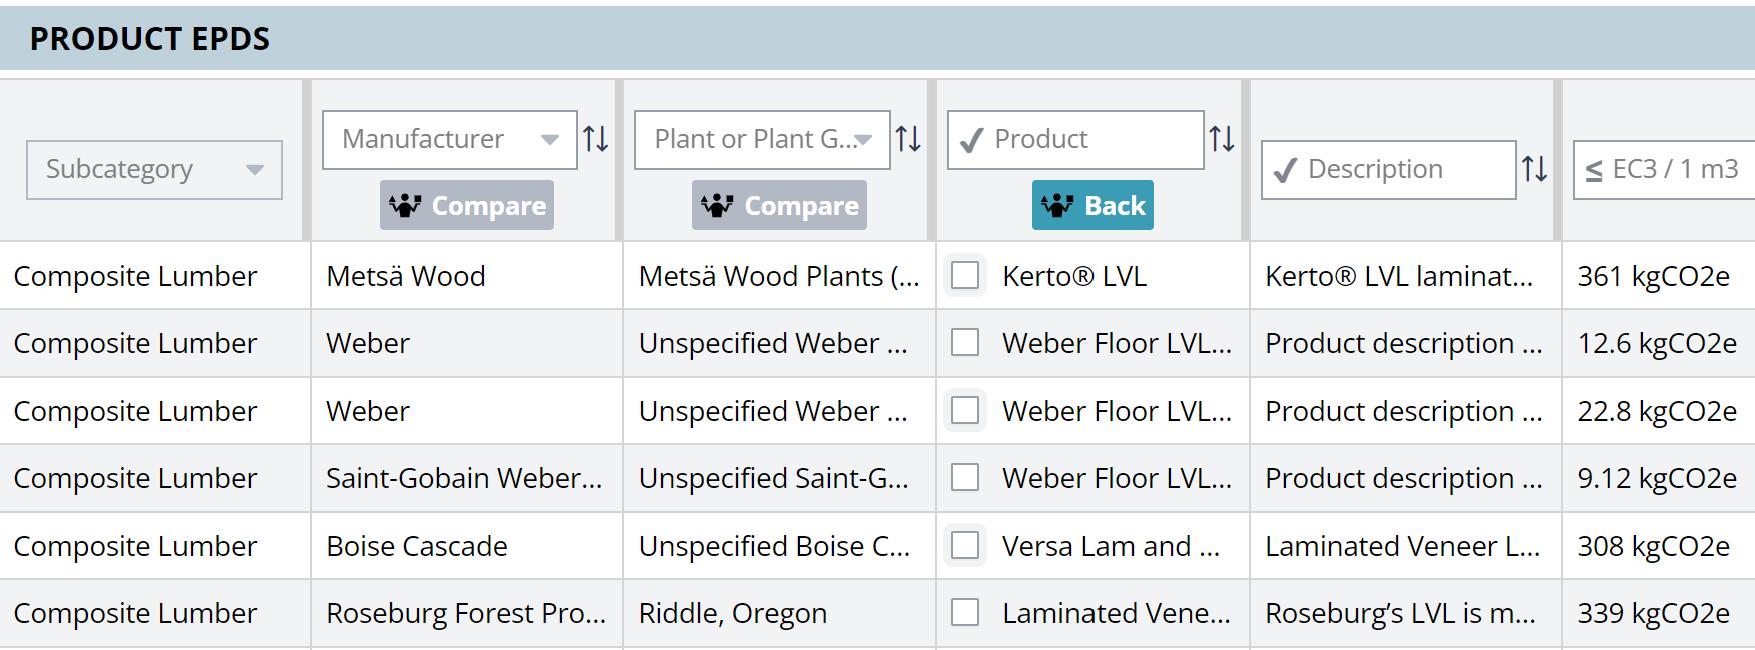
IMAGE 2
IMAGE 1
DESIGN FOR ECONOMY
EPD - FLOOR WOOD
LVL STRUCTURAL WOOD
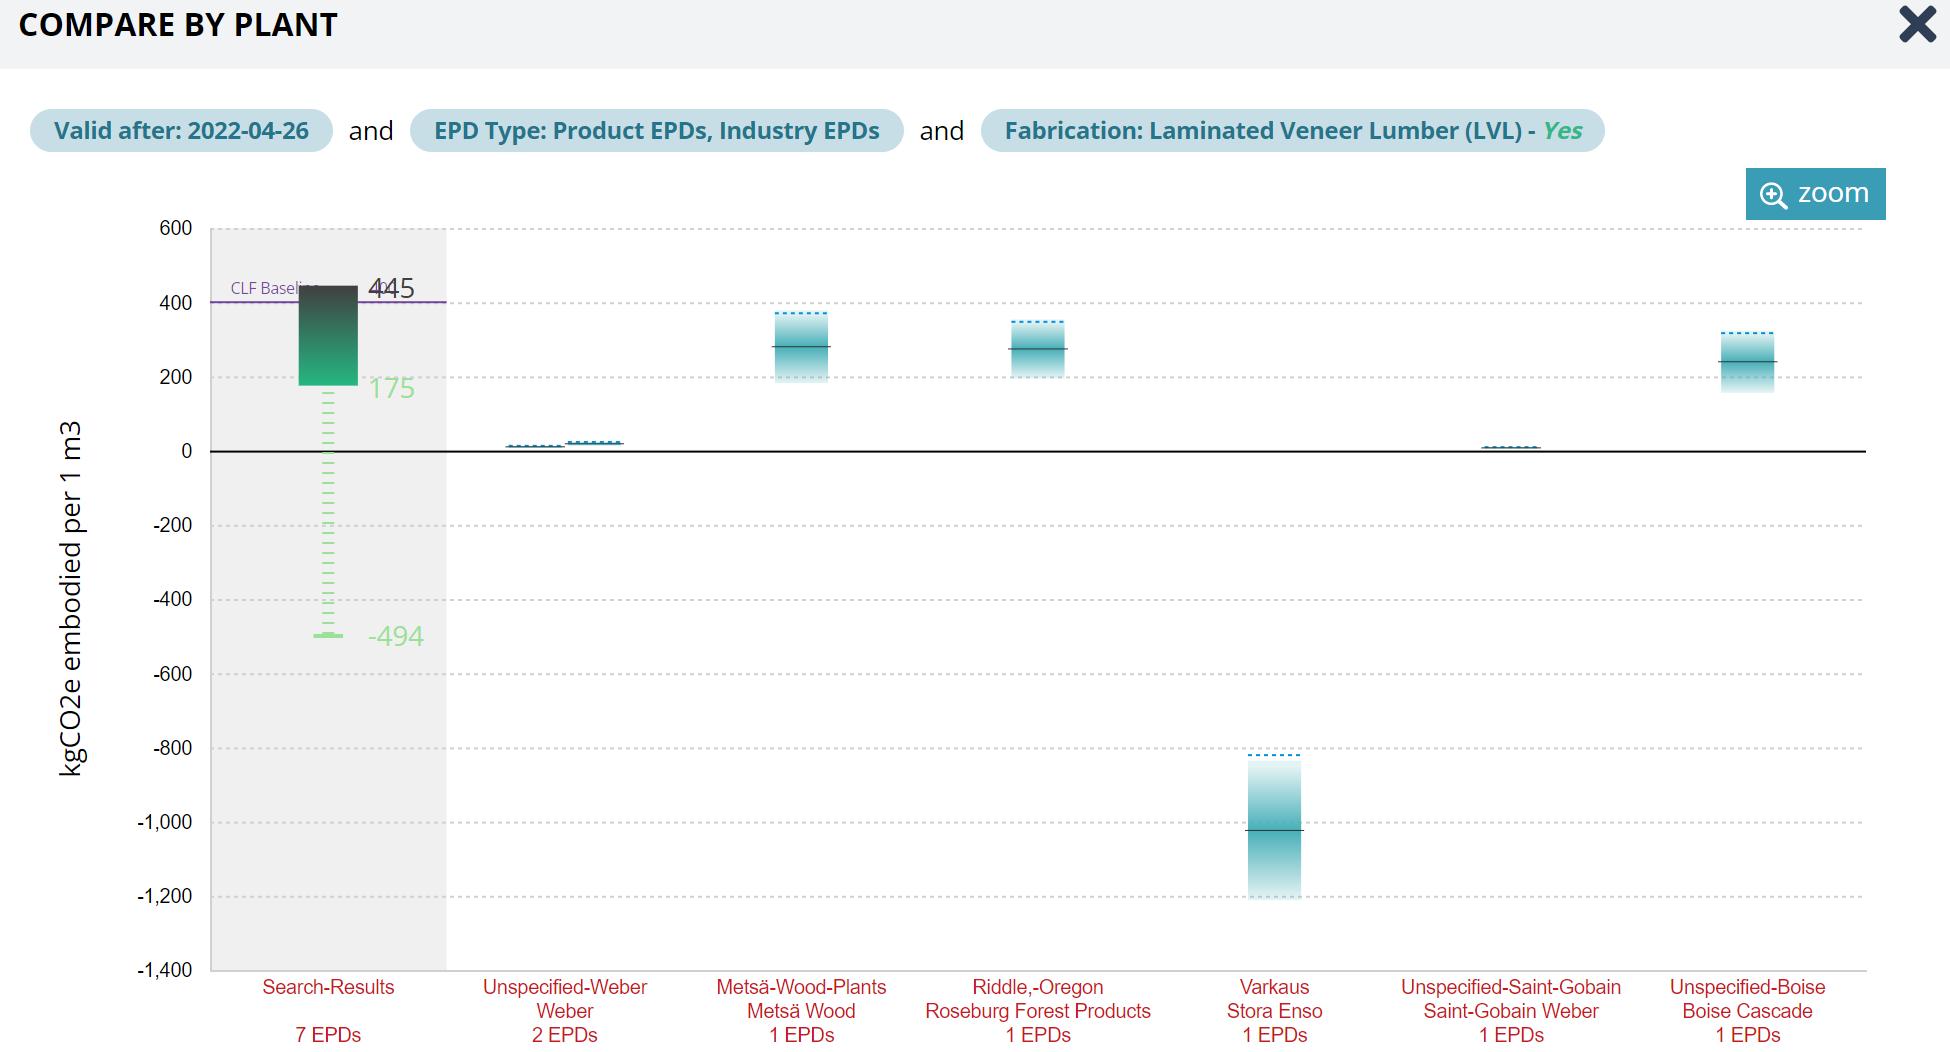
These charts show the comparison of the EPD for Composite Wood Structural Flooring with LVL Wood.
1 - COMPARE BY MANUFACTURER
There are far less EPDs recorded for LVL structural wood to compare by manufacturer, and some with negative embodied carbon. From the chart, the manufacturer with the lowest achievable target for embodied carbon is Stora-Ens at -1000 kgCO2e.
2 - COMPARE BY PLANT
Again after comparing to concrete, the compare by plant chart has far less data available for LVL structural wood, and also features negative embodied carbon options. The plant with the lowest achievable target for embodied carbon is Varkaus at -1000 kgCO2e.
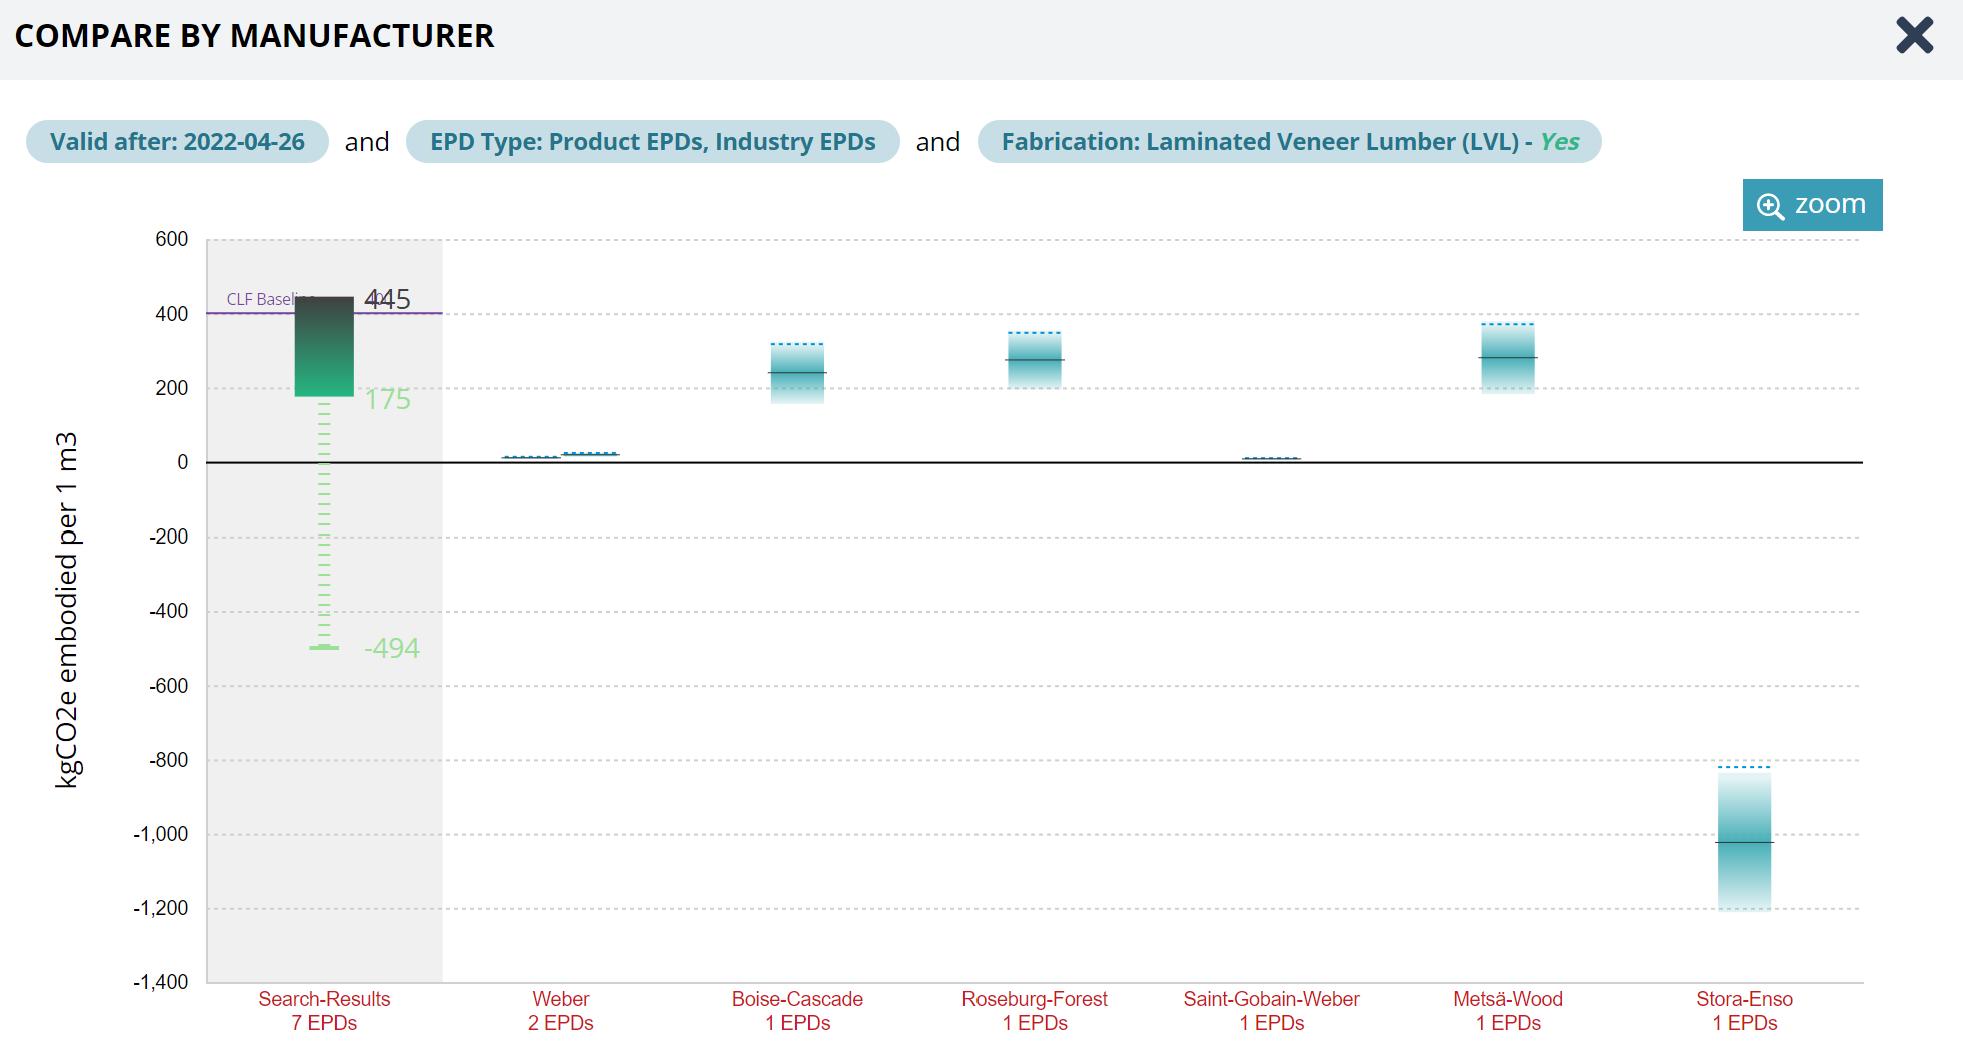
IMAGE 1
IMAGES: Charts created with EC3
DESIGN FOR ECONOMY
PLAN & COMPARE BUILDINGS
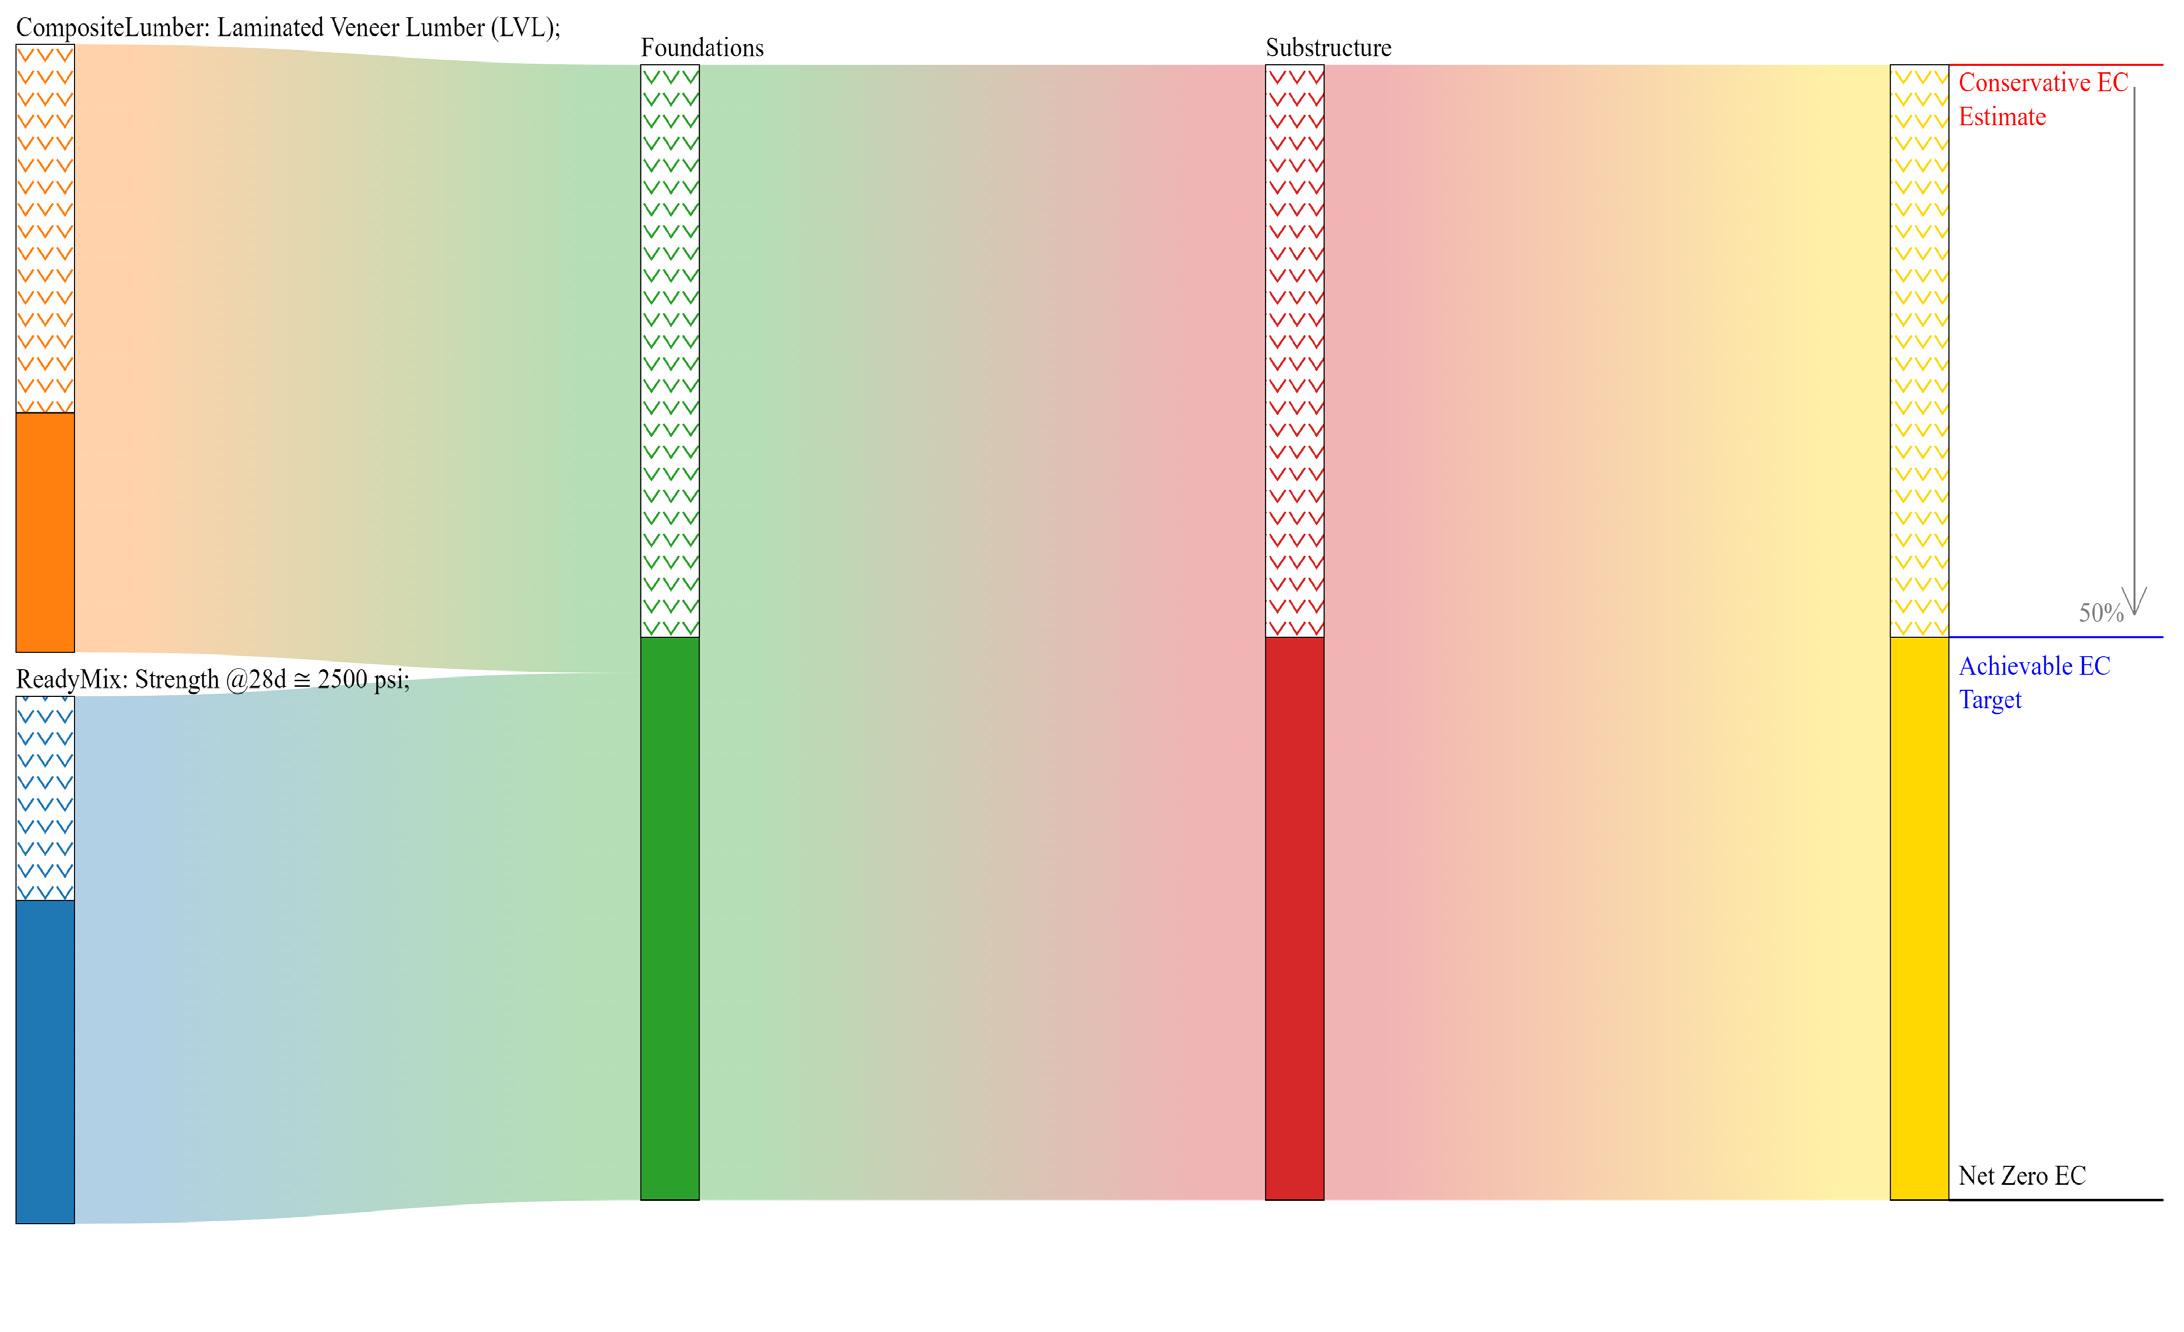
GWP SANKEY DIAGRAM: THE AXIS
The GWP Sankey diagram compares the embodied carbon for both the Floor Concrete and Floor Wood analyzed for the Axis building.
In analyzing the global warming potential Sankey diagram, the cast-in-place concrete begins with a higher global warming potential. Then it is found that the building design saves 50% embodied carbon per the final estimate.
IMAGE: Charts created with EC3
DESIGN FOR ECONOMY
PLAN & COMPARE BUILDINGS
GWP SANKEY DIAGRAM: BT MID-RISE
The GWP Sankey diagram compares the embodied carbon for the materials studied in the BT Residential Mid-Rise Building.
In comparing the concrete and wood materials in the project it is found that the largest area of embodied carbon is from the concrete materials, with wood being a smaller amount. Then it is found that the building design saves 44% embodied carbon per the final estimate, which comes out higher than the Axis estimate.
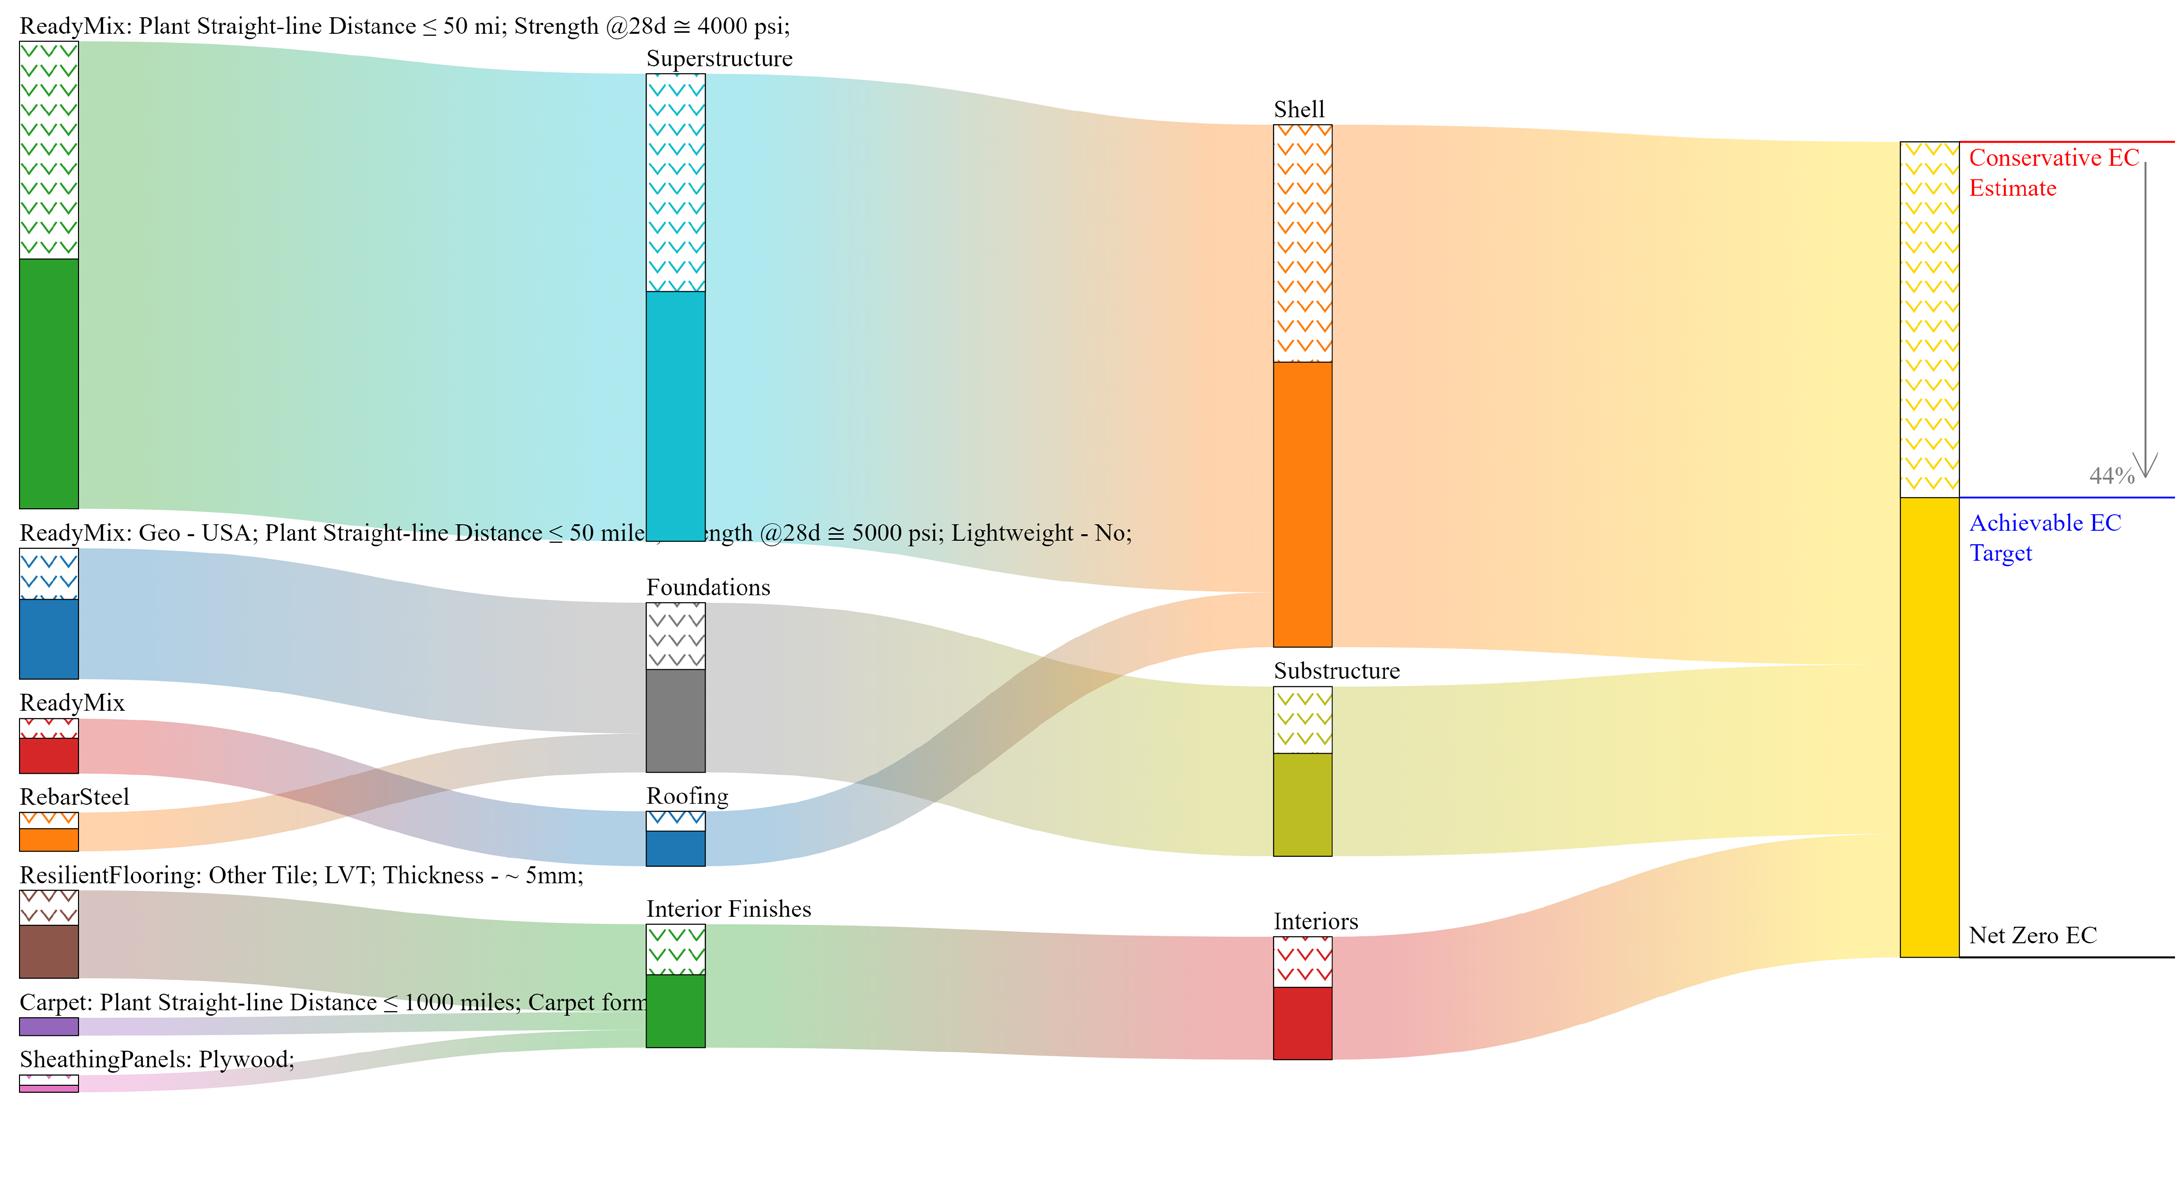
IMAGE: Charts created with EC3
DESIGN FOR ECONOMY
PLAN & COMPARE BUILDINGS
LEED BAR CHART: THE AXIS
This LEED Bar Chart compares the concrete and wood flooring options for the Axis building. In analyzing the chart, both the concrete and wood materials realized embodied carbon amounts align with the CLF baseline of embodied carbon for that material.
Both the concrete and wood products selected could be researched further in order to lower the embodied carbon to the achievable levels shown. Because of this, the overall building total reduction in embodied carbon was reduced by 0%, which could be improved. Also, overall, the wood material showed a higher embodied carbon amount.
LEED BAR CHART: BT MID-RISE
This LEED Bar Chart compares the concrete and wood materials used in the BT Residential Mid-Rise Building. In analyzing the chart, both the concrete and wood materials realized embodied carbon amounts align with the CLF baseline of embodied carbon for that material.
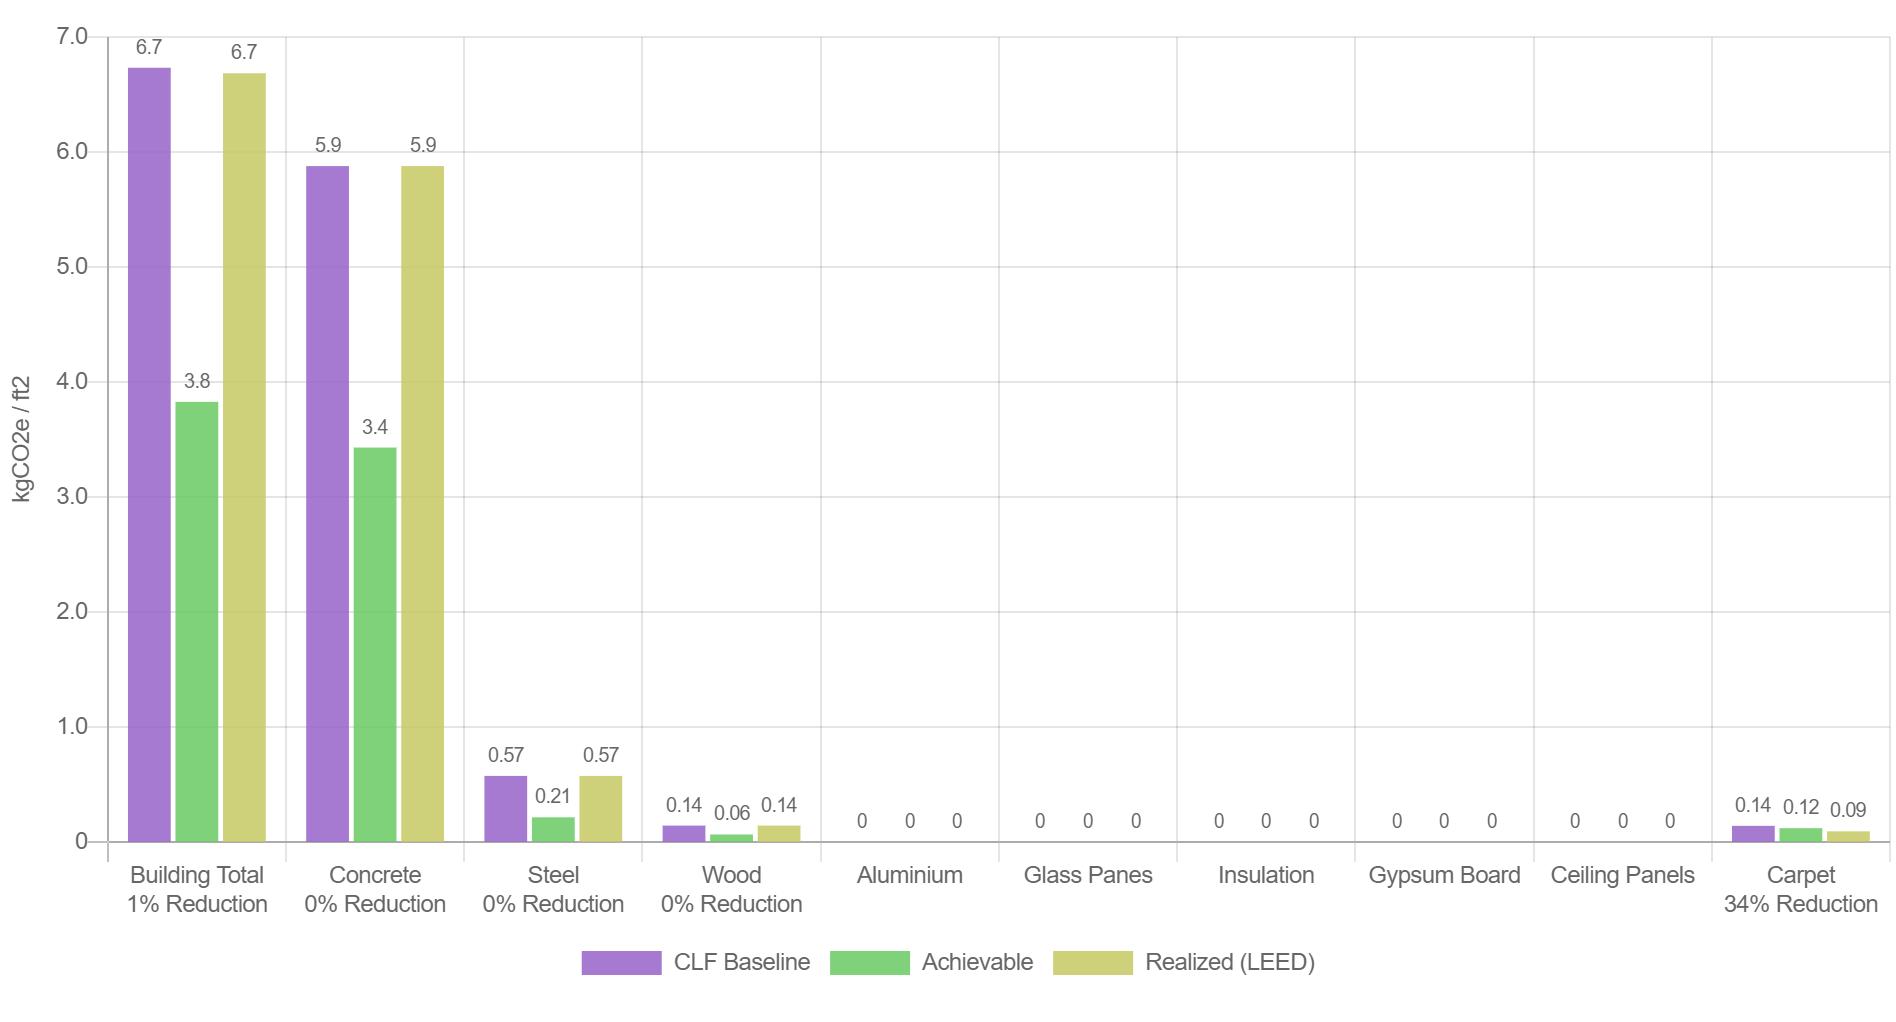
Similar to the Axis chart, both of these materials could be studied further to reselect another option with a lower embodied carbon closer to the achievable range shown. The overall building total reduction was reduced by 1%, which while better then the Axis, could still be lowered. Overall, the concrete material showed the most embodied carbon.

COTE MEASURE 5 - DESIGN FOR ECONOMY
DESIGN FOR ECONOMY ANALYSIS
There were multiple strategies used in the design for economy. Strategies were included to improve the economy at both indoor and outdoor areas.
In-house cleaning equipment was purchased in order to maintain and clean the on-site buildings by the staff, rather than subbing out this work at an added cost per year. There was also special attention shown to the amount of circulation space and how to make it dual purpose through use as waiting and seating areas.
The outdoor park paths were paved with a long-term strategy so that they could be maintained multiple years in between new paving.
Calculators: Enter your values into the yellow cells. Enter non-numerical data into the green cells.
1 - Construction cost benchmark
Benchmark - Building Type Specific
$477.00 / sf Actual construction cost $666.67 / sf
Construction cost reduction from the benchmark -40%
Benchmark Source Ccorpinsights.com/costs-per-square-foot/
2 - Estimated operating cost reduction
Operating and maintenance cost reduction strategies:
From utility savings $324,000.00 / year From cleaning Durability investments $0.50 / year $1.00 / year
Other / year
Other
/ year Total $324,001.50 / year Major Strategy N/A Major Strategy Purchasing property cleaning equipment and completing in-house Major Strategy Long-term paving strategies for park paths Major Strategy Major Strategy
3 - Building space efficiency
Efficiency ratio Benchmark - Building Type Specific Efficiency ratio achieved
Efficiency ratio percent improvement
30% 40%
33%
Benchmark Source www.gsa.gov Major Strategy Dual purpose circulation paths and waiting areas


