





 Spring 2024
Big Dutchman Creek Watershed Plan

Table of Contents
Acknowledgments City of Rock Hill City of Rock Hill David Dickson City Engineer III, Public Works City of Rock Hill P.O. Box 11706 Rock Hill, SC 29731-1706 (803) 329-7096 2 Watershed Analysis Water Quality Classification & Standards Impairments & TMDLS & Watershed Plans E. Coli Description & Monitoring Data Total Nitrogen & Phosphorus Description Hydrologic Impacts 3 Pollutant Sources Summary of Impairments, Causes, Sources & Impacts Septic Systems in the Watershed Nonpoint Sources Within the Watershed Pollutant Loading Estimate 4 Load Reductions Watershed Plan Review 5 Descriptions of Management Measures Summary Objective 1 Measures Objective 2 Measures Objective 3 Measures Pollutant Removal & Implementation Cost Est. 6 Climate Change Temperature Increases Higher Variability in Rainfall Methods for Improving Climate Resiliency 7 Environmental Justice (EJ) Watershed Demographics Environmental Justice Considerations 1 Watershed Overview Watershed Assets Streams & Impoundments Floodplains Riparian Buffers Soils Typography pg. 05 pg. 23 pg. 31 pg. 43 pg. 45 pg. 61 13 References pg. 12 Monitoring Overview Sampling Points Sampling Parameters pg. 89 11 Evaluation Criteria Overview Digital Watershed Dashboard Evaluation Criteria pg. 87 10 Implementation Timeline & Milestones Overview Milestone Timeframe pg. 83 9 Education & Outreach Overview Current Public Perceptions Ten Methods to Make it Fun & Creative Outreach & Education Management Measures pg. 75 8 Financial & Technical Assistance Cost Estimate for Watershed Plan Funding Sources and Partners pg. 71 pg. 61
Introduction The Nine Required Plan Elements The Watershed Planning Process pg. 01 Land Use Water Supplies Population Projections Local Interest This project was funded wholly or in part by the US EPA under a capitalization grant for the Drinking Water State Revolving Fund through the South Carolina Department of Health and Environmental Control

Introduction
Introduction
A watershed is an area of land that channels rainfall and occasionally snowmelt to streams and rivers. All land is part of a watershed, and watersheds do not follow jurisdictional boundaries.
Watersheds play a pivotal role in collecting, filtering, and supplying water to ecosystems and human communities, as shown in Figure 1. Watershed Plans serve as a roadmap to maintain and improve watershed health by providing voluntary recommendations to address known water quality impairments within the watershed. By promoting sustainable land and water management practices, this Watershed Plan seeks to ensure that both natural ecosystems and human communities can thrive and coexist harmoniously, safeguarding our vital water resources for future generations
One of the biggest benefits of creating a Watershed Plan is that it makes the watershed eligible for state and federal grants to address pollution problems in the watershed. One of those funding sources is the Section 319 Nonpoint Source Management Program. These are federal monies that are awarded by the South Carolina Department of Health and Environmental Control (DHEC) to support public education, technical training, and management measures to improve water quality.
The Nine Required Plan Elements

The Watershed Planning Process
In the Big Dutchman Creek Watershed there are many organizations already active and engaged in local water quality issues. Leaders of those organizations were invited to participate as Key Partners on this Watershed Planning process. It would not have been possible to create this Watershed Plan without the assistance of the Key Partners. The Key Partners supported the project in the following ways:
y Creating goals and a schedule for the project;
y Sharing their concerns about the water quality of the watershed;
y Organizing the information into an outline for the document;
y Leading field visits to areas of concern within the watershed; and
y Sharing data that was needed to successfully complete the assessment.
In addition to the input from the Key Partners, input from the public was also sought. The Watershed Planning process was highlighted on a local radio show (Rick Lee, WEHI) and the public was invited to provide input via a digital survey. The information gained from the survey was used to identify key pollution issues, sources and to prioritize management measures.
The Key Partners included the following communities and organizations:
Catawba Nation
Catawba River Keeper
City of Rock Hill
Keep York County Beautiful
Rock Hill Clean and Green
SC Department of Health and Environmental Control (DHEC)
SC Rural Water Association
WRHI FM 100.1
York County
York Soil and Water Conservation District
The Nine Required Elements are displayed below that must be included in a Watershed Plan are determined by the United States Environmental Protection Agency (EPA). In combination, these elements explain the community’s concerns with the watershed, creates a strategy to address those concerns, and includes a plan to monitor progress.
A.
Identify causes of impairment and pollution sources
B. C. D.
Estimate load reductions expected from management measures
Describe management measures to be implemented
Estimate technical and financial assistance needed
E.
Include informational and educational components
F. G. H. I.
Create a schedule for implementation of management measures
Describe the interim measurable milestones
Determine criteria to measure success
Create a monitoring plan
All the management measures presented in a Watershed Plan are strictly voluntary.

Thank you DHEC for your assistance and expertise in the development of this Watershed Plan.
DUTCHMAN CREEK WATERSHED RESTORATION PLAN INTRODUCTION 2 1
Figure 1. Diagram of a watershed (University of Maryland)
Figure 2. Photo of completed stream restoration (McAdams)
Key Terms
The following key terms are used throughout this document and will be helpful for the reader to understand.
y BMPs are structural, vegetative or managerial practices used to treat, prevent or reduce water pollution.
y Detention Basins are structural BMPs that capture stormwater runoff to reduce flooding and remove pollutants before discharging it at a controlled rate until they are completely drained. Detention basins are designed to be dry between storm events and thus are also called “dry ponds.”
y E. coli is the shorter name for the Escherichia coli bacteria. This bacteria is found in the fecal matter of humans and animals, and can cause illness.
y Floodplains are the low-lying areas that surround rivers and other waterbodies that naturally flood on a frequent basis.
y Impoundments are manmade or naturally occurring standing waterbodies, often produced by dams on streams or rivers.
y Infiltration is the process by which water moves from the surface into the ground. Infiltration is one of the most effective methods for improving water quality and reducing water quantity.
y Impaired Waters are waters listed on the 303(d) list because they do not currently meet State water quality standards after application of required controls for point and nonpoint source pollutants (DHEC, 2022).
y Intermittent Streams are streams that have flowing water during certain times of the year, when groundwater and/or precipitation provides water for stream flow.
y Perennial Streams are streams that have flowing water year-round during a typical year.
y Pollutant Loading is the measure of how much of a particular pollutant reaches a waterbody in a unit of time. For example, the pollutant load may be expressed as pounds of pollutant per day or as tons of pollutant per year.
y Retention Basins are structural BMPs that capture stormwater runoff to reduce flooding and remove pollutants before discharging it at a controlled rate. Retention basins are designed to permanently hold water between storm events and thus are also called “wet ponds.”
y Riparian Buffers are areas adjacent to streams, lakes, and wetlands containing trees, shrubs, and other plants.
y Runoff is water from precipitation events that flows over surfaces such as the ground, rooftops, or pavement.
y Stormwater is any liquid precipitation, such as rain or snow.
y Total Nitrogen includes nitrite (NO2), nitrate (NO3), ammonia (NH3), and organic nitrogen.
y Total Phosphorus includes both dissolved phosphorus and particulate forms.
y Watersheds are areas of land where all stormwater runoff flows to a common waterbody. Watersheds may be comprised of smaller “sub-watersheds.”
y Wetlands are areas where the water table is usually at or near the surface or the land is covered by shallow water.
DUTCHMAN CREEK WATERSHED RESTORATION PLAN INTRODUCTION 4 3
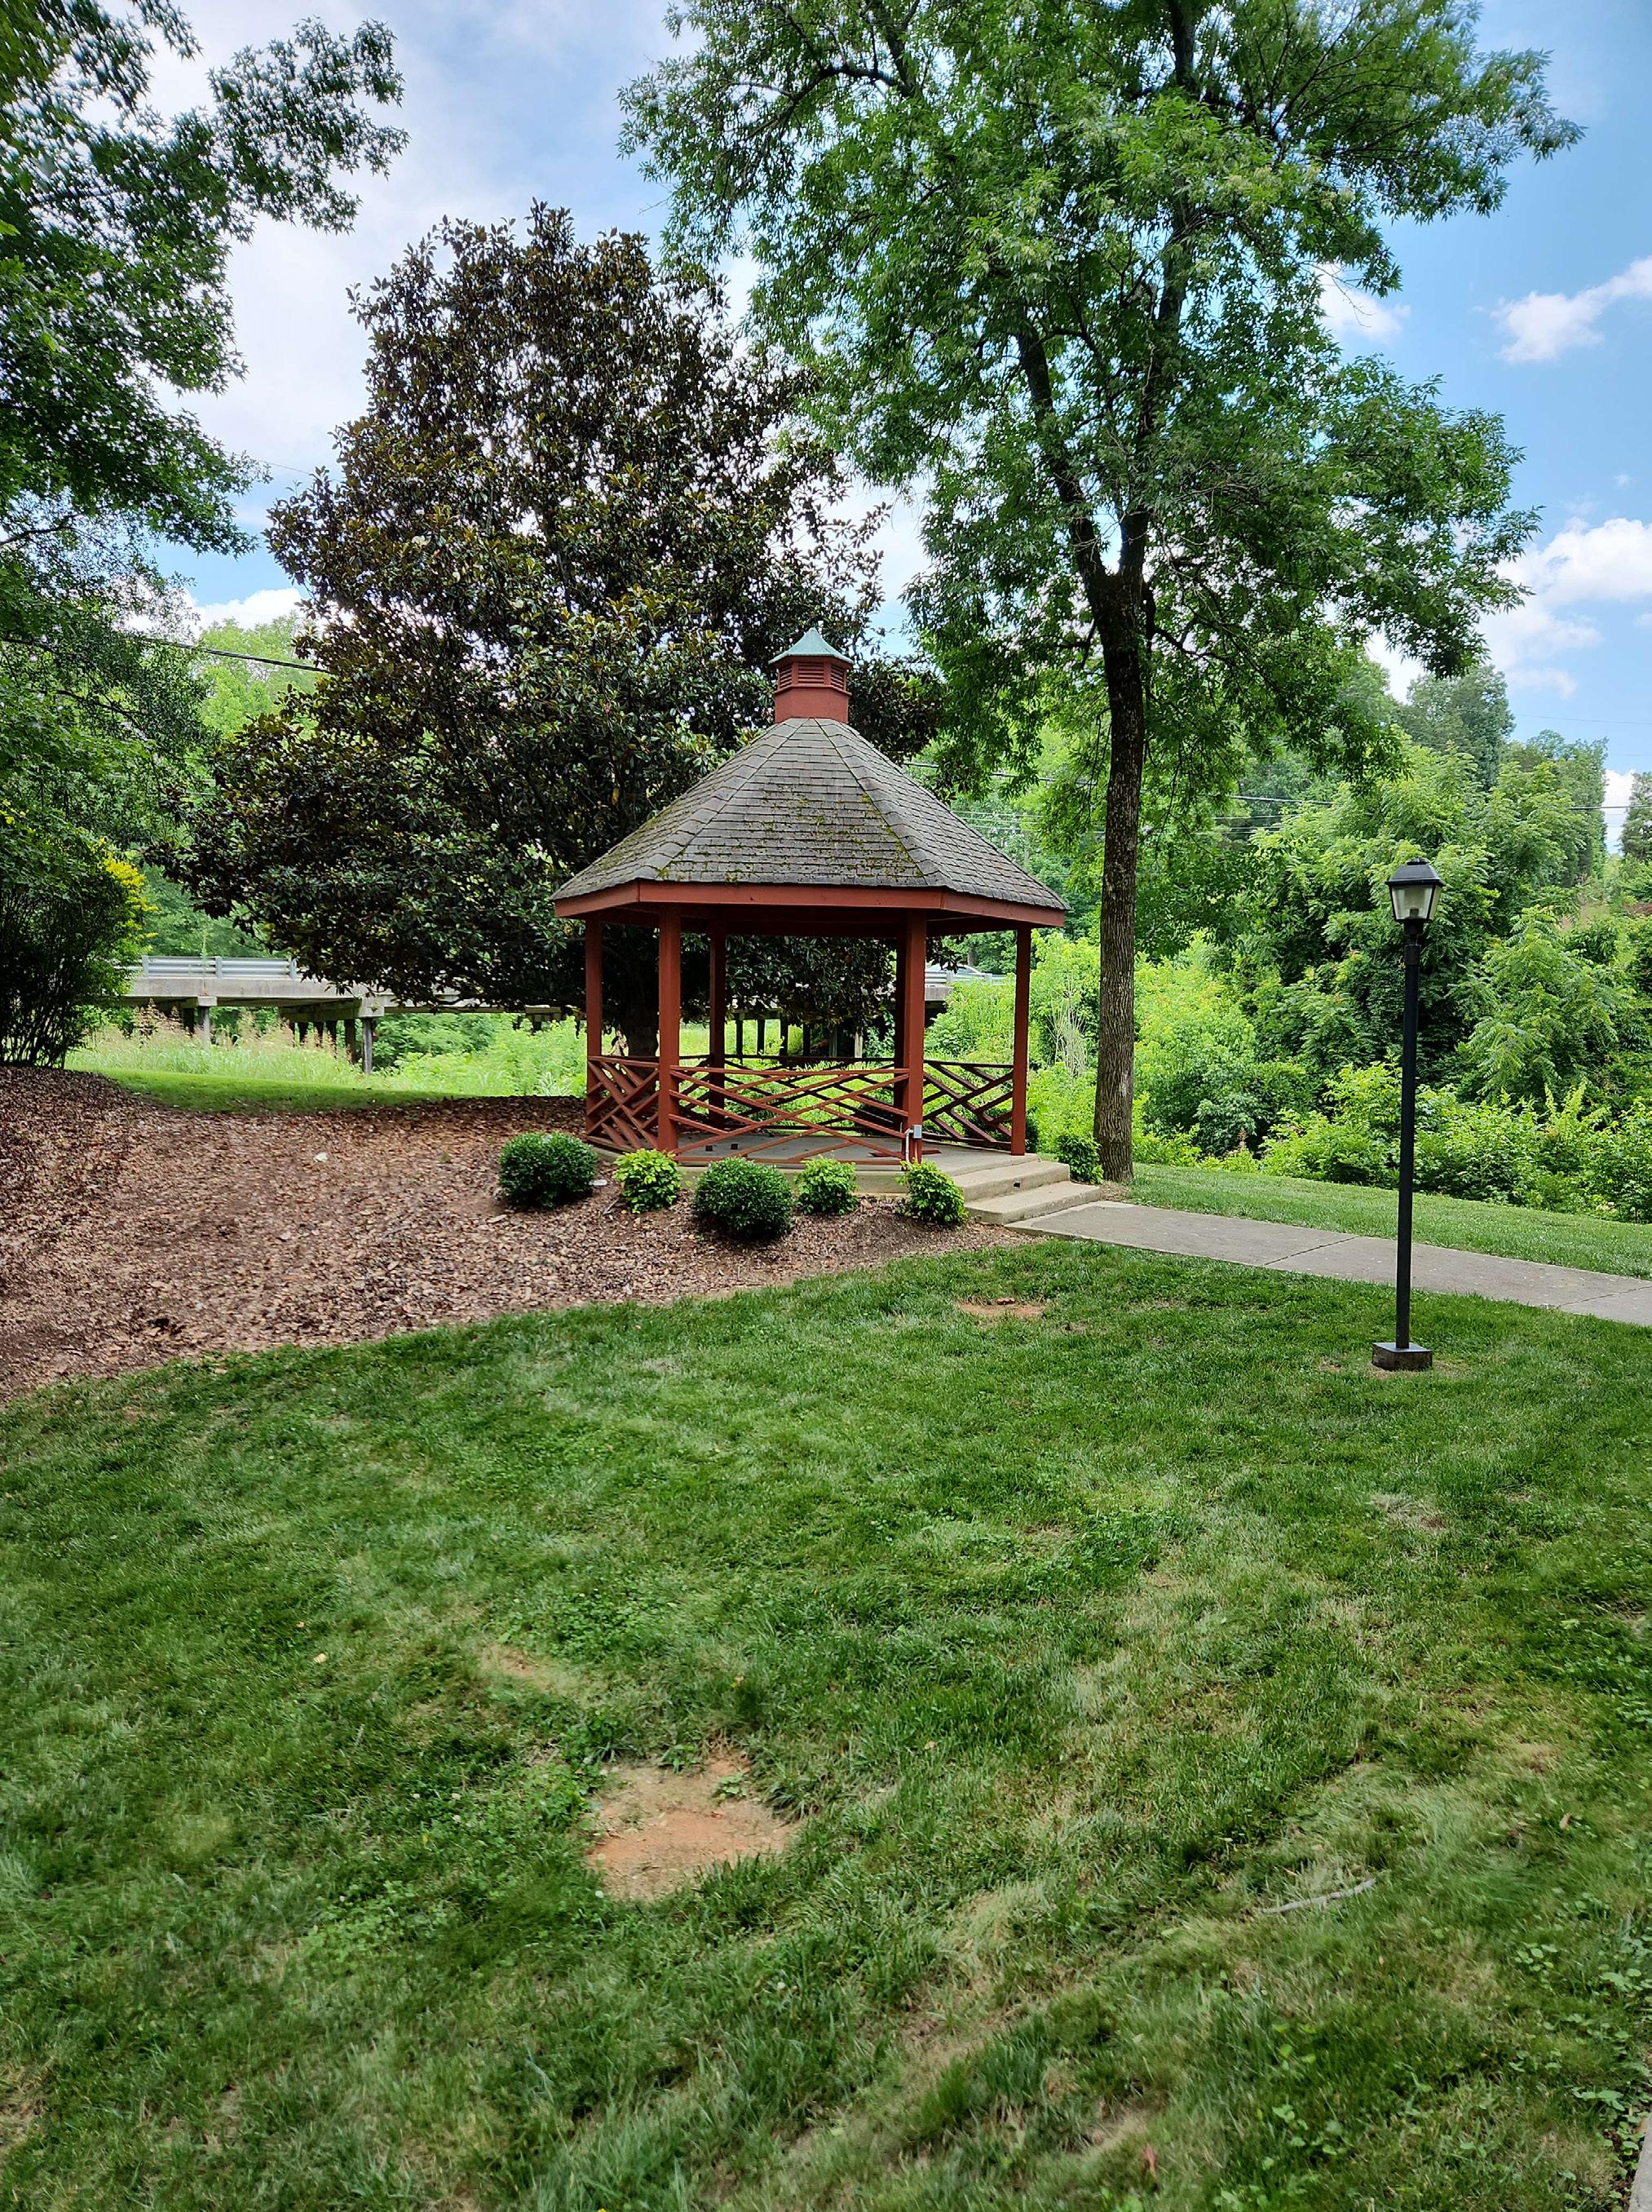
Figure 3. Gazebo overlooks the Big Dutchman Creek as it flows into the Catawba River (McAdams)

1 Watershed Overview

Watershed Overview
The Big Dutchman Creek Watershed has many assets that are important to the quality of life, economy, and environment of Rock Hill and the surrounding communities.
Watershed Assets
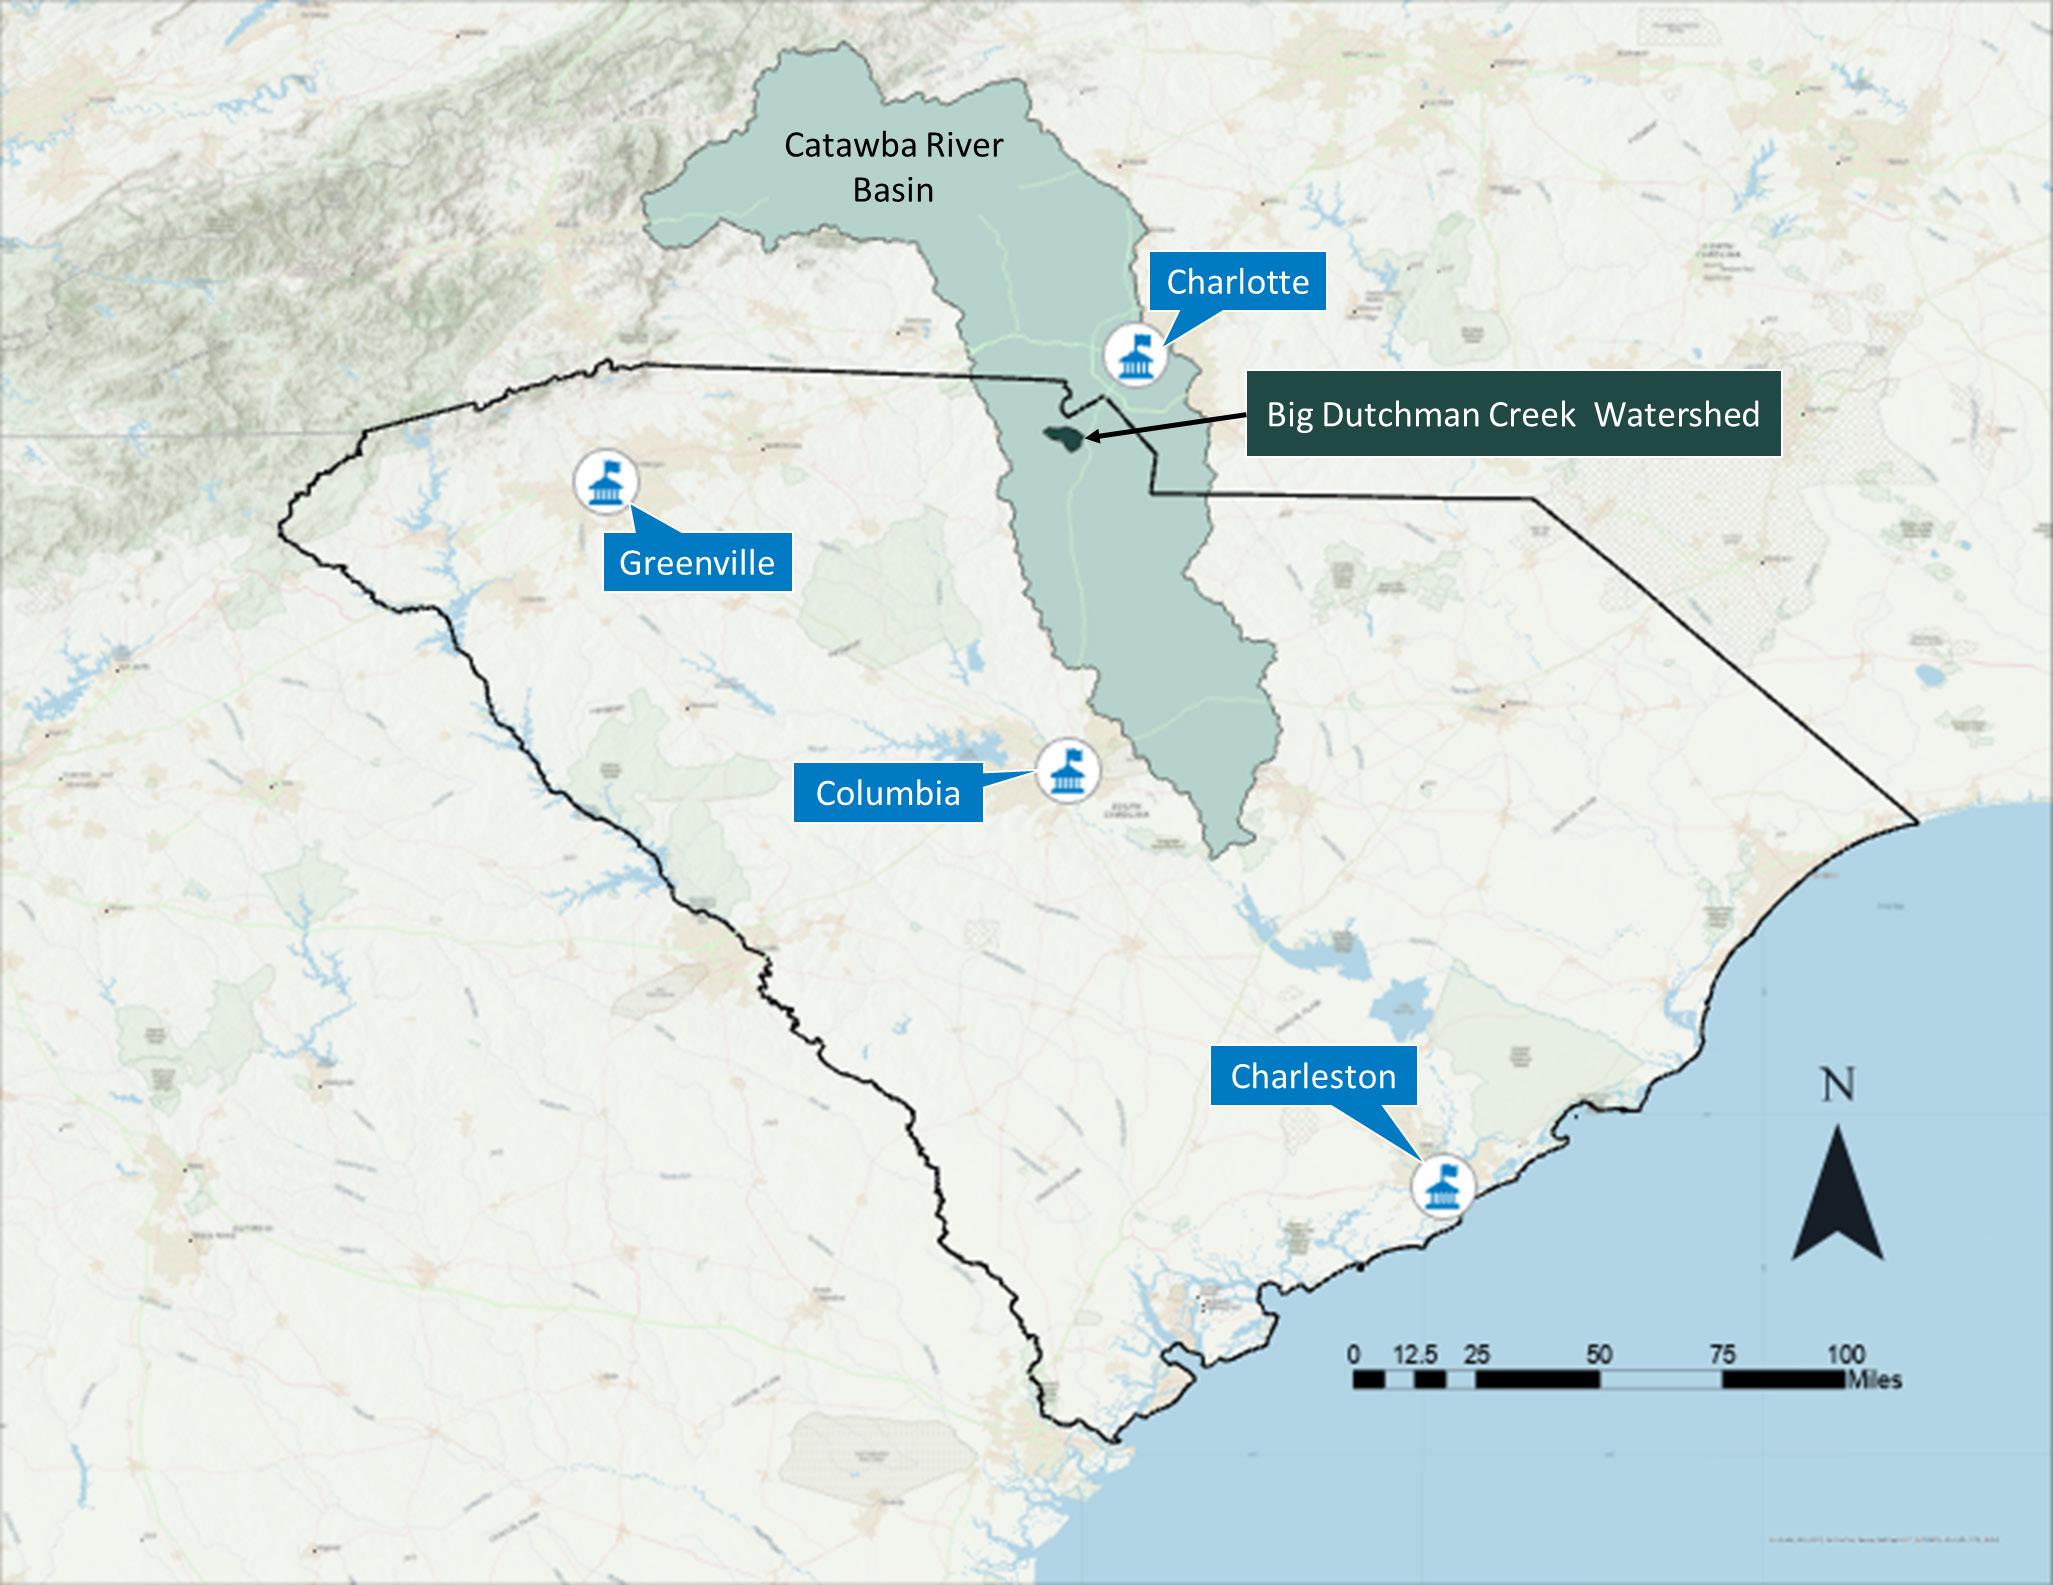
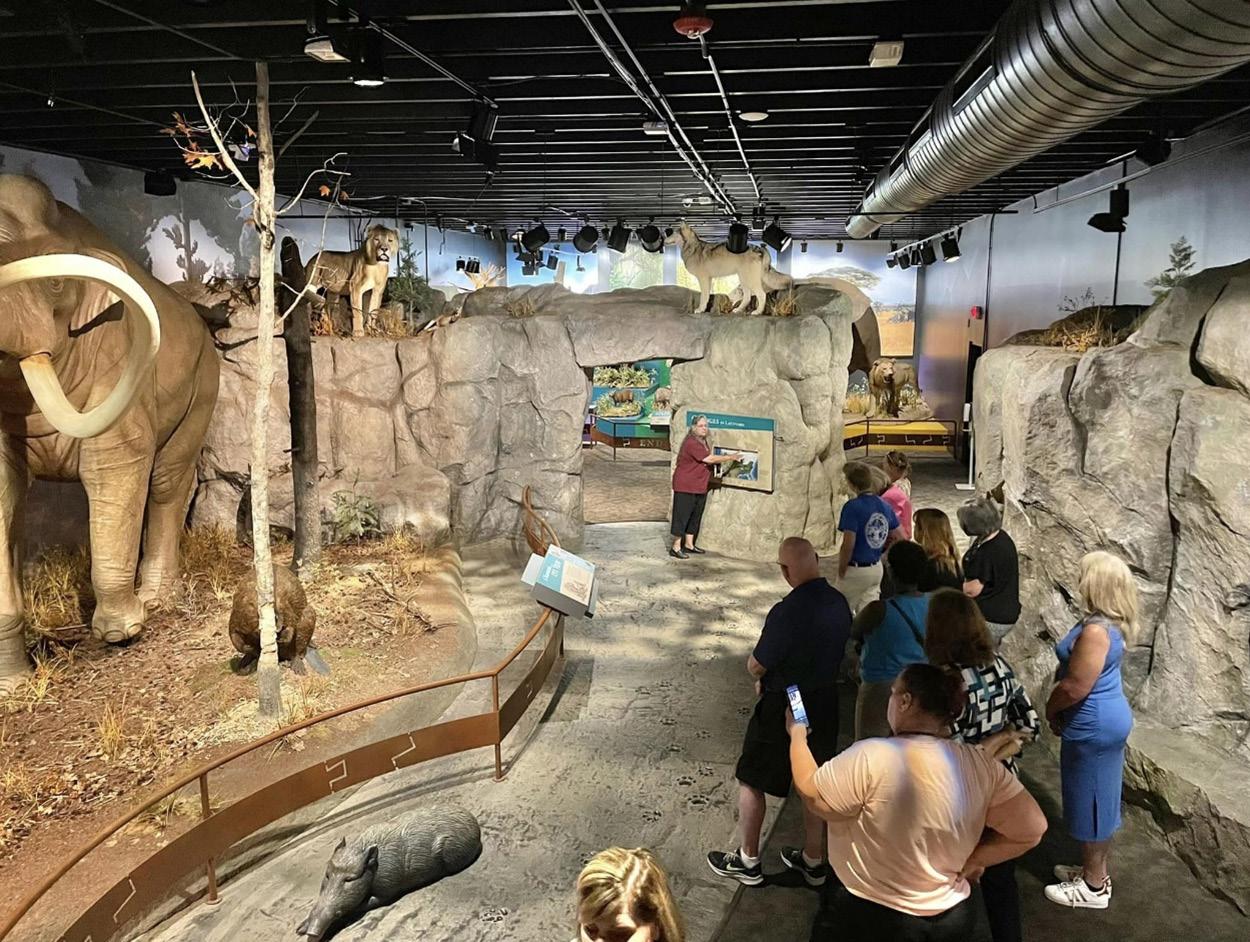
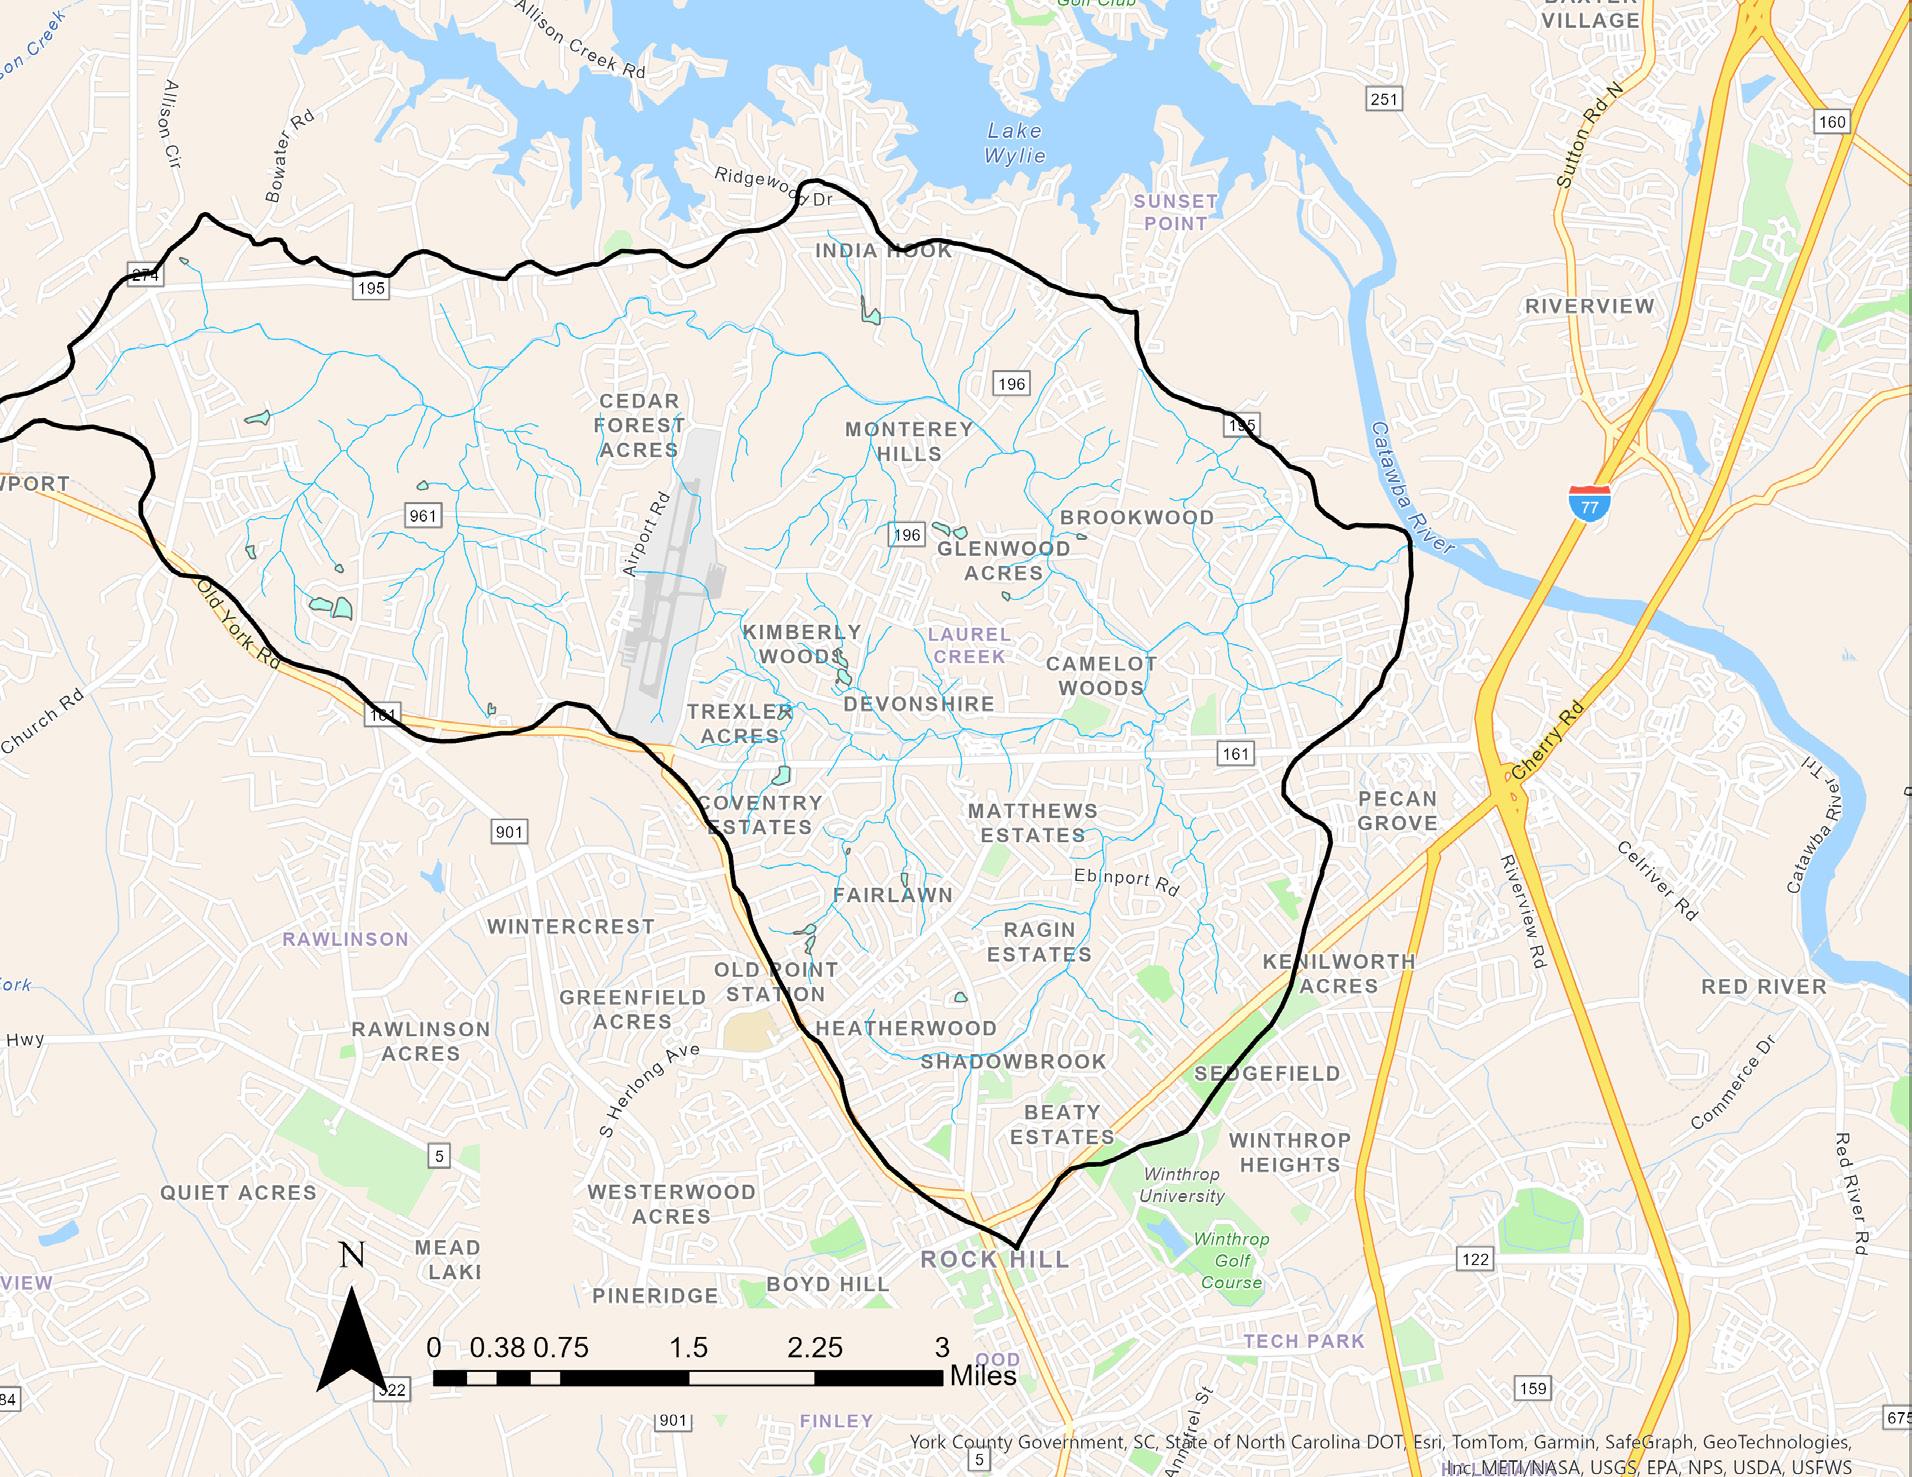
The Big Dutchman Creek Watershed is home to approximately 28,000 people, and most of the land is devoted to providing housing, parks, medical offices, and businesses to support its residents and visitors. The watershed also includes the York County airport and the Museum of York County,shown in Figure 1.2, has exhibits, a naturalist center, trails and a planetarium. Bike trails and parks, like those shown in Figure 1.3 and 1.4, enable people to enjoy the natural amenities of the area on foot or bicycle. This watershed is part of the Charlotte metropolitan area, and thus offers a wide variety of employment, academic, and entertainment opportunities to people who live here. The watershed’s location relative to major cities is shown in Figure 1.1.
Key Watershed Facts
HUC 030501030601
57 miles of streams
11,360 acres of land
Watershed is within the City of Rock Hill and York County Jurisdictions
Elevation ranges from 492 ft to 724 ft


DUTCHMAN CREEK WATERSHED RESTORATION PLAN WATERSHED OVERVIEW 6 5
Figure 1.4 Piedmont Medical Center trail (Carolina Thread Trail 2023)
Figure 1.2 York County 101 Citizens Academy hosted at the Museum of York County (Museum of York County
Figure 1.3 Piedmont Medical Center trail (Carolina Thread Trail 2023)
Figure 1.1 Watershed location
Streams & Impoundments
The Big Dutchman Creek Watershed contains approximately 57 miles of streams and 33.1 acres of impoundments. As water moves through the watershed, it collects to form waterways such as intermittent streams, perennial streams, and impoundments. Figure 1.5 shows an perennial stream within the watershed and Figure 1.6 shows an example of an intermittent stream. This flowing water can also pick up pollutants from the land and carry those pollutants into and through the waterways. There are two main streams in the watershed: Big Dutchman Creek and Little Dutchman Creek. These streams join in the eastern part of the watershed and eventually drain to the Catawba River.


There are nearly three times more miles of intermittent streams than perennial streams in the watershed, as shown in Figure 1.7. Even though intermittent streams typically flow for only part of the year, they provide food and habitat for many types of animals. Some of the intermittent streams have been piped under areas of development in the locations where they appear disconnected on the adjacent map (Figure 1.8).
The impoundments shown on the map consist of lakes, ponds and wetlands. Those features are spread evenly throughout the watershed. Although impoundments can be helpful in controlling flooding, they can alter the natural flow regime of streams when they are placed “on-line,” or directly in the stream channel. Online impoundments can cause sediment to build up in stream channels and degrade the habitat of aquatic animals.


DUTCHMAN CREEK WATERSHED RESTORATION PLAN WATERSHED OVERVIEW 8 7
Figure 1.7 Stream miles by type in watershed
Figure 1.5 A perennial stream in the Big Dutchman Creek Watershed (McAdams)
Figure 1.8 Streams and impoundments in watershed Perennial and Intermittent Stream Miles
Figure 1.6 An intermittent stream (Army Corps of Engineers)
Floodplains
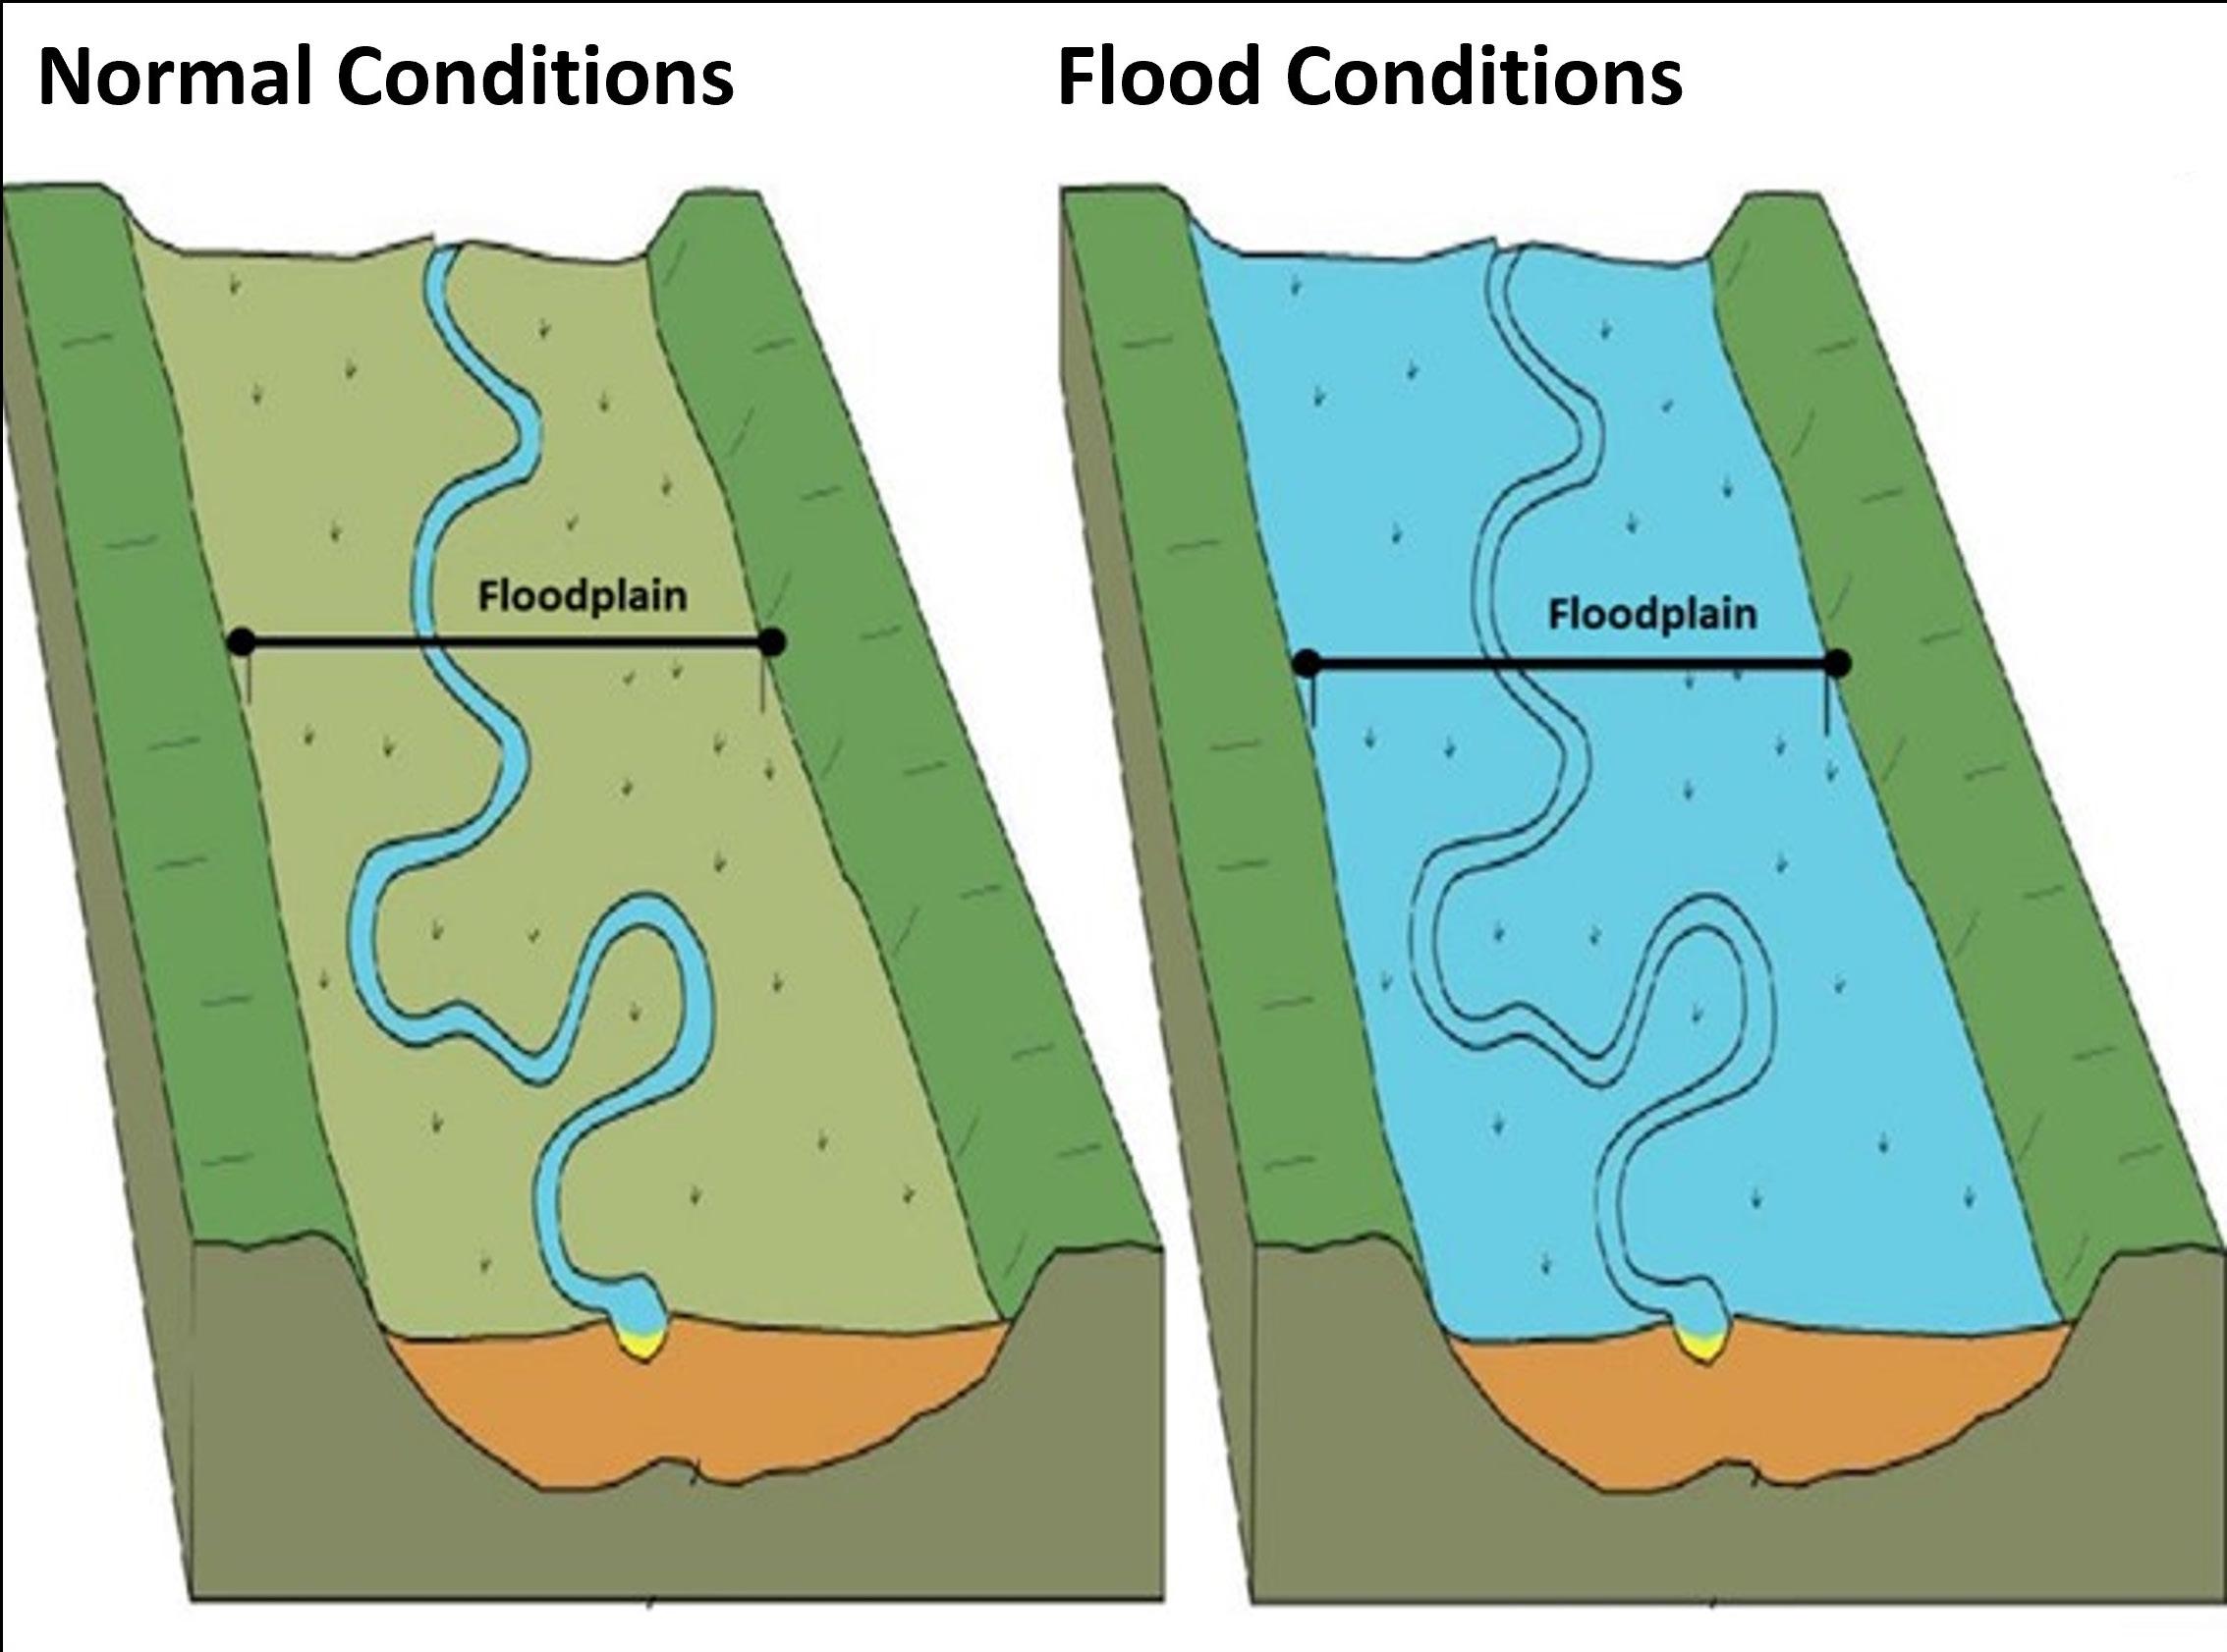
Floodplains are the low-lying areas that surround rivers and other waterbodies that naturally flood on a frequent basis, as shown in Figure 1.9. Floodplains are important to a healthy environment because they provide clean water and wildlife habitat. If left undisturbed, floodplains protect citizens from flooding by storing large volumes of stormwater and releasing it slowly over time. The Big Dutchman Creek floodplain becomes much wider where Big Dutchman Creek and Little Dutchman Creek join and remains wide until Big Dutchman Creek discharges into the Catawba River.
The Federal Emergency Management Agency (FEMA) categorizes floodplains to reflect the frequency of flooding. FEMA Flood Zone categories are summarized in Figure 1.10. Floodplains within the watershed are shown in Figure 1.11.

DUTCHMAN CREEK WATERSHED RESTORATION PLAN WATERSHED OVERVIEW 10 9
Flood Zone Risk Level Description 100-Year High Areas with a 1% chance of flooding in any given year and a 26% chance of flooding over the life of a 30year mortgage. 500-Year Moderate to Low Areas with a 0.2% chance of flooding in any given year
Figure 1.9 Floodplain storing water after a large storm event (City of Austin, Texas)
Figure 1.10 Table summarizing FEMA Flood Zones (FEMA 2020)
Figure 1.11 Floodplains in watershed
Riparian Buffers
A riparian buffer is a protected area adjacent to a stream, lake, or wetland containing trees, shrubs, and other plants. Riparian buffers, particularly forested buffers adjacent to headwater streams, deliver tremendous benefits, as summarized in Figure 1.12. In a riparian buffer, stormwater and water in the stream interact with soil, plant roots, insects, and other living things that together remove pollutants such as nutrients and harmful bacteria (Klapproth 2009). Fortunately, all the jurisdictions within this watershed require some protection of riparian buffers. Jurisdictional protections are summarized in Figure 1.13 and shown in Figure 1.14. The benefits of riparian buffers are explained in the figures below.


Figure 1.13 Table summarizing riparian buffer width requirements
•
•


Riparian Buffers
Rock Hill and York County allow some limited activities to balance access to water resources and protection of buffer function. Examples of these uses include:
y Maintaining existing structures;

y Planting additional trees, shrubs, and native plants;
y Removing large debris;
Big Dutchman Creek
y Stabilizing the shoreline (with approval)

y Installing water-dependent structures such as docks (with approval); and
y Installing paths or stairs to water-dependent structures (with limitations on width/area and approval)
DUTCHMAN CREEK WATERSHED RESTORATION PLAN WATERSHED OVERVIEW 12 11
Figure 1.12 Diagram of riparian buffer benefits (Highland)
Figure 1.14 Stream buffer limits in watershed
covers riparian buffer protection on
343-340 of the
of
Jurisdiction Waterbody Type Width (Feet) Notes Rock Hill Catawba River 125 • 100’ undisturbed, 25’ transition zone • Will span the entire floodplain instead if it is wider than 125’ Rock Hill Perennial Stream 75
50’ undisturbed, 25’ transition zone
Rock Hill requires riparian buffer protection in Section 8.4 of the Rock Hill Zoning Ordinance York County
pages
York County, Chapter 155 Code
Ordinances
•
Will span the entire floodplain if it is wider than 75’ Rock Hill Intermittent Streams, Wetlands & Ponds 50
40’ undisturbed, 10’ transition zone
Co. Catawba River 100
Co. Perennial Stream 50
York
York
N 0 1 2 0.5 Mi. York County, SC
Watershed Boundary
125-Foot or Floodplain Buffer 75-Foot Buffer 50-Foot Buffer
Rock Hill City Limits
N
Wetlands
The USGS defines wetlands as transitional areas where water is frequently present either just above or below the land surface. Emergent wetlands are dominated by perennial plants that are water-loving and have vegetation present for most of the growing season in most years (Figure 1.15). Forest/shrub wetlands have at least 30% areal coverage of trees and shrubs, and vegetation is present all year but will lose its leaves during the winter (Figure 1.16).
The data to support this watershed assessment was gathered from the Wetlands Mapper, which is maintained by the National Wetlands Inventory Program (under the U.S. Fish and Wildlife Service). Wetlands comprise a total of approximately 66 acres, or 5.7% of the total watershed land area, as shown in Figure 1.17 and 1.18.
Although this is a small percentage of the watershed’s overall land area, their contribution is significant because they:
y Provide a home and a food source to a diverse array of microbes, plants, insects, amphibians, reptiles, birds, fish and mammals;
y Prevent flooding by storing stormwater during large rain events; and
y Moderate both local and global temperatures.


DUTCHMAN CREEK WATERSHED RESTORATION PLAN WATERSHED OVERVIEW 14 13
6.2 59.4 65.6 0 20 40 60 80 Freshwater Emergent Wetland Forested/Shrub Wetland Total
Figure 1.15 An emergent wetland (US Department of Agriculture)
Figure 1.18 Wetlands in watershed
Figure 1.16 A forested wetland (NC Wetlands)
Figure 1.17 Chart showing wetland types in watershed
Wetlands in Watershed (acres)
N
Soils
The USDA groups soils into four hydrologic soil groups (HSGs). HSG A soils are sandier and tend to soak rainwater into the ground rather than producing stormwater runoff. HSG D soils, on the other hand, have more clay particles and do not soak up as much stormwater, and thus produce a high amount of stormwater. A summary of HSGs is provided in Figure 1.19. Highly urban areas are sometimes not classified by the USDA, but often act like HSG D soils due to the soil disturbance and compaction that occur during the construction process.
Soils in the watershed are 47% urban unclassified, which is assumed as HSG D. Another 23% of the soils are classified as D, as shown in Figures 1.20 and 1.21. Therefore, a total of 71% of soils in the watershed have high runoff potential and low infiltration rates, resulting in large volumes and high rates of stormwater runoff. This can compromise the functioning of septic systems and make it difficult to implement stormwater BMPs that rely on infiltration to function, effectively such as permeable pavement..
HSG Runoff Implications Soil Properties
A Low runoff, high infiltration
B Moderately low runoff, moderately high infiltration
C Moderately high runoff, moderately low infiltration
D High runoff, low infiltration
D Assumed Assumed high runoff, low infiltration
Less than 10% clay & more than 90% sand or gravel
10-20% clay & 50-90% sand
20-40% clay & less than 50% sand
More than 40% clay & less than 50% sand
Highly disturbed & compacted from development


DUTCHMAN CREEK WATERSHED RESTORATION PLAN WATERSHED OVERVIEW 16 15
Figure 1.19 Table showing properties of Hydrologic Soil Groups
Figure 1.20 Chart showing soils in watershed
Figure 1.21 Soils in watershed
Soils in Watershed (acres)
Topography
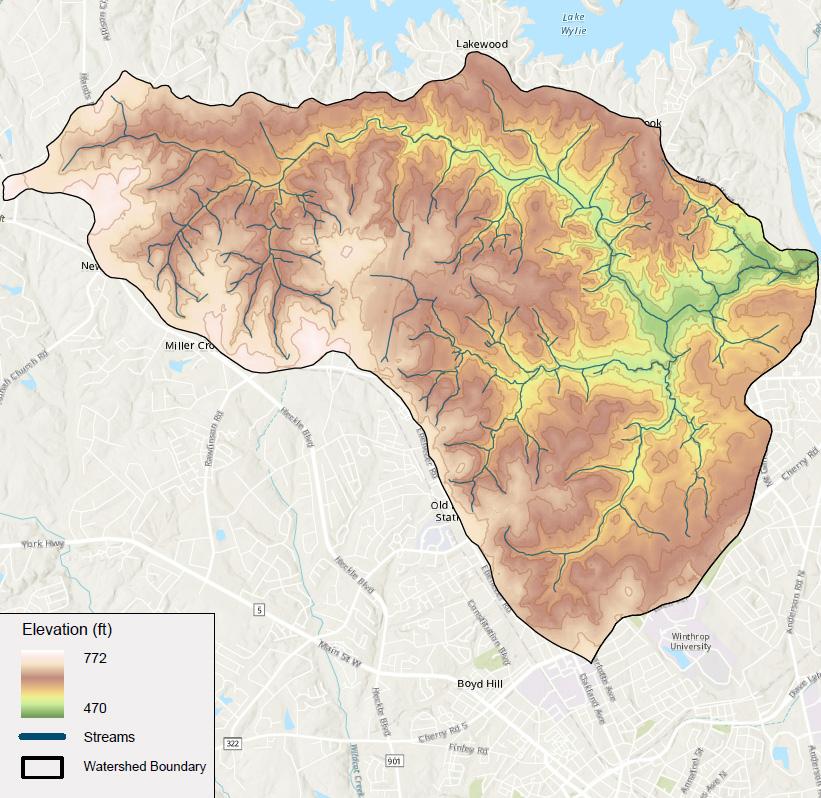
Topography plays a crucial role in a watershed because water always flows downhill. The perimeter of a watershed typically contains the highest elevation in the watershed; in fact, a watershed boundary is a ridge that separates one watershed from another. Topographic maps use elevation contour lines or color scales to illustrate the shape of the Earth’s surface and usually contain additional geographic features such as roads, rivers, streams, lakes, and jurisdictional boundaries.
In the Big Dutchman Creek Watershed, elevations range between 492 feet to 724 feet above sea level. Figure 1.22 shows that the highest elevations are around the watershed boundary and the lowest are near the watershed outlet to the Catawba River. Overall, the terrain in the watershed is rolling hills. Where Big Dutchman Creek and Little Dutchman Creek join, the floodplain becomes much wider and remains wide until Big Dutchman Creek discharges into the Catawba River.
Land Use
The amount of runoff and types of pollutants generated in a watershed often correspond to land use. Approximately 90% of the watershed is developed, with the remaining 10% forested or undeveloped. Nearly 60% of the land in the Big Dutchman Creek Watershed is comprised of residential development, most of which is single-family residences. These features can be seen in the aerial image of the watershed below (Figure 1.23). Some of the notable non-residential land uses in the watershed include:
y Rock Hill-York County Airport;
y Northwoods Square Shopping Center;
y Dutchman Creek Middle School;
y Mount Gallant Elementary School;
y Piedmont Medical Center; and
y Rolling Hills Nursery and Landscaping.
The watershed also contains several parks, including Cherry Park, Oakwood Acres, Hargett, Fewell, and Boyd Hill Recreation Center, all in the southeastern portion of the watershed.

DUTCHMAN CREEK WATERSHED RESTORATION PLAN WATERSHED OVERVIEW 18 17
Figure 1.22 Topography in watershed
Figure 1.23 Aerial image of watershed
N N
Water Supplies
The City of Rock Hill water system and wells are the sources of drinking water within the watershed. Drinking water is withdrawn from Lake Wylie and treated by the City of Rock Hill Water Treatment Plant to remove sediment, bacteria, and other contaminates before being made available for public consumption. This treatment processes results in water that exceeds DHEC and EPA quality standards. The Lake Wylie water intake is upstream of where the Big Dutchman Creek Watershed flows into the Catawba River, so activities within the watershed will not impact this drinking water source.
However, there is another water intake that is downstream from the watershed. This water intake will be impacted, both positively and negatively, by activities within the watershed.
Figure
intakes.
Wells withdraw and filter groundwater. The depth of the wells combined with the impermeability of the clay soils common in the watershed help to protect the quality of well water from the impacts of human activity. There are 11 privately owned and maintained public water supply wells throughout the watershed.
Lake Wylie Water Intake
Downstream Water Intake
In 2020, the Big Dutchman Creek Watershed was home to approximately 28,000 people. Because of the recent changes to U.S. Census tracts, it is not possible to accurately estimate the population within the watershed prior to the 2020 census. However, there is data available that shows the population growth in York County and South Carolina between 1970 and 2020.
Both South Carolina and York County have experienced significant population growth since the 1970s. The population in York County grew 228% between 1970 and 2020. The population in South Carolina grew 98% during the same time (U.S. Census Bureau, 1970-2020). If the population of the Big Dutchman Creek Watershed grows at the same rate as York County, then the projected 2050 population will be 39,000. These growth trends and predictions can be seen in Figure 1.25.
The additional residents in the watershed will help grow the economy of the area; however, they will need additional housing and amenities that will result in converting open space to roads, roofs, and parking lots. It will be crucial to increase efforts to protect the watershed from the hydrologic changes that could result from those land use conversions.
DUTCHMAN CREEK WATERSHED RESTORATION PLAN WATERSHED OVERVIEW 20 19
Figure 1.24 Public water supply intakes near the watershed
1.24 shows the locations of these water
0 50,000 100,000 150,000 200,000 250,000 300,000 350,000 400,000 450,000 500,000 0 1,000,000 2,000,000 3,000,000 4,000,000 5,000,000 6,000,000 7,000,000 8,000,000 1970 1980 1990 2000 2010 2020 2030 2040 2050 York County + Big Dutchman Population South Carolina Population South Carolina South Carolina Projected York County York County Projected Big Dutchman Projected
Figure 1.25 Graph depicting future population growth for South Carolina, York County, and the Watershed
Population & Projected Growth
Local Interest in Protection & Restoration
The City of Rock Hill is significantly advancing environmental preservation, especially through its stream restoration initiatives. Several projects in this area have already been completed. In addition, the City is involved in thorough stream assessments, which help pinpoint potential sites for future restoration efforts.
The wider York County community is also engaging in conservation activities, such as the litter sweeps shown in Figure 1.26. These activities are spearheaded by York County Stormwater and Environmental Compliance, which focuses on protecting local waterbodies. In addition, several conservation organizations are leading efforts to preserve the environment within the watershed.

Keep York County Beautiful
Founded via York County Ordinance No. 710 in 2010, the Keep York County Beautiful board is an affiliate of the larger Keep America Beautiful organization. They accomplish their mission of “inspiring and encouraging citizens to take personal responsibility for improving the environment of their York County community” through volunteer cleanup programs, site adoption programs, and public education. These educational outreach efforts include recycling and litter prevention presentations, promoting apartment community recycling and beautification of public spaces, and working with local businesses on waste reduction practices (York County, 2023). More information about the Keep York County Beautiful board can be found on their website and Facbook page.


Catawba Riverkeeper
Founded in 1997, the Catawba Riverkeeper’s mission is to “preserve, protect, and restore the waters of the Catawba-Wateree River basin for all through education, advocacy, and engagement.” This organization operates in both North and South Carolina and advocates for both the Catawba River and for those who utilize the river for livelihood and recreation.
The Catawba Riverkeeper also offers a plethora of volunteer and special events. These events include annual Riversweeps across more than 50 sites, public cleanup events, a Riverkeeper Explorers Camp, a Trash Trap Program, RiverFest, and Jam at the Dam live music event. More information about the Catawba Riverkeeper can be found on their website (Catawba Riverkeeper, 2023).

Rock Hill Clean & Green
This City-sponsored organization was certified as a Keep America Beautiful affiliate in 1987. It is comprised of 15 volunteers that are appointed by the City Council. Its mission is to “promote litter reduction, beautification and recycling through public awareness, education and special events designed to reach every segment of the population; to make recommendations to city government on programs, policies and codes which impact these issues.” To help accomplish this mission, Rock Hill Clean & Green participates in America Recycles Day, the Earth Day Birthday, the Great American Clean-Up, and sponsors Rock Hill litter pick-ups. As a result of their dedication, Rock Hill Clean & Green won a national award for its environmental education programs among numerous other state and national accomplishments (City of Rock Hill). More information about Rock Hill Clean & Green can be found on their website
DUTCHMAN CREEK WATERSHED RESTORATION PLAN WATERSHED OVERVIEW 22 21
Figure 1.26 Volunteer litter sweep (Keep York County Beautiful)

2
Analysis
Watershed

Watershed Analysis
The South Carolina Pollution Control Act and SC Regulation 61-68: Water Quality Classifications and Standards establish a classifying system for the state’s waters, assigning uses to each classification, and assigning standards that must be maintained to support those uses.
Water Quality Classification & Standards
The primary goal of these rules is to maintain waters that meet water quality standards and restore waters that do not. A water is considered impaired if it does not meet the standards associated with its water quality classification. All freshwaters (FW) in South Carolina are required to be of sufficient quality to support the uses shown in Figure 2.1.
SC Regulation 61-69: Classified Waters lists the classification and boundaries of waterbodies in South Carolina. The purpose of water quality classifications is to protect water quality as well as public health, safety and welfare. These standards also assist DHEC in making decisions about establishing pollutant limits when it issues wastewater and stormwater permits.


In the Big Dutchman Creek Watershed, all waters are classified as Freshwater (FW). Figure 2.2 summarizes some of the water quality standards associated with the FW classification.
Figure 2.2 Table summarizing DHEC water quality standards for Freshwater (FW) Pollutant Water
Impairments & TMDLS & Watershed Plans
The term “303(d) list” is short for a state’s list of impaired and threatened waters (e.g. stream/ river segments, lakes). The EPA requires all states to develop a list of waterbodies that do not meet water quality standards. This requirement comes from Section 303(d) of the Clean Water Act, hence the name for the list. The purpose of the list is to identify impaired waters and to identify the source of impairment so that corrective actions can be taken to improve water quality. EPA mandates that the 303(d) list of impaired waters be developed every two years and submitted to EPA for approval.
South Carolina develops a 303(d) list every two years for the waterbodies that fail to meet water quality standards. The 303(d) list cycles begin on even-numbered years. In developing South Carolina’s 303(d) list, DHEC solicits and evaluates all existing and readily available water quality data collected over the previous 5 years.
Figure 2.3 shows the current 303(d) list entry for Big Dutchman Creek. Because the watershed was not assessed previously, it is not possible to tell if the impairment occurred recently or if the creek has been impaired for a long period of time.
The SC Watershed Atlas displays the state’s water quality monitoring sites and 303(d) listed waterbodies and a wide variety of additional watershed data, including water quality classifications, floodplains, permitted discharges, and some additional information as shown in Figure 2.4. There are two water quality monitoring sites within the watershed, as shown in the Figure 2.5. The State monitors near the point where the Big Dutchman Creek flows into the Catawba River. While sampling at one point provides an efficient snapshot of the overall watershed bacterial load, including additional locations would allow the Key Partners to better pinpoint pollutant sources.

WATERSHED ANALYSIS 24 23 DUTCHMAN CREEK WATERSHED RESTORATION PLAN
Aquatic Life (AL) Fishing (FISH) Primary & Secondary Recreation (REC) Drinking Water Industrial & Agricultural Uses (wading, swiming, etc.) (after treatment)
Figure 2.1 Uses that all freshwaters in SC should support
coli < 349 CFU / 100 mL, and a geometric mean < 126 CFU / 100 mL for 4 samples within a 30 day period Turbidity < 25 NTUs for lakes, < 50 NTUs for other waters pH 6.0 - 8.5 Dissolved Oxygen > 5.0 mg/L for a daily average with
mg/L
Source Runoff Allowed if uses are maintained and protected Garbage, Ashes, Oils, & Sludge Not allowed
Discharges of Treated Wastes Allowed
permit conditions
met
maintained and protected
Quality Standard E.
no samples below 4.0
Nonpoint
Permitted
if
are
and uses are
Figure 2.3 DHEC’s 303(d) list entry for Big Dutchman Creek
BASIN HUC-12 COUNTY STATION DESCRIPTION 2020 IMPAIRED USE 2020 STATUS 2020 CAUSE 2022 IMPAIRED USE 2022 STATUS 2020 CAUSE PRIORITY RANK CATAWBA 030501030601 YORK LCT-02 BIG DUTCHMAN CR AT MT. GALLANT RD. NA NOT ASSESSED NA REC IMPAIRED E. COLI 3
Figure 2.4 Screenshot of SC Watershed Atlas

According to the Clean Water Act, each state must develop TMDLs (Total Maximum Daily Load) for all the waters identified on their Section 303(d) list of impaired waters, according to their priority ranking on that list. The TMDL is a calculation of the load reduction needed for a waterbody to meet its uses and assigns the load reductions required for the various pollutant sources (both point and nonpoint). TMDLs must account for seasonal variations in water quality and provide a margin of safety to account for uncertainty in predicting how well pollutant reductions will result in meeting water quality standards. TMDLs must be approved by both DHEC and the EPA.
Big Dutchman Creek has been assigned a priority rank of “3.” Each of the waters listed in the 303(d) list is assigned one of the following priority ranks depending on how soon it will be addressed by a TMDL:
1. Current: 2022 - 2024
2. Near-Term: 2024 - 2026
3. Long-Term: After 2026
E. coli Description & Monitoring Data
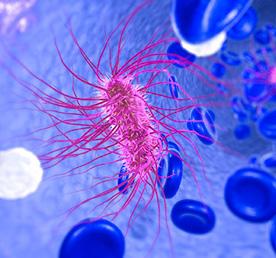
E. coli is a shorter name for Escherichia coli, which is a bacteria that exists in the fecal matter of farm animals, humans, wildlife and pets. Most E. coli bacteria do not cause illness. However, there is a subset of E. coli bacteria that are pathogenic, and possibly life-threatening, as shown in Figure 2.6. The disease-causing type of E. coli can be carried by water and therefore is an important parameter to include in water quality monitoring.
E. coli is measured as colony forming units (CFU) per 100 milliliters (mL). A CFU is an estimate of the number of viable bacteria cells in a sample.
Figure 2.7 shows that the average of the DHEC sampling results from sample station LTC-02 is 1,070 CFU/100 mL, which is higher than the water quality standard of 349 CFU/100 mL of E. coli. This data indicates that reductions in E. coli will be necessary to bring the watershed into compliance with the required standard. A 30% reduction in E. coli is proposed as an appropriate adaptive goal to begin the process of achieving water quality standards in the Big Dutchman Creek Watershed.
The purpose of this Watershed Plan is to bring the watershed into attainment of the water quality standards so that a TMDL will not be needed. After a water has been added to the 303(d) list, it can only be removed by either being improved to meet the water quality standard or by having a TMDL developed for it.
The status of Big Dutchman Creek as a long-term priority allows time for this Watershed Plan to be implemented and, hopefully, for the SC water quality standard to be achieved so that a TMDL will not need to be developed. This Watershed Plan not only addresses the identified cause of impairment, E. coli, but also addresses several other concerns in the watershed, including nutrients and hydrologic modification. These pollutants and goals are described below.
WATERSHED ANALYSIS 26 25 DUTCHMAN CREEK WATERSHED RESTORATION PLAN DHEC Sampling Point Station LTC-02
Figure 2.5 Water quality sampling point in watershed
Figure 2.6 E. coli explanation and image of E. coli bacteria (Alabame Cooperative Extension Service, 2022)
435 236 3,025 2,420 2,420 727 687 1,553 579 313 1,046 345 1,300 219 184 2,420 980 2,419 435 613 1,733 435 579 579.4 0 500 1000 1500 2000 2500 3000 Water Quality Standard Average
Total Coliforms Fecal Coliforms E. coli Pathogenic E. Coli 0157-H7
Figure 2.7 Recent E. coli sampling results
E. coli Count in CFU/100 mL
N
Total Nitrogen & Total Phosphorus Description
Nitrogen and phosphorus are both nutrients, which are substances that provide nourishment that is essential for growth and maintenance of life. Although plants and animals require nutrients to survive and thrive, human activities in the watershed can contribute much higher levels of nutrients than are typically found in an undeveloped watershed. Elevated levels of nutrients in waterbodies can trigger an algal bloom, like the one shown in Figure 2.8 below. Algal blooms can be toxic to humans and animals. They also block sunlight that is needed by other aquatic plankton (small plants in the water), causing them to die and decompose, which then depletes the water of oxygen and endangers the health of the entire ecosystem (Water Science School, 2018).
The main sources of nitrogen and phosphorus in a developed watershed are:
y Fertilizers. Although fertilizer promotes plant growth, when it is improperly applied, excess nutrients can be transported to waterbodies in stormwater runoff or through ground water via infiltration.
y Human waste. Improperly functioning septic systems and sanitary sewer overflows can cause human waste and its associated nutrients to be transported to waterbodies in stormwater runoff.
y Animal waste. When pet waste is not cleaned up and properly disposed of, or if livestock are not separated from streams, animal waste and its associated nutrients can reach waterbodies through direct deposition or stormwater runoff.
y Atmospheric deposition. Emissions from vehicles contain nitrogen compounds that can be deposited on land and carried to waterbodies in stormwater or deposited directly in waterbodies. Phosphorus can also be carried by the atmosphere and deposited on the land and water.
In this Watershed Plan, nitrogen is measured as Total Nitrogen (TN). TN includes several different nitrogen compounds such as nitrate-nitrate (NO₂ and NO₃ in fertilizer and car emissions), ammonia (NH₃ in fertilizer and animal waste), and organic nitrogen (from plant and animal debris). TN compounds are frequently dissolved in water and can be removed by plant uptake or chemical processes. Figure 2.9 shows the complexities of the nitrogen cycle.
Phosphorus is measured in the Watershed Plan as Total Phosphorus (TP). TP includes several different inorganic compounds as well as organic phosphorus from plant and animal debris. TP is usually easier to remove from stormwater than TN because many of the phosphorus compounds bind with sediment, allowing them to be filtered or settled out. Figure 2.10 shows the phosphorus cycle.
Although the Big Dutchman Creek Watershed is not currently impaired for TN and TP, the goal is to control and reduce the existing sources of nutrients and prevent new ones so that nutrients will not become a cause of impairment to this watershed in the future as the watershed continues to develop.


WATERSHED ANALYSIS 28 27 DUTCHMAN CREEK WATERSHED RESTORATION PLAN
Figure 2.9 The nitrogen cycle (Vermont Public)
Figure 2.8 Photo of algal bloom in York County, SC (McAdams)
Figure 2.10 The phosphorus cycle (Socratic)
Hydrologic Impacts
The Big Dutchman Creek Watershed is not currently impaired for hydrologic impacts to aquatic life. However, the goal of this Watershed Plan is to prevent “failure to support aquatic life” as a cause of impairment in the future as the watershed continues to develop. As watersheds urbanize, several hydrologic changes occur. Development raises the elevation of low areas, which previously provided storage, and paves over pervious areas, which previously provided opportunities for infiltration. The addition of curb and gutters with storm sewer systems quickly directs more runoff to streams and lakes. Left unchecked, hydrologic impacts cause serious damage to the physical and biological integrity of the receiving stream, such as the flooding and erosion depicted in Figure 2.11 and 2.12. These impacts include:
y Increased speed and volume of flow within the stream compared to pre-development conditions;
y Increased frequency of flooding;
y Wider stream channels due to increased storm flows. Streambanks are undercut and slump into the channel;
y Weakened trees along the streambank due to exposed roots. When these trees fall, a second phase of bank erosion can be triggered;
y Elimination of aquatic habitat through sedimentation;
y Diminished groundwater flow to streams, causing less flow to streams between storm events;
y Decreased aquatic biodiversity as sensitive species are reduced or eliminated;
y Substantially increased pollutant volume entering the stream system; and
y Increased stream temperatures, which can further harm aquatic plants and animals.


As the Big Dutchman Creek Watershed continues to develop, the volume and intensity of runoff will increase. This increase will impact the physical characteristics of streams as described above. Artificial structures, such as bridges or culverts, may restrict water flow, and cause stream erosion. Other hardened structures, such as walls and riprap, transmit more energy downstream than vegetated streambanks, increasing erosive stresses on weaker areas of the streambank.
Objective Statement
The main objective of this Watershed Plan is to propose management measures that will lead to a sufficient reduction of E. coli bacteria within the watershed so that Big Dutchman Creek will meet the required water quality standards. Additional objectives identified by the Key Partners and concerned citizens are to reduce nutrients and hydrologic impacts from development.
More specifically, this Watershed Plan seeks to implement a variety of practical and cost-effective management measures that, when implemented together, achieve the following:
1. Reduce bacteria and nutrients from humans (numeric goal: 30% reduction in E. coli and 25% reduction in TN and TP);
2. Reduce bacteria and nutrients from animals (numeric goal: 30% reduction in E. coli and 25% reduction in TN and TP);
3. Reduce hydrologic impacts from development (numeric goal: provide at least 5 measures to restore hydrology in the next 5 years while increasing hydrologic protection on new development projects); and
4. Increase education and outreach (no numeric goal).
WATERSHED ANALYSIS 30 29 DUTCHMAN CREEK WATERSHED RESTORATION PLAN
Figure 2.11 River and creek flooding (Independent Mail)
Figure 2.12 Streambank erosion caused by hydrologic impacts (Clemson University)

3
Sources
Pollutant

Pollutant Sources
This section addresses Element A – identify causes and sources of pollution and the first part of Element B – estimate pollutant loading.
Summary of Impairments, Causes, Sources & Impacts
Big Dutchman Creek is on the 303(d) list based on water quality monitoring data showing levels of E. coli that significantly exceed the SC water quality standard. Therefore, addressing the potential sources for E. coli is a focus for this Watershed Plan. Key partners and involved citizens have identified several concerns beyond E. coli to address in this Watershed Plan: Total Nitrogen (TN), Total Phosphorus (TP), and hydrologic impacts from impervious surfaces. The causes, sources, and waterbody impacts associated with each of the impairments is described in Figure 3.1.
Impairment Causes Potential Sources Waterbody Impacts
Point Sources Sanitary sewers leaks/ overflows
E. coli (from 303d list)
TN and TP (from observations)
Septic Systems Unmaintained and failing septic systems
Other Nonpoint Sources Pet waste, geese, wildlife, livestock
Point Sources Sanitary sewer leaks/ overflows
Septic Systems
Other Nonpoint Sources
Hydrological (from observations)
Unmaintained and failing septic systems
Excessive fertilizer, pet waste, geese, wildlife, livestock
Nonpoint Sources Increased impervious cover
• Health risks to animals
• Potentially serious or even fatal health risks to humans
• Loss of recreational resources

What is Point Source Pollution?
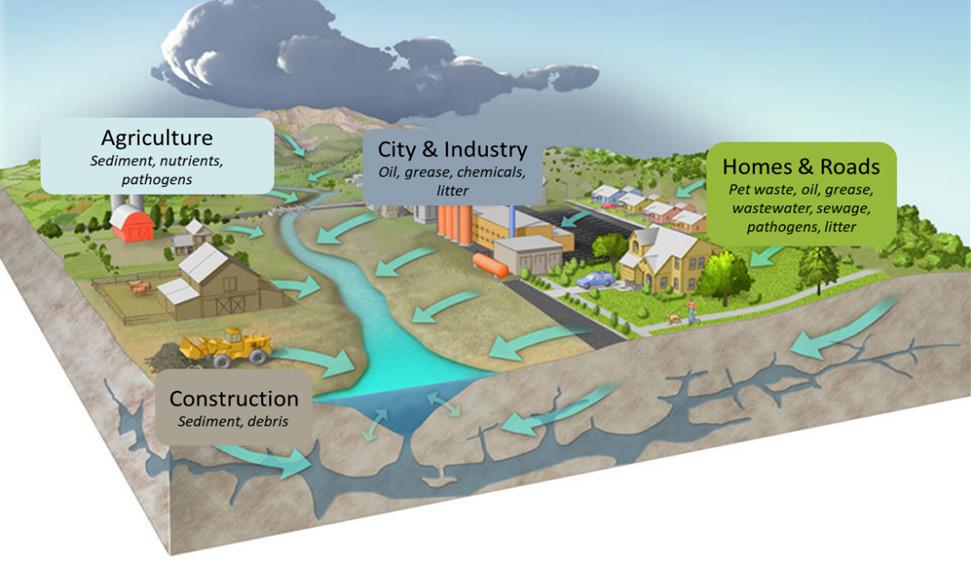
Point source pollution is discharged from a discrete location, such as the end of an outlet pipe as seen in Figure 3.2. Wastewater treatment plants and industries are required to have a discharge permit from DHEC to discharge treated wastewater. No one is allowed to discharge untreated wastewater, either intentionally or accidentally.
What is Nonpoint Source Pollution?
Unlike point source pollution, nonpoint source pollution does not have a discrete discharge point. Instead, nonpoint sources are areas where pollutants are present on land and are carried away with stormwater runoff, as illustrated in Figure 3.3. Examples of nonpoint source pollution include nutrients from fertilizers applied to landscaped areas, E. coli from pastures, oil and grease from roadways, and sediment from construction sites.
• Algal blooms
• Health risks to humans and animals
• Loss of recreational resources
• Eroded streambanks
• Loss of riparian habitat and property
• Risks to human health and safety
DUTCHMAN CREEK WATERSHED RESTORATION PLAN POLLUTANT SOURCES 32 31
Figure 3.1 Table summarizing the impairments, causes, sources and impacts in the watershed
Figure 3.2 Point source pollution example (Encyclopædia Britannica, 2023)
Figure 3.3 Nonpoint source pollution example (Three Lakes Association, 2017)
Sanitary Sewer Overflows (SSOs)
Within the Big Dutchman Creek Watershed, there are no discharges of either treated or untreated wastewater from wastewater treatment plants. However, there have been issues with sanitary sewer lines that have caused releases of E. coli, nutrients, sediment, and solid waste. Sanitary sewer systems collect and transport domestic, commercial, and industrial wastewater to treatment facilities. Occasionally, releases of raw sewage known as sanitary sewer overflows (SSOs) can occur. SSOs can contaminate surface waters, causing serious water quality problems, and can back up into homes, causing property damage and threatening public health.
Possible causes of SSOs include:
y Blockages;
y Line breaks;
y Construction activities;
y Root intrusion;
y Lack of proper maintenance;
y Vandalism; and
y Stormwater inflow and infiltration that overloads the system.
There are two types of SSOs: main line and service line. Main line SSOs occur from a larger sewer line that collects and carries untreated wastewater from many households or businesses to the wastewater treatment plant. Service line SSOs occur from a smaller line that carries wastewater from a single property to the main line. Figure 3.4 shows the difference between main and service lines.
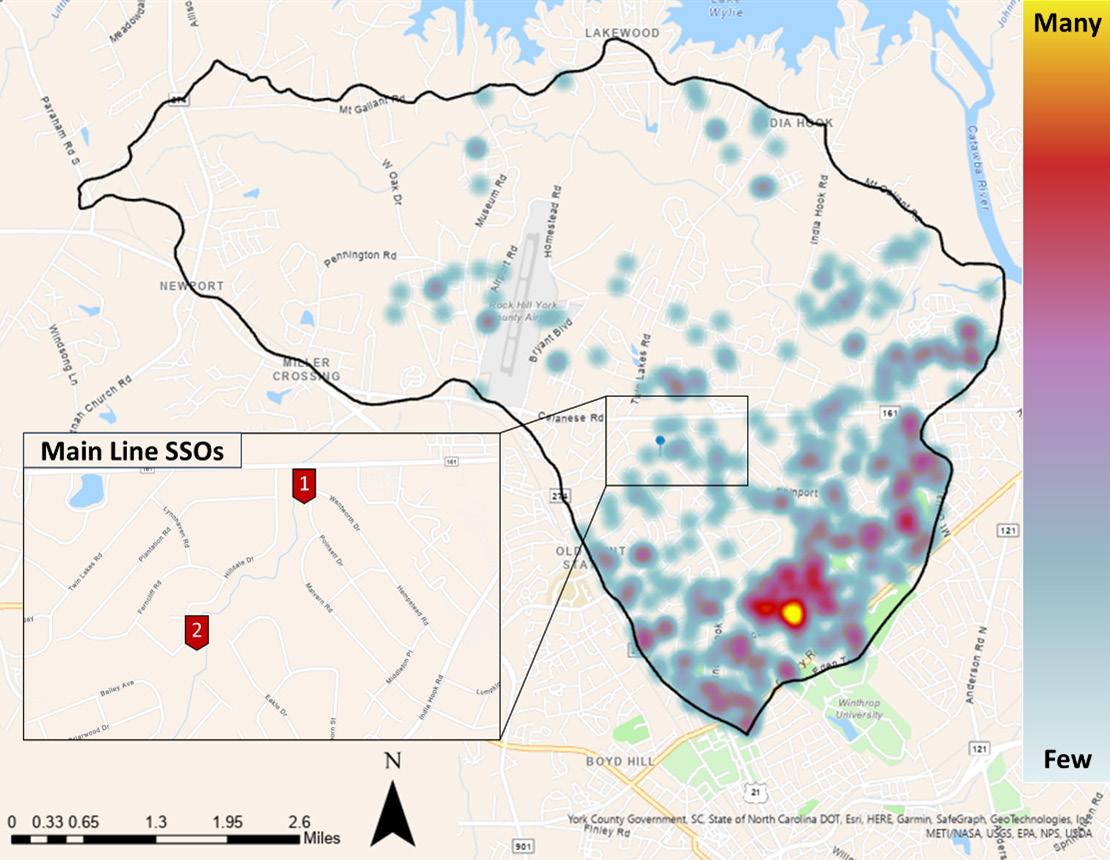
Since 2020, there have been two main line SSOs in the Big Dutchman Creek Watershed (DHEC 2023). In addition to the main-line SSOs, there have been approximately 500 service line SSOs in the watershed since 1996 (Rock Hill GIS, 2023). The specific locations of the main line SSOs are shown in Figure 3.5. The service line SSOs are shown as a heat map.
Unlike main line SSOs, service line SSOs are often present for an extended time before the property owner notices them. Some of the signs that a service line is failing include sewage backup and soggy areas in the yard, foul odors, foundation cracks, and lush areas of green grass growth above the sanitary sewer line. It is important for property owners to know the location of their sanitary service lines and to understand the signs of a potential SSO so they will be able to take swift action before an SSO damages their property or becomes a significant source of E. coli and nutrients.

Date 5/18/2023
Discharge 10,150 gallons
Cause Uprooted tree broke terra cotta sewer line
Remediation Debris removed & pipe replaced with ductile iron
Date 6/2/2023
Discharge 9,600 gallons
Cause Grease blockage
Remediation Line cleaned & lime applied to
DUTCHMAN CREEK WATERSHED RESTORATION PLAN POLLUTANT SOURCES 34 33
Figure 3.4 Sanitary sewer main line and service line in a typical residence (City of Fargo, North Dakota)
Figure 3.5 Main line SSOs (points 1 and 2) and service line SSOs (heat map) in watershed
area
1 2 1 2
Septic Systems in Watershed
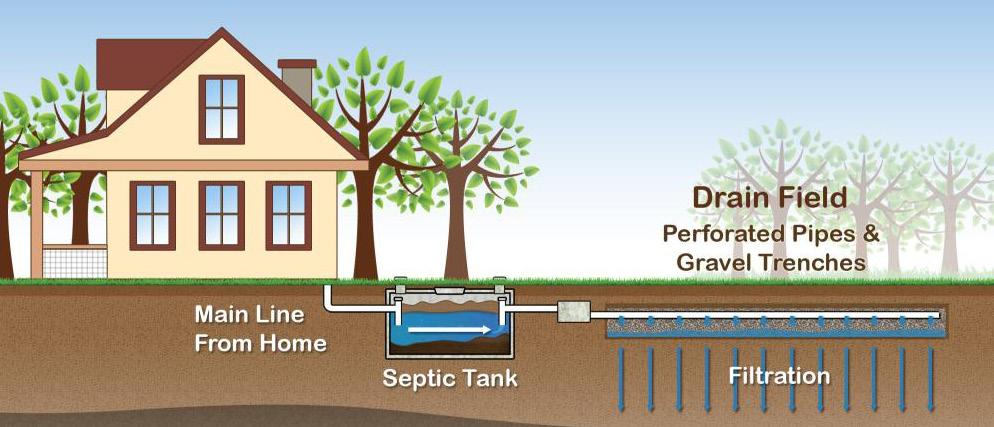
A septic system consists of a septic tank and a drain field. Wastewater from the household flows into the septic tank, where solids settle at the bottom. The remaining wastewater flows into the drain field, where it is released into the soil through a series of perforated pipes. The soil’s physical properties filter out particles, while the microorganisms in the soil break down harmful substances like nitrogen, phosphorus, and pathogens such as E. coli bacteria. The effectiveness of a septic system depends on the soil’s ability to absorb and filter the wastewater and the proper maintenance of the septic system.
When septic systems fail, untreated wastewater can seep into the groundwater or flow to streams and become a source of E. coli and nutrients. The EPA has identified malfunctioning septic systems as one of the top five sources of groundwater
contamination in the country, highlighting the need for proper installation, regular maintenance, and periodic inspections to ensure their effective and safe operation (Gibb, 2022).
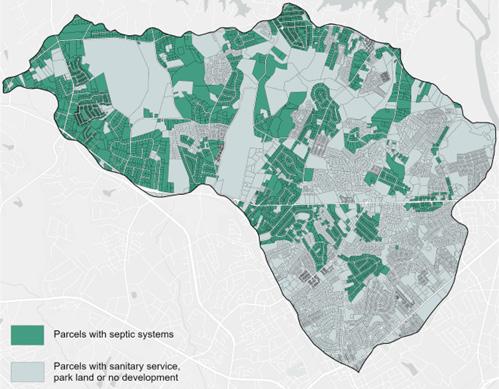
As depicted in Figure 3.6, approximately 3,700 parcels within the watershed are estimated to be served by septic systems, representing approximately 27% of the total parcels.
This estimate is based on the City of Rock Hill’s sanitary sewer data because accurate septic system data is not available. This plan recommends the Key Partners generate precise septic system location and condition information. Reliable data is needed for both pollutant modeling and for community outreach and education.

DUTCHMAN CREEK WATERSHED RESTORATION PLAN POLLUTANT SOURCES 36 35
Figure 3.6 Parcels with no sanitary service, presumed to have septic systems in watershed
Figure 3.7 Diagram of a septic system (Minnesota Pollution Control Agency 2023)
Figure 3.8 A septic system pump out (Vac-Tec Septic & Water LLC)
Figure 3.7 shows how a typical septic system functions. The most clear sign of a septic system failure is a sewage backup that occurs when the tank is clogged or full. Other signs of septic system failures include algal blooms in nearby lakes, slow moving drains, bright green or soggy grass in the yard, standing water, and bad odors. When a septic tank becomes clogged, it is usually necessary to have it pumped out as shown in Figure 3.8.
N
Nonpoint Sources within the Watershed
In the Big Dutchman Creek Watershed, pollution from nonpoint sources far exceeds pollution from point sources. This is also true for most watersheds because the combined volume of stormwater runoff is greater than discharges from wastewater treatment plants, SSOs, and failing septic systems. Some of the stormwater in the watershed is treated in stormwater BMPs, but there is a significant amount of stormwater that enters the streams and impoundments without treatment.
Urban development alters the hydrology and water quality of streams. Roads, parking lots, and buildings increase the impervious cover and restrict the infiltration of precipitation. As a result, stream flows in urban areas often rise rapidly after a rainfall event. This can cause erosion of stream beds and banks and degrade fish spawning and feeding habitats. Other impacts are shown in Figure 3.9. The most common sources of E. coli and nutrients in the watershed are fertilizers, pet waste, geese, wildlife, and livestock.
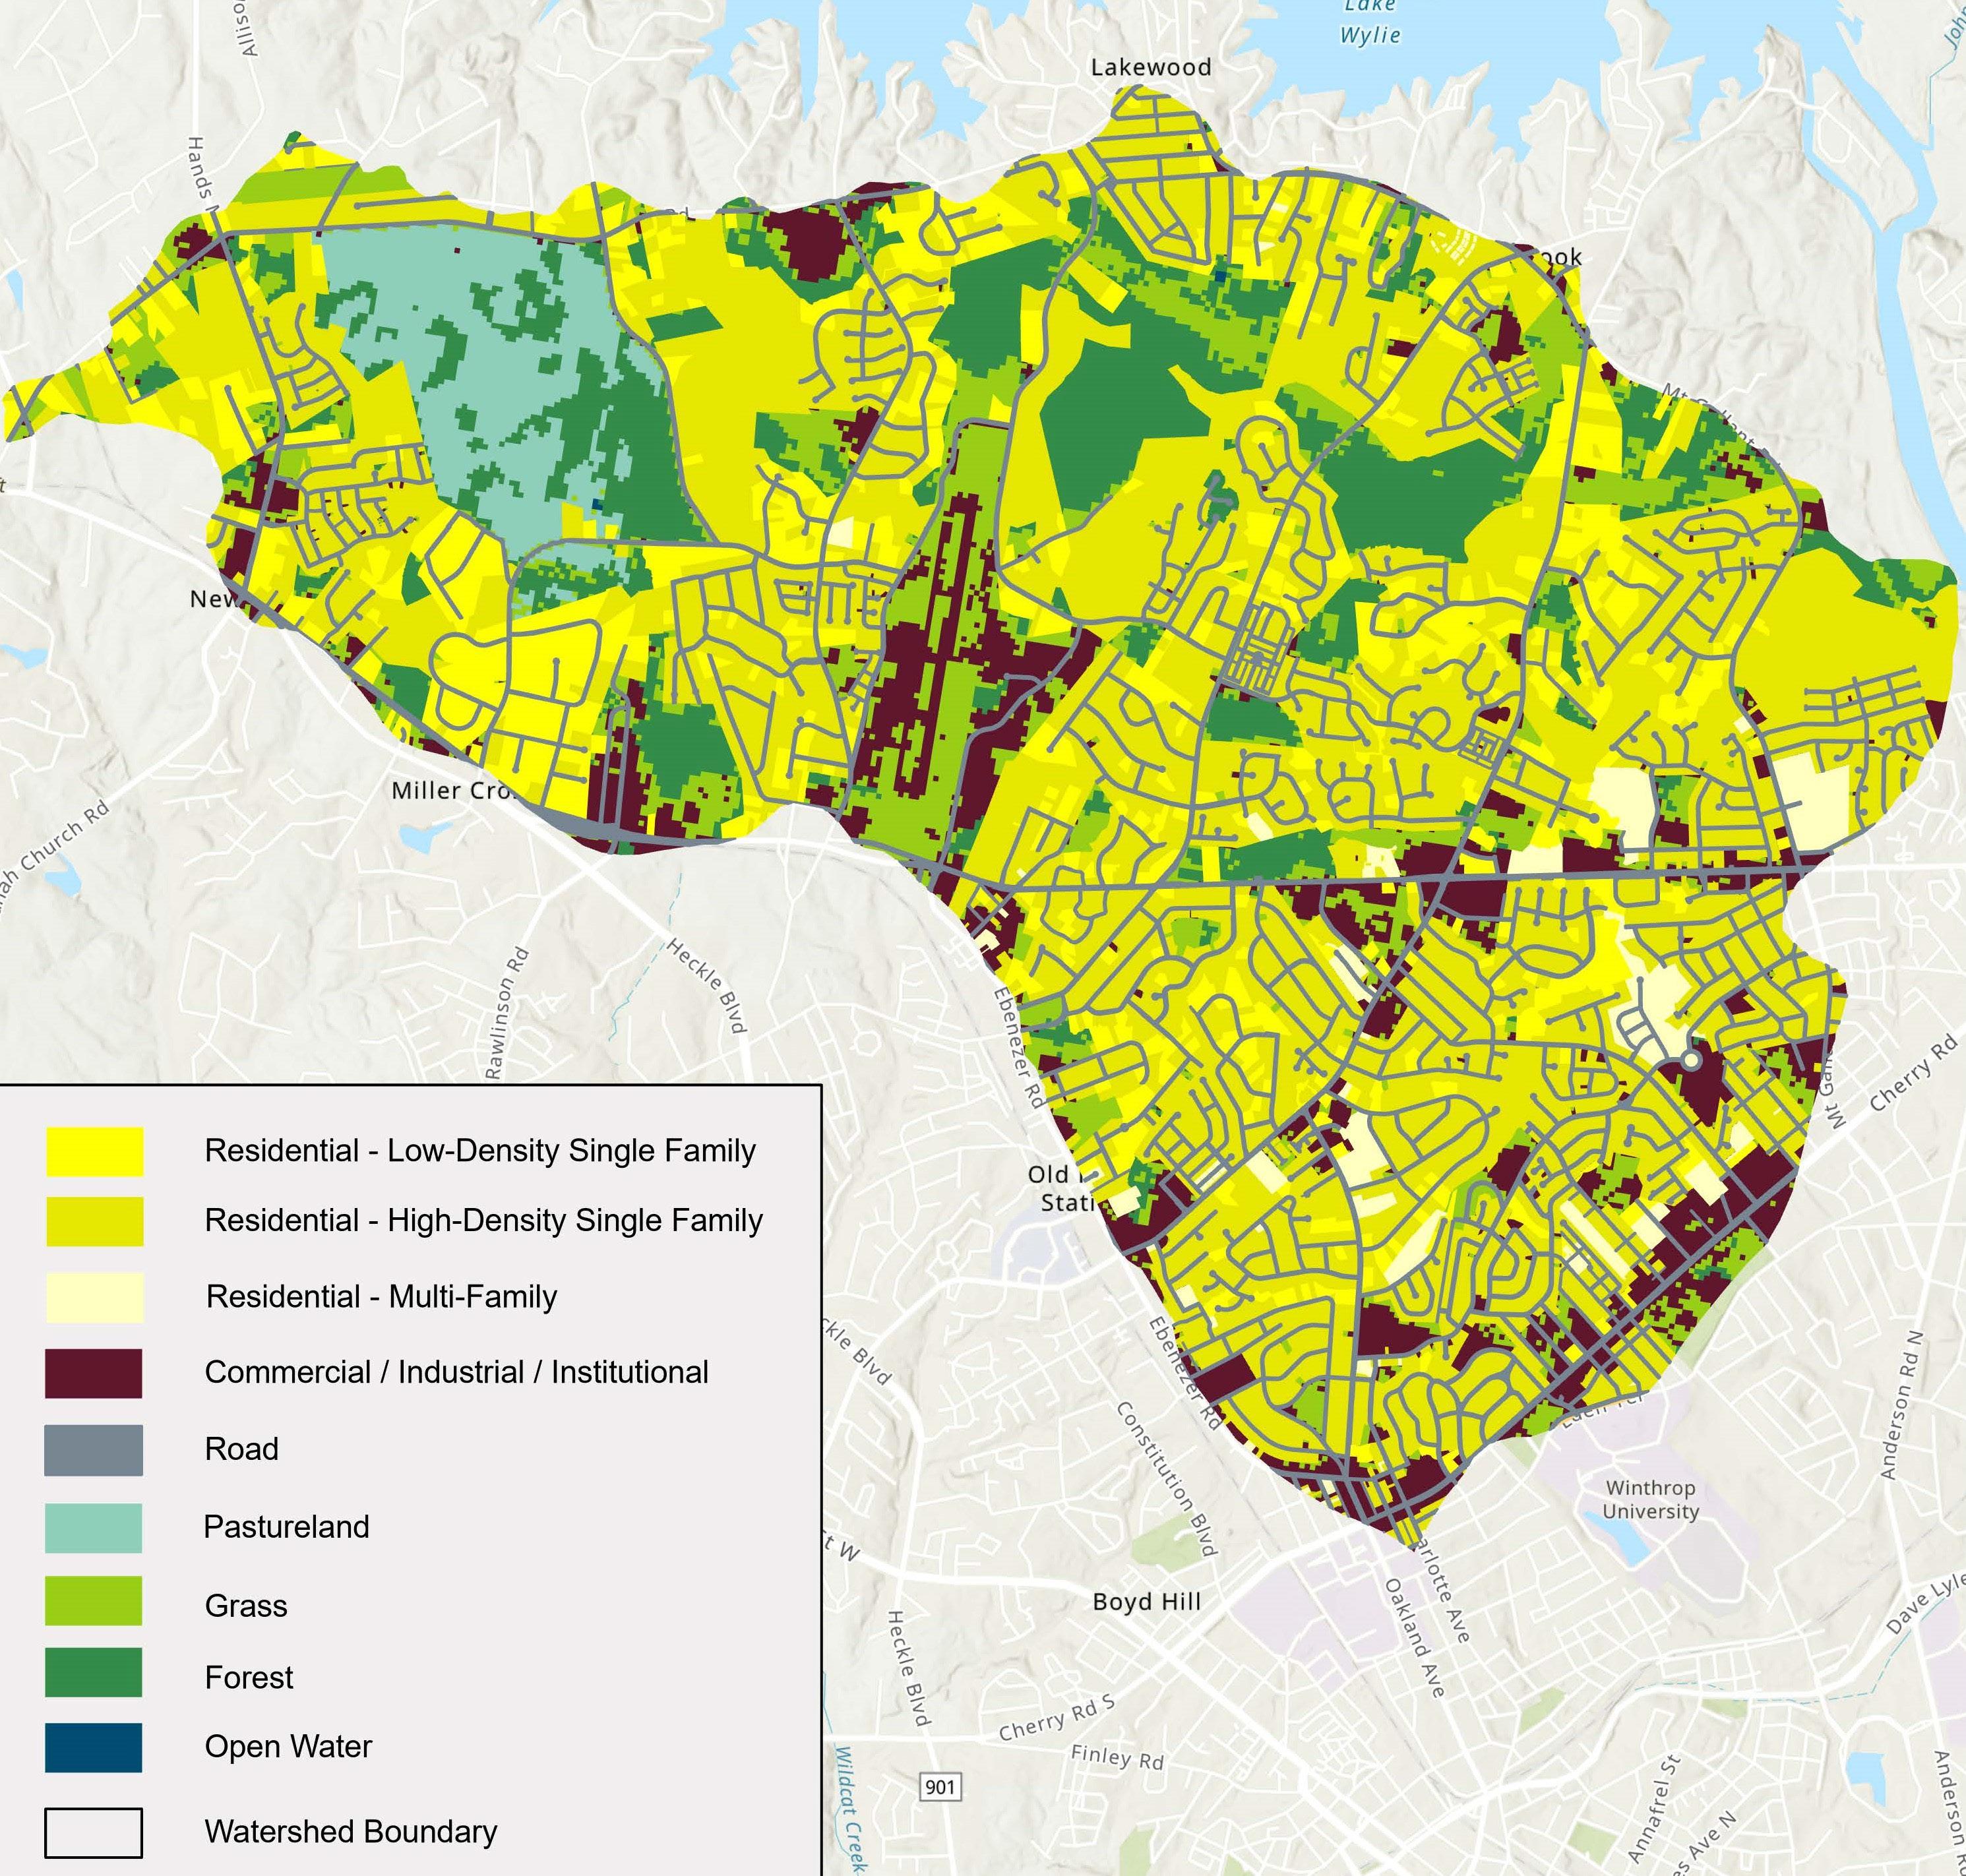
The most prevalent land use in the watershed is urban development which accounts for about 77% of its overall area. Figure 3.10 shows the relative amounts of each land use type while Figure 3.11 shows the dispersal of land use types throughout the watershed.

Hydrologic Impacts
• Increased Water Volume
• Higher Peak Flows
• Longer Peak Flows Duration
• Warmer Stream Temperatures
• More Pollutant Loading
Ecosystem Impacts
• Flooding
• Degraded Ecosystems
• Impaired Waters

DUTCHMAN CREEK WATERSHED RESTORATION PLAN POLLUTANT SOURCES 38 37
Figure 3.10 Graph summarizing land uses in the watershed
Figure 3.11 Land uses in watershed Land Uses in Watershed (acres)
Figure 3.9 Figure summarizing impervious surface impacts
Pollutant Loading Estimate
The results of the analysis of the pollutants from each source are shown in Figure 3.12 below. It demonstrates that point sources and failing septic systems are relatively small contributors to the overall amount of E. coli, TN, and TP contributed compared to nonpoint sources in the watershed. Nonpoint sources are the largest contributors because they cover all 11,360 acres of the watershed.
High density, single family residential development is the single largest contributor of nonpoint source pollutants since it is the most common land use in the watershed and has a relatively high pollutant loading rate. The highest pollutant loading rates are from multifamily residential and commercial development; however, these are less common land uses in the watershed and therefore do not have as significant of an impact overall in the watershed.
The estimated total loadings of the pollutants of concern to the Dutchman Creek Watershed are shown in Figure 3.13.
The estimates of pollutant loading were calculated as follows:
Main Line SSOs: The estimated number of sewer spills annually (0.5) was multiplied by the average volume of the spill (9,875 gallons). Typical concentrations of E. coli, TN and TP found in literature were applied to the estimated volume of main line SSOs to estimate the annual pollutant loads.
Service Line SSOs: The estimated number of service line SSOs annually (18.5) was multiplied by DHEC’s loading rate factor for failing septic systems (21.09 BCFU per system), because service line SSOs contribute similar volumes and E. coli loading rates as failing septic systems. Typical concentrations of TN and TP found in literature were applied to the service line SSOs to estimate the annual nutrient loads.
Failing Septic: It was estimated that one tenth of the number of septic systems in the watershed (370) are failing. This number was multiplied by DHEC’s loading rate factor for failing septic systems (21.09 BCFU per system). Typical concentrations of TN and TP found in literature were applied to the failing septic systems to estimate the annual nutrient loads.
Nonpoint Sources: Estimating the pollutant loading from the nonpoint sources was a multistep process:
y The areas of each type of land use within the watershed were determined using GIS data, parcel data, and aerial photography (see Figure 3.14);
y To estimate E. coli loads, DHEC loading rate factors were applied to each type of land use;
y To estimate the TN and TP loads from the land uses, the North Carolina Stormwater Nitrogen and Phosphorus (SNAP) Tool was used;
y The SNAP Tool requires that each land use be broken into the following land covers: roof, roadway, parking/driveway/sidewalk, forest, and landscaped area/grass. The land covers associated with each type of land use were estimated using aerial images of developments within the watershed;
y For each land use, the estimated land covers were input into the SNAP Tool. The SNAP Tool produced the nutrient loading rate for each of the land uses in pounds/ acre/year (see Figure 3.15);
y The loading rates in pounds/acre/year estimated using the SNAP tool were multiplied by the acres of each land use to estimate the pounds/year contributed by each land use.
DUTCHMAN CREEK WATERSHED RESTORATION PLAN POLLUTANT SOURCES 40 39
E. coli Total Load (BCFU/year) TN Total Load (lb/yr) TP Total Load (lb/yr) 53,063 63,630 9,430
4 390 7,805 4,367 26,775 1,946 1,838 72 2,452 5,749 1,665 1 107 2,142 5,404 27,903 2,346 8,798 10,805 2,536 2,468 1,119 0 29 585 732 3,444 274 1,016 1,010 1,244 1,061 35 0 5,000 10,000 15,000 20,000 25,000 30,000 Main Line SSOs Service line SSOs Failing Septic LD Single Family HD Single Family Multi-Family Commercial Road Pasture Grass Forest E. coli Total Load (BCFU/year) TN Total Load (lb/yr) TP Total Load (lb/yr)
Figure 3.13 Pollutant loading estimate
Figure 3.12 Pollutant source estimate graph
Note: The pollutant loading rate is the contribution of the pollutant per acre. The total pollutant load in Figure 3.12 reflects the pollutant loading rate times the acres in each land use.
DUTCHMAN CREEK WATERSHED RESTORATION PLAN POLLUTANT SOURCES 42 41
Figure 3.14 Watershed land uses
Pollutant Loading Rates for Watershed Land Uses 3.3 5.3 7.4 2.0 0.1 5.6 5.6 1.4 4.1 5.5 8.9 9.4 9.5 5.8 2.4 1.0 0.6 0.7 1.0 1.1 0.9 2.9 1.0 0.0 0 2 4 6 8 10 LD Single Family HD Single Family Multi-Family Commercial Road Pasture Grass Forest E. coli Loading Rate (BCFU/acre/year) TN Loading Rate (lb/ac/yr) TP Loading Rate (lb/ac/yr) 1,331 5,064 263 932 1,135 435 1,020 1,178 0 1,000 2,000 3,000 4,000 5,000 6,000 LD Single Family HD Single Family Multi-Family Commercial Road Pasture Grass Forest
Figure 3.15 Pollutant loading rates for watershed land uses Watershed Land Uses (acres)

4 Load Reductions

Load Reductions
This section addresses the second part of EPA’s Element B – estimate the expected load reductions.
Watershed Plan Review
The watershed is impaired due to exceedances of E. coli bacteria in one sampling location just upstream of where Big Dutchman Creek discharges to the Catawba River. DHEC has rated this impairment as Priority 3, meaning they do not intend to develop a TMDL for E. coli until after 2026. In addition to E. coli, the Key Partners and citizens in the watershed reported concerns over excessive TN and TP.
The objectives of this Watershed Plan are to:
y Reduce bacteria and nutrients from humans;
y Reduce bacteria and nutrients from animals;
y Reduce hydrologic impacts from development; and
y Increase public education.
To achieve these goals, nearly all the pollutant sources in the watershed will require some level of reduction. Figure 4.1 illustrates the overall pollutant reduction goals within the watershed. The prevalence of each pollutant source and a reduction estimation for each management measure are shown in Figure 4.2.
The expected pollutant removals from individual management measures, along with a description of each measure, are detailed in Section 5. To address each of the nonpoint sources of pollution and meet the objectives outlined in Figure 4.1, a combination of the proposed management measures will be necessary.
For point sources and failing septic systems, the pollutant removals were estimated to be 100%, as resolving these issues would completely eliminate the pollutant source. Therefore, even though these sources were not large contributors of pollutants, this Watershed Plan proposes to address a high percentage of these sources.
For nonpoint sources, this Watershed Plan suggests targeting a high percentage of residential developments and grassed areas, and half of the commercial properties. As the next section will show, management measures on pasture are very cost-effective and thus it is suggested to implement agricultural measures on all or nearly all of this land use.
Targets are not provided for forest land because this is the natural land use and contributes a very low concentration of pollutants.
Nonpoint Sources
DUTCHMAN CREEK WATERSHED RESTORATION PLAN LOAD REDUCTIONS 44 43
Numeric Pollutant Reduction Goals for this Plan E. coli Total Load (BCFU/year) TN Total Load (lb/yr) TP Total Load (lb/yr) 30% 15% 30%
Figure 4.1 Numeric pollutant reduction goals for this plan
Total Units Type of Unit Units Treated E. coli Removed TN Removed TP Removed (%) (BFCU/yr) (%) (lb/yr) (%) (lb/yr) Point Sources and Septic Systems Main Line SSOs 0.5 SSOs/year 100% 100% 4 100% 1 100% 0 Service Line SSOs 18.5 SSOs/year 80% 100% 312 100% 86 100% 23 Failing Septic 370 Systems 75% 100% 5,854 100% 1,606 100% 439
LD Single Family 1,331 acres 75% 20% 655 20% 811 25% 137 HD Single Family 5,064 acres 75% 20% 4,018 20% 4,185 25% 646 Multi-Family 263 acres 75% 40% 584 20% 352 50% 103 Commercial 932 acres 50% 20% 184 20% 880 50% 254 Road 1,135 acres 30% 20% 4 20% 648 20% 61 Pasture 435 acres 90% 90% 1,987 30% 685 75% 840 Grass 1,020 acres 75% 60% 2,589 35% 648 50% 398 Forest 1,178 acres 0% 0% 0 0% 0 0% 0 Total Load Removed 16,191 9,902 2,901 Percentage of Load Removed 30% 15% 30%
Figure 4.2 Point source, septic system, and nonpoint source pollutant load removal

Descriptions of Management Measures
5

Descriptions of Management Measures
This section addresses EPA’s Element C – describe management measures that will achieve load reductions and targeted critical areas.
Summary of Objectives & Management Measures
Figure 5.1 presents the four objectives of this Watershed Plan, each supported by 5-6 management measures aimed at fulfilling these objectives. This section details the management measures associated with Objectives 1, 2, and 3. For management measures related to Objective 4, ‘Increase Education & Outreach,’ refer to Section 9 of this plan. A summary of pollutant removal effectiveness and implementation costs for each management measure is presented in Figure 5.36 at the end of this section.
1.
Reduce Bacteria & Nutrients from Humans
Repair & replace failing septic systems
Connect failing septic systems to sanitary sewer
Implement Sanitary Capital Improvement Plan
Remove litter from streams
Remove litter from streets
Sweep streets
Convert dry detention basins to stormwater wetlands
2. 3. 4.
Reduce Bacteria & Nutrients from Animals
Implement a Goose Egg Addling Program
Provide Pet Waste Stations
Increase Catch Basin Cleaning
Exclude Livestock from Streams with Fencing
Provide Alternative Water Sources on Pastureland
Reduce Hydrologic Impacts from Development
Disconnect household downspouts
Provide flood attenuation & storage
Restore and enhance stream buffers
Restore eroding streams
Restore floodplains
Increase Education & Outreach
Provide septic & sanitary system education
Provide pet waste education & signage
Provide lawn care education
Provide educational signage
Increase coverage of water quality in the media
Expand existing engagement programs
Objective 1 measures reduce the bacteria & nutrient pollution from human sources.
The effectiveness of a septic system depends on the soil’s ability to absorb and filter the wastewater and the proper maintenance of the septic system. When a septic system fails, untreated wastewater can seep into the groundwater or flow to streams and become a source of E. coli and nutrients. The EPA has identified malfunctioning septic systems as one of the top five sources of groundwater contamination in the county, highlighting the need for proper installation, regular maintenance, and periodic inspections to ensure their effective and safe operation. Repairing or replacing these failing systems reduces the E. coli, nitrogen, and phosphorus load to local waterbodies (Gibb, 2022).
If the option is available, property owners facing issues with their septic systems should consider the benefits of connecting to the City of Rock Hill’s sanitary sewer system. Sanitary sewers are less likely to fail than septic system, and even in cases of malfunction, the impact is often more contained and managed quickly to minimize environmental impacts. The Manchester Wastewater Treatment Plant is equipped with advanced technologies and processes to treat and purify the water to a much higher standard than what a septic system can achieve. The treated water is safe enough to be released into rivers, lakes, or even used for irrigation.
1b. Install Rain Gardens
Rain gardens offer an aesthetically pleasing solution for stormwater management and are suitable for both residential and commercial environments. These gardens temporarily hold stormwater, allowing it to be naturally treated by native plants and soil infiltration.

DUTCHMAN CREEK WATERSHED RESTORATION PLAN DESCRIPTIONS OF MANAGEMENT MEASURES 46 45
Objective 1 Measures 1a. Repair, Replace, or Connect Failing Septic Systems
Pollutant Removal Effectiveness Cost Priority Area E. coli TN TP $2,400 Per System Connected* $1,775 Per System Fixed** Homes with Septic Systems
Figure 5.3 Rain Garden in Gig Harbor, WA (AARP, 2021)
Figure 5.2 Septic system fixes at a glance
*University of North Carolina (2015)
**Forbes (2023)
Pollutant Removal Effectiveness Cost Priority Area E. coli TN TP $4 Per Ft2 (Residential)* $25 Per Ft² (Commerical)* Residential and Commerical Areas
Figure 5.4 Rain gardens at a glance
*Interstate Commission on the Potomac River basin (2024)
Figure 5.1 Diagram of watershed objectives & management measures
Implement Sanitary Capital Improvement Plan
Damaged sanitary sewer lines present a significant environmental hazard because they discharge raw sewage directly into the ground and surface waters, and often are sited in low areas adjacent to surface waters. Sanitary sewer overflows (SSOs) are quickly addressed by City of Rock Hill staff, who repair the breaks and mitigate environmental impact. The City’s implementation of its Capital Improvement Plan (CIP) 20232028 will help to address the most urgent sewer infrastructure repairs and replacements and reduce the risk of future SSOs.

1c. 1e. 1d. 1f.
Remove Litter from Streams
Trash in streams is unsightly and can also contribute nutrients and other pollutants and provide food sources for E. coli bacteria. For example, plastic waste breaks down into microplastics that are ingested by a wide range of animals and harm their health. The current stream cleanups organized by the Catawba Riverkeeper and Keep York County Beautiful can be continued and expanded to address this issue.

Remove Litter from Streets
Compared with stream cleanups, removing litter from streets is significantly more efficient. On streets, volunteers collecting litter can stay dry and avoid the hazards of working in a stream area. Removing litter before it reaches waters avoids disruption and damage to aquatic ecosystems. Rock Hill Clean & Green organizes and promotes street cleanup events; these efforts can be continued and enhanced.

Sweep Streets
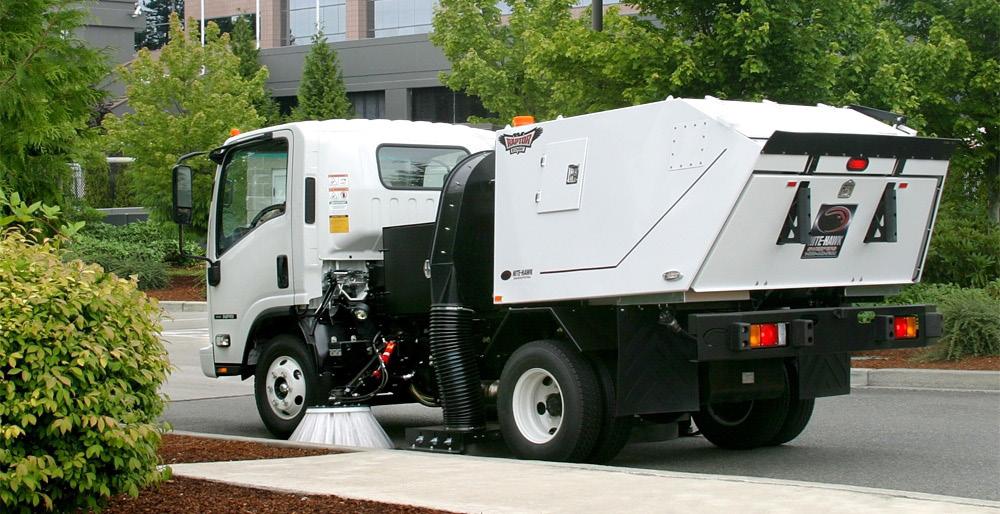
Streets collect debris, including pet/wildlife waste, leaf litter, yard clippings, trash, and soil, that can be a source of E. coli and nutrients. During storm events, streets become conveyances that carry this debris directly to the stream through the storm drainage system. Street sweeping is an efficient way to prevent these pollutants at the source. Ideally, a regular street sweeping schedule could be maintained for primary and secondary roads. Some communities repurpose the collected debris for beneficial uses, such as fill material (EPA, 2021).
DUTCHMAN CREEK WATERSHED RESTORATION PLAN DESCRIPTIONS OF MANAGEMENT MEASURES 48 47
Figure 5.5 Repaired section of sanitary sewer line (Paradise Plumbing)
Figure 5.9 Clean & Green volunteers remove trash from streets (Rock Hill Clean and Green)
Figure 5.7 Litter clogs the Catawba River (Random Connections)
Pollutant Removal Effectiveness Cost Priority Area E. coli TN TP $2.5 Million over 5 Years* Homes with Septic Systems
Figure 5.11 Street sweeper (North American Power Sweeping Association)
Pollutant Removal Effectiveness Cost Priority Area E. coli TN TP $8,065 per Ton of Litter* All Streams Pollutant Removal Effectiveness Cost Priority Area E. coli TN TP $94 per Mile of Street Swept* Primary & Secondary Roads
Figure 5.6 CIP implementation at a glance *City of Rock Hill (2023)
Figure 5.8 Stream litter removal at a glance
*Axios (2023)
Figure 5.12 Street sweeping at a glance
*Minnesota
Pollution Control Agency (2023)
Pollutant Removal Effectiveness Cost Priority Area E. coli TN TP $1,000 per Ton of Litter Removed* Primary & Secondary Roads
Figure 5.10 Street litter removal at a glance *York Daily Record (2019)
1g.
Convert Dry Detention Basins to Stormwater Wetlands
Dry detention basins have historically been a popular choice for urban stormwater management due to their ability to provide effective flood control over large areas. However, they are not very effective at removing nutrients or E. coli from stormwater. Transforming existing dry detention basins into stormwater wetlands is becoming a popular solution. Since the land for these basins is already graded and designated for stormwater management; conversion only requires a modification to the outlet structure and
the addition of wetland plantings. Stormwater wetlands offer substantial improvements over dry detention basins in terms of water quality enhancement. As water flows through the wetland, pollutants are naturally filtered out, both through settling and through biological processes inherent to the wetland ecosystem. Moreover, stormwater wetlands add significant aesthetic value to an area, creating visually appealing landscapes as opposed to the often barren appearance of dry detention basins (EPA, 2005).
Objective 2 Measures
Objective 2 measures reduce the
bacteria &
nutrient pollution from animal sources
Implement a Goose Egg Addling Program
Goose fecal matter presents a serious water quality concern due to its transmission of E. coli, TN and TP, usually directly adjacent to or in a waterbody. Addressing the issue of goose population control in a humane and effective manner is challenging. The most humane and effective strategy is egg addling, a process that prevents eggs from developing into goslings. This method involves treating eggs, preferably those that are 14 days old or younger with 100%
vegetable oil. The oil application obstructs the tiny pores on the eggshell, stopping the embryo’s development without harming the adult geese. This approach is more effective than simply destroying the eggs as geese will often renest and lay more eggs if their initial clutch is destroyed. Egg addling, therefore, presents a sustainable and ethical solution to managing goose populations and mitigating their environmental impact on waterbodies (USDA, 2022).
$165,000


DUTCHMAN CREEK WATERSHED RESTORATION PLAN DESCRIPTIONS OF MANAGEMENT MEASURES 50 49
Removal Effectiveness Cost Priority Area E. coli TN TP
per Addled Nest* Impoundments
Figure 5.16 Oiling goose eggs prevents embryo development (Star Tribune)
Pollutant
$60
Figure 5.15 Goose egg addling at a glance *University of Nebraska (2010) 2a.
Cost
Area
Pollutant Removal Effectiveness
Priority
E. Coli TN TP
per Conversion* Existing Dry Detention Ponds
Figure 5.13 Dry detention basin conversions at a glance *Fairfax County (2005)
Figure 5.14 Stormwater wetlands clean water well and look attractive (McAdams)
Provide Alternative Water Sources on Pastureland
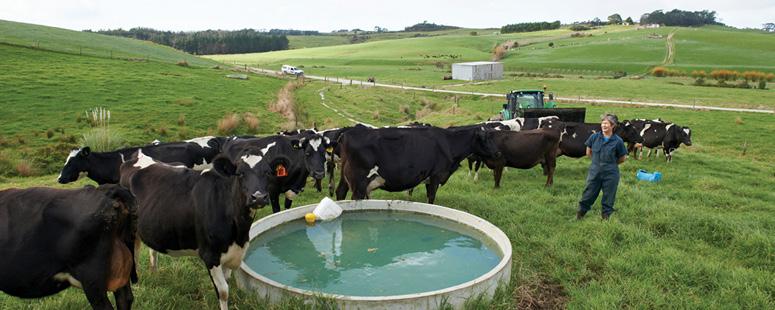
Providing alternative water sources for livestock on pasturelands supports both animal health and water quality protection. Traditionally, livestock wander down to the stream when they need water; however, this leads to contamination from animal waste and increased bank erosion due to animal traffic. By separating the animals from streams and offering them a distinct, clean
water supply, several benefits are achieved. For the livestock, the alternative water is generally cleaner and safer compared to surface waters, potentially improving their health. Moving the water source around the grazing area can also lead to more efficient and uniform grazing patterns, as livestock tend to congregate near water sources. 2b.
Exclude Livestock from Streams with Fencing
Fencing off streams to keep livestock out, combined with providing alternative water sources, is an effective dual strategy. It not only preserves water quality by preventing livestock from accessing natural streams, but also ensures that the animals’ need for drinking water is adequately met.


DUTCHMAN CREEK WATERSHED RESTORATION PLAN DESCRIPTIONS OF MANAGEMENT MEASURES 52 51
Removal Effectiveness Cost Priority Area E. coli TN TP $2 per linear foot of fence* Pasture
Pollutant
2c.
Figure 5.20 Livestock exclusion at a glance *Iowa State University (2012)
Figure 5.21 Five reasons to keep livestock out of rivers (The Freshwater Trust)
Figure 5.19 Livestock fencing (Western Pennsylvania Conservancy)
Removal Effectiveness Cost Priority Area E. coli TN TP $37 per Acre of Pasture Served* Pasture
Pollutant
*USDA, 2000
Figure 5.17 Alternative water sources at a glance
Figure 5.18 Cow conference by the water cooler (PGG Wrightson)
Objective 3 Measures
Provide Pet Waste Stations
Like goose waste, pet waste is a significant contributor to E. coli and nutrient pollution, particularly in urban and suburban areas. Remarkably, a single pet waste station can capture up to 2,250 pounds of dog waste annually, substantially reducing the pollutants entering the watershed. These stations are inexpensive to install and offer an opportunity for public education, reminding pet owners to dispose of their pets’ waste properly to preserve the cleanliness and safety of public spaces and water bodies (City of Kirkland, 2020).

Disconnect Household Downspouts
Downspouts typically function by channeling stormwater from roofs away from structures. In many instances, downspouts are directly connected to the storm drainage system through pipes or they discharge the water onto paved surfaces that discharge to the storm drainage system. Property owners with directly connected downspouts can disconnect their storm drains and instead direct the stormwater from the roof into gardens or lawns, where most of the water will infiltrate into the soil. This practice reduces the volume of stormwater
Increase Catch Basin Cleaning
As their name implies, catch basins often capture debris such as pet/wildlife waste, leaf litter, yard clippings, trash and soils, all of which are sources of E. coli and nutrients to streams. Regular cleaning of catch basins removes captured material and associated pollutants and has the added benefit of preventing blockages in the storm drainage system that can lead to flooding.

Objective 3 measures reduce the hydrologic impacts caused by development. Although the primary purpose of these measures is to address the increases in volume and velocity of stormwater that occurs when the natural landscape is replaced with roofs, roads, and other hardened surfaces, they also have some benefits for reducing E. coli and nutrients. Pollutant Removal
and helps to reduce the burden on stormwater pipes and channels. In addition, disconnecting downspouts enhances water quality because the stormwater is filtered through the soil, which removes E. coli and nutrients. Disconnecting downspouts can also provide a water source for landscaping (particularly if the homeowner chooses to store the stormwater in a rain barrel so it will be available after storm events). Overall, disconnecting downspouts is a simple yet effective step towards sustainable water management and conservation at the household level (Ruiz et al, 2017).

DUTCHMAN CREEK WATERSHED RESTORATION PLAN DESCRIPTIONS OF MANAGEMENT MEASURES 54 53
Effectiveness Cost Priority Area E. coli TN TP $100 per Downspout Disconnect * Residential Areas
Figure 5.26 Downspout disconnection at a glance. *Nick’s Window Cleaning (2017)
Figure 5.27 Downspout disconnect allows stormwater to recharge groundwater (The Pocket)
3a.
Effectiveness Cost Priority Area E. coli TN TP
per Station* Parks
2d.
Figure 5.22 Pest waste stations keep the grass fun for all (Recycle Away)
Pollutant Removal
$200
Figure 5.23 Pet waste stations at a glance *Bow Wow Waste (2024)
Effectiveness Cost Priority Area E. coli TN TP $300 per Basin Cleaned* Paved Roads
2e.
Figure 5.24 Cleaning dirty catch basins in the Big Apple (NYC Environmental Protection)
Pollutant Removal
Figure 5.25 Catch basin cleaning at a glance
*FEMA
(2020)
Provide Flood Attenuation & Storage Restore and Enhance Stream Buffers
The proliferation of streets, homes, and other infrastructure within the watershed increases the presence of impervious surfaces like asphalt, concrete, and roofs that do not absorb stormwater. Consequently, rainwater that would naturally percolate into the ground instead rapidly flows over these hard surfaces to streams that are overwhelmed by the volume and velocity of flows
that are reaching them. Flood attenuation and storage mechanisms, such as retention ponds, can be implemented to capture and temporarily hold stormwater, allowing it to be released gradually over time. This controlled release also provides some pollutant removal through a natural settling processes.

Stream buffers are the areas surrounding surface waters that typically extend 50 to 150 feet from the bank. Protecting buffers from development is required by the jurisdictions in this watershed because they have significant environmental benefits. Their primary function is to stabilize the stream bank from erosion and protect developed areas from flooding. The roots of the plants in a stream buffer filter and take up E. coli and nutrients and bacteria before they reach the
surface water areas. Areas that lack vegetation often experience accelerated streambank erosion, resulting in steep and sheer banks. These conditions not only degrade the aquatic habitat but also hinder access to the water for both people and wildlife. Stream buffer restoration and enhancement involves removing impervious surfaces from the buffer, grading eroded areas if needed, and providing native plantings.

DUTCHMAN CREEK WATERSHED RESTORATION PLAN DESCRIPTIONS OF MANAGEMENT MEASURES 56 55
Pollutant Removal Effectiveness Cost Priority Area E. coli TN TP $70,000 per Acre of Impervious Treatment* Entire Watershed
Figure 5.28 Flood attenuation & storage at a glance
3b. 3c.
*U.S. EPA (2021)
Figure 5.29 Retention pond components and operation (City of Naperville, Illinois)
Pollutant Removal Effectiveness Cost Priority Area E. coli TN TP $850 per Linear Foot of Buffer Restored* Poorly Vegetated Buffers
Figure 5.31 Stream buffer restoration and enhancement at a glance
*American Water Resources Association (2012)
Figure 5.30 Before and after buffer restoration (Urban Ecosystems)
Restore Eroding Streams Restore Floodplains
Floodplains offer a multitude of services that include flood protection, erosion control, and habitat for diverse wildlife. However, the development of many floodplains has significantly impaired their capacity to deliver these benefits. Floodplain restoration involves restoring a stream’s floodplain through voluntary buyouts of frequently flooded properties within the 3d. 3e.
After a watershed is developed, streams are subject to higher velocities and volumes of stormwater, resulting in the erosion of streambanks and loss of aquatic habitat. In addition, eroding streambanks themselves can become a source of sediment pollution. Stream restoration involves creating a new structure for a stream system that better matches the characteristics of the watershed. Restoring streams reduces stream bank erosion by diminishing the energy of flowing water, which lessens the erosive force exerted on the banks.
Stream restoration projects can also have a cooling effect by increasing vegetation and reducing sedimentation. During a restoration project, the stream bed and floodplain are usually regraded so that water can disperse over the floodplain during large storm events. This dispersion reduces the velocity of surface water, which minimizes erosion and improves the stream’s resilience to large storm events. Stream restoration projects also include removing invasive species and planting native plant species which enhances the removal of E. coli and nutrients.
floodplain and regrading of the floodplain so it can receive water from the stream when it overflows its banks. Floodplain restoration projects also include planting native species to strengthen the ecological integrity of these areas and bolster their resilience against erosive forces (National Wildlife Federation). The plantings remove TN and TP and reduce vulnerability to flooding.
November 2018


June 2021 Pre-Restoration

Post-Restoration

DUTCHMAN CREEK WATERSHED RESTORATION PLAN DESCRIPTIONS OF MANAGEMENT MEASURES 58 57
Pollutant Removal Effectiveness Cost Priority Area E. coli TN TP $850 per Linear Foot of Stream Restored* Eroded Streams
Removal Effectiveness Cost Priority Area E. coli TN TP $15,000 per acre of floodplain restored* Degraded floodplains
Figure 5.32 Eroding stream restoration at a glance *American Water Resources Association (2012)
Pollutant
Figure 5.34 Effectiveness of floodplain restoration *McAdams
Figure 5.33 Before and after, Methodist University stream restoration (McAdams)
Figure 5.35 Diagram of a floodplain & stream restoration (River Floodplain Restoration)
DUTCHMAN CREEK WATERSHED RESTORATION PLAN DESCRIPTIONS OF MANAGEMENT MEASURES 60 59 Management Measures Pollutant Removal Effectiveness Cost Priority Area E. coli TN TP Reduce Bacteria + Nutrients from Humans Repair, replace, or connect failing spetic systems $1,775 per system fixed Homes with septic systems $2400 per system connected Install rain gardens $4 per square foot (residential) Residential & commerical areas $25 per square foot (commerical) Implement Rock Hill’s wastewater CIP $2,500,000 per fiscal year 2025-2028 Main sanitary sewer lines Remove litter from streams $8,065 per ton of litter removed All streams Remove litter from streets $1,000 per ton of litter removed Primary & secondary roads Sweep streets $94 per mile of street swept Primary & secondary roads Convert dry detention ponds to wetlands $165,000 per conversion Existing dry detention ponds Reduce Bacteria & Nutrients from Animals Implement goose egg addling $60 per addled nest Impoundments Provide alternative water sources on pastureland $37 per acre of pasture served Pasture Exclude livestock from streams with fencing $2 per linear foot of fence Pasture Proivde pet waste stations $200 per pet waste station Parks Increase catch basin cleaning $300 per basin cleaned Paved roads Reduce Hydrologic Impacts of Development Disconnect household downspouts $100 per downspout disconnected Residential areas Provide flood attenuation & storage $70,000 per acre of impervious area treated Entire watershed Restore and enhance stream buffers $850 per linear foot of buffer restored Poorly vegetated buffers Restore eroding streams $850 per linear foot of stream restored Eroded streams Restore floodplains $15,000 per acre of floodplain restored Degraded floodplains
table
Figure 5.36 Pollutant removal and implementation cost estimate

6 Climate Change Considerations

Environmental Justice (EJ)
Watershed Demographics
The socio-economic indicators within the Big Dutchman Creek Watershed reflect a community that is more economically prosperous than South Carolina as a whole. Figure 7.1 shows that the watershed’s population boasts a median household income of $69,143, a figure that surpasses South Carolina’s overall median household income by a notable 17%. Furthermore, the poverty rate within the watershed stands at 9.3%, a rate that is 5.3% lower than the state’s average.

Figure 7.2 illustrates that the racial demographics also differ between the Big Dutchman Creek and the overall demographics of South Carolina. The Big Dutchman Creek Watershed’s white population is 5.8% greater than in the rest of the state. Consequently, other racial groups are less represented within the watershed.

7.2
Environmental Justice Considerations
Environmental Justice (EJ) plays a critical role in planning efforts as it ensures equitable access to natural resources and protection from environmental hazards for all communities, especially those that have been historically marginalized. By integrating EJ principles, the disproportionate impact of pollution and waterrelated issues on marginalized communities may be addressed, which fosters fairness in the distribution of environmental benefits and burdens. Involving marginalized communities in the planning process brings diverse perspectives and cultural lenses to the table and promotes more effective and culturally sensitive management strategies. This inclusive approach helps to create a sustainable and comprehensive Watershed Plan that is equitable to all community members.

Engaging with Leaders
Local community leaders should be engaged early and often when pursuing EJ. These leaders often have a deep understanding of the community’s dynamics and can provide valuable insights into the most effective methods of communication. They serve as bridges between the community and decision-makers, ensuring that the concerns and needs of different groups are brought to the forefront. Public input sessions should recognize and respect the contributions, heritage, and culture of all community members. This fosters a sense of respect and belonging but also ensures that water quality initiatives are responsive to the unique dynamics of each community. By embracing this approach, EJ becomes not just a policy initiative but a practice that genuinely resonates with and empowers the diverse voices it aims to represent.
Choosing the Public Forums
Deciding on the format for public input is also important. Options may include online platforms, town hall meetings, stakeholder groups, or other interactive forums. These sessions should be accessible to everyone, considering different schedules, locations, and preferences. By offering various formats, the likelihood of broad participation is increased, enabling voices from all corners of the community to be heard. Advertising the public input sessions through diverse channels also supports EJ. Using a variety of approaches that may include radio, print media, and social media ensures that the information reaches a wide audience. Each of these approaches have a different reach and impact, making it possible to engage with a broader spectrum of the community. Communication during these sessions should be inclusive and accessible. Offering options in non-English languages like Spanish and providing American Sign Language (ASL) if needed boosts inclusivity. Additionally, using non-technical language helps to demystify projects and make the information understandable and relatable to all community members.
DUTCHMAN CREEK WATERSHED RESTORATION PLAN ENVIRONMENTAL JUSTICE (EJ) 68 67
Figure
Demographics of watershed residents compared with South Carolina residents
Figure 7.3 Rock Hill, SC Christmas event (Southern Living, 2023)
$0 $20,000 $40,000 $60,000 $80,000 $100,000 $89,723 $81,580 $69,413 Median Income Average Income $58,234 White Black Hispanic or Latino 2+ Races Asian Pacific Islander American Indian & Alaskan Native 0% 10% 20% 30% 40% 50% 60% 70% 80% 68.9% 74.7% 26.3% 16.1% 6.6% 9.2% 2.2% 5.3% 2.0% 2.1% 0.6% 0.5% 0.1% 0.0%
Figure 7.1 Income of watershed residents compared with South Carolina residents
Distributing Benefits & Burdens
For new projects, the focus should be on creating a balance where the benefits are shared equitably across the community. This includes access to clean air and water, recreational spaces, and other environmental goods. Burdens, such as pollution or resource depletion, should not be disproportionately placed on certain groups, particularly those who are economically disadvantaged or belong to minority communities.

Equitable distribution requires a nuanced understanding of the community’s demographic and socio-economic landscape, ensuring that the outcomes of any environmental project do not exacerbate existing inequalities.
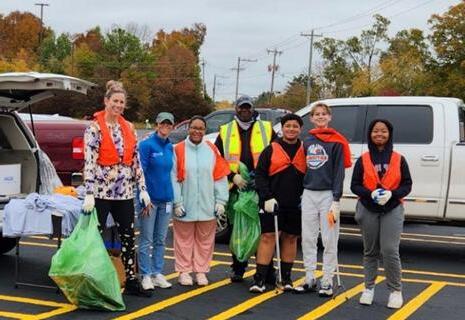

Removing Barriers
Removing barriers to existing benefits is another critical aspect of ensuring equitable access. These barriers can be economic, such as fees that limit access to certain amenities or services. For example, imposing a fee to enter a public park can exclude lower-income individuals and families, thus denying them the benefits of the space. Physical barriers, like fences or other structures that restrict access to environmental amenities, can also be obstacles. These barriers not only physically exclude people but can also symbolize social and economic divides, reinforcing feelings of exclusion and inequality.
Institutional barriers are often more challenging to identify and dismantle. These include policies and practices that prevent meaningful engagement of all community members in environmental decision-making. Institutional barriers could manifest as complex bureaucratic processes, lack of transparency, or a decision-making framework that does not consider the voices of marginalized groups. Overcoming these barriers requires a systemic change in how institutions operate and engage with communities.
In conclusion, EJ’s focus on equitable access requires a multi-dimensional approach that addresses various barriers and ensures fair distribution of environmental benefits and burdens. It demands a commitment to understanding and dismantling the structures that perpetuate inequality, ensuring that environmental policies and projects are inclusive and equitable for all community members.


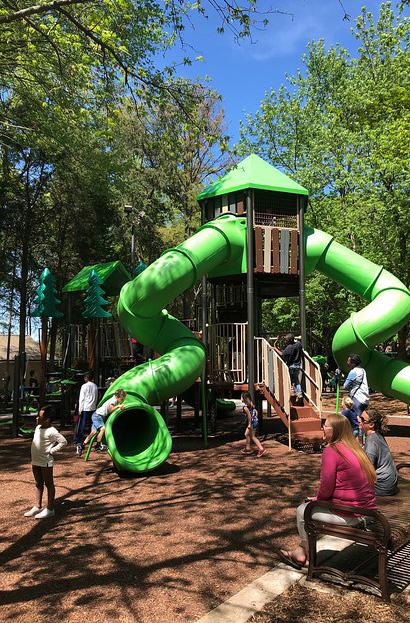
DUTCHMAN CREEK WATERSHED RESTORATION PLAN ENVIRONMENTAL JUSTICE (EJ) 70 69
Figure 7.4 Clean Up Aiken, SC Volunteers keep their community clean (Clean Up Aiken)
Figure 7.5 Clean Up Aiken, SC Volunteers keep their community clean (Clean Up Aiken)
Figure 7.6 Environmental Justice Guiding Principles (DHEC, 2024)
Figure 7.7 Keep American Clean Presidents Circle recognition (Rock Hill Clean and Green)
Figure 7.9 Cherrry Park Rock Hill (Flckr).
Figure 7.8 Northwestern High School Litter Clean Up Day (Rock Hill Clean and Green)

8 Financial & Technical Assistance

Financial & Technical Assistance
This section addresses EPA’s Element D – estimate amounts of technical and financial assistance and the relevant authorities to implement the plan.
Cost Estimate for Watershed Plan
The yearly cost of implementing the management measures is estimated in Figure 8.1. The total cost for all five years is approximately $12.6 million; however, of that cost $10.1 million is for the City of Rock Hill’s Wastewater Capital Improvement Plan (CIP). The remainder of the Watershed Plan implementation will cost $2.5 million.
DUTCHMAN CREEK WATERSHED RESTORATION PLAN FINANCIAL & TECHNICAL ASSISTANCE 72 71
Cost Per unit 2024-2027 2028-2031 2032-2035 2036-2039 Annual cost from 2040 onwards # Cost # Cost # Cost # Cost # Cost
Reduce Bacteria & Nutrients from Humans Repair & replace failing septic systems $1,775 per system fixed 15 $26,625 15 $26,625 15 $26,625 5 $8,875 Connect failing septic systems to sanitary sewer $2,400 per system connected 70 $168,000 70 $168,000 70 $168,000 25 $60,000 Install rain gardens (residential) $4 per square foot 250 $1,000 250 $1,000 250 $1,000 85 $340 Install rain gardens (commercial) $25 per square foot 125 $3,125 125 $3,125 125 $3,125 40 $1,000 Implement Rock Hill's wastewater CIP $2,500,000 per fiscal year 2025-2028 2 $5,000,000 1 $2,500,00 Remove litter from streams $8,065 per ton of litter removed -- -- -- -- 2 $16,130 8 $64,520 1 $8,065 Remove litter from streets $1,000 per ton of litter removed 5 $5,000 20 $20,000 5 $5,000 Sweep streets $94 per mile of street swept 120 $11,280 480 $45,120 120 $11,280 Convert dry detention ponds to wetlands $165,000 per conversion 2 $330,000 1 $165,000 2. Reduce Bacteria & Nutrients from Animals Implement goose egg addling $60 per addled nest 18 $1,080 24 $1,440 6 $360 Provide pet waste stations $200 per pet waste station 6 $1,200 12 $2,400 12 $2,400 3 $600 Increase catch basin cleaning $300 per basin cleaned 25 $7,500 100 $30,000 25 $7,500 Exclude livestock from streams with fencing $2 per linear foot of fence 80 $160 160 $320 160 $320 40 $80 Provide alternative water sources on pastureland $37 per acre of pastureland 80 $2,960 160 $5,920 160 $5,920 40 $1,480 3. Reduce Hydrologic Impacts from Development Disconnect household downspouts $100 per downspout disconnected 10 $1,000 20 $2,000 20 $2,000 5 $500 Provide flood attenuation & storage $70,000 per acre of impervious area treated 2 $140,000 Restore and enhance stream buffers $850 per linear foot of buffer restored -- -- -- -- -- -- 400 $340,000 100 $85,000 Restore eroding streams $850 per linear foot of stream restored 400 $340,000 100 $85,000 Restore floodplains $15,000 per acre of floodplain restored 8 $120,000 1 $15,000 4. Increase Education & Outreach Provide septic & sanitary system education $10,000 per year 1 $10,000 1 $10,000 1 $10,000 1 $10,000 0.25 $2,500 Provide pet waste education & signage $10,000 per year 1 $10,000 1 $10,000 1 $10,000 1 $10,000 0.25 $2,500 Provide lawn care education $2 per household or business 800 $1,600 800 $1,600 800 $1,600 200 $400 Provide educational signage $200 per installed sign 45 $9,000 Increase coverage of water quality in the media $10,000 per year 2 $20,000 4 $40,000 4 $40,000 4 $40,000 1 $10,000 Expand existing education program $5,000 per year 2 $10,000 4 $20,000 4 $20,000 4 $20,000 1 $5,000 Totals Total cost for period $5,059,000 $2,785,670 $331,980 $1,582,070 $615,480 Annual cost during period $1,264,750 $696,481 $82,995 $395,518
Figure 8.1 Estimated costs for Watershed Plan implementation
1.
Funding Sources & Partners
Successfully implementing this Watershed Plan will require funding and partners who can assist by providing volunteers and technical assistance. Specific expertise may be needed for management measure design, siting, and construction and implementing education and outreach programs. Figure 8.2 below provides information about programs and organizations that can help provide the needed resources.
1. Reduce Bacteria & Nutrients from Humans
Repair & replace failing septic systems
Connect failing septic systems to sanitary sewer
2. Reduce Bacteria & Nutrients from Animals
Implement goose egg addling
Provide pet waste stations
Increase catch basin cleaning
Exclude livestock from streams with fencing
Provide alternative water sources on pastureland
3. Reduce Hydrologic Impacts from Development
Disconnect household downspouts
4. Increase Education & Outreach
DUTCHMAN CREEK WATERSHED RESTORATION PLAN FINANCIAL & TECHNICAL ASSISTANCE 74 73
Funding Sources Volunteer Assistance Financial & Technical Assistance Section 319 SC State Revolving Fund USDA EQUIP FEMA BRIC Rock Hill SW Fee Rock Hill Clean & Green Catawba Riverkeeper Keep York Beautiful DHEC Watersheds Program York Co Cooperative Extension York Co Soil & Water
Figure 8.2 Sources of support for implementing the Watershed Plan
rain gardens
Install rain gardens (commercial)
Hill's wastewater CIP
from streams
from streets
to wetlands
Install
(residential)
Implement Rock
Remove litter
Remove litter
Sweep streets
Convert dry detention ponds
flood
Restore and enhance stream buffers Restore eroding streams Restore floodplains
Provide
attenuation & storage
septic & sanitary system education Provide pet waste education & signage Provide lawn care education Provide educational signage Increase coverage of water quality in the media Expand existing education program
Provide

9 Education & Outreach

Education & Outreach
This section addresses EPA’s Element E – develop an information/education component.
Overview
Engaging the community through education and outreach fosters awareness and understanding of watershed issues among the people who live, work, and play in the Big Dutchman Creek Watershed. Citizens who are well-informed about the impacts of their actions on the watershed are more likely to participate in conservation efforts and adopt environmentally responsible behaviors. Effective public education can also build community support for the Watershed Plan, ensuring sustained commitment and involvement from local stakeholders. Objective 4 of this Watershed Plan is to increase education and outreach by:
y Providing education for septic + sanitary systems;
y Providing pet waste education + signage;
y Providing lawn care education;
y Providing educational signage;
y Increasing coverage of water quality in the media; and
y Expanding existing engagement programs.
Public Feedback
“The trash problem in York County has gotten significantly worse in the decades I’ve lived here… How do we stop littering?”
“When I was a kid you could look into creeks & see lots of creatures swimming around. I looked into Little Dutchman Creek recently & saw no life.”
“Local government can help drive the conversation around water quality and bring groups together to find viable solutions.”
“Increase the communication for concerns like this. Too many people don’t even know what/ how/why anything is a problem.”
Current Public Perceptions
Public input was collected through ArcGIS’s web-based Survey123 platform. The survey was promoted via multiple channels to ensure broad community engagement. The local radio station WRHI advertised the survey and it was published on the official City of Rock Hill website. The survey garnered a total of 107 responses.
The survey was divided into two distinct versions based on the respondent’s selfreported familiarity with environmental issues. This approach ensured each respondent was presented with questions aligned to their familiarity with watershed issues.
A total of 19 respondent classified themselves as highly familiar with environmental issues and were directed to a more specialized version of the survey. This version incorporated in-depth questions regarding water quality and utilized industry-specific terminology.
The remaining respondents received a more generalized questionnaire, specifically designed to be comprehensible to a broad audience. A total of 88 respondents participated in this version of the survey.
80%
of environmental professionals characterized the watershed as some level of impaired.
77%
of all respondents said posting to social media is an effective method of public communication.
61%
of respondents said that they hiked in the watershed, with another 40% reporting that they swim or boat.
86%
of respondents said they support the construction of additional structural BMPs.
DUTCHMAN CREEK WATERSHED RESTORATION PLAN EDUCATION & OUTREACH 76 75
Ten Methods to Make it Fun and Creative
Many issues are competing for the attention of the public and it can be challenging to encourage the community to prioritize watershed protection. Ensuring that education and outreach activities are fun and creative will draw more attention from the public than a serious or even a negative message. Here are a few big picture tips to engage the public in the Big Dutchman Creek Watershed:
1. Engage audiences by offering interactive content like quizzes, polls, and contests. This approach captures attention and encourages participation, makes them feel connected to the watershed. Interactive content can be shared easily, increasing your brand's reach.
2. Some of these topics, particularly pet waste management, can easily be made humorous. People are much more likely to remember the message when you have made them laugh.
3. Use social media to cater to the ways in which younger generations receive information.
4. Set up tables where people are already gathered, including community events such as Catawba Fest, ChristmasVille, the Strawberry Festival and the Come-See-Me Festival, can spread the message much further than trying to hold a separate event solely focused on watershed issues.
5. Provide educational signage at relevant locations such as parks, stormwater BMPs, and in pet stores (for pet waste management) so people see the message at the moment when it is pertinent.
6. Engage local radio shows, like WRHI, to provide updates on the implementation of the Watershed Plan, ensuring the community stays informed and engaged. Work with local news stations such as WBTV, WCNC, or WSOC to showcase more significant watershed achievements and initiatives.
7. Continue to foster partnerships and create new ones to help spread the message.
8. Create an integrated campaign that uses a variety of media and approaches to be more effective. People generally need to hear a message multiple times from different sources before they will act.
9. Work with the Art Council of York County to create programs, exhibits, and events that promote watershed awareness and health.
10. Be willing to think outside the box on how to approach watershed education.
Outreach & Education Management Measures
State and local governments have already developed a wide variety of effective and entertaining outreach and education materials for the topics identified in this Watershed Plan. Before developing new materials, it is recommended to consider the resources that already exist and to borrow ideas and approaches that have already worked elsewhere.
Provide Septic & Sanitary System Education
Malfunctioning septic systems and leaking sanitary pipes are a source of E. coli and nutrient pollution. Property owners with septic systems need to hear the following messages:
Here’s how to recognize and respond to signs of service line or septic system malfunctions;
You can prevent failures and clogs by properly disposing of grease and toxic substances; and
Here’s how to maintain septic systems so it can protect your home, family and the environment.
How a Septic Tank System Works DHEC
Be Septic Safe Clemson Cooperative Extension
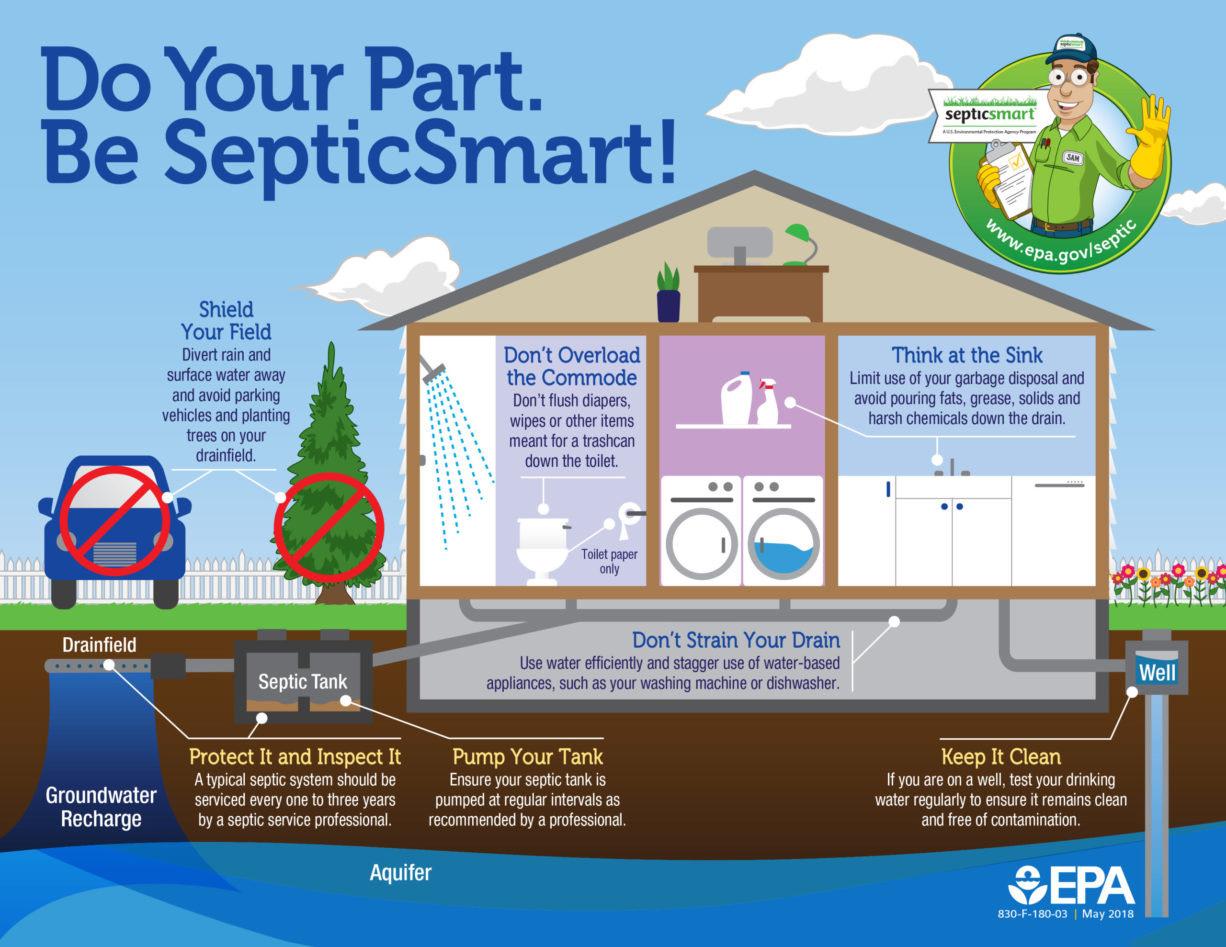
DUTCHMAN CREEK WATERSHED RESTORATION PLAN EDUCATION & OUTREACH 78 77
Figure 9.1 EPA “Do your part, be septic smart!” poster (EPA, 2024)
4a.
Resources From SepticSmart Educational Materials EPA
4b.
Provide Pet Waste Education & Signage
Pet waste is a source of E. coli and nutrients. Pet owners need to hear the following messages:
Cleaning up after you pets protects water quality and keeps outdoor amenities safe for everyone;
This is part of your responsibility as a pet owner; and
It just takes a little planning and effort to pick up after your pet.

4c.
Provide Lawn Care Education
Improper or excessive application of lawn care products is a significant source of nutrient pollution. Property owners and lawn care professionals need to hear the following
Applying lawn care products at the correct times, and in the correct amounts, protects water quality, keeps lawns lush, and saves money;
When too much fertilizer is applied to lawns, it can wind up in everyone’s streams and lakes and cause algal blooms; and
These algal blooms can be dangerous to humans and pets.

Water
Carolina
DUTCHMAN CREEK WATERSHED RESTORATION PLAN EDUCATION & OUTREACH 80 79
Figure 9.3 Organic lawn care infographic (TurfGrowers)
Resources From Please Clean Up After Your Pet Beaufort County, SC Trash the Poop Columbia, SC Pick it Up! Richland County, SC
Waste Management EPA
Your Duty to Pick up their Doody Durham, NC Scoop It, Bag It, Trash It! Maryland Dept. of Environmental Protection Resources From Grasscycling DHEC
Pet
It’s
Quality and Lawn Care NC State Cooperative Extension
Steps for Eco-Friendly Lawn Care Lawn Love
Lawn, Healthy Environment EPA
16
Healthy
Lawns: A Guide to Maintaining Quality Turf NC State Cooperative Extension
Figure 9.2 Pet waste education can be whimsical (Dog Poop Signs – A SmartSign Store)
Provide Educational Signage & Increase Coverage of Water Quality in the Media
A lack of familiarity with water quality issues can lead people to inadvertently take actions that negatively impact the health of the watershed. All residents need to hear the following messages:
Being knowledgeable and proactive when it comes to protecting water quality is everybody’s business;
There are many ways that individuals can affect everyone’s water quality; and
Stormwater BMPs require regular maintenance.

Expand Existing Education Programs
Residents want to help improve the environmental conditions within the watershed but may not know how. All residents need to hear the following messages:
There are many programs, initiatives, and ways to get involved with protecting water quality within the watershed; and
Your contributions can make a meaningful difference.
DUTCHMAN CREEK WATERSHED RESTORATION PLAN EDUCATION & OUTREACH 82 81
4d. 4e. Resources From What Does a Swim Advisory Mean? DHEC Carolina Clear – Rain Gardens WBTW Stream Bank Stabilization Upstate Forever Creek Friendly Wilmington, NC See It. Report It. Wilmington, NC Resources From Adopt a Stream Program DHEC & Clemson University Catawba Riverkeeper Catawba Riverkeeper Rock Hill Clean & Green City of Rock Hill Keep York County Beautiful York County, SC
Figure 9.4 Educational signage is an easy way to provide public education about stormwater issues (McAdams)
Figure 9.5 The Adopt-a-Stream program provides education while keeping waterways clean (DHEC)

10
Implementation Timeline & Milestones

Implementation Timeline & Milestones
This section addresses EPA’s Elements F and G – develop a project schedule and describe the interim, measurable milestones.
Overview
The most important part of Watershed Planning is to implement the management measures. This process is more successful if each management measure is separated into a series of interim milestones with a schedule for each milestone, as shown in Figure 10.1a and 10.1b. The implementation timeline for this Watershed Plan puts education and outreach programs at
the beginning of the implementation process to engage citizens and stakeholders while planning for some of the on-the-ground measures is conducted. Goals and milestones will change over time as the Key Partners and others involved in implementing plan learn from their efforts and make refinements. This implementation timeline will likely be modified over time.
Determine location/content for signage
Design signage
Provide educational signage
Identify funding for signs
Install signs
Ongoing maintenance of signs
Determine which outlets to use
Create/update content
Increase coverage of water quality in the media
Identify funding & free coverage opportunities
Create/update schedule for media coverage
Execute media coverage plan
Expand existing engagement programs
Provide education for septic & sanitary systems
Repair/replace failing septic systems or connect failing septic systems to sanitary sewer
Determine needs of existing programs
Create & executes plan to address needs
Contact homeowners via mail & media
Provide workshops & educational materials
Identify funding sources/cost-share
Visit homes & determine solutions needed
Implement needed solutions
Ensure ongoing maintenance of solution
Identify funding sources/cost-share
Contact owners via mail & media
Install rain gardens (residential & commercial
Provide workshops & educational materials
Provide design & installation support
Ensuring ongoing maintenance of rain gardens
Time limited task
Ongoing Task
DUTCHMAN CREEK WATERSHED RESTORATION PLAN IMPLEMENTATION TIMELINE & MILESTONES 84 83
Milestones 2024 2025 2026 2027 2028 2029 2030 2031 2032 2033 2034 2035 2036 2037 2038 2039 2040+
Figure 10.1a Management measures implementation timeline
Management Measures
Provide alternative water sources on pastureland
Exclude livestock from streams with fencing
Provide pet waste education & signage
Provide pet waste stations
Contact pasture owners
Provide funding & technical assistance
Contact pasture owners
Provide funding & technical assistance
Design or select pet education materials
Provide education via vets & media
Install signs in parks & other targeted areas
Target locations to install pet waste stations
Identify funding
Install & maintain stations
Identify funding sources/cost-share
Disconnect household downspouts
Provide lawn care education
Implement goose egg addling
Contact homeowners via mail & media
Provide funding & technical assistance
Design or select lawn education materials
Distribute materials to property owners
Contact owners of ponds with geese
Identify funding
Implement addling
Convene existing outreach organizations
Assess & prioritize needs
Remove litter from streams & streets
Create a schedule for cleanup activities
Implement schedule
Assess & prioritize needs
Sweep streets
Increase catch basin cleaning
Restore & enhance stream buffers, eroding streams and impacted floodplains
Convert dry detention ponds to wetlands
Create a schedule for sweeping activities
Assess & prioritize needs
Create a schedule for cleaning
Identify priorities
Seek grant funding
Implement stream & buffer enhancements
Identify priorities
Seek grant funding
Implement dry detention pond conversions
Identify priorities
Provide flood attenuation & storage
Time limited task
Ongoing Task
Seek grant funding
Implement flood attenuation & storage
DUTCHMAN CREEK WATERSHED RESTORATION PLAN IMPLEMENTATION TIMELINE & MILESTONES 86 85
Management Measures Milestones 2024 2025 2026 2027 2028 2029 2030 2031 2032 2033 2034 2035 2036 2037 2038 2039 2040+
Figure 10.1b Management measures implementation timeline

11 Evaluation Criteria

Evaluation Criteria
This section addresses EPA’s Element H – identify indicators to measure progress.
Overview
The recommended management measures will be implemented by numerous organizations in multiple locations. Therefore, the contributors need to track their progress and to view the efforts of others. This will enable the Key Partners to make datadriven decisions about which measures are most cost-effective and emphasize those measures in future efforts. This section provides metrics for tracking implementation and a recommendation to create a digital watershed dashboard to facilitate seamless teamwork between partners.
Digital Watershed Dashboard
Benefits of a Digital Dashboard
Seamless Communication of Real-Time Data:
Immediately after data is entered by a Key Partner, it can be viewed by other partners and, if desired, the public.
Ability to View Data in a Map or List Format:
Watershed Plan data can be viewed on a map or in a list format based on the needs of different users. For Key Partners, this means the ability to cast either a wide or narrow net over the data, focusing on the details most pertinent to their roles and responsibilities. With interactive data visualizations, digital dashboards allow for improved decision-making process and continuous growth.
Ability to Connect Watershed Efforts with Water Quality Data:
Being able to simultaneously view the locations and timing of management measures with water quality data is the only way to draw conclusions about the effectiveness of the efforts.
Opportunity for Public Outreach
Evaluation Criteria
The tracking metric for each management measure is provided in Figure 11.2 below.
Overall Plan Objectives
A digital dashboard, like the example shown in Figure 11.1, is a powerful analysis tool that can allow Key Partners to track, analyze and report on Watershed Plan progress. This dashboard would be a repository of both locational and descriptive information for tracking the progress of Watershed Plan implementation. ArcGIS Survey123 is an excellent platform for digital dashboards because it integrates with existing GIS systems and can be customized based on the preferences of the watershed partners. Tracking Metric
If the dashboard were made publicly available, the successes and ongoing efforts of the Watershed Plan could be showcased, which would bolster community engagement and support. This approach would inform the public and foster a sense of collective responsibility and accomplishment.
Reduce E. coli load by 30% Concentration of E. coli in water samples
Reduce TN load by 15% Concentration of TN in water samples
Reduce TP load by 30% Concentration of TP in water samples
1. Reduce Bacteria & Nutrients from Humans
Repair & replace failing septic systems # of repaired/replaced septic systems
Connect failing septic to sanitary sewer # of homes converted to sanitary sewer
Implement Rock Hill’s wastewater CIP # of sanitary sewer repairs
Remove litter from streams Tons of litter removed from streams
Remove litter from streets Tons of litter removed from streets/ROW
Sweep streets Miles of streets swept
Convert dry detention ponds to wetlands # of wetland conversions
2. Reduce Bacteria & Nutrients from Animals
Implement goose egg addling # of addled goose nests
Provide pet waste stations # of installed pet waste stations
Increase catch basin cleaning # of catch basins cleaned
Exclude livestock from streams with fencing Feet of fencing installed along pastureland
Provide alternative water sources on pastureland Acres of pasture served by alternative water sources
3. Reduce Hydrologic Impacts from Development
Disconnect household downspouts # of household downspout disconnections
Provide flood attenuation & storage # of flood attenuation BMPs installed
Restore and enhance stream buffers Miles of restored/enhanced stream buffers
Restore eroding streams Miles of restored stream banks
Restore floodplains Acres of restored floodplains
4. Increase Education & Outreach
Provide septic & sanitary system education # of citizens educated about septic & sanitary systems
Provide pet waste education & signage # of citizens educated about pet waste
Provide lawn care education # of citizens educated about lawn care
Provide educational signage # of educational signs installed
Increase coverage of water quality in the media # of water quality news stories
DUTCHMAN CREEK WATERSHED RESTORATION PLAN EVALUATION CRITERIA 88 87
Figure 11.1 Example of digital tracking dashboard (McAdams)
Figure 11.2 Tracking metric for measurement measures

12 Monitoring

Monitoring
This section addresses EPA’s Element I – develop a monitoring component.
Overview
Without consistent and systematic monitoring, it is impossible to determine if the implemented management measures are effectively enhancing water quality in the watershed. By conducting thorough water quality evaluations, the evaluation criteria can be compared against real world
conditions. This ensures that water quality improvements are on the right track and provides valuable insights for continuous improvement and adaptation of the management strategies.

Sampling Points
Water quality monitoring is currently limited to a single sampling point within the watershed. This point is situated near where the Big Dutchman Creek flows into the Catawba River and offers a valuable overview of the entire watershed’s health. While this single snapshot is informative, it lacks the nuances necessary to accurately assess the effectiveness of newly implemented management measures across the watershed. To address this limitation, this plan proposes establishing three additional monitoring points.
Access: At the bridge on W Oak Drive
Reason to Sample: The sampling results from this location will help assess if additional management measures are needed at the pastureland in the northwestern portion of the watershed.

Access: At the bridge on Twin Lakes Road
Reason to Sample: The sampling results from this location will help assess if additional management measures are needed at the airport.
The proposed points are labeled 1, 2, and 3 in Figure 12.1. These new locations have been chosen to provide a more comprehensive understanding of water quality issues throughout the watershed. The reasons for selecting these specific points, along with their locations and access methods, are detailed in Figure 12.2 below.

Access: From footpath at the end of Quiet Creek Dr (may need to obtain permission).
Reason to Sample: The sampling results from this location will help assess the impact of the denser development in the southeastern portion of the watershed.

Access: At the bridge on Mt Gallant Road
Reason to Sample: This is DHEC’s existing sampling location, and it shows the overall health of the watershed.
DUTCHMAN CREEK WATERSHED RESTORATION PLAN MONITORING 90 89
1 2 3 4 Pastureland Airport Dense Development *
Figure 12.1 Existing and proposed sampling points in watershed map
2 1 3 4
Adopt-a-Stream
N
Figure 12.2 Existing and proposed sampling points in watershed summary
*
Monitoring Point
Sampling Parameters
When? Samples from each monitoring site should be collected monthly. This is the same monitoring schedual implemented by DHEC and required by the Adopt-a-Stream program.
What? To monitor the success of this Watershed Plan, sampling results must include E. coli, Total Nitrogen (TN), and Total Phosphorus (TP). Including pH, Dissolved Oxygen (DO), and turbidity is recommended because these pollutants are often associated with development and agricultural activities. Including pH, DO and turbidity would also allow for a complete picture of whether this watershed meets DHEC’s water quality standards. In addition, expanding the list of parameters can also allow for early detection. Most of the effort in water quality monitoring is collecting the samples; testing for these extra parameters requires only minimal additional costs.
How? For those eager to play an active role in enhancing the water quality of the Big Dutchman Creek Watershed, participating in the Adopta-Stream program is an excellent opportunity. This program empowers community members by providing them with the necessary tools and training to collect valid water quality samples. By engaging in this initiative, participants can contribute to the sucess of this Watershed Plan.
DUTCHMAN CREEK WATERSHED RESTORATION PLAN MONITORING 92 91

13
References

References
Report References
Alabama Cooperative Extension System. (2022, February 1). Coliform bacteria in well water - Alabama Cooperative Extension System.
American Planning Association. (2023). Land-Based Classification Standards Activity Dimension with Descriptions.
American Water Resources Association. (2012, June). Is Urban Stream Restoration Worth It?
Art Council of York County. (2023). Home Page
Axios. (2023, August 31). More than 62,000 pounds of trash removed from Iowa rivers
Bow Wow Waste. (2024). Dog Waste Stations.
Catawba Riverkeeper. (2023). About Catawba Riverkeeper. Mission, History, & Vision.
Chestnut, D., & Rabon, B. (2020). Development and Adoption of the Escherichia coli Freshwater Water Quality Standard. South Carolina Bureau of Water.
City of Durham. (2023). It’s your duty to pick up their doody.
City of Kirkland. (2020). Pet Waste Bacteria Monitoring, Outreach and Education.
City of Rock Hill. (2022) Zoning Ordinance
City of Rock Hill. (2022, June 28). 2021 Water Quality Consumer Confidence Report.
City of Rock Hill. (2023). Bike Rock Hill
City of Rock Hill. (2023). Capital Improvement Plan 2023-2028.
City of Rock Hill. (2023). Rock Hill Clean & Green.
City of Rock Hill. (2023). Stormwater Fees.
City of Wilmington. (2023). Report Stormwater Pollution.
City of Wilmington. (2023). Stormwater Solutions.
Clary, J., Pechacek, L., Clark, S., Steets, B., & Pitt, R. (2014). Pathogens in Urban Stormwater Systems Pathogens in Wet Weather Flows Technical Committee.
Clemson Cooperative Extension. (2022, May 24). Be Septic Safe: Considerations for New Septic System Users, Locating the System, & Basic Maintenance
Clemson Cooperative Extension. (2023). Pet Waste & Water Quality.
Clemson Cooperative Extension. (2023). York County Extension Office.
Columbia Water. (2023). Trash the Poop.
Connecticut Department of Energy & Environmental Protection. (2022, March 31). Problems with Canada Geese.
Fairfax County. (2005). Popes Head Creek Watershed Management Plan.
Federal Emergency Management Agency. (2020, February 4). Debris Removal from Catch Basins.
Federal Emergency Management Agency. (2020, July 8). Flood Zones.
Federal Geographic Data Committee, Wetlands Subcommittee. (2013). Classification of Wetlands and Deepwater Habitats of the United States (FGDC-STD-004-2013) U.S. Fish and Wildlife Service.
Forbes. (2023, April 20). How Much Does Septic Tank Repair Cost?
Gibb T., M. E. (2022, January 21). Nutrients from septic systems can impact well and Surface Water. Michigan State University Extension.
Report References
Gould, Kevin. (2012, March 26). Watering Systems for Grazing (E3097). Michigan State University Extension.
Interstate Commission on the Potomac River Basin. (2024). How to Create a Rain Garden.
Iowa State University. (2012, February). Estimated Costs for Livestock Fencing
Klapproth, J. and Johnson, J. (2009). Understanding the Science Behind Riparian Forest Buffers: Effects on Plant and Animal Communities. Blacksburg, VA: Virginia Polytechnic Institute and State University. Publication 420-152.
Lawn Love. (2023, November 21). 16 Steps for Eco-Friendly Lawn Care.
Li, X et al. (2017). Fate of Nitrogen in Subsurface Infiltration Systems for Treating Secondary Effluent. Water Science Engineering.
Lusk, M., Toor, G, and Obreza, T. (2019). Onsite Sewage Treatment and Disposal Systems: Phosphorus. University of Florida Extension.
Minnesota Pollution Control Agency. (2022, November 1). Overview, water quality benefits, and other co-benefits of street sweeping Minnesota Stormwater Manual.
Minnesota Pollution Control Agency. (2023). Cost considerations for establishing and maintaining a street sweeping program.
Montomery County Department of Environmental Protection. (2023). Pet Waste.
Museum of York County. (2023). History.
National Oceanic and Atmospheric Administration. (2023). Global Summary of the Year (GSOY), Version 1.
National Wildlife Federation. (2023). Protecting and Restoring Floodplains.
News Center. (2023, May 30). Restoring Streams to Help the Environment.
Nick’s Window Cleaning. (2017, May 12). What is a Downspout Disconnection and Why Do It?
North Carolina Department of Environment and Natural Resources. (2022, September 7). Jordan Lake Riparian Buffer Rules.
North Carolina Department of Environmental Quality. (2023). Stormwater Nutrient and Phosphorus (SNAP) Accounting Tool.
North Carolina State University Extension. (2021, July 2). Carolina Lawns: A Guide to Maintaining Quality Turf in the Landscape.
North Carolina State University Extension. (2022, July 29). Water Quality and Professional Lawn Care
North Carolina Wetlands. (2019, November 20). What-when-where-who of NC wetlands: North Carolina wetlands.
Rhea, D. (2022, August 24). What is sediment and why is it a stormwater pollutant? Penn State Extension
Richland Countywide Stormwater Consortium. (2023). Pick it Up!
Ruiz, Nelly, et al. (2017, May). Minimizing Stormwater Runoff by Disconnecting Residential Downspouts Oklahoma State University Extension
Schueler, T. 1995. The architecture of urban stream buffers. Watershed Protection Techniques, 1(4), 155-163.
South Carolina Department of Health and Environmental Control. (2023). SC Watershed Atlas.
South Carolina Department of Health and Environmental Control. (2023). Adopt-A-Stream Program.
DUTCHMAN CREEK WATERSHED RESTORATION PLAN REFERENCES ii i
Report References
South Carolina Department of Health and Environmental Control. (2023). South Carolina 303(d) List of Impaired Waters & TMDLs.
South Carolina Department of Health and Environmental Control. (2023). Sanitary Sewer Overflow List. DHEC Online Services.
South Carolina Department of Health and Environmental Control. (2023). Calculating Bacterial Load Reductions in South Carolina for GRTS Reporting. Bureau of Water.
South Carolina Department of Health and Environmental Control. (2012). Watershed Water Quality Assessment: Catawba River Basin. Technical Report No. 1109-12. Bureau of Water.
South Carolina Department of Health and Environmental Control. (2022). South Carolina Simplified Guide to Developing Watershed-Based Plans.
South Carolina Department of Health and Environmental Control. (2022, June 30). The State of South Carolina’s 2020 and 2022 Integrated Report (IR).
South Carolina Department of Health and Environmental Control. (2012, June 22). Regulation 61-69: Classified Waters.
South Carolina Department of Health and Environmental Control. (2014, June 27). Regulation 61-68: Water Classifications and Standards
South Carolina Department of Health and Environmental Control. (2023). Section 319 Grant
South Carolina Department of Health and Environmental Control. (2023). State Revolving Fund (SRF) Program.
South Carolina Department of Health and Environmental Control. (2023). How a Septic Tank System Works.
South Carolina Department of Health and Environmental Control. (2023). Grasscycling.
South Carolina Department of Health and Environmental Control. (2023). Beach Monitoring
South Carolina Department of Natural Resources. (2023). South Carolina Hurricanes.
South Carolina Emergency Management Division. (2023). Building Resilient Infrastructure and Communities (BRIC).
South Carolina Legislature. (2023). Title 48 – Envirionmtnal Protection and Conservation. Chapter 1. Pollution Control Act.
U.S. Census Bureau. (2020). 1970-2020 census of Population and Housing. Department of Commerce, Economics and Statistics Administration
U.S. Census Bureau. (2022) American Community Survey. American Community Survey Office
U.S. Department of Agriculture. (1986, June). Urban Hydrology for Small Watersheds – TR-55 National Resources Conservation Service.
U.S. Department of Agriculture. (2000). Agricultural Resources and Environmental Indicators, Ch. 2.1.
U.S. Department of Agriculture. (2009, January). National Engineering Handbook Chapter 7Hydrologic Soil Groups. National Resources Conservation Service.
U.S. Department of Agriculture. (2018). The Use of Egg Addling in Wildlife Damage Management. Wildlife Services.
U.S. Department of Agriculture. (2023). Environmental Quality Incentives Program.
U.S. Department of Agriculture. (2023). Riparian forest buffers. Riparian Forest Buffers
U.S. Environmental Protection Agency. (2004, September). Healthy Lawn Healthy Environment: Caring for Your Lawn in an Environmentally Friendly Way.
U.S. Environmental Protection Agency. (2005, November) National Management Measures to Control Nonpoint Source Pollution from Urban Areas .
Report References
U.S. Environmental Protection Agency. (2013). Pollutant Load Estimation for Water Quality Monitoring Projects. National Nonpoint Source Monitoring Program.
U.S. Environmental Protection Agency. (2021, December). Stormwater Best Management Practice: Parking Lot and Street Sweeping
U.S. Environmental Protection Agency. (2021, December). Stormwater Best Management Practices –Dry Detention Ponds.
U.S. Environmental Protection Agency. (2023). Glossary.
U.S. Environmental Protection Agency. (2023, February). Stormwater Best Management Practice Pet Waste Management.
U.S. Environmental Protection Agency. (2023, March 6). CADDIS Volume 2: Nutrients.
U.S. Environmental Protection Agency. (2023, November 14). Overview of Total Maximum Daily Loads (TMDLs).
U.S. Fish & Wildlife Service. (2023). National Wetlands Inventory
U.S. Fish and Wildlife Service. (2023). Wetlands
U.S. Geological Survey. (2018, June 5). Phosphorus and Water. Water Science School
U.S. Geological Survey. (2018, May 21). Nitrogen and Water. Water Science School.
U.S. Geological Survey. (2023). What are wetlands?
University of Nebraska. (2010). Using a Cost-Effectiveness Model to Determine the Applicability of OvoControl G to Manage Nuisance Canada Geese.
University of North Carolina. (2015, May 26). How much does it cost to connect to a water and wastewater system?
Upstate Forever Land Conservation. (2021, January 28). Brushy Creek stream bank strengthened in Greer’s Century Park.
WBTW News 13. (2018, July 18). Carolina Clear – Rain Gardens.
York County Soil & Water Conservation District. (2023). Home Page.
York County, SC. (2023). Keep York County Beautiful & Volunteer Programs.
York County. (2022, February 21). York County Code of Ordinances Chapter 155: Zoning Code.
York Daily Record. (2019, December 9). Litter costs money, and guess what? You’re paying for it. Here’s how to prevent it.
DUTCHMAN CREEK WATERSHED RESTORATION PLAN REFERENCES iv iii
Photograph and Figure References
American Association of Retired Persons (2021, April 13). 5 Steps to Build a Serene Rain Garden.
Alabama Cooperative Extension System. (2022, February 1). Coliform bacteria in well water - Alabama Cooperative Extension System.
Army Corps of Engineers. (2023). Corps Lakes Photo Album
Carolina Thread Trail (2023). Local Trail.
City of Austin Texas. (2023). Bottomland: Life on the Floodplain
City of Fargo. (2023). Sanitary Sewer Example.
City of Naperville. (2023). Stormwater Pond Maintenance
Clean Up Aiken. (2023). Facebook Media
Clemson Cooperative Extension. (2023). Example of incision
Dog Poop Signs. (2023). Humorous Polite Dog Poop Sign: Be Responsible Or Train Your Dog To Be!
Encyclopædia Britannica, inc. (2023). Water Pollution
Environmental and Energy Study Institute. (2022, June 2). Q&A: How the Savanna Institute is Helping Agroforestry Thrive in the Midwest.
Flckr. (2019, April 17). Grand Opening Celebration.
Greenville News. (2017). City begins restoration project on Reedy Falls.
Highland. (2022, May 19). Riparian Plant Walk at Highland.
Independent Mail. (2020, January 3). River and creek flooding around Clemson
Keep Your County Beautiful. (2021). Facebook Photo. Facebook.
Minnesota Pollution Control Agency. (2023). Keep your septic system healthy.
Museum of York County (2021). Ice Age Exhibit. Facebook
North American Power Sweeping Association. (2023). Chicago Street & Lot Sweeping Partners.
North Carolina Wetlands. (2019, November 20). What-when-where-who of NC wetlands: North Carolina wetlands.
NYC Environmental Protection. (2021). State of the Sewers
Paradise Plumbing. (2023). Broken Sewer Lateral Spot Repair in Santa Barbara.
PGG Wrightson. (2020). Water – the forgotten nutrient.
Public Health notes. (2018). Impacts of urban heat island.
Random Connections. (2023). Landsford Canal Lilies and the Catawba River
Recycle Away. (2023). 10 Gallon Barrel Dog Waste Station.
River Floodplain Restoration. (2020, September 27). Nutrient Retention in Ecologically Functional Floodplains: A Review.
Rock Hill Clean & Green. Facebook Photo. Facebook.
Socratic. (2016, April 24). What is the phosphorus cycle?
South Carolina Department of Health and Environmental Control (2024). Guiding Principles (EJ)
South Carolina Department of Health and Environmental Control (2024). Adopt-A-Stream Program.
Southern Living. (2023, November 2). Rock Hill, South Carolina, Transforms Into ChristmasVille Every Winter.
Star Tribune. (2021). Rochester’s bid to control its goose population sparks controversy.
The Freshwater Trust. (2015). Infographic: 5 Reasons to Keep Livestock Out of Rivers.
Photograph and Figure References
The Augusta Chronicle. (2011). York County officials identify 3 killed in storm that also injured 5 others
The Pocket. (2023). The PCA Downspout Disconnection Project.
The Post and Courier. (2020). Green roofs, walls gain momentum in South Carolina.
Three Lakes Association. (2017, January 12). Nonpoint Source Pollution.
TurfGrowers. (2023). Organic Lawn Care Infographic.
U.S. Department of Agriculture. (2021, March 12). Climate change and the future of Southern wetlands.
U.S. Environmental Protection Agency. (2023). SepticSmart Education Materials.
U.S. Environmental Protection Agency. (2024, January 10). Do Your Part Get SepticSmart Infographic
University of Maryland (2016). Upper Potomac Headwaters Conceptual Diagram Center for Environmental Science.
Vac-Tec Septic & Water LLC. (2023). Septic Tank Pumping. The Blue Book.
Vermont Public. (2017, December 15). Nitrate Risk Near Farms: A Hydrogeologist Explains
Western Pennsylvania Conservancy. (2023). Streambank Fencing and Crossings.
York County Clean and Green. (2023). Facebook Photos
DUTCHMAN CREEK WATERSHED RESTORATION PLAN REFERENCES vi v
Geographic Information System References
Open Data Hub for York County South Carolina. (2023). Jurisdiction Boundaries [Data Set] York County South Carolina.
The National Map. (2017). NHDPlus High Resolution [Data Set]. U.S. Geological Survey.
Open Data Hub for York County South Carolina. (2023). Flood Hazard Zone Areas (DFIRM 2017) [Data Set] York County South Carolina.
City of Rock Hill. (2022). Zoning Ordinance
York County. (2022). Code of Ordinances
Digital Coast: Data Access Viewer. (2021). USDA NAIP 4-Band 8 Bit Imagery: South Carolina [Raster] National Oceanic and Atmospheric Administration.
National Land Cover Database. (2019). NLCD 2019 Land Cover [Data Set]. Multi-Resolution Land Characteristics Consortium.
Open Data Hub for York County South Carolina. (2023). Existing Land Use [Data Set]. York County South Carolina.
Open Data Hub for York County South Carolina. (2023). Parcels [Data Set] York County South Carolina.
SC Watershed Atlas. (n.d.). Livestock Operations [Data Set] South Carolina Department of Health and Environmental Control.
Web Soil Survey. (2020). Soil Survey Geographic (SSURGO) Database for York County, South Carolina [Data Set]. U.S. Department of Agriculture, Natural Resources Conservation Service.
National Wetlands Inventory. (2023). Wetlands Data Layer [Data Set] U.S. Fish and Wildlife Service
The National Map. (2020). USGS 1/3 Arc Second DEM [Raster] U.S. Geological Survey.
Open Data Hub for York County South Carolina. (2021). Public Water Supply Intakes [Data Set] York County South Carolina.
City of Rock Hill. (2023). SewerOver [Data Set]. Personal Communication.
South Carolina Department of Health and Environmental Control. (2023). SSO List [Data Table]
City of Rock Hill. (2023). SampleData [Data Set]. Personal Communication.
Geographic Information Section (2023). 2022 Water Quality Assessments and 303(d) list [Data Set]. South Carolina Department of Health and Environmental Control.
Open Data Hub for York County South Carolina. (2023). TMDL Monitoring Stations [Data Set] York County South Carolina.

Spring 2024
Big Dutchman Creek Watershed Plan


 Spring 2024
Big Dutchman Creek Watershed Plan


 Figure 6.7 Urban heat island effect (Public Health Notes)
Rural regions have larger evapotranspiration rates and open spaces reflect solar energy out into space
Cities have less evapotranspiration and buildings trap solar radiation
Figure 6.8 A green roof on the rooftop terrace at the SkyGarden Apartment in Charleston, SC (The Post and Courier)
