Transport Improvement Study

A75 Gretna - Stranraer
A77 Ayr - Stranraer
Economic Activity and Location Impacts Report
Foreword
The A77 Action Group was first formed in October 2016. The establishment of the Action Group, now recognised as the A77 Campaign Team, was as a result of years of neglect and lack of investment to the road infrastructure in the South West of Scotland and followed years of individuals campaigning over the many decades dating back to 1936 when the Maybole bypass was first pegged out and, again, in the early 1980’s when it was raised at Westminster to dual carriageway the A77 to Stranraer.
Working alongside partners in the local authorities on both sides of the Irish Sea, the A77 Campaign Team welcome Dumfries and Galloway Council, South Ayrshire Council and Mid and East Antrim Borough Council bringing forward their Economic Activity and Location Impacts (EALI) Report that all three Councils have been working hard in partnership to produce.
This EALI Report will add to the weight of evidence being gathered supporting the need for improving the A75 and A77 trunk roads to dual carriageway standards. This will boost the local economy and strengthen Stena Line’s case for having a proper road system serving the International Ports of Cairnryan with its intended massive £500 million green investment which would make Lochryan Port the first Green Port in the whole of the UK and on the North Channel Sea Crossing, provided the trunk roads are upgraded.
The EALI Report will not only provide valuable information on the effect the poor conditions of the A75 and A77 trunk roads have on the region’s economy, but it will also provide valuable information for attracting real inward investment that is needed to develop our manufacturing base thereby, creating jobs, increase our gross domestic product and, essentially, outline what it will mean to have faster access to National and European markets. On top of these benefits, it will build on our tourist market by making connectivity much easier with the upgrading of these arterial routes to the Central belt of Scotland, the rest of the UK and Europe through Southern Ireland.
The improvements to these trunk roads will assist in reaching Climate Change targets by reducing greatly the CO2 emissions that the environs are subjected to on a daily basis in towns and villages on the A77 and will see the roads made safer for the communities, as witnessed just how dangerous these trunk roads are with the recent road traffic accident (RTA) at Crocketford on the A75. A frequent occurrence on both trunk roads with RTA’s causing the trunk roads to be closed for lengthy times almost on a weekly basis. The Strategic and Economic Launch Event is welcomed by the A77 Campaign Team who were instrumental at bringing together the 3 Local Authorities. It will be for the Scottish and UK Governments to demonstrate that they can put aside Political Party ideology and work together to bring about the improvements the A75 and A77 arterial trunk roads need to bring them up to dual carriageway standards.

A77 Campaign Team

Contents 1 INTRODUCTION........................................................................................ 5 1.1 Overview 5 1.2 Project Background 6 1.3 The Process 8 1.4 Economic Activity and Location Impacts Report 8 2 TRANSPORT BASELINE 10 2.1 Overview . . . . . . . . . . . . . . . . . . . . . . . . . . . . . . . . . . . . . . . . . . . . . . . . . . . . . . . . . . . 10 2.2 A75 . . . . . . . . . . . . . . . . . . . . . . . . . . . . . . . . . . . . . . . . . . . . . . . . . . . . . . . . . . . . . . 10 2.3 A77 . . . . . . . . . . . . . . . . . . . . . . . . . . . . . . . . . . . . . . . . . . . . . . . . . . . . . . . . . . . . . . 13 2.4 Road Safety . . . . . . . . . . . . . . . . . . . . . . . . . . . . . . . . . . . . . . . . . . . . . . . . . . . . . . . . . 17 2.5 Existing Accessibility and Connectivity 18 2.6 Existing Port and Ferry Connectivity 24 2.7 Summary of Transport Background/ Key Findings 26 3 SOCIO-ECONOMIC BASELINE 27 3.1 Overview 27 3.2 Geography of the Data . . . . . . . . . . . . . . . . . . . . . . . . . . . . . . . . . . . . . . . . . . . . . . . . . . . 27 3.3 Demographics and Socio-Economic Profile . . . . . . . . . . . . . . . . . . . . . . . . . . . . . . . . . . . . . . . 28 3.4 Economic Performance . . . . . . . . . . . . . . . . . . . . . . . . . . . . . . . . . . . . . . . . . . . . . . . . . . . 42 3.5 Tourism . . . . . . . . . . . . . . . . . . . . . . . . . . . . . . . . . . . . . . . . . . . . . . . . . . . . . . . . . . . . 46 3.6 Property 49 3.7 Local Development Plans – Allocated Sites 52 3.8 Summary 58 4 PUBLIC ENGAGEMENT 59 4.1 Introduction 59 4.2 Engagement Objectives . . . . . . . . . . . . . . . . . . . . . . . . . . . . . . . . . . . . . . . . . . . . . . . . . . 59 4.3 Methods of Engagement . . . . . . . . . . . . . . . . . . . . . . . . . . . . . . . . . . . . . . . . . . . . . . . . . . 59 4.4 Promotional Strategy . . . . . . . . . . . . . . . . . . . . . . . . . . . . . . . . . . . . . . . . . . . . . . . . . . . . 61 4.5 Feedback Survey Results 61 4.6 Summary 65 5 BUSINESS ENGAGEMENT 66 5.1 Introduction 66 5.2 Engagement Objectives 66 5.3 Business Survey . . . . . . . . . . . . . . . . . . . . . . . . . . . . . . . . . . . . . . . . . . . . . . . . . . . . . . . 66 5.4 Summary . . . . . . . . . . . . . . . . . . . . . . . . . . . . . . . . . . . . . . . . . . . . . . . . . . . . . . . . . . 76
6 TRANSMISSION MECHANISMS .......................................................................... 77 6.1 Overview . . . . . . . . . . . . . . . . . . . . . . . . . . . . . . . . . . . . . . . . . . . . . . . . . . . . . . . . . . . 77 6.2 Recapping the Problem. . . . . . . . . . . . . . . . . . . . . . . . . . . . . . . . . . . . . . . . . . . . . . . . . . . 77 6.3 Transport Economic Efficiency . . . . . . . . . . . . . . . . . . . . . . . . . . . . . . . . . . . . . . . . . . . . . . 77 6.4 W ider Economic Impacts Results – Static 80 6.5 W ider Economic Impacts Results – Transformational Impacts 81 6.6 W ider Spatial and Social Context Results - Additional Welfare Benefits 82 6.7 Rail Freight Benefits 86 6.8 Summary . . . . . . . . . . . . . . . . . . . . . . . . . . . . . . . . . . . . . . . . . . . . . . . . . . . . . . . . . . . 88 7 ECONOMIC ACTIVITY AND LOCATION IMPACTS............................................................. 89 7.1 Overview . . . . . . . . . . . . . . . . . . . . . . . . . . . . . . . . . . . . . . . . . . . . . . . . . . . . . . . . . . . 89 7.2 EALI Assessment . . . . . . . . . . . . . . . . . . . . . . . . . . . . . . . . . . . . . . . . . . . . . . . . . . . . . . 89 7.3 Summary 94 8 CONCLUSION 96 8.1 Overview 96 8.2 Transport Connectivity 96 8.3 The South West Scotland Economy 96 8.4 Economic Activity and Location Impacts . . . . . . . . . . . . . . . . . . . . . . . . . . . . . . . . . . . . . . . . 97
1 Introduction
1.1 Overview
Sweco uK Ltd was commissioned jointly by dumfries & Galloway, South Ayrshire, and Mid & East Antrim Borough Councils to produce an Economic Activity and Location Impacts (EALI) report for a package of proposed improvements to the A75 and A77 trunk roads.

The A75/A77 Trunk roads are the key strategic corridors serving the Ports of Cairnryan and they account for all passenger journeys and freight movements between mainland uK and northern Ireland via the Cairnryan-Larne and Cairnryan-Belfast crossings. They are, therefore, assigned the highest level of functionality of any transport link in the region.
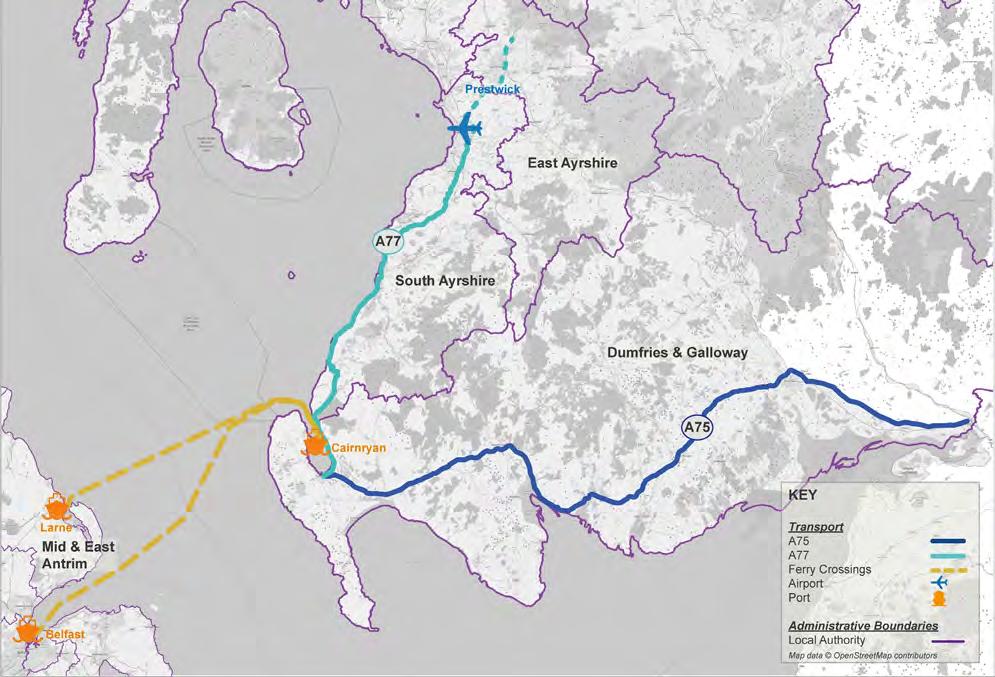

The A75 travels east-west through the dumfries & Galloway Council area and meets the A77 at Stranraer, before the A77 travels north past the Ports of Cairnryan and through the East and South Ayrshire Council areas. Cairnryan is Scotland’s main port for carrying good and passengers to northern Ireland and sailings arrive in Larne, situated in the Mid and East Antrim Borough Council area, and Belfast.
The relevant geography is presented in Figure 1-1.
5 ECONOMIC ACTIVITY AND LOCATION IMPACTS REPORT | 1 In T rodu CTI on
FIGURE 1-1: A75 AND A77 GEOGRAPHY (EALI STUDY AREA)
1.2 Project Background
The A75 and A77 form part of what the recent ‘union Connectivity review1 (department for Transport, 2021) termed the northern Channel Corridor. The northern Channel Corridor is described as “critical for connectivity for passengers and freight between England, Scotland and northern Ireland” and Cairnryan is described to be “Scotland’s busiest port”, providing the shortest trip between Great Britain and northern Ireland .
despite their critical role for freight movements and domestic travel, the A75 and A77 are primarily single carriageway roads on which, in Scotland, heavy goods vehicles (HGVs) are limited to speeds of 40mph. Both routes also travel through several towns and villages where further speed limits and congestion negatively impact on journey time reliability and safety.
The A77 and A75 carry an estimated £67 million worth of goods per day
The routes have been subject to improvements by Transport Scotland, at various stages of completion at the time of writing, as presented in Table 1-1.
TABLE 1-1: EXISTING IMPROVEMENTS MADE TO THE A75 AND A77

Route Improvement
A752 dunragit Village Bypass
Increased overtaking opportunities at:
• Planting End to drumflower
• newton Stewart
• Hardgrove
• Cairntop to Barlae
• Barfil to Bettyknowes
A773 Maybole Town Bypass
Increased overtaking opportunities at:

• Park End to Bennane
• Glen App
Junction Improvements at Symington and Bogend Toll Addition of Climbing Lane at Haggstone
More recent studies have, however, concluded further improvements are required to both roads to alleviate current issues and better serve the port of Cairnryan. These include, but are not limited to, the following:
Union Connectivity Review
The review of uK connectivity, undertaken independently by Sir Peter Hendy on behalf of the uK Government, examines how best to improve road, rail, air and sea links across the uK and to bring forward funding to accelerate infrastructure projects. The A75 is identified as a crucial freight link, carrying “2 in 3 of all HGV traffic from the ports at Cairnryan” for travel onwards to England, while the A77 is noted as critical for journeys between Belfast, Glasgow and Aberdeen.
Cairnryan is also highlighted as Scotland’s busiest port, handling 2.7 million tonnes of domestic cargo in 2020 and the Cairnryan-Belfast crossing is the second busiest passenger ferry route between Great Britain and the island of Ireland with 1.3 million passengers annually. It is in this context that the following recommendations are made for the A75/ A77 trunk roads
“As a particularly poorly performing part of the proposed uKnET, and one which is critical for connectivity between northern Ireland and the rest of the uK, the uK Government should offer funding to support the upgrade of the A75 to improve journeys between northern Ireland and Great Britain.”
Union Connectivity Review (2021) p.45
“The review also encourages the Scottish Government to improve the A77 to support journeys between Belfast, Glasgow and Aberdeen.”
Union Connectivity Review (2021) p.45
1 department for Transport (2021) union Connectivity review, p.45
2 Transport Scotland (2021) A75 Projects, accessed 01/12/2021 at https://www.transport.gov.scot/projects/?q=a75
3 Transport Scotland (2021) A77 Projects, accessed 01/12/2021 at https://www.transport.gov.scot/projects/?q=a77
6 ECONOMIC ACTIVITY AND LOCATIONS IMPACTS REPORT | 1 In T rodu CTI on
Strategic Transport Projects Review 2 (STPR2) (Transport Scotland, 2021)
The STPr2 forms a Scotland-wide review of the strategic transport network across all transport modes, including walking, wheeling, cycling, bus, rail, and car, as well as reviewing wider island and rural connectivity. It was prepared to “guide the Scottish Government’s transport investment programme in Scotland for the next 20 years and help to deliver the vision, priorities and outcomes that are set out in the new national Transport Strategy (nTS2)”. Cairnryan is classified as a Major Port and is identified as one of the country’s key transport hubs, being at one end of the main freight corridor between Scotland and the island of Ireland. The A75 is stated to link the port with England, and the A77 with the Scottish Central Belt. Combined, the roads are estimated to carry a total of £67 million worth of goods per day. A number of improvements to both roads are included in the ‘options sifted in for further consideration through STPr2’ and will be progressed in line with the Scottish Transport Appraisal Guidance (STAG) process. These largely comprise road network improvements and are focused on the A75, with additional improvements assigned for the A77.
South West Scotland Transport Study (Transport Scotland, 2020)

The South West Scotland Transport Study (SWSTS) Initial Appraisal (‘The Study’) was published in January 2020. It sets out a key aim to “consider the rationale for improvements to road, rail, public transport and active travel on key strategic corridors” in the region and outlines “a particular focus on access to the ports at Cairnryan”.
The study takes a multi-modal approach and looks at the problems and opportunities for each mode and the interchanges between modes. For the road network, the following problems are identified:
• The mix of local and strategic traffic, high proportions of HGVs, and platooning (or convoys) of vehicles
• Limited overtaking opportunities due to single-carriageway roads and poor sightlines, road alignment and geometry

• A high number of unprotected right-hand turns
A range of data is provided to evidence these problems, including stakeholder opinions. It is said “travel times between the motorway network and the ports at Cairnryan are seen by many stakeholders as posing a threat to the future of the ports” (p.110).
As part of the STAG process, transport planning objectives (TPos) are set to inform the assessment of potential options/ interventions and align with the aim to address the identified issues of slow journey times; road safety concerns; lack of network resilience; and perceptions of poor journey quality on the road network. The overarching TPos are outlined as follows:
• TPo1 – reduce journey times across the strategic transport network in the study area to the ports at Cairnryan
• TPo2 – reduce accident rates and the severity of accidents on the trunk road network in the South West of Scotland
• TPo3 – Improve the resilience of the strategic transport network across the South West of Scotland
• TPo4 – Improve journey quality across the road, public transport, and active travel networks in the South West of Scotland
• TPo5 – Improve connectivity (across all modes) for communities in the South West of Scotland to key economic, education, health and cultural centres including Glasgow, Edinburgh, Ayr, Kilmarnock, and Carlisle
An extensive list of options was generated, and the initial sifting and packaging exercise resulted in 23 multi-modal option packages. The following option packages, presented in Table 1 2 were recommended for further appraisal.
Package Number Package Name
2 development of the Strategic Active Travel network
12 development of Enhanced diversionary routes and route Planning
13 development of Enhanced Service, rest Areas, and Laybys
14 HGV Speed Limit Increase
Package Description
Package of measures to develop the Strategic Active Travel network in the South West of Scotland to better connect communities, including cycle paths parallel to trunk roads and improvements to the national Cycle network.
Package of measures and improvements to develop the secondary road network which performs a function when the trunk road network is closed to increase resilience of the transport network.
Package of measures to deliver improved rest provision for all road users in the South West of Scotland, such as truck/lorry stops and rest facilities on the A75 and A77 and enhanced laybys for buses on main routes.
HGV speed limit increase to 50mph on the trunk road network in the South West of Scotland.
7 ECONOMIC ACTIVITY AND LOCATION IMPACTS REPORT | 1 In T rodu CTI on
TABLE 1-2: SWSTS PACKAGES FOR FURTHER APPRAISAL
Package Number Package Name
Package Description
15 A75 Capacity Enhancements development of capacity enhancement measures on the A75, such as partial dualling, town/village bypasses and improved overtaking opportunities.
16 A75 Safety Measures
Implementation of targeted measures, such as improvements to road geometry, bends and junction improvements to improve safety on the A75. Package will also include consideration of safety camera deployments through the Scottish Safety Camera Programme annual site prioritisation exercise.
17 A77 Capacity Enhancements development of capacity enhancement measures on the A77, such as partial dualling, town/village bypasses and improved overtaking opportunities.
18 A77 Safety Measures
Implementation of targeted measures, such as improvements to the road geometry, bends and junction improvements to improve safety on the A77. Package will also include consideration of safety camera deployments through the Scottish Safety Camera Programme annual site prioritisation exercise.

1.3 The Process
The Scottish Transport Appraisal Guidance (STAG)4 provides a framework to fully assess potential transport interventions and seeks to ensure that they provide the best solutions for identified problems and opportunities. The 2008 version of the document sets out the ‘STAG Process’, which comprises the following four phases:
• Pre-Appraisal
• Initial Appraisal – Part 1 Appraisal

• detailed Appraisal – Part 2 Appraisal
• Post-Appraisal
The requirement for an EALI report/Study is listed under the ‘Economy’ criteria in appraisal parts 1 and 2 and is specified to allow “the impact of an option to be expressed in terms of the net effects of the option on the local and/or national economy”. In this way, the EALI report is aimed at identifying how transport projects can affect the economic performance or circumstances of different geographical areas, and to also capture those economic impacts which the standard cost-benefit analysis (recognised in STAG as Transport Economic Efficiency (TEE)) may fail to capture.
At the time of writing a STAG update is in process but is yet to be fully published. It is understood that the requirement for an EALI is not featured in the update however, in line with the principles of the current STAG, this study therefore considers what are known the EALI of the proposed road and rail upgrade in terms of the impact on local employment, Gross Value Added (GVA) and how these impacts are ‘transmitted’ to the real economy.
1.4 Economic Activity and Location Impacts Report
The main aim of EALI analysis is to describe the impacts of any transport investment or policy using the measures of employment and/ or income. In STAG, EALI analysis can be reported as a net impact at the Scotland level and in terms of its gross components, which will distinguish impacts on particular areas and/ or on particular groups of society.
The proposed package of interventions, is considered to comprise a large transport project and, following a proportional approach as advocated by STAG, a wide geographic area will be considered in the EALI analysis. This report will present regional economic impacts, with a focus on South West Scotland, alongside the corresponding national impact at the Scotland level.
In this unique case impacts are also anticipated cross-border considering the existing connection between the A75 and the M6, for travel south to England, and the A75 and A77 for routing to the Ports of Cairnryan which provides ferry crossings to northern Ireland. In recognition of this connectivity with England and northern Ireland, and the importance of these trade routes, this report will provide a high-level qualitative review of the anticipated impacts at the national level.
8 ECONOMIC ACTIVITY AND LOCATIONS IMPACTS REPORT | 1 In T rodu CTI on
4 Scottish Government (2008) Scottish Transport Appraisal Guidance
1.4.1 Economic Activity and Location Impacts Approach
The approach adopted in this EALI begins with an examination of the existing situation in the local authority areas served by the A75 and A77 trunk roads, to establish a comprehensive baseline of the key transport and socio-economic indicators.
The largely quantitative baseline is added to by a series of interviews with local businesses in the South West Scotland region and a range of other consultations intended to explore how upgrades to the A75/ A77 may affect businesses and local groups and organisations.

Finally, Transport Scotland’s Transport Model for Scotland (TMfS) and Transport Economic Land use Model for Scotland (TELMoS) forecasting models were used to provide a consistent and quantitative analysis of the impacts of the proposals on the location of population and employment, and on the economic performance of business by sector.
The EALI analysis provides an assessment of the impact of transport investment or policy measures on the economy, measured in terms of income (Gross domestic Product (GdP) or GVA) and/or employment. The EALI analysis assesses the distribution of the national impacts captured through the TEE and Wider Economic Benefits (WEB), identifying the impacts on different areas. The EALI does not generally identify additional economic impacts that could be added to the TEE or WEB results. However, where market failures exist (the impact of negative perceptions for example) the EALI analysis may capture the economic impacts that the TEE analysis may not have fully assessed. note that the EALI guidance also states that “it is important to recognise that perceptions of problems with the transport system by users, operators, the public at large and politicians can be equally as important as problems that can be quantified through analysis of data”.
The study has been based on full dualling of the A75 and A77 routes, bypasses of settlements including Kirkoswald, Girvan, Ballantree, Spirngholm and Crocketford, and associated junction improvements. The proposals also include the electrification of the rail line between Stranraer and Ayr, and the installation of rail freight hubs at Stranraer, Ayr, and Barrhill

1.4.2 Structure of Report
The remainder of this report is structured as follows:
• Chapter 2 presents the existing conditions and transport baseline relative to the A75/A77 trunk roads.
• Chapter 3 outlines the socio-economic baseline to provide a detailed picture of the areas served by the A75/A77 trunk roads.
• Chapter 4 reports the findings of the interviews conducted with local business and key stakeholders.
• Chapter 5 provides the results of the land use – transport modelling assessment.
• Chapter 6 discusses the forecasted impacts of improvements to the A75/A77 trunk roads.
• Chapter 7 presents the conclusions of the EALI.
9 ECONOMIC ACTIVITY AND LOCATION IMPACTS REPORT | 1 In T rodu CTI on
2 Transport Baseline
2.1 Overview
This chapter outlines the existing conditions, in terms of journey times, traffic patterns and connectivity, of the A75 and A77 routes. It also touches on sustainable transport modes and cross-border connectivity.
2.2 A75
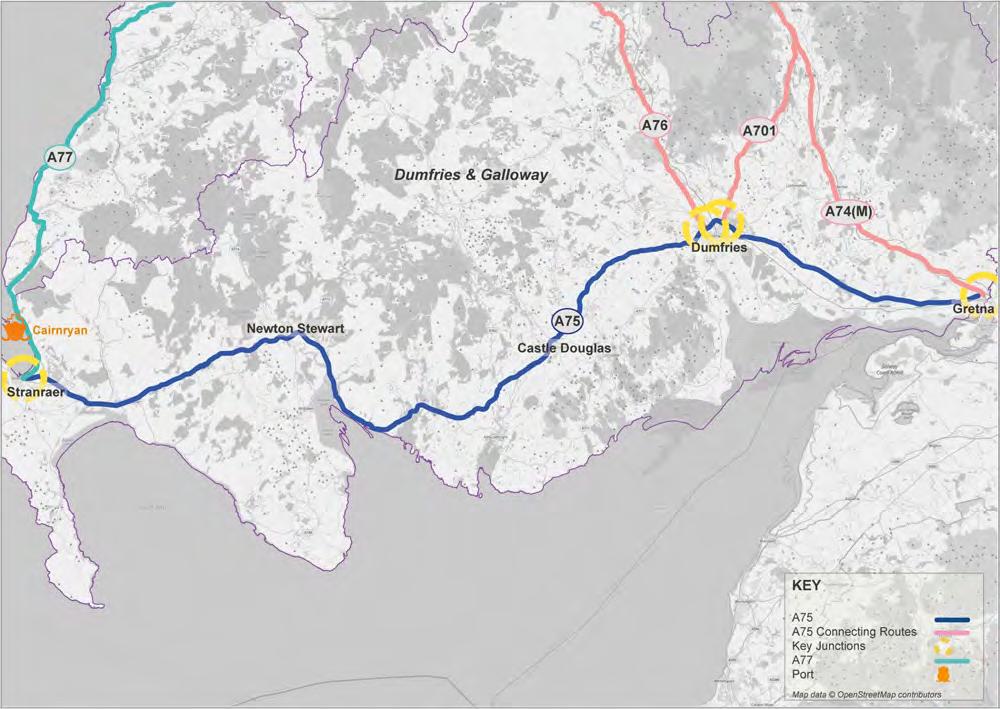
The A75 is the region’s principal east-west link and runs along the southwest coast of Scotland from the A74/M6 at Gretna, at the border with England, to Stranraer where it meets the A77. The route runs for approximately 155km and also has key junctions with the A76 and A701 trunk roads in the vicinity of dumfries, as pictured in Figure 2-1.

The A75 is primarily single carriageway standard. It has been subject to a number of improvements by Transport Scotland, as outlined at Section 1.2, to provide sections of 2+1 carriageway for increased overtaking opportunities and bypasses of residential settlements. As outlined in the SWSTS (2020), completion of bypass projects leaves Springholm and Crocketford as the remaining settlements which the routes runs directly through. on these sections vehicle speeds are limited to 30mph..

2.2.1 Existing Journey Times
The SWSTS presents typical vehicle journey times and speeds on the strategic road network across Scotland and provides comparison figures to consider with the performance of the A75. Table 2-1 includes the A75 alongside the three best-performing routes in terms of journey times and speed.
10 ECONOMIC ACTIVITY & LOCATION IMPACTS (EALI) STUDY 2 Tr A n SP or T B ASELI n E
FIGURE 2-1: THE A75 ROUTE AND KEY JUNCTIONS
TABLE 2-1: TYPICAL JOURNEY TIMES AND SPEEDS, A75 COMPARISON
Source: Here Journey Time data, as extracted from the South West Scotland Transport Study (SWSTS) (2020)
While the length of the A75 ranks mid-table in comparison to the other strategic routes considered, the typical journey times is directly comparative to that of the A9 between Perth and Inverness which runs for a further 16 miles. The typical speed reached on the A75 is also poor by comparison at 44.9mph in comparison to 51.9mph on the A9 and A90, and 56.4mph on the A74 (M) between Glasgow and Carlisle. routing through speed limited settlements is considered to be a primary factor in the lower than average speeds on the A75.
It should also be considered that, as a predominantly single carriageway road in Scotland, a speed restriction of 40mph exists for HGVs. With limited overtaking opportunities currently, this restriction also impacts the journey times and speeds of other vehicles.
2.2.2 Existing Traffic Patterns

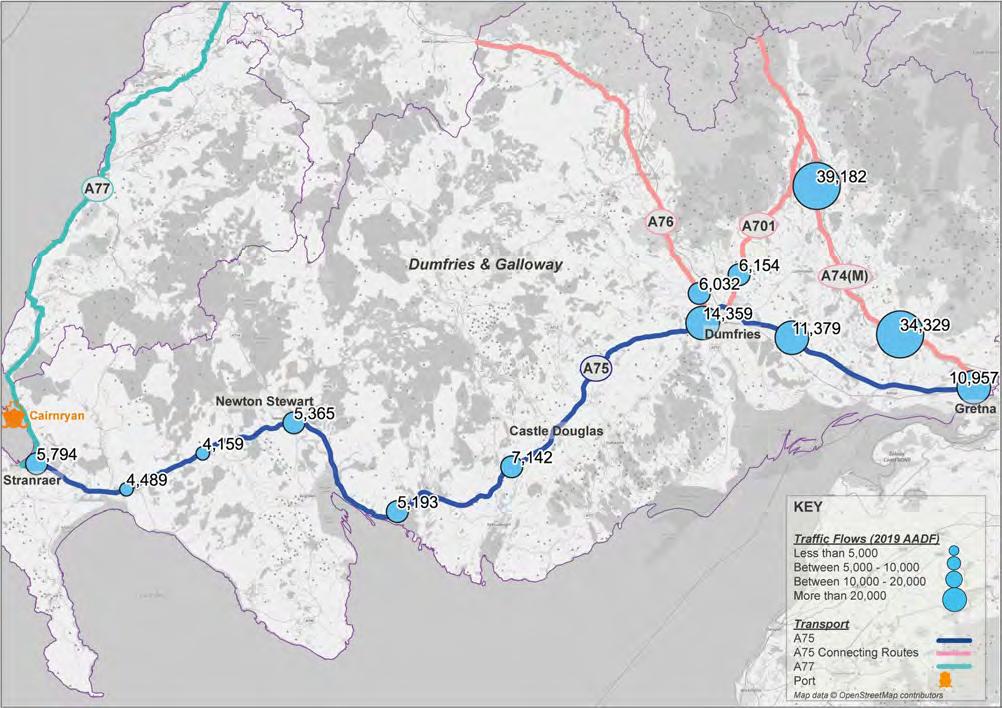
Traffic count data are available from the department for Transport’s (dfT) network of count points in Average Annual daily Flow (AAdF) format. There are a number of count points located along the A75 corridor and the connecting routes of the A74 (M), A701 and A76. The location of the count points considered for analysis are shown in Figure 2-2.

11 ECONOMIC ACTIVITY & LOCATION IMPACTS (EALI) STUDY 2 Tr A n SP or T B ASELI n E
Corridor Origin Destination Journey Time minutes Distance miles Speed mph A74 (M) Glasgow Carlisle 91 86 56.4 A90 Perth Aberdeen 95 82 51.9 A9 Perth Inverness 126 109 51.9 A75 Gretna Cairnryan 124 93 44.9
FIGURE 2-2: AADF COUNT POINTS (2019) ALONG THE A75 AND CONNECTING ROUTES
Figure 2-2 shows traffic volumes to vary across the length of the A75. The route section between Gretna and dumfries is evidenced to carry the greatest proportion of traffic, with two-way flows recorded in excess of 10,000 vehicles at the three count points considered. From dumfries to Stranraer in the west, vehicle flows are found to vary less from 7,142 to 5,794 respectively.
Table 2-2 presents these vehicle flows from east to west, and also assesses the proportion of HGVs recorded at each location in 2019.
TABLE 2-2: AADF TRAFFIC ON THE A75 (2019)
Source: department for Transport (2019)
*Counts estimated using previous year’s AAdF on this link


2.2.2.1 HGV Traffic
The proportion of HGVs is also found to vary across the length of the route. If, however, locations in the east, central section and west are considered individually, the range is between 13.7% and 15.5%.
These figures can be considered in line with the average HGV mix on the Scottish trunk road network for the 2019 period, as reported by Transport Scotland, of 14.0%. Transport Scotland have also published average HGVs figures for the entire length of the A75 which report the overall eastbound mix to be 21.0% and westbound to be 20.4%1 . Across the route, therefore, HGV numbers are higher than the national average.
2.2.2.2 Traffic over Time
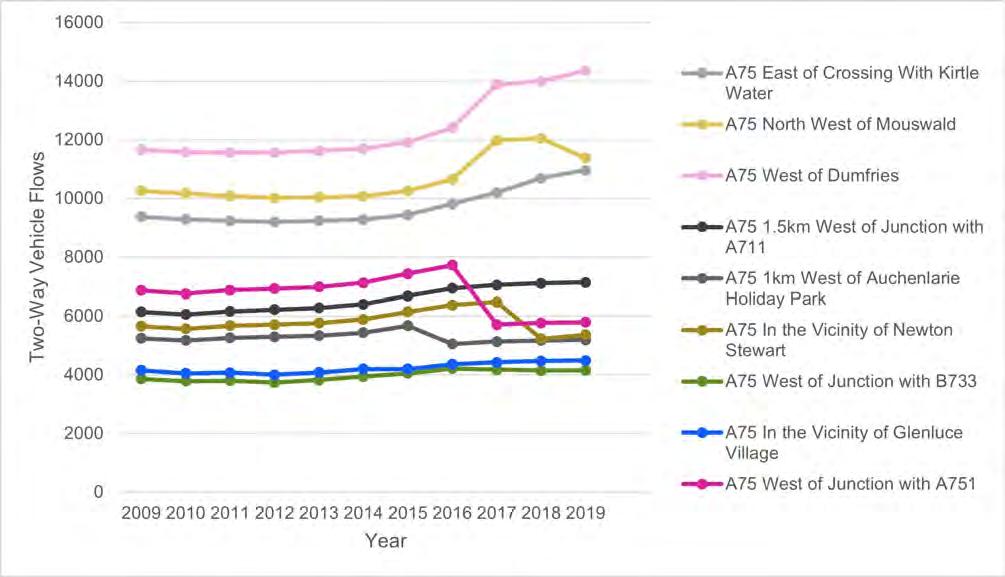
during the last five years traffic has remained relatively constant across the A75. data at each of the count points considered is charted in Figure 2-3 for the period 2009 – 2019 to illustrate the change in traffic, if any, over time.
12 ECONOMIC ACTIVITY & LOCATION IMPACTS (EALI) STUDY 2 Tr A n SP or T B ASELI n E
Count Location Annual Average Daily Flows (2019) Proportion of HGVs (of Two-Way Flow) Eastbound Westbound Two-Way A75 East of Crossing with Kirtle Water 5,467 5,490 10,957 13.7% (1,504) A75 north West of Mouswald 5,634 5,745 11,379 12.2% (1,388) A75 West of dumfries* 6,966 7,393 14,359 10.9% (1,562) A75 1.5km West of Junction with A711* 3,588 3,554 7,142 12.7% (910) A75 1km West of Auchenlarie Holiday Park* 2,637 2,556 5,193 15.3% (792) A75 In the Vicinity of newton Stewart 2,638 2,727 5,365 10.9% (586) A75 West of Junction with B733* 2,062 2,097 4,159 15.5% (644) A75 In the Vicinity of Glenluce Village* 2,254 2,235 4,489 14.5% (651) A75 West of Junction with A751* 2,893 2,901 5,794 9.5% (552)
1 https://www.gov.scot/publications/foi-202000040081/
2
Figure 2-3 shows traffic flows along the eastern extent of the A75 to be more changeable over time and to have generally followed a pattern of increase from 2015 onwards. data gathered along the western extent of the A75, west of Castle douglas to Stranraer, shows less variation, especially between Stranraer and newton Stewart. At each of these locations, however, sharp declines in traffic flows were recorded in 2016-2017 and 2017-2018 respectively.
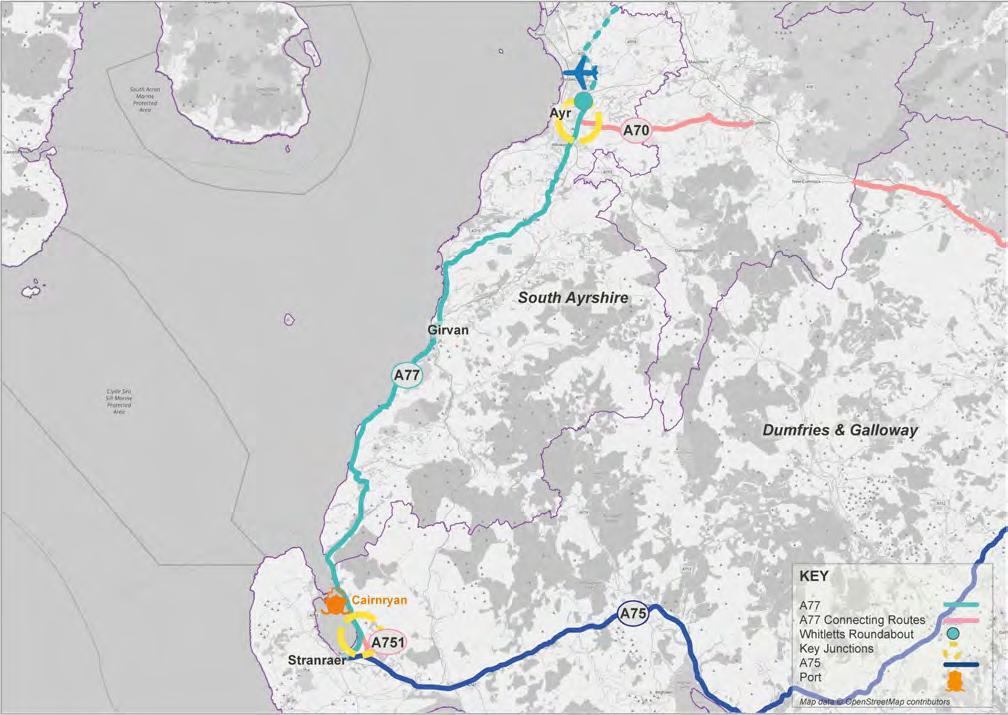
The A77 is the region’s principal north-south route and it runs along the west coast of Scotland from the A75 at Stranraer to north of Kilmarnock, where it becomes the M77 and travels into the City of Glasgow. This study considers the route as far as the Whitletts roundabout outside the town of Ayr, South Ayrshire as pictured in Figure 2-4.


13 ECONOMIC ACTIVITY & LOCATION IMPACTS (EALI) STUDY 2 Tr A n SP or T B ASELI n E
FIGURE 2-3: TRAFFIC TRENDS ON THE A75 (2009 - 2019 AADF)2
Source: department for Transport (2019)
2.3 A77
An unexplained spike in traffic outside Gretna in 2017 has been evened in order to more accurately represent the gradual increase of traffic over time on the A75
The A77 is primarily single carriageway standard and routes through a number of settlements, including Minishant, Kirkoswald, Turnberry, Girvan, Lendalfoot, Ballantrae, Smyrton, Auchencrosh, and Cairnryan. Along these sections vehicle speeds are reduced to 30 or 40mph.

The route has been subject to a number of improvements by Transport Scotland, as outlined at Section 1.2, the most notable of which provided a bypass for Maybole with the aims of reducing congestion in the town and improving safety and journey time reliability on the A77.

2.3.1 Existing Journey Times
Typical vehicle journey times and speeds on Scotland’s best preforming trunk roads and the A75 are included in Table 2 3 alongside the performance of the A77 for comparison purposes.
Source: Here Journey Time data, as extracted from the South West Scotland Transport Study (SWSTS) (2020)
14 ECONOMIC ACTIVITY & LOCATION IMPACTS (EALI) STUDY 2 Tr A n SP or T B ASELI n E
FIGURE 2-4: THE A77 ROUTE AND KEY JUNCTIONS
Corridor Origin Destination Journey Time minutes Distance miles Speed mph A74 (M) Glasgow Carlisle 91 86 56.4 A90 Perth Aberdeen 95 82 51.9 A9 Perth Inverness 126 109 51.9 A75 Gretna Cairnryan 124 93 44.9 A77 Ayr Cairnryan 69 43 37.7
TABLE 2-3: TYPICAL JOURNEY TIMES AND SPEEDS, A77 COMPARISON
While the A77 between Ayr and Cairnryan is the shortest route section considered in Table 2-3, the typical journey time is shown to be lengthy in comparison to the other strategic routes. The A74 (M) and A90, for example, cover approximately twice the distance of the A77 yet see typical journey times only 25% above that seen on the A77. The typical speed reached on the A77 is also limited in nature, in comparison to the other strategic routes and the A75, at 37.7mph. The A75 sees a typical speed of 44.9mph, while all other routes experience speeds in excess of 50mph. routing through speed-limited settlements and the lack of overtaking opportunities are considered to be primary factors in the lower than average speeds on the A75.

2.3.2 Existing Traffic Patterns

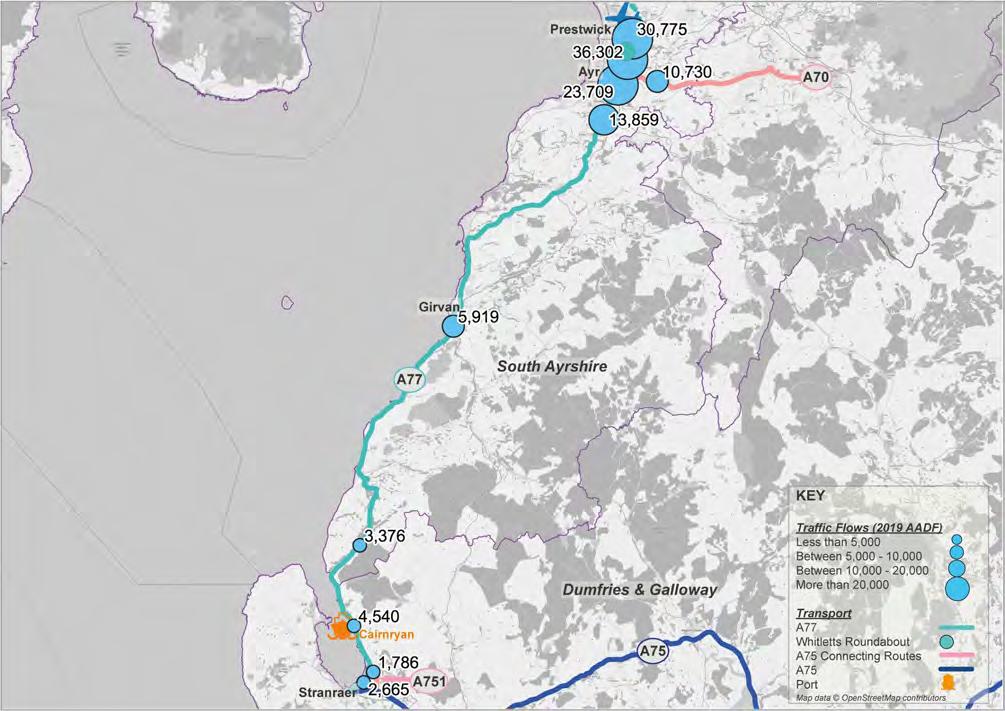
Traffic count data has been extracted from the dfT’s network of count points for the 2019 period at locations along the A77 in Average Annual daily Flow (AAdF) format. Count points located on the connecting routes of the A70 and A751 have also been reviewed and are plotted in Figure 2-5.
Figure 2-5 shows traffic volumes to follow a general trend of increasing steadily if the A77 is considered south to north. Beginning at Stranraer, and with the exception of the counter in the vicinity of Mark (south of Girvan), traffic flows are found to increase as the route travels past the Ports of Cairnryan, through Girvan town centre and towards Ayr. The highest count is found approximately 700m south of the Whitletts roundabout, where two-way flows were recorded in excess of 35,000. The lowest traffic count, 2,665 two-way vehicles, was recorded just outside of Stranraer.
Table 2-4 presents these vehicle flows from north to south, and also assesses the proportion of HGVs recorded at each location in 2019.
15 ECONOMIC ACTIVITY & LOCATION IMPACTS (EALI) STUDY 2 Tr A n SP or T B ASELI n E
FIGURE 2-5: AADF COUNT POINTS (2019) ALONG THE A77 AND CONNECTING ROUTES
TABLE 2-4: AADF TRAFFIC ON THE A77 (2019)
Source: department for Transport (2019)
*Counts estimated using previous year’s AAdF on this link

2.3.2.1 HGV Traffic
A review of the proportion of HGVs, as presented in Table 2 4, shows the peak numbers were recorded along the northern extent of the route section considered. While the overall proportion of the general traffic is relatively low, under 10%, the number of HGVs recorded around Ayr is 2,147 and 2,038 north and south of the Whitletts roundabout respectively. Meanwhile in the south at the Port of Cairnryan, HGVs constitute a greater percentage of the overall traffic at 18%. This can be considered in line with the average HGV mix on the Scottish trunk road network for the 2019 period, as reported by Transport Scotland, of 14.0%.
2.3.2.2
Traffic over Time
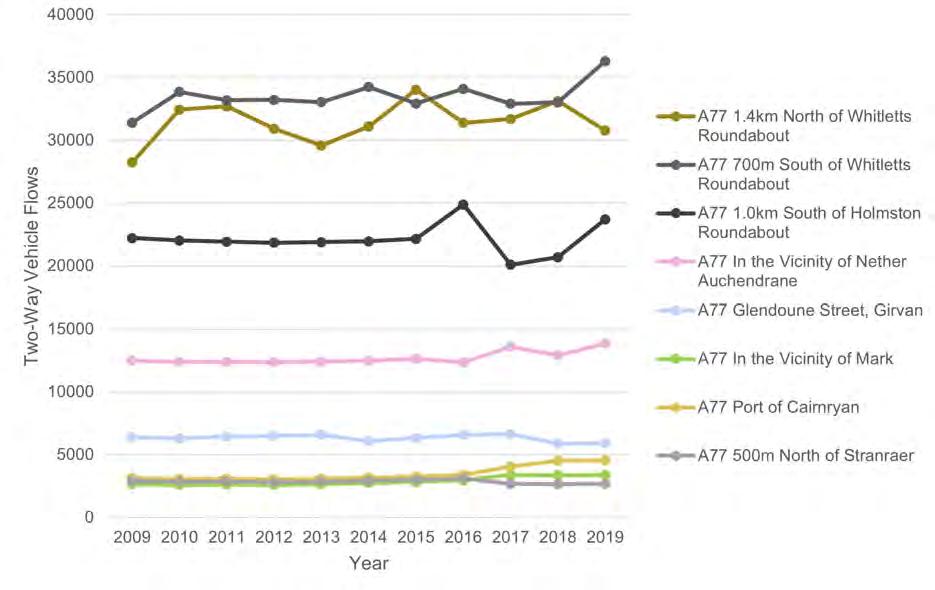
In the ten-year period between 2009 and 2019, traffic volumes at very few of the count locations along the A77 have fluctuated greatly. Figure 2 6 shows the annual average daily flows (AAdF) captured at each of the count points over time along the route between Stranraer and Ayr.

16 ECONOMIC ACTIVITY & LOCATION IMPACTS (EALI) STUDY 2 Tr A n SP or T B ASELI n E
Count Location Annual Average Daily Flows (2019) Proportion of HGVs (of Two-Way Flow) Northbound Southbound Two-Way A77 1.4km north of Whitletts roundabout 17,694 13,081 30,775 7.0% (2,147) A77 700m South of Whitletts roundabout 18,359 17,943 36,302 5.6% (2,038) A77 1.0km South of Holmston roundabout 11,990 11,719 23,709 5.5% (1,305) A77 In the Vicinity of nether Auchendrane 7,014 6,845 13,859 8.8% (1,213) A77 Glendoune Street, Girvan 2,869 3,050 5,919 8.4% (500) A77 In the Vicinity of Mark 1,676 1,700 3,376 19.8% (667) A77 Port of Cairnryan* 2,290 2,250 4,540 18.0% (815) A77 500m north of Stranraer* 1,339 1,326 2,665 6.2% (165)
FIGURE 2-6: TRAFFIC TRENDS ON THE A77 (2009 - 2019 AADF)
From Figure 2-6 levels of traffic are shown to have remained more or less constant along the southern route section, between Stranraer in the south and nether Auchendrane. Small increases were experienced at the Port of Cairnryan from 2016 onwards, while an overall increase in seen in the vicinity of nether Auchendrane. It is in close proximity to the town of Ayr, however, that the greatest fluctuations are seen. South of the Holmston roundabout, where the A77 meets the A70, traffic volumes were found to increase in 2016 before decreasing sharply in 2017 and rising steadily in the time since. Around the Whitletts roundabout, to the north-east of Ayr, larger fluctuations have been experienced. South of the roundabout traffic volumes have followed a general incremental pattern over the ten year period, reaching a peak of 36,302 vehicles in 2019. north of the roundabout traffic volumes are shown to be at their lowest in 2009 and to have peaked in 2015. Since 2015, traffic volumes here have seen an overall decrease and in 2019 were recorded at 30,775 vehicles.

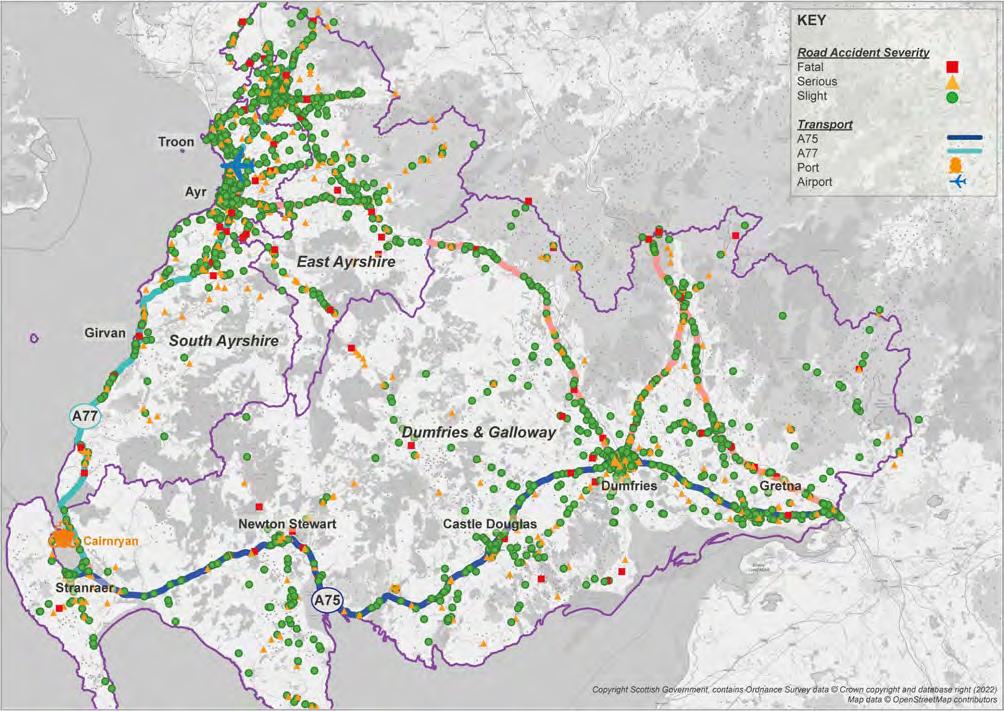
To assess the level of accidents on the A75/A77 trunk roads and the wider study area, the number of Personal Injury road Accidents (PIrA), as recorded via the dfT’s STATS19 dataset, has been interrogated for the latest 5-year period (2016 – 2020). Within this dataset accidents refer to personal-injury accidents, on public roads (including footways) which become known to the police within 30 days. damage-only accidents, with no human casualties or accidents, on private roads or car parks are not included.
Figure 2-7 plots the location of each accident within the study area and differentiates these by classification of severity, between ‘fatal’, ‘serious’ and ‘slight’.
Source: department for Transport (2022) road Safety data – Accidents Last 5 Years

Figure 2 7 shows there is a wide geographic spread of accidents across the study area. overall, the largest proportion of accidents (44%) are recorded on the A-road network, reflecting the dominance of A-class roads for travel in the region. Most of the recorded accidents are classified as ‘slight’ and these are largely concentrated in and around the area’s urban settlements. There are, however, a number of fatal accidents recorded. Focusing on the A75/A77 routes, these are found on sections between Ayr and Maybole and Girvan and Cairnryan on the A77 between 2017 and 2019, and on the A75 select fatal records are found around the settlements of newton Stewart, Castle douglas, dumfries, and Annan. A concentration of fatal accidents is also of note on the A74(M) between Gretna and Lockerbie.
17 ECONOMIC ACTIVITY & LOCATION IMPACTS (EALI) STUDY 2 Tr A n SP or T B ASELI n E
2.4 Road Safety
FIGURE 2-7: PERSONAL INJURY ROAD ACCIDENTS, SOUTH WEST SCOTLAND (2016 - 2020)
The change in the number of PIrAs over the last 5 years has also been assessed. Figure 2-8 charts the number of fatal, serious, and slight road accidents in the study area in the period 2016 – 2020.
Source: department for Transport (2022) road Safety data – Accidents Last 5 Years
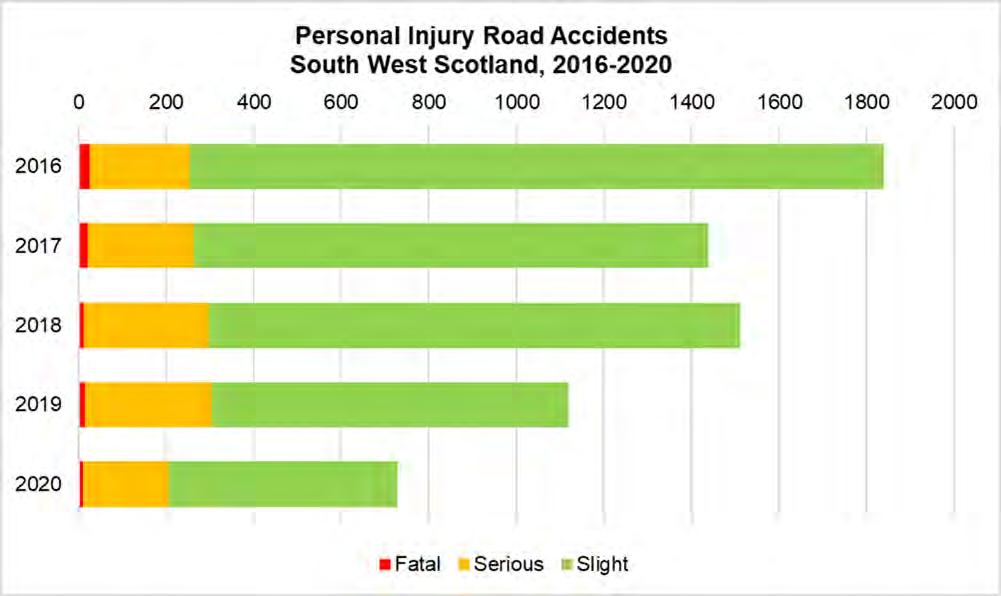

The overall number of road accidents is shown to have decreased in the study area in the period 2016 – 2020, with the number recorded in 2020 the lowest in 5 years at 709. of the total accidents seen in 2020 the number of fatal PIrAs represents just 1%, while the proportion of serious and slight accidents was much higher at 27% and 72% respectively.
2.5 Existing Accessibility and Connectivity
The area’s existing connectivity by public transport and active travel modes has also been reviewed and is set out, by mode, in the following sections.
2.5.1 Rail
The South West Scotland region is served by two rail lines, the Glasgow South West Line (GSWL) and the West Coast Mainline (WCML). The GSWL runs from Glasgow to Kilmarnock, and then travels to Carlisle via dumfries or Stranraer via Ayr, with a branch to East Kilbride. The core route of the WCML runs from Glasgow to London and main-line passenger services make stops at Glasgow Central, Motherwell, Carstairs and Lockerbie (in dumfries and Galloway) on the west coast.

18 ECONOMIC ACTIVITY & LOCATION IMPACTS (EALI) STUDY 2 Tr A n SP or T B ASELI n E
FIGURE 2-8: CHANGE IN PERSONAL INJURY ROAD ACCIDENTS, SOUTH WEST SCOTLAND 2016-2020
FIGURE 2-9: RAILWAY COVERAGE, SOUTH WEST SCOTLAND
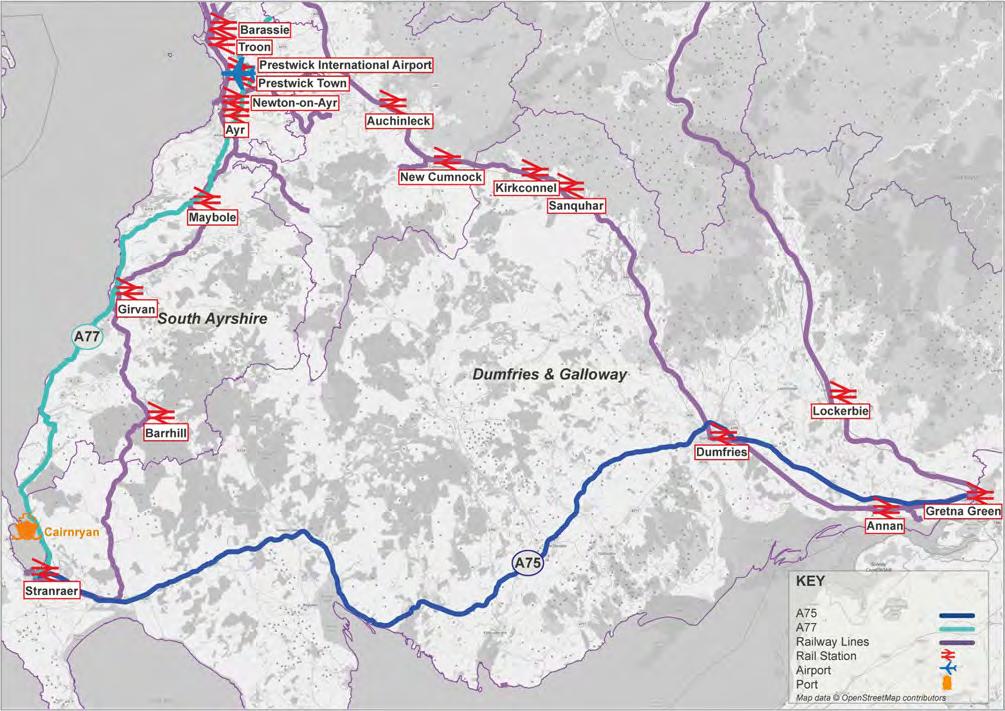

From Figure 2-9 it’s visible that the GSWL to Stranraer largely follows the route of the A77. There is a concentration of stations along this line in the northern coastal settlements within South Ayrshire, around the towns of Ayr, Prestwick and Troon, and station provision becomes more limited as the route travels towards Stranraer.

There is currently no rail provision along the length of the A75 corridor. While it is possible to travel west from Gretna Green as far as dumfries, the southern settlements of dumfries & Galloway face long access times to rails stations. This also means that the Ports of Cairnryan, and Stranraer, are connected by rail only from the north.
The SWSTS (2020) looked to rail passenger survey data to assess the journey origin points of station users, and effective station catchment areas, in the region. Figure 2-10 is extracted from the study and shows the geographical spread of journey origin points, grouped by the station at which respondents were surveyed.
19 ECONOMIC ACTIVITY & LOCATION IMPACTS (EALI) STUDY 2 Tr A n SP or T B ASELI n E
Source: South West Scotland Transport Study (SWSTS) Initial Appraisal (The Study), AECoM, 2020

The SWSTS made the following conclusions on station catchment areas:
• dumfries Station has a large catchment with passengers travelling from as far as Wigtown in the south of the study area, Thornhill on the A76 corridor, Moffat on the A701 corridor, and Carlisle to the south east.
• Lockerbie Station also has a large catchment similar to that of dumfries. Lockerbie Station’s large catchment is likely a result of people travelling to the station to take advantage of the enhanced service and cheaper fares on the WCML compared to the GSWL, with many people living in dumfries and west of the town electing to travel to Lockerbie for onward travel to the Central Belt rather than travelling direct from dumfries. This is supported by Figure 2-10 which shows that large numbers of those travelling north from Lockerbie, started their journey in dumfries and west of dumfries.
• The catchment area for Barrhill Station is also relatively large with just 18% of passengers surveyed travelling less than 3km to access the station and a considerable proportion travelling from newton Stewart and south of the A75. This is likely to be a result of the lack of rail access in the A75 corridor with Barrhill being the closest station for many in these locations.
• Stranraer also has a relatively dispersed catchment area with respondents travelling from as far as drummore at the southern end of the rhins of Galloway and Kirkcolm on the western coast of Loch ryan.

• outwith dumfries, Lockerbie, Barrhill and Stranraer, the remaining stations have more concentrated catchments, with the majority of users surveyed (more than 70% in each case) drawn from within a 3km radius.
Journey times by rail from stations along the A75 and A77 routes are presented in Table 2-5 for a range of uK destinations.

20 ECONOMIC ACTIVITY & LOCATION IMPACTS (EALI) STUDY 2 Tr A n SP or T B ASELI n E
FIGURE 2-10: GEOGRAPHICAL SPREAD OF JOURNEY ORIGIN POINTS FOR ACCESS TO THE RAILWAY
TABLE 2-5: RAIL JOURNEY TIMES TO UK DESTINATIONS
Source: Scotrail (2022) (All journeys leaving during the Weekday AM Period, 07:00-09:00hrs)


Table 2-5 shows the selection of stations along the A75 and A77 routes are reasonably well connected with destinations in the north (Ayr, Kilmarnock and Glasgow Central). It is travel to England which proves lengthy by rail from stations along the A77 route in Ayrshire, which requires changing at Glasgow Central. The long journey times seen between dumfries, Gretna Green and Ayr also evidence the lack of an east-west rail link in the region, along the A75 corridor.
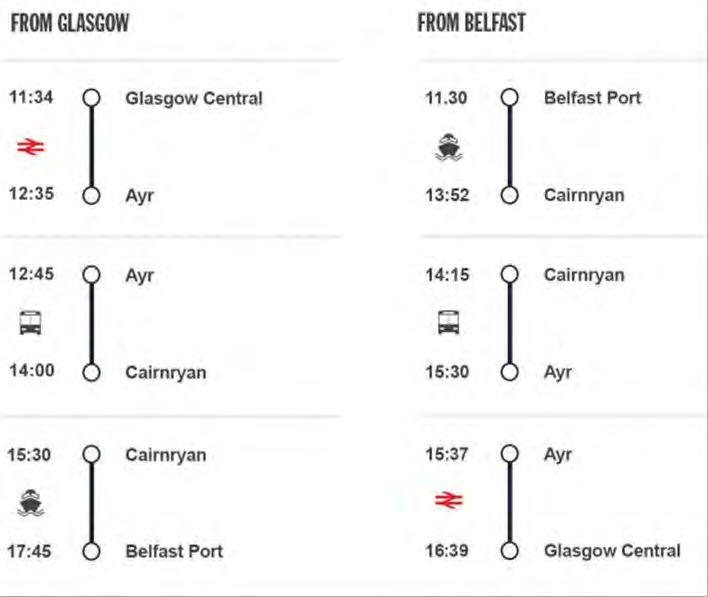
It is noted that for access by public transport to the Ports of Cairnryan for onward travel to Ireland, operators Stena Line promote a ‘rail & Sail’ package which sees passengers travel by rail as far as Ayr and onward by coach to the ports. The timetable in place at the time of writing comprised one return journey option between Glasgow and Belfast, as included in Figure 2-11.
Source: Stena Line (2022)
2.5.2 Bus
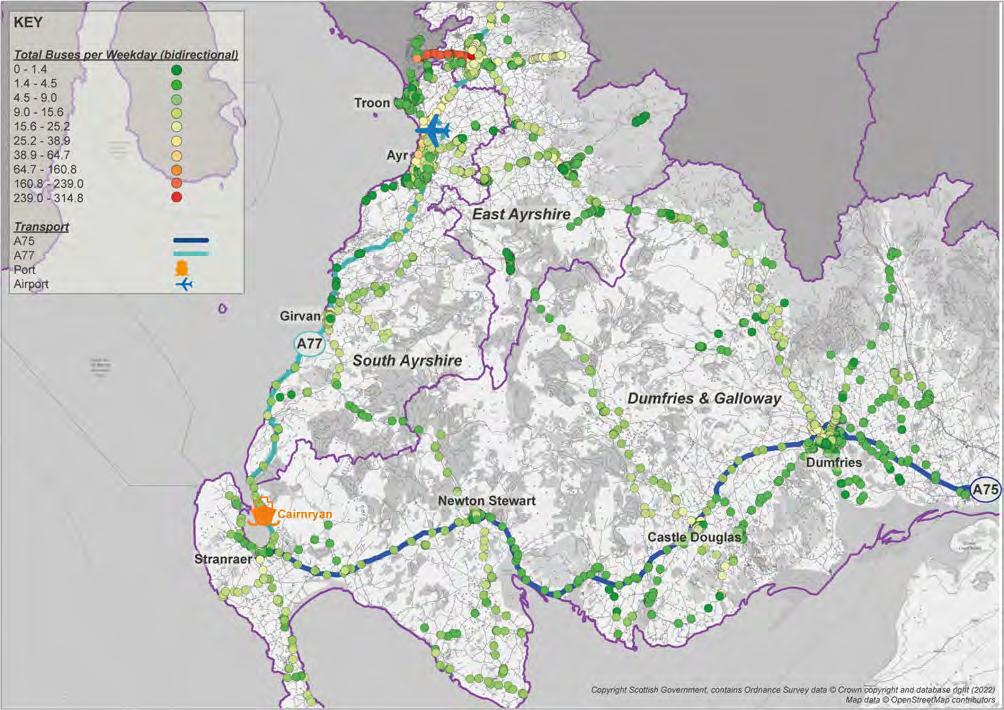
The dfT’s Bus open data Service (BodS) provides a range of bus-related data for the uK, as supplied by bus operators. The dataset includes timetable and stop data, and this has been employed in the assessment of the bus service coverage and service frequency in the study area. Figure 2-12 maps the region’s bus stops and charts the approximate number of services at each stop on an average weekday (00:00 – 23:59). The totals included in Figure 2-12 should be considered as bidirectional, or two-way.
21 ECONOMIC ACTIVITY & LOCATION IMPACTS (EALI) STUDY 2 Tr A n SP or T B ASELI n E
Origin Station Destination (travel time in minutes) Glasgow Central Kilmarnock Ayr Carlisle London Euston Prestwick International Airport 49 118 (1 change) 8 147 (1 change) 334 (1 change) Ayr 53 30 - 138 (1 change) 415 (1 change) Girvan 95 (1 change) 60 28 175 (2 changes) 378 (2 changes) Stranraer 99 112 80 288 (1 change) 430 (2 changes) dumfries 109 66 101 (1 change) 37 302 (2 changes) Gretna Green 136 93 225 (1 change) 13 245 (1 change)
FIGURE 2-11: RAIL & SAIL TRAVEL OFFERING FROM STENA LINE, GLASGOW-BELFAST
The assessment shows the daily number of buses to be lower across more rural parts of the study area. As services extend into such rural parts they are shown to reduce in number, as evidenced at stops along routes travelling north of centres such as dumfries, Castle douglas, and newton Stewart. By contrast, inter-urban services are found to be more plentiful across the day and this is most clearly seen in South and East Ayrshire. Between the coastal towns of Prestwick and Ayr a higher number of buses are found, while the highest concentration is found between the population centres of Irvine and Kilmarnock. This particular concentration lies along the B7801, which sees high frequency services between Kilmarnock and Irvine and university Hospital Crosshouse.

The key services on what are considered the area’s strategic transport corridors are summarised in Table 2-6.

22 ECONOMIC ACTIVITY & LOCATION IMPACTS (EALI) STUDY 2 Tr A n SP or T B ASELI n E
FIGURE 2-12: TOTAL BUSES PER WEEKDAY (00:00 – 23:59)
Source: department for Transport (2022) Bus open data Service


23 ECONOMIC ACTIVITY & LOCATION IMPACTS (EALI) STUDY 2 Tr A n SP or T B ASELI n E
Corridor Service No. Route Operator Approx. Daily Frequency Gretna - Stranraer X75 Stranraer - dumfries or Carlisle Stagecoach West Scotland 2 per day 79 dumfries - Annan – Gretna - Carlisle Stagecoach West Scotland 15 per day 179 Annan – Gretna - Carlisle Stagecoach Cumbria /north Lancashire 4 per day 373 dumfries - Terregles - Shawhead Houston’s Coaches 5 per day 379 Annan – Gretna Houston’s Coaches 5 per day 385 dumfries - Carrutherstown - daltonAnnan Houston’s Coaches /McCall’s Coaches 6-7 per day 416 newton Stewart - WhithornStranraer Stagecoach West Scotland 3 per day 430 newton Stewart - Stranraer Stagecoach West Scotland 1 per day 500 dumfries - Stranraer Stagecoach West Scotland 7 per day 503 dumfries - Springholm - Castle douglas McCall’s Coaches 7 per day 555 dumfries - Castle douglasKirkcudbright dumfries and Galloway Council Buses 2 per day Ayr - Stranraer 58 Stranraer - Girvan - Ayr Stagecoach West Scotland 13 per day 60 Stranraer - Girvan - Ayr Stagecoach West Scotland 9 per day 358 Ayr - Girvan Stagecoach West Scotland 9 per day 360 Ayr - Girvan Stagecoach West Scotland 2 per day dumfries - Cumnock 213 Thornhill - dumfries dumfries and Galloway Council Buses 7 per day 221 Wanlockhead - Sanquhar /Sanquhar - Kirkconnel W Brownrigg 7 per day 236 dumfries - Kirkton - ThornhillPenpont Houston’s Coaches 8 per day 246 Cumnock - Sanquhar - Thornhilldumfries /Kirkconnel - SanquharThornhill - dumfries /Thornhilldumfries Stagecoach West Scotland 12 per day /2 per day /9 per day dumfries –Lockerbie/ Moffat / Edinburgh/ Glasgow 74 dumfries – Beatcock – Moffat Stagecoach West Scotland 2 per day X74 dumfries – Moffat – Lesmahagow –Glasgow Stagecoach West Scotland 11 per day 101 dumfries – Edinburgh Stagecoach West Scotland 8 per day 101A dumfries – Edinburgh Stagecoach West Scotland 3 per day 102 dumfries – Edinburgh Stagecoach West Scotland 1 per day 81 dumfries - Lockerbie Stagecoach West Scotland 19 per day 381 dumfries - Lochmaben - Lockerbie Houston’s Coaches 9 per day 117 Lockerbie - Templand - LochmabenHightae - dumfries Houston’s Coaches 4 per day Lockerbie - Carlisle 382 Lockerbie – Gretna – Carlisle Houston’s Coaches 7 per day Source: Various operator Timetables (2022)
TABLE 2-6: SUMMARY OF KEY BUS SERVICE ON THE AREA’S STRATEGIC TRANSPORT CORRIDORS
Figure 2-12 and Table 2-6 compound to show the most developed part of the network and the majority of commercial services are concentrated in the most populated areas in and around dumfries and Ayr. There is relatively high bus frequency between Girvan/ Maybole and Ayr and on the key corridors into dumfries, including the A75 corridor between dumfries and Gretna, the A76 between dumfries and Thornhill, the A701 between dumfries and Moffat, and the A709 between dumfries and Lockerbie.
Bus service frequency is lower across the more rural areas, with particularly low frequency levels between Glenluce and Port William, across several routes into Castle douglas and Kirkcudbright, between Moniaive and Thornhill, and between Bellsbank and Carsphairn in the centre of the study area.

2.6 Existing Port and Ferry Connectivity
2.6.1
The Ports of Cairnryan lie 5 miles north of the nearest town, Stranraer, on the route of the A77. Vehicle travel from the north follows the A77, from Glasgow, while from England and the south the A75 westbound provides a connection from the M6/A74 (M) at Gretna. The A75 and A77 are, therefore, the primary access routes to the Ports of Cairnryan.
Access by sustainable modes of transport to the Ports is more challenging. The nearest rail station is located at Stranraer at a distance of approximately 4 miles. Bus services provide a greater level of connectivity and may connect to rail services at Ayr, while they also run to/from dumfries, Stranraer, Carlisle, Preston, and Birmingham. There is a local bus service, the 350 from Stranraer, which runs Monday to Saturday.

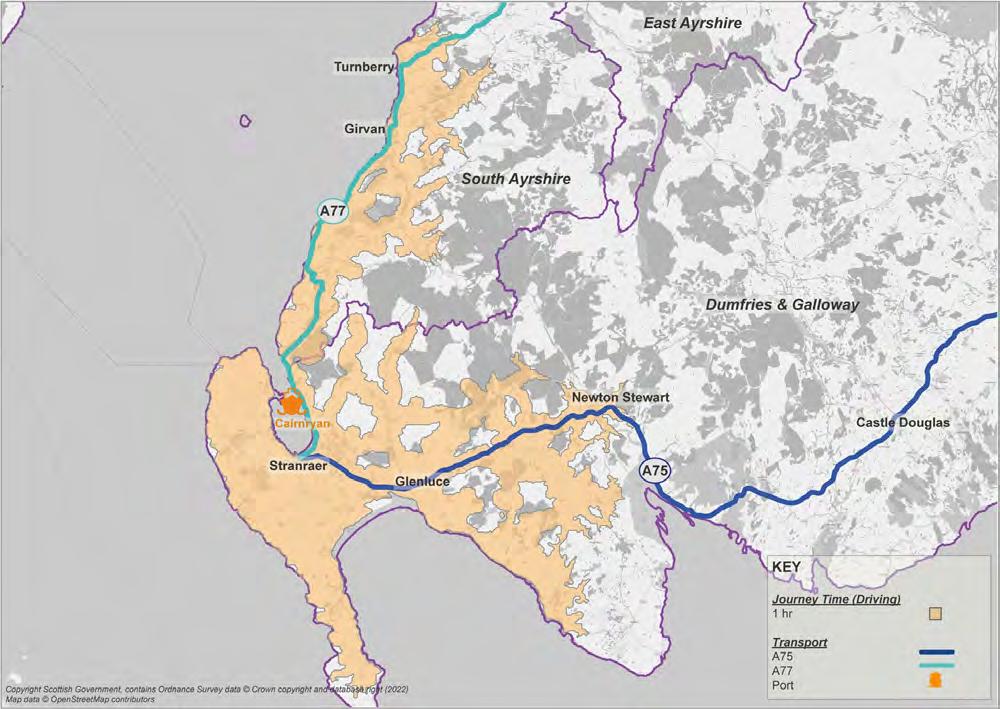
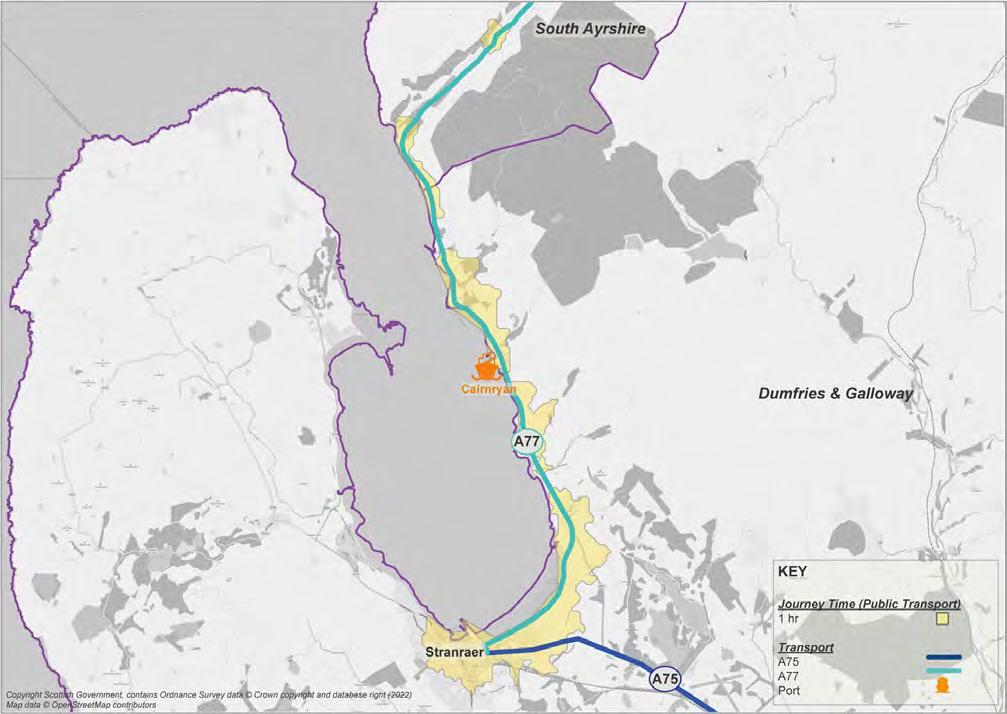
Existing journey times to Cairnryan have been assessed using the TravelTime platform. A 1-hour travel time catchment area has been produced for the vehicle and public transport modes to visualise the Ports’ accessibility. This is presented across Figure 2-13 and Figure 2-14.
24 ECONOMIC ACTIVITY & LOCATION IMPACTS (EALI) STUDY 2 Tr A n SP or T B ASELI n E
Cairnryan
FIGURE 2-13: VEHICLE JOURNEY TIME ISOCHRONE (1HR)
2.6.2 Larne
The Port of Larne, located within the Mid & East Antrim Borough Council area, is situated approximately 23 miles northeast of Belfast. It is a major passenger and freight port and serves northern Ireland in addition to the Port of Belfast.

The Port of Larne is served directly by the A8 Belfast – Larne route, a strategically important connection in the northern Ireland context. The A8 carries some 17,000 vehicles daily, a mix of HGVs, agricultural vehicles, and private vehicles. In recognition of the economic importance of the Port of Larne, in 2015 the department for Infrastructure opened a 14km dualled route section. The dualled route is now deemed to provide a safer and more efficient connection the Port.
Sustainable transport connections to the Port comprise Larne Harbour train station and a bus stop located on olderfleet road at Larne Harbour roundabout.

25 ECONOMIC ACTIVITY & LOCATION IMPACTS (EALI) STUDY 2 Tr A n SP or T B ASELI n E
FIGURE 2-14: PUBLIC TRANSPORT JOURNEY TIME (1HR)
Figure 2-13 and Figure 2-14 highlights that the Ports of Cairnryan are better connected by road than public transport, with the 1hr travel time catchment area significantly larger for private vehicles. As described in Section 2.5, there is currently poor integration with bus and rail and ferry services at the Ports of Cairnryan.
2.7 Summary of Transport Background/ Key Findings

This chapter has presented the existing transport context and provided an insight into the operation of the A75/ A77 Trunk roads. Travel times between the motorway network and the ports at Cairnryan are seen as posing a threat to the future of the ports. It is understood that long average journey times on the A75 and A77 to the ports at Cairnryan (due to road topography, alignment, and routing through small communities) will be a factor in influencing both existing and potential business and leisure users of the port to potentially utilise a different, more easily accessible port.
The key point of note is that vehicle-based journey times are significantly impacted by the mix of traffic on these routes, which includes trade and tourist traffic, and the lack of overtaking opportunities.
The study area is also challenged by large extents of rurality and the sustainable transport network struggles to overcome this. Travel times by rail and bus to the Ports of Cairnryan are not competitive with road-based journeys.

Long average road-based journey times impact on local people’s ability to effectively access key economic, education, health and cultural centres. This can also impact on population retention in the area – particularly in younger age groups; and the attractiveness of the area for potential in-migrants. These factors contribute to the ageing demographic profile in the area, as discussed in Chapter 3.
Any unanticipated delay on the road network which causes an increase in journey time, and especially the increased time and distance associated with journey times when a diversion is in place, can have detrimental impacts.
The low population density in the region presents challenges for the provision of commercially sustainable public transport services in the area as noted above. Given the dispersed population and travel distances involved, modes such as walking and cycling are only suited to shorter, local trips.
Providing commercially sustainable public transport services in the area is challenging, with two-thirds of services operated in part with subsidy. The current bus network is fragile. Given this, there is a high level of uncertainty in the ability to depend on the future bus network and plan travel decisions accordingly. For those living in rural areas without access to a car (or who would prefer not to use a car), there is often no alternative other than the bus and therefore many of these services are lifeline services.
Integration of bus and rail services is also limited across the region, due in part to the competitive environment in which they operate. While a walking trip is required to access rail stations from the nearest bus stop, wait times between services can be lengthy, adding substantially to overall journey times by public transport. In addition, for those communities not located on the rail network, bus services often do not operate early or late enough to provide access to rail services at the start and end of the operating day, thus limiting people’s use of the rail network to access employment, education, health and social opportunities.
26 ECONOMIC ACTIVITY & LOCATION IMPACTS (EALI) STUDY 2 Tr A n SP or T B ASELI n E
3 Socio-Economic Baseline
3.1 Overview
This chapter presents a range of data, from sources including Scotland’s Census and national records of Scotland (nrS), to summarise the socio-economic baseline along the A75 and A77 corridors and in the local authority areas of dumfries & Galloway, South Ayrshire, and East Ayrshire.


As in Chapter 2, a pre-Covid baseline year of 2019 is set unless otherwise stated.
3.2 Geography of the Data
The statistics presented in this chapter are mapped, where spatial data was available, and deemed appropriate, to enable an assessment of how the data varies and also where it varies. Statistics in Scotland are available for a range of geographies and those used in this assessment are described briefly in Table 3-1.
TABLE 3-1: GEOGRAPHY OF THE DATA
Data Geography Description
data Zone Boundaries (2011) data zones are the key geography for the dissemination of small area statistics in Scotland and are widely used across the public and private sector. Composed of aggregates of Census output areas, data zones are large enough that statistics can be presented accurately without fear of disclosure and yet small enough that they can be used to represent communities. They are designed to have roughly standard populations of 500 to 1,000 household residents, nest within local authorities (at the time of the Census), have compact shapes that respect physical boundaries where possible, and to contain households with similar social characteristics. Following the update to data zones using 2011 Census data, there are now 6,976 data zones covering the whole of Scotland.
Intermediate Zone Boundaries (2011)
Intermediate zones sit between data zones and local authority boundaries and were created for use with the Scottish neighbourhood Statistics (SnS) programme and the wider public sector. Intermediate zones are used for the dissemination of statistics that are not suitable for release at the data zone level because of the sensitive nature of the statistic, or for reasons of reliability. Intermediate zones were designed to meet constraints on population thresholds (2,500 - 6,000 household residents), to nest within local authorities (at the time of the Census), and to be built up from aggregates of data zones. Following the update to intermediate zones using 2011 Census data, there are now 1,279 intermediate zones covering the whole of Scotland.
Source: Scottish Government, Spatial data (2021)
The relevant data Zone, Intermediate Zone and nrS boundaries are shown in Figure 3-1.
27 ECONOMIC ACTIVITY AND LOCATION IMPACTS REPORT | 3 So CI o-E C ono MIC B ASELI n E
3.3 Demographics and Socio-Economic Profile
3.3.1 Population
In 2019 the study area registered a total resident population of 383,480, according to the mid-year population estimate .

The area has a varied population density, considered in line with the Scottish average of 70 people per km2. The local authority areas of dumfries & Galloway, South Ayrshire and East Ayrshire were found to have population densities of 23, 92, and 97 people per km2 respectively. dumfries & Galloway, therefore, has the lowest population density with the population spread across a large geographic area.


The distribution of the population can be assessed according to a selection of the area’s ‘key settlements’. Table 3-2 shows the population of the areas 3 most-populated and 3 least-populated settlements, as recorded in 2016.
Source: national records Scotland (2016)
28 ECONOMIC ACTIVITY AND LOCATION IMPACTS REPORT | 3 So CI o-E C ono MIC B ASELI n E
FIGURE 3-1: DATA GEOGRAPHIES
Settlement Local Authority Area 2019 Population Estimate Most Populous Ayr South Ayrshire 62,580 Kilmarnock East Ayrshire 51,390 dumfries dumfries & Galloway 34,030 Least Populous Crosshill South Ayrshire 500 Moniaive dumfries & Galloway 510 Glenluce dumfries & Galloway 590
TABLE 3-2: 2016 MID-YEAR POPULATION ESTIMATE BY SETTLEMENT
The town of Ayr, located in the north-eastern extent of the study area, is found to be the largest settlement. Ayr is one of the region’s largest retail centres and it is the administrative centre for South Ayrshire.

KEY POINT
dumfries & Galloway is one of the most rural local authority areas in Scotland, with a relatively low population density of 23 people per square kilometre.
A trend is identified across dumfries & Galloway, South Ayrshire, and East Ayrshire in which the highest percentage of the populations live in settlements with populations of 10,000 to 124,999, categorised by Scottish Government as ‘other urban areas’. Furthermore, in dumfries & Galloway and East Ayrshire over 20% of the population live in ‘accessible rural’ settlements (with populations less than 3,000, but within a 30-minute drive time of a Settlement with a population of 10,000 or more). .
3.3.1.1 Age Profile
Table 3-3 presents the age profile of the three local authority areas and that of Scotland as a whole.
TABLE 3-3: 2019 MID-YEAR POPULATION ESTIMATE BY AGE

Source: national records Scotland (2020)
The proportion of people of working age across the study area is relatively consistent, ranging between 58 – 62%, and sits just below the Scottish average of 64%. The proportion of people in the lower age category is generally in line with the Scottish average at 16/17%, while a higher proportion of people over the age of 65 is seen in dumfries & Galloway and South Ayrshire. The population of these areas is comprised of 26% of over 65s, while the Scottish average is 19%. The proportion of over 65s in East Ayrshire is more comparable to the Scottish average at 20%.
29 ECONOMIC ACTIVITY AND LOCATION IMPACTS REPORT | 3 So CI o-E C ono MIC B ASELI n E
Area Age 0 – 15 years (%) 16 – 64 years (%) 65 years+ (%) All Ages dumfries & Galloway 16% 58% 26% 148,860 South Ayrshire 16% 59% 26% 112,610 East Ayrshire 17% 62% 20% 122,010 Scotland 17% 64% 19% 5,463,300
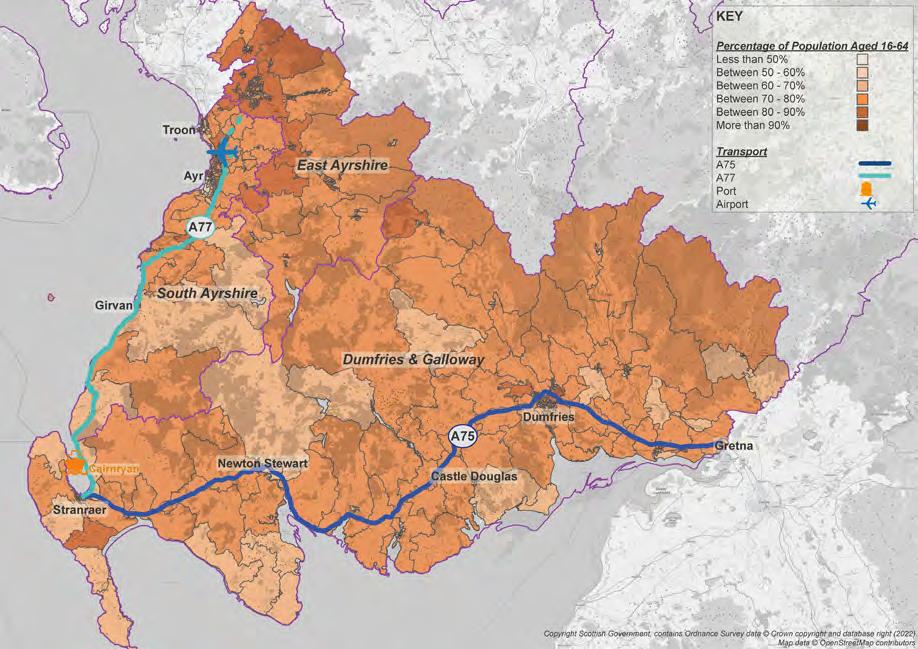
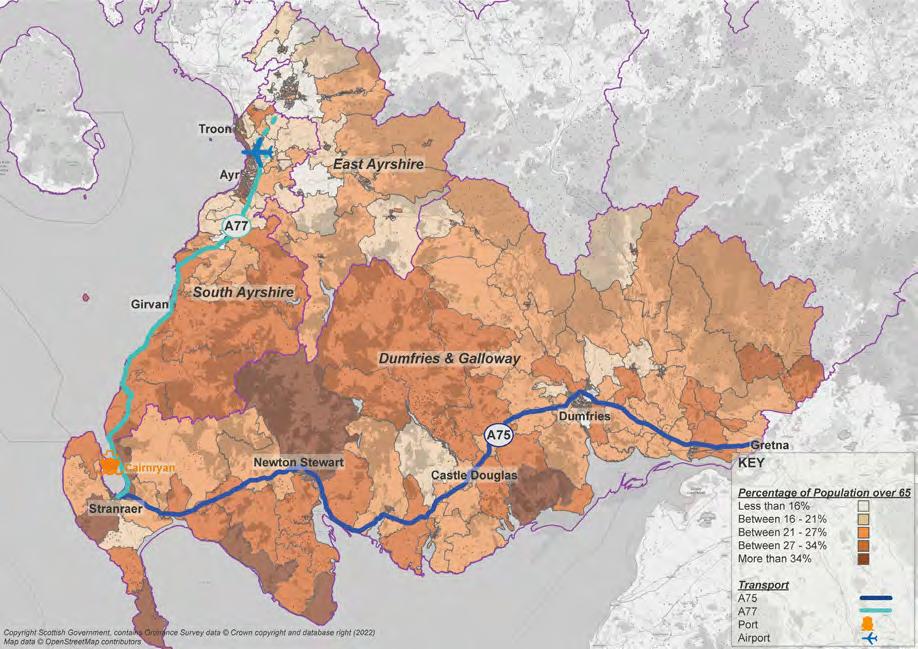
Figure 3-2 and Figure 3-3 map the population age profile for those of working age, 16-64 years old, and those over 65 years old.


30 ECONOMIC ACTIVITY AND LOCATION IMPACTS REPORT | 3 So CI o-E C ono MIC B ASELI n E
FIGURE 3-2: PERCENTAGE OF POPULATION AGED 16-64 (2019)
FIGURE 3-3: PERCENTAGE OF POPULATION OVER 65 (2019)
Figure 3-2 shows the highest proportions of working age people to be concentrated in the region’s largest towns and urban areas. In Ayr and Kilmarnock in particular, the population of certain areas was found to be comprised of more than 90% of people within the 16-64 age group. This is also seen in one central area of Prestwick and Stranraer, respectively. dumfries, the largest town in dumfries & Galloway, contains several central and suburban areas comprised of 80-90% of people with the 16-64 active age group.
The greatest concentration of people over the age of 65 was found to be mixed in these same areas, as reflected in Figure 3-3. In 2019, several coastal areas of the towns Ayr, Prestwick and Stranraer registered populations comprising of more than 34% of people within the 16-64 age group. This is also true for the large towns of Kilmarnock and dumfries. rural and coastal areas of dumfries & Galloway were also found to be popular with those over 65 years old, with the proportion of the overall population commonly over 27%.
KEY POINT
An uneven demographic mix is found across the study area which, in comparison to the Scottish average, sees a lower proportion of people of working age and a higher proportion of people over the age of 65. This is particularly true in dumfries & Galloway and South Ayrshire, where 26% of the population is over the age of 65 (+7% on the Scottish average).


3.3.1.2 occupations/Employment Sectors
The range of occupations in the study area has been extracted from 2011 Census data to provide an indication of the main economic sectors and the skills held in the region. Table 3-4 presents the percentage of jobs held in each local authority area according to 9 occupation categories.
TABLE 3-4: CATEGORIES OF OCCUPATION BY LOCAL AUTHORITY AREA (2011)
Source: office for national Statistics (2011) Census 2011 Table Id KS608uK - occupation
Table 3-4 relays a general trend of high employment figures in the ‘professional occupations’ and ‘skilled trades occupations’ categories. In dumfries & Galloway there is a higher percentage of the population (17%) in skilled trades occupations than the national average of 13%; this is also true for East Ayrshire at 15%. occupation categories in South Ayrshire follow a similar pattern, with ‘administrative & secretarial occupations’, ‘caring, leisure & other service occupations’, and ‘elementary occupations’ also comprising above 11% of the overall job market. Employment sectors have also been assessed and Table 3-5 shows the approximate percentage employee jobs by industry in the study area, and Scotland as a whole.
31 ECONOMIC ACTIVITY AND LOCATION IMPACTS REPORT | 3 So CI o-E C ono MIC B ASELI n E
Area Occupation Categories (%) Managers, d irectors, Senior o fficials Professional o ccupations Associate Professional & Technical o ccupations Administrative & Secretarial o ccupations Skilled Trades o ccupations Caring, Leisure & o ther Service o ccupations Sales & Customer Service o ccupations Process, Plant & Machine o peratives Elementary o ccupations dumfries & Galloway 8% 13% 9% 10% 17% 11% 8% 10% 13% South Ayrshire 9% 16% 12% 11% 13% 11% 9% 7% 11% East Ayrshire 7% 14% 11% 11% 15% 12% 9% 10% 12% Scotland 8% 17% 13% 11% 13% 10% 9% 8% 12%
TABLE 3-5: PERCENTAGE EMPLOYEES BY INDUSTRY (2011)
Table 3-5 shows the percentage split of jobs by industry in the three local authority areas is largely in line with the figures across Scotland. There are exceptions; a higher proportion of jobs within category A (agriculture, forestry, and fishing) is found in dumfries & Galloway, at 8% in comparison to the Scottish average of 2%, while East Ayrshire sees a higher proportion of job in category C (manufacturing) at 11% compared to Scotland as a whole at 8%.
overall, a high proportion of jobs in the study area fall into industry categories G, ‘wholesale and retail trade; repair of motor vehicles and motorcycles’, and Q, ‘human health and social work activities’. Combined, these industries comprise 32% of all jobs in dumfries & Galloway; 33% in South Ayrshire; and 34% in East Ayrshire.


KEY POINT
There is a relatively high proportion of residents within the study area employed in ‘professional occupations’ and ‘skilled trades occupations’ categories and this is particularly true for skilled trades occupations in dumfries & Galloway and East Ayrshire. The job market in the study area is generally dominated by the ‘wholesale and retail trade; repair of motor vehicles and motorcycles’, and ‘human health and social work activities’ industries, with specialities in ‘agriculture, forestry and fishing’ and ‘manufacturing’ seen in dumfries & Galloway and East Ayrshire respectively.
32 ECONOMIC ACTIVITY AND LOCATION IMPACTS REPORT | 3 So CI o-E C ono MIC B ASELI n E
Industry Area dumfries & Galloway South Ayrshire East Ayrshire Scotland (A) Agriculture, forestry and fishing 8% 2% 2% 2% (B) Mining and quarrying 0% 1% 1% 1% (C) Manufacturing 9% 9% 11% 8% (d) Electricity, gas, steam and air conditioning supply 1% 1% 1% 1% (E) Water supply; sewerage, waste management and remediation activities 1% 1% 1% 1% (F) Construction 9% 7% 9% 8% (G) Wholesale and retail trade; repair of motor vehicles and motorcycles 16% 16% 16% 15% (H) Transport and storage 5% 6% 5% 5% (I) Accommodation and food service activities 7% 8% 5% 6% (J) Information and communication 1% 2% 2% 3% (K) Financial and insurance activities 1% 3% 3% 5% (L) real estate activities 1% 1% 1% 1% (M) Professional, scientific and technical activities 3% 4% 3% 5% (n) Administrative and support service activities 3% 3% 5% 4% (o) Public administration and defence; compulsory social security 6% 7% 7% 7% (P) Education 7% 8% 7% 8% (Q) Human health and social work activities 16% 17% 18% 15% (r – u) other 4% 5% 4% 5%
office for national Statistics (2011) Census 2011 Table Id KS605uK - Industries
Source:
3.3.1.3 Economic Activity
The economic activity rate, expressed as the ratio between the number of economically active people (i.e., people in or looking for employment) and the total number of people aged 16 and over, is presented across Table 3-6 and Table 3-7 at the local authority and Scotland levels.
TABLE 3-6: ECONOMIC ACTIVITY (2019) Area
Source: office for national Statistics (2022) Local Authority Profiles – Economically Inactive – Time Series
*For the period october 2018 – September 2019, office for national Statistics (2022) HI11 regional labour market: Headline indicators for Scotland
TABLE 3-7: ECONOMIC INACTIVITY (2019)
Source: office for national Statistics (2022) Local Authority Profiles – Economically Inactive – Time Series

As shown in Table 3-6, the economic activity rate throughout the study area is relatively consistent, only fluctuating between 61.5% and 63.7%. It is highest in East Ayrshire at 63.7%.
In terms of the economically inactive sector, the total figures show dumfries & Galloway (22.6%) to be in line with the national average (22.5%). South and East Ayrshire were found to have a lower proportion of economically inactive at 23.3% and 22.1% respectively. dumfries & Galloway registered the highest proportion of students (19.7%); South Ayrshire the highest proportion of retirees (25.7%); and East Ayrshire the highest number of those looking after family/ home (19.2%) and sick (41.0%).
KEY POINT
Economic activity rates in the study area were found to be higher than the Scottish average, and highest in East Ayrshire. South Ayrshire saw a lower economic activity rate in 2019 with a significantly higher retired population in comparison to the remainder of the region, and to Scotland as a whole.

3.3.1.4 Gross Value Added
Gross Value Added (GVA) is a measure of the increase in the value of the economy due to the production of goods and services. The office for national Statistics (onS) reports on the ‘Balanced Gross Value Added’ (GVA(B)) to provide a balanced measure of regional GVA, giving single measure of economic activity within a region. GVA(B) is measured at current basic prices, which include the effect of inflation.
33 ECONOMIC ACTIVITY AND LOCATION IMPACTS REPORT | 3 So CI o-E C ono MIC B ASELI n E
Economically Active In Employment: Employees In Employment: Self Employed unemployed dumfries & Galloway 55,400 (61.5%) 12,900 (13.2%) 2,200 (3.2%) South Ayrshire 42,100 (63%) 7,800 (10.7%) 1,900 (3.7%) East Ayrshire 48,500 (63.7%) 8,300 (10.3%) 2,700 (4.5%) Scotland* 2,317,000 (59.6%) 330,000 763,000
Area Economically Inactive Economically Inactive (Total) Student Looking After Family/Home Sick (Temporary & Long-Term) retired other dumfries & Galloway 19,400 (22.6%) 3,800 (19.7%) 3,200 (16.6%) 6,200 (32.3%) 3,300 (16.9% 1,800 (9.2%) South Ayrshire 15,200 (23.3%) 2,700 (17.7%) 2,600 (16.9% 4,100 (27.2% 3,900 (25.7% 1,800 (11.9%) East Ayrshire 16,600 (22.1%) 1,900 (11.6% 3,200 (19.2%) 6,800 (41.0%) 2,600 (15.6%) 1,700 (10.2% Scotland* 772,800 (22.5%) 197,400 (25.5%) 147,400 (19.1%) 234,000 (Undetermined) 110,700 (14.3%) 80,500 (10.4%)
The latest GVA figures from 2019 are available from the onS for local authority areas as the smallest geography. Table 3-8 presents a 5-year assessment, from 2015 to 2019, of the GVA(B) per head of population at current basic prices.
TABLE 3-8: BALANCED GVA PER HEAD OF POPULATION
Source: office for national Statistics (2021) regional Gross Value Added (balanced) reference Tables (Table 2)
The GVA per head of population in 2019 in each of the areas considered was below that of Scotland (26,968). The percentage growth in the 5-year period from 2015 – 2019 in dumfries & Galloway (+13.1%) is shown to have exceeded the national growth of 10.1%
An alternative measure of productivity is GVA per filled job. This only counts the input of those directly employed in the production process and is also a workplace-based measure and therefore takes account of the impact of commuting. Table 3 9 shows the change in GVA per filled job in dumfries & Galloway, South Ayrshire, and East Ayrshire, and at the Scotland-level between 2015 and 2019.
TABLE 3-9: GVA(B) PER FILLED JOB
Source: office for national Statistics (2021) Subregional Productivity – Table B1 GVA(B) per Filled Job (£)
KEY POINT
In 2019 labour productivity throughout the study area, as measured by balanced GVA per head of population, is below that of the Scottish average. The rate of change in the period 2015 – 2019, however, exceeded that of Scotland as a whole, except in East Ayrshire where the change was -0.8% below the Scottish average.
The GVA per filled job in dumfries & Galloway and South Ayrshire was found to be comparable for the year 2019, at 50,373 and 49,765 respectively. A lower figure was reported in East Ayrshire, at 42,824. The rate of growth in the period 2015 – 2019 was found to be highest in South Ayrshire at 10%.


3.3.1.5 Gross disposable Household Income
Gross disposable Household Income (GdHI) per head is the amount of money that all of the individuals in the household sector have available for spending or saving after income distribution measures (for example taxes, social contributions and benefits) have taken effect.
The latest GdHI figures from 2019 are available from the onS for Local Authority areas as the smallest geography. Table 3-10 presents a 5-year assessment, from 2015 to 2019, of the GdHI per head of population at current basic prices.
34 ECONOMIC ACTIVITY AND LOCATION IMPACTS REPORT | 3 So CI o-E C ono MIC B ASELI n E
Area Balanced Gross Value Added GVA(B) 2015 2016 2017 2018 2019 Percentage Change 2015 – 2019 dumfries & Galloway 21,439 21,979 22,848 23,332 24,252 +13.1% South Ayrshire 19,705 20,058 21,101 21,680 22,043 +11.9% East Ayrshire 14,749 15,300 15,774 15,696 16,122 +9.3% Scotland 24,483 24,718 25,592 26,180 26,968 +10.1%
Area Balanced Gross Value Added GVA(B) 2015 2016 2017 2018 2019 Percentage Change 2015 – 2019 dumfries & Galloway 47,849 48,156 48,792 49,641 50,373 +5% South Ayrshire 45,171 46,497 47,898 49,140 49,765 +10% East Ayrshire 40,634 40,926 41,509 42,305 42,824 +5%
TABLE 3-10: GVA(B) PER FILLED JOB
Source: office for national Statistics (2021) regional Gross disposable Household Income (GdHI) – Table 2 GdHI per Head of Population at Current Basic Prices
The average GdHI per head has increased across all areas considered from 2015, with the fastest growth occurring in dumfries & Galloway (9%) while East & north Ayrshire is seen to be in line with the Scottish average (8%). In 2019, the GdHI per head in South Ayrshire was tantamount to the Scottish average closely followed by dumfries & Galloway, while in East & north Ayrshire it remained on a lower trajectory.
KEY POINT
GdHI grew at a rate comparable with the Scottish average throughout the study area, except in South Ayrshire where the growth in GdHI was -2% lower in the period 2015 – 2019. The fastest growth occurred in dumfries & Galloway.

3.3.1.6 Household Income

The Scottish Government makes available modelled estimates of gross household income in which data on income and household characteristics from a national survey (the Scottish Household Survey) has been combined with associated local area level data. The estimates are available for spatial analysis at the data zone level for 2018 as the latest year, as presented in Figure 3-4.

3-4: AVERAGE WEEKLY HOUSEHOLD INCOME (GROSS) (2018)
Source: Scottish Government (2020) Local Level Household Income Estimates, Weekly, (£), Banded Income, 2018
35 ECONOMIC ACTIVITY AND LOCATION IMPACTS REPORT | 3 So CI o-E C ono MIC B ASELI n E
Area Balanced Gross Value Added GVA(B) 2015 2016 2017 2018 2019 Percentage Change 2015 – 2019 dumfries & Galloway 17,284 17,675 17,748 18,135 18,806 +9% South Ayrshire 18,373 18,464 18,474 18,995 19,428 +6% East Ayrshire 16,021 16,063 16,264 16,896 17,365 +8% Scotland* 18,148 18,237 18,479 19,110 19,649 +8%
FIGURE
Figure 3-4 highlights the differences in income across the region with the lowest income levels found in rural parts of dumfries & Galloway, mostly along the A75 corridor, and in East Ayrshire. Much of the study area is represented by the median income band, £601-880 per week, while it is clear the coastal settlements of South Ayrshire rank in the highest income band.
KEY POINT
GdHI grew at a rate comparable with the Scottish average throughout the study area, except in South Ayrshire where the growth in GdHI was -2% lower in the period 2015 – 2019. The fastest growth occurred in dumfries & Galloway.
3.3.1.7 Annual Pay and Hours Worked

The Annual Survey of Hours and Earnings (ASHE) is carried out in April each year and its results provide the most comprehensive source of information on the structure and distribution of earnings in the uK. ASHE provides information about the levels, distribution and make-up of earnings and paid hours worked for employees in all industries and occupations. Table 311 and Table 3-12 present the average gross annual pay, for full-time and part-time workers respectively, for the period 2015 – 2019.
TABLE 3-11: MEDIUM GROSS ANNUAL PAY FOR FULL-TIME WORKERS
Annual Survey of Hours and Earnings via office for national Statistics (2021) Earnings and Hours Worked, Place of residence by Local Authority (Table 8.7a)
TABLE 3-12: MEDIAN GROSS ANNUAL PAY FOR PART-TIME WORKERS
Source: Annual Survey of Hours and Earnings via office for national Statistics (2021) Earnings and Hours Worked, Place of residence by Local Authority (Table 8.7a)
There have been overall increases in mean gross annual pay across the region, for both full-time and part-time workers, in the period 2015-2019. For full-time workers a minimum increase of 8% was seen, as in dumfries & Galloway and South Ayrshire, while East Ayrshire registered a growth of 10%, above the Scottish average (9%). For part-time workers a larger percentage change was registered in the same period; a minimum increase of 14% was seen in East Ayrshire. The increase in pay for part-time workers in dumfries & Galloway (27%) and South Ayrshire (41%) exceed the Scottish average (17%).
KEY POINT
unlike for Scotland as a whole, annual full-time pay for workers in the study area has not increased incrementally in the period 2015 – 2019. Across year-on-year variances found in each Local Authority area negative fluctuations are found, most recently in South Ayrshire between 2018 – 2019. overall, a positive trend is seen percentage-wise between 2015 and 2019, for both full-time and part-time workers..

36 ECONOMIC ACTIVITY AND LOCATION IMPACTS REPORT | 3 So CI o-E C ono MIC B ASELI n E
Area Balanced Gross Value Added GVA(B) 2015 2016 2017 2018 2019 Percentage Change 2015 – 2019 dumfries & Galloway 28,268 29,207 29,860 29,791 30,437 +8% South Ayrshire 32,296 33,155 33,764 35,392 34,868 +8% East Ayrshire 29,349 30,599 30,451 31,753 32,409 +10% Scotland* 32,482 33,120 33,489 34,563 35,263 +9%
Source:
Area Balanced Gross Value Added GVA(B) 2015 2016 2017 2018 2019 Percentage Change 2015 – 2019 dumfries & Galloway 9,283 9,875 9,836 10,586 11,808 +27% South Ayrshire 9,540 11,334 12,164 12,046 13,452 +41% East Ayrshire 9,937 9,925 13,568 11,484 11,298 +14% Scotland* 11,323 11,721 12,141 12,596 13,220 +17%
3.3.1.8 Educational Attainment
Qualification levels held by the population of an area can also be considered an indicator of economic performance. Areas with a high proportion of well qualified people tend to perform comparatively better (in terms occupational classification, average wages, etc.) than areas characterised by low educational attainment.
This data is obtained through the Census and the highest level of qualification achieved by all people aged 16 and over is presented in Table 3-13. The qualification levels can be defined as follows:
• Level 1:
o Grade, Standard Grade, Access 3 Cluster, Intermediate 1 or 2, GCSE, CSE, Senior Certification or equivalent; GSVQ Foundation or Intermediate, SVQ level 1 or 2, SCoTVEC Module, City and Guilds Craft or equivalent; other school qualifications not already mentioned (including foreign qualifications).


• Level 3:
HnC, Hnd, SVQ level 4 or equivalent; other post-school but preHigher Education qualifications not already mentioned (including foreign qualifications).
• Level 2:
SCE Higher Grade, Higher, Advanced Higher, CSYS, A Level, AS Level, Advanced Senior Certificate or equivalent; GSVQ Advanced, SVQ level 3, onC, ond, SCoTVEC national diploma, City and Guilds Advanced Craft or equivalent.
• Level 4 and above: degree, Postgraduate qualifications, Masters, Phd, SVQ level 5 or equivalent; Professional qualifications (for example, teaching, nursing, accountancy); other Higher Education qualifications.
TABLE 3-13: HIGHEST LEVEL OF QUALIFICATION BY TERM-TIME ADDRESS
37 ECONOMIC ACTIVITY AND LOCATION IMPACTS REPORT | 3 So CI o-E C ono MIC B ASELI n E
Area Highest Level of Qualification Total People no Qualifications Level 1 Level 2 Level 3 Level 4 and above dumfries & Galloway 126,160 41,563 (33%) 31,078 (25%) 16,771 (13%) 9,614 (8%) 27,134 (22%) South Ayrshire 94,419 26,925 (29%) 20,828 (22%) 13,217 (14%) 9,704 (10%) 23,745 (25%) East Ayrshire 101,168 34,507 (34%) 24,651 (24%) 13,793 (14%) 10,092 (10%) 18,125 (18%) Scotland 4,379,072 1,173,116 (27%) 1,010,875 (23%) 627,423 (14%) 424,996 (10%) 1,142,662 (26%) Source: national records of Scotland (2022) Scotland’s Census (2011) Table Id QS501SCW
Table 3-13 shows the greatest proportion of people over the age of 16 in the study area have no qualifications. In the study area this figure sits above the Scottish average (27%) and is particularly high in dumfries & Galloway (33%) and East Ayrshire (34%). The most achieved qualification is Level 1, except in South Ayrshire where 25% of the population have achieved it is Level 4 and above.
Educational attainment is seen to be high along the western extent of the study area, particularly in the coastal areas of South Ayrshire and dumfries & Galloway and the most southern and northern parts of East Ayrshire. Also well represented is the town of dumfries and the eastern extent of dumfries & Galloway. Pockets of low education attainment are found across the area in all three Councils.
KEY POINT
Educational attainment in the region is slightly lower than the Scottish average. At the local authority level this is most apparent in East Ayrshire where 34% of the local population have no qualifications. By contrast South Ayrshire sees the highest proportion of Level 4 and above achievers at 25%, largely in line with the Scottish average.


3.3.2 Deprivation
The Scottish Index of Multiple deprivation (SIMd) is the Scottish Government’s standard approach to identifying areas of multiple deprivation in Scotland. The SIMd assesses the extent to which an area is deprived across seven domains: income, employment, education, health, access to services, crime, and housing. It is presented at the data zone level, across the 6,976 data zones which make up the country, and it assigns a rank of 1 (most deprived) to 6,976 (least deprived) to each.
Analysis of the SIMd often groups data zones below a certain rank, for example, the 5%, 10%, 15% or 20% most deprived data zones in Scotland. data is available for the years 2012, 2016 and 2020, and Figure 3-6 presents the most recent iteration to show the levels of deprivation in the study area.
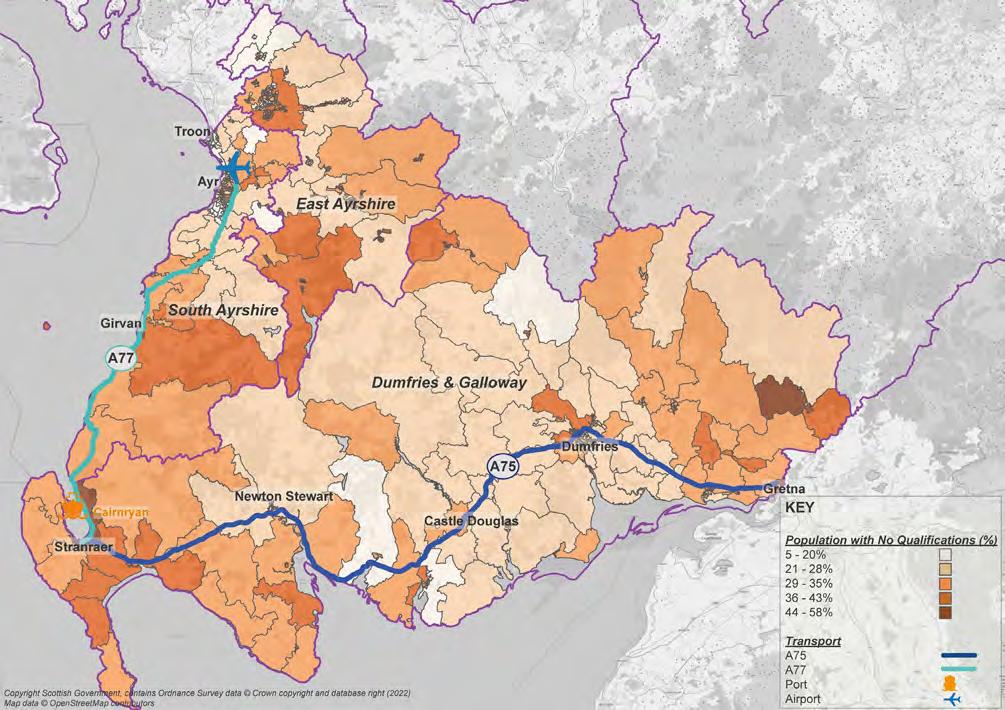
38 ECONOMIC ACTIVITY AND LOCATION IMPACTS REPORT | 3 So CI o-E C ono MIC B ASELI n E
FIGURE 3-5: PERCENTAGE OF POPULATION WITH NO QUALIFICATION
Spatial analysis of the SIMd dataset shows there to be concentrations of data zones classified within the “20% least deprived” bracket localised to the towns of Ayr, Troon, Kilmarnock, Stranraer, and dumfries, while pockets are also found along the A76 corridor as it travels from north Ayrshire to dumfries & Galloway. Similarly, areas classified within the “20% most deprived”, represented by the pictured red data zones, are most concentrated within these localities. The more rural areas, which make up most of the study area, are shown to rank mid-range in the SIMd ranking system.
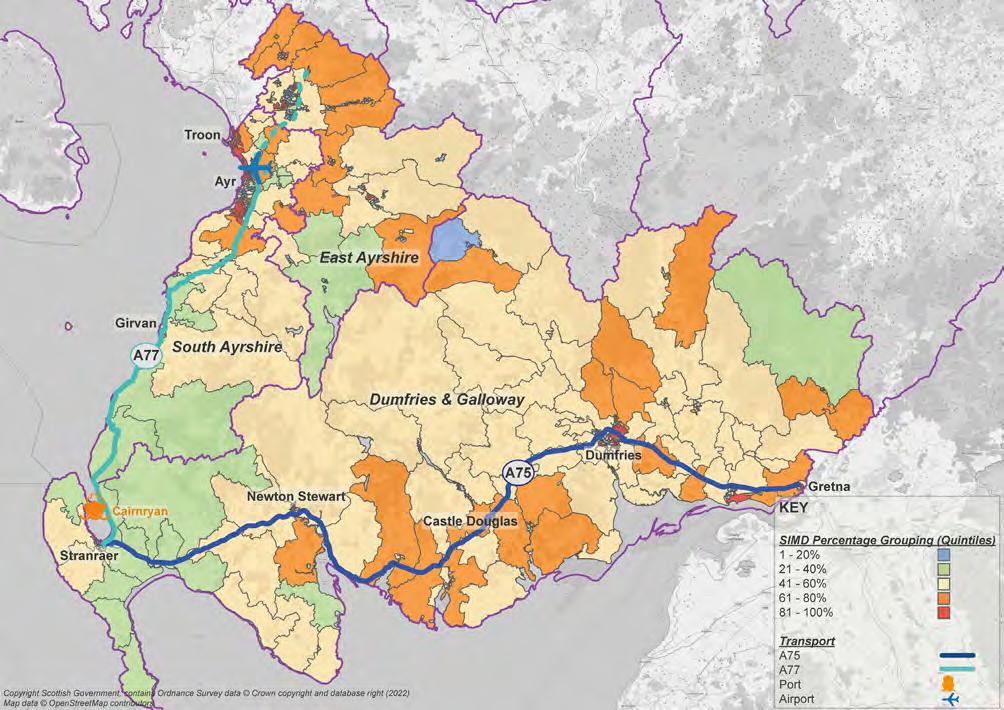

KEY POINT
The region’s urban settlements are found to be diverse, in terms of hosting both concentrated pockets of deprivation and affluence. The wider study area, which is predominantly rural, largely ranks mid-range in the SIMd ranking system.

3.3.3 Travel to Work
Scotland’s Census includes questions about the working population’s commute, including where people work and how they get there. The available data has been reviewed to provide an indication of the region’s key employment centres. This has been assessed by the total number of trips to workplace destinations within each Intermediate Zone boundary, as mapped in Figure 3-7.
39 ECONOMIC ACTIVITY AND LOCATION IMPACTS REPORT | 3 So CI o-E C ono MIC B ASELI n E
FIGURE 3-6: SCOTTISH INDEX OF MULTIPLE DEPRIVATION (SIMD) (2020)
Source: Scotland’s Census (2021) Census 2011 Table Id Wu03BSC – Location of usual residence and Place of Work by Method of Transport
Large extents of the study area are shown to generate few commuting trips, especially in consideration of their geographic area. This is particularly true of intermediate zones in central dumfries & Galloway where the landscape is largely rural.

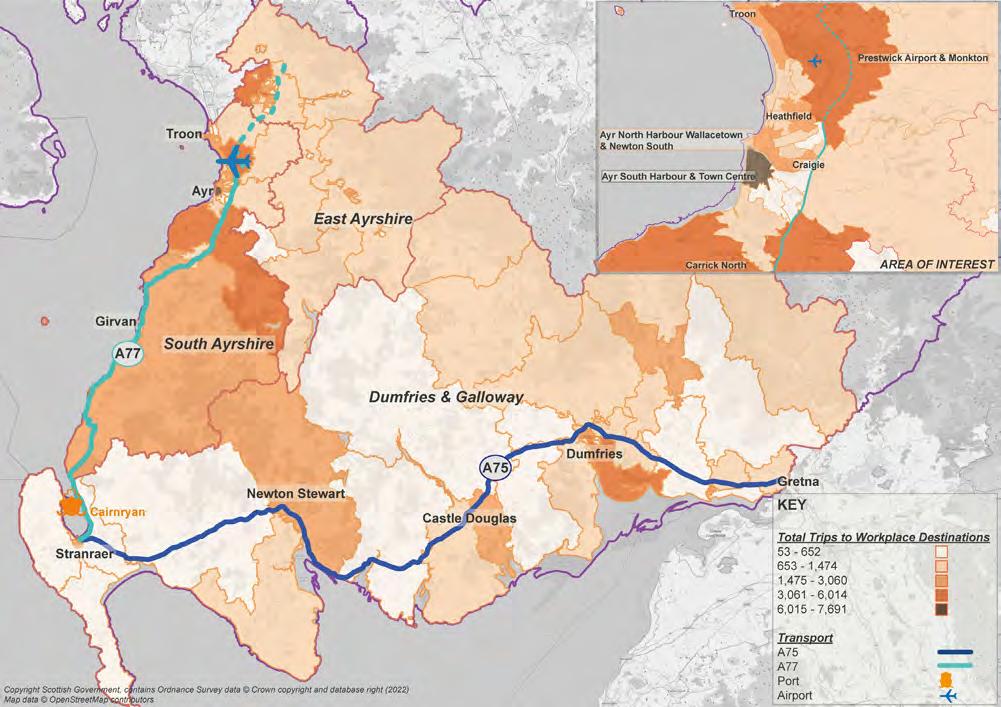
Popular workplace destinations are mainly found concentrated in the South Ayrshire area, as exhibited by the ‘area of interest’ highlighted in Figure 3-7. The greatest number of trips was seen to the ‘Ayr South Harbour and Town Centre’ area, which comprises a range of urban land uses including retail and leisure. Further popular employment centres are found within the ‘Prestwick Airport & Monkton’ and ‘Carrick north’ areas in South Ayrshire; ‘Kingholm’ in dumfries & Galloway; and in central and western Kilmarnock, East Ayrshire.
It is also important to understand how employees travel to work. The modal splits for commuting trips to the most popular workplace destinations in the study area are included in Figure 3-8 and the corresponding Table 3-14.

40 ECONOMIC ACTIVITY AND LOCATION IMPACTS REPORT | 3 So CI o-E C ono MIC B ASELI n E
FIGURE 3-7: TRAVEL TO WORK DESTINATIONS BY NUMBER OF TRIPS (ALL MODES)
Source: Scotland’s Census (2021) Census 2011 Table Id Wu03BSC – Location of usual residence and Place of Work by Method of Transport
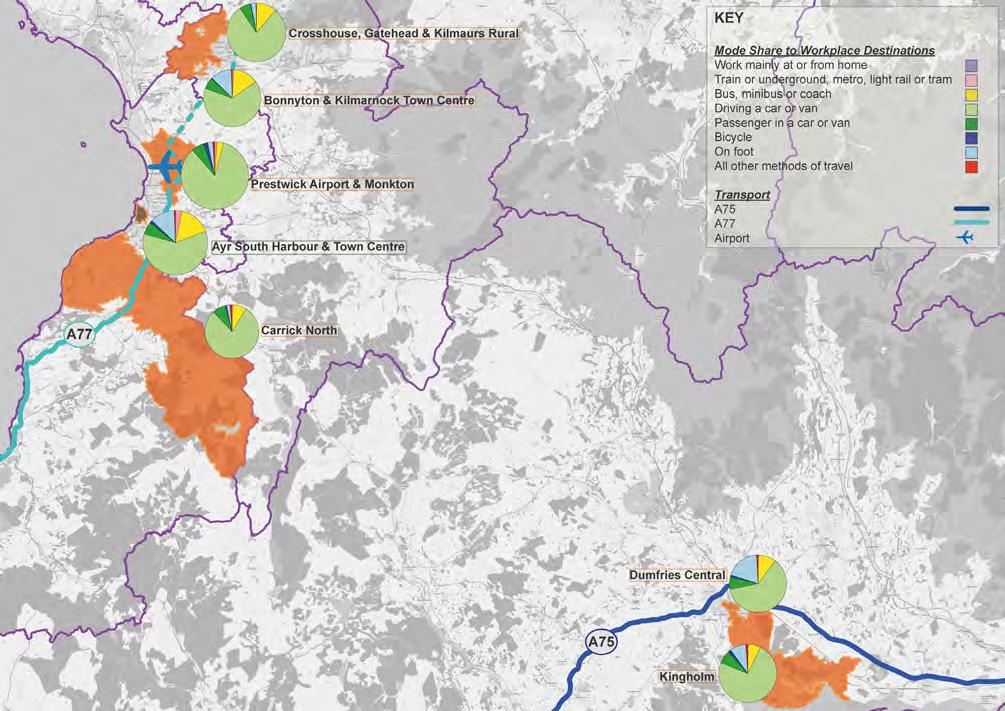

TABLE 3-14:
TO WORK MODE SHARE, MOST TRAVELLED TO DESTINATIONS

41 ECONOMIC ACTIVITY AND LOCATION IMPACTS REPORT | 3 So CI o-E C ono MIC B ASELI n E
FIGURE 3-8: TRAVEL TO WORK MODE SHARE, MOST TRAVELLED TO DESTINATIONS
Name All Commuting Trips Mode Share Work or mainly at or from home Train or underground, metro, light rail or tram Bus, minibus or coach d riving a car or van Passenger in a car or van Bicycle o n foot All other methods of travel Ayr South Harbour and Town Centre 7,691 0% 3% 16% 60% 6% 1% 12% 1% Prestwick Airport and Monkton 6,014 0% 1% 3% 84% 6% 2% 2% 1% dumfries Central 5,895 0% 0% 10% 61% 7% 1% 19% 1% Bonnyton and Kilmarnock Town Centre 5,561 0% 1% 14% 65% 6% 0% 12% 1% Kingholm 5,057 0% 0% 7% 74% 7% 2% 9% 1% Crosshouse, Gatehead and Kilmaurs rural 4,829 0% 0% 11% 79% 6% 0% 3% 0% Carrick north 4,043 0% 1% 8% 79% 8% 1% 2% 1%
Scotland’s Census (2021) Census 2011 Table Id Wu03BSC – Location of usual residence and Place of Work
Method of Transport
TRAVEL
Zone
Source:
by
Analysis of the commuting data presented across Figure 3-8 and Table 3-14, which it should be noted accords with this study’s preCovid baseline, shows a clear reliance on the private vehicle for trips to work in the study area. This is highest amongst those travelling to workplaces in the Prestwick Airport and Monkton, Kingholm, Crosshouse, Gatehead and Kilmaurs rural and Carrick north zones. The level of car/van passengers is seen to sit at a consistent 6-8% across the study area.
Where private vehicle use is lower, to workplaces in the Ayr South Harbour and Town Centre, dumfries Central and Bonnyton and Kilmarnock Town Centre zones, and in the region of 60-65% of all trips, trips by bus and on foot are higher in number. Bus use is highest in the Ayr area, at 16%, and as found at Section 2.5.2, this is supported by a high number of inter-urban bus services between Ayr and the neighbouring towns. This is also true of the Kilmarnock and dumfries areas which see a higher number of bus services across a day than their rural counterparts. Walking, which makes up 12% of the modal split in the Ayr South Harbour and Town Centre and Bonnyton and Kilmarnock Town Centre zones and a high of 19% in dumfries Central, is also better supported for trips within urban areas where the pedestrian network is denser.
KEY POINT
The South West Scotland labour market is relatively self-contained, with the highest levels of commuting trips seen between the South and East Ayrshire and dumfries & Galloway areas. The most-travelled-to workplace destinations in the region are in South Ayrshire, most notably in the ‘Ayr South Harbour & Town Centre’ and ‘Prestwick Airport & Monkton’ zones. Single occupancy car/van trips dominate the mode share as recorded by the 2011 Census.

3.4 Economic Performance
3.4.1 Active Businesses

To establish the number of active businesses in the study area, a snapshot of data from the uK-wide Inter-departmental Business register on 15th March 2019, as presented by the office for national Statistics, has been assessed. The register counts VAT and PAYE based enterprises and local units, and statistics are available for local authority areas in Scotland. Table 3 15 and Table 3 16 present the findings for the baseline year 2019, according to business size (in terms of number of employees) and broad industry group respectively.
Source: office for national Statistics (2019) uK Business: Activity, Size and Location – Table 10
42 ECONOMIC ACTIVITY AND LOCATION IMPACTS REPORT | 3 So CI o-E C ono MIC B ASELI n E
Area Number of Employees 0-4 5-9 10-19 20-49 50-99 100-249 250+ Total dumfries & Galloway 4,595 1,020 445 200 40 25 15 6,340 South Ayrshire 2,595 510 235 135 35 20 15 3,545 East Ayrshire 2,400 430 220 100 30 15 10 3,205 Scotland 132,405 23,425 11,800 5,915 1,840 995 695 177,075
TABLE 3-15: NUMBER OF ACTIVE BUSINESSES BY NUMBER OF EMPLOYEES (2019)
TABLE 3-16: NUMBER OF ACTIVE BUSINESSES BY BROAD INDUSTRY GROUP (2019)
Source: office for national Statistics (2019) uK Business: Activity, Size and Location – Table 16
Table 3-15 shows most of the businesses in the study area to be small to medium sized enterprises, based on their staffing levels. The most represented staffing level is 0-4 employees in each local authority area, and this is particularly true for East Ayrshire at 75% of all active businesses.


In Table 3-16 retail is shown to be the most popular industry across the study area by the number of active businesses. This is closely followed by the ‘professional, scientific & technical’ broad industry group.
The ‘agriculture, forestry & fishing’ industry group is also well represented across the study area and particularly in dumfries & Galloway, which has a large woodland resource. data has been obtained from the local authority, working in partnership with the Timber Transport Forum, on harvested timber volumes and their ‘exit point’ for transportation on the public road network in the southwest Scotland region. Figure 3-9 and Figure 3-10 show these exit points in the context of the A75 and A77 routes and charts the timber tonnages from 2020 and predicted levels in 2034 respectively.
43 ECONOMIC ACTIVITY AND LOCATION IMPACTS REPORT | 3 So CI o-E C ono MIC B ASELI n E
Area Dumfries & Galloway South Ayrshire East Ayrshire Scotland Broad Industry Group Agriculture, forestry & fishing 2,060 420 465 17,845 Production 425 250 270 12,685 Construction 690 460 435 21,810 Motor trades 205 135 125 5,585 Wholesale 270 180 120 7,300 retail 705 575 425 22,395 Transport & Storage (inc. postal) 270 145 130 7,505 Accommodation & food services 620 365 400 17,650 Information & communication 110 135 110 11,440 Finance & insurance 85 90 55 4,825 Property 150 160 95 6,745 Professional, scientific & technical 550 515 430 33,805 Business administration & support services 385 285 320 16,605 Public administration & defence 85 80 90 3,040 Education 165 100 115 5,205 Health 435 250 235 12,325 Arts, entertainment, recreation & other 475 395 295 16,360 Total 7,685 4,540 4,115 223,125
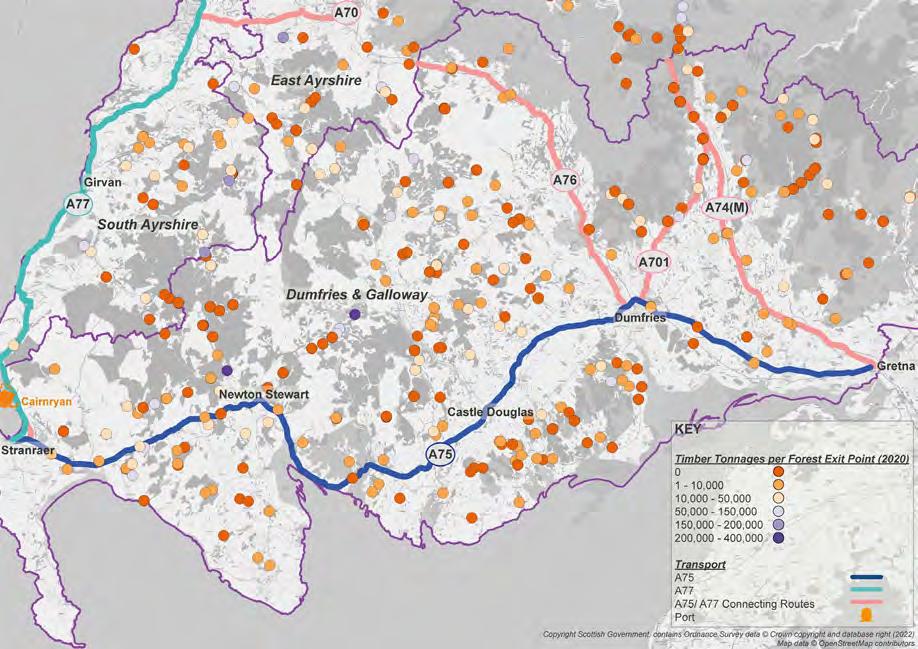
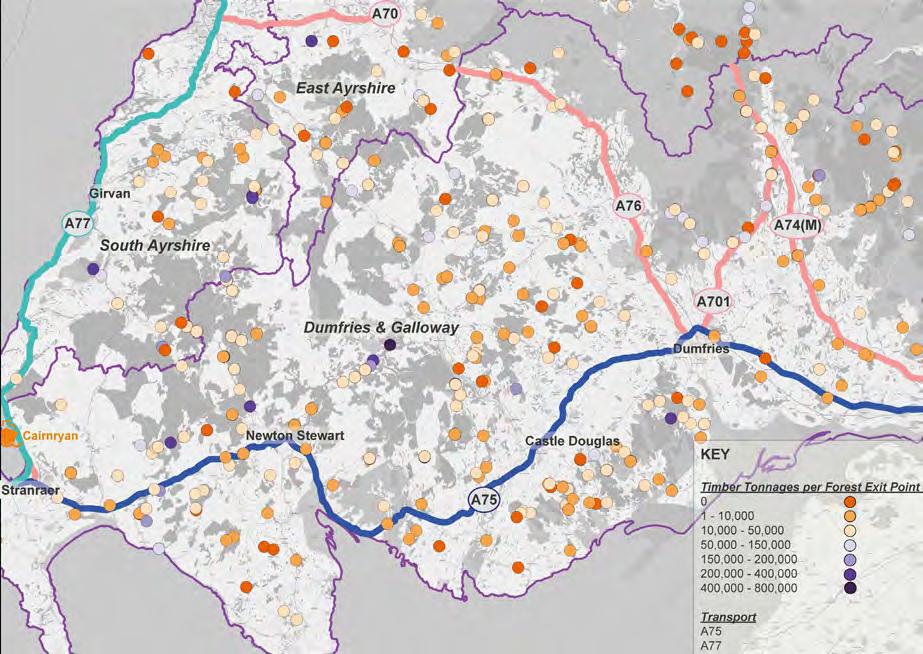


44 ECONOMIC ACTIVITY AND LOCATION IMPACTS REPORT | 3 So CI o-E C ono MIC B ASELI n E
FIGURE 3-9: TIMBER TONNAGES PER FOREST EXIT POINT, SOUTHWEST SCOTLAND (2020)
FIGURE 3-10: 15 YEAR PROJECTION OF TIMBER TONNAGES PER FOREST EXIT POINT, SOUTHWEST SCOTLAND (2034)
Between Figures 3-9 and 3-10, and the 15-year period in-between, an intensification in the quantity of harvested timber volumes at forest exist points throughout Southwest Scotland is anticipated. This is most evident where, in 2020, the baseline data shows many exit points across the study area to be inactive and registering 0 tonnes of timber. In the period to 2034, a large proportion of these sites become active and, most commonly, see a rise in tonnage between 10,000 and 50,000. This is seen, for example, in the vicinity of Moffat at forest exit points located along the A74(M) and around newton Stewart at exit points along the A75. The greatest timber volumes are anticipated in 2034 from exit points across dumfries & Galloway, with the highest (756,497 tonnes) located on the A712 The Queen’s Way due north of the A75 corridor at Gatehouse of Fleet.
Consultation with dumfries & Galloway Council’s South of Scotland Timber Transport officer has confirmed that the A75, A77 and A74(M) are used by most of the traffic associated with the timber trade in the region and that these routes are critical for the import/ export of timber. While the movement of timber is dependent on market demand, the officer noted prominent sawmills at Lockerbie and Carlisle for which the A74(M) and A75 provide strategic road connections from the study area and Scottish Central Belt.

KEY POINT
Across the region a high concentration of jobs in the construction and retail sectors is apparent. In dumfries & Galloway, however, this is overtaken by the ‘agriculture, forestry & fishing’ industry group, to which approximately 27% of all active businesses in the area can be ascribed. This is a freight-intensive sector and stakeholder engagement has confirmed the A75, A77 and A/M74 routes are critical for the import/export of timber, and that timber trade in the area is expected to intensify in the period to 2034.

3.4.2 Employment Change
The Business register and Employment Survey (BrES) publishes employee and employment estimates and is regarded as the official source of this information. The results from the period 2015 to 2019 have been extracted to assess the change in employment across the study area and these figures are compared to the Scottish average. Table 3-17, Table 3-18 and Table 3-19 show the total number of jobs, full-time jobs, and part-time jobs respectively. Please note that all data excludes jobs in farm-based agriculture.
TABLE 3-17: TOTAL EMPLOYEE JOBS BY LOCAL AUTHORITY AREA, 2015 - 2019
Source: office for national Statistics (2019) Business register and Employment Survey
TABLE 3-18: FULL-TIME EMPLOYEE JOBS BY LOCAL AUTHORITY AREA, 2015 - 2019
Source: office for national Statistics (2019) Business register and Employment Survey
45 ECONOMIC ACTIVITY AND LOCATION IMPACTS REPORT | 3 So CI o-E C ono MIC B ASELI n E
Area Total Employee Jobs 2015 2016 2017 2018 2019 Percentage Change 2015 – 2019 dumfries & Galloway 56,000 57,000 57,000 57,000 56,000 0% South Ayrshire 45,000 46,000 45,000 46,000 46,000 +2% East Ayrshire 40,000 41,000 40,000 40,000 39,000 -3% Scotland 2,435,000 2,454,000 2,441,000 2,478,000 2,470,000 +1%
Area Full-Time Employee Jobs 2015 2016 2017 2018 2019 Percentage Change 2015 – 2019 dumfries & Galloway 35,000 36,000 37,000 37,000 34,000 -3% South Ayrshire 29,000 30,000 29,000 30,000 29,000 0% East Ayrshire 25,000 26,000 26,000 25,000 24,000 -4% Scotland 1,613,000 1,636,000 1,612,000 1,645,000 1,639,000 +2%
TABLE 3-19: PART-TIME EMPLOYEE JOBS BY LOCAL AUTHORITY AREA, 2015 - 2019
Source: office for national Statistics (2019) Business register and Employment Survey
The BrES data summarised across Tables 3-17, 3-18 and 3-19 relays a shift from full-time to part-time jobs in the period 2015-2019, particularly in dumfries & Galloway and East Ayrshire. A general balancing effect was seen in dumfries & Galloway in this period, with regard to the total number of jobs, East Ayrshire however saw a percentage decrease of -3%. In South Ayrshire the number of fulltime jobs has remained consistent at 29,000-30,000 over the study period and the number of part-time jobs has fluctuated in a limited capacity between 16,000 and 17,000 in the same 5 year period.
KEY POINT
Trends in the total number of employee jobs in the period 2015 – 2019 show a certain level of stagnation in the creation of new jobs in the region. This is apparent in dumfries & Galloway in particular, while South and East Ayrshire saw respective increases and decreases by 1,000 jobs in this period. Full-time employment has followed a downward trend in the region since 2018, while part-time employment has risen in both dumfries & Galloway and East Ayrshire.
3.5 Tourism
Tourism is an important economic and social driver in Scotland. This section reviews the key tourism data for the study area, generally informed by Visit Scotland regional statistics, to show trends in the period 2015-2019. Where appropriate, comparisons are also made to the Scottish average for 2019.
3.5.1 Visitor Numbers and Spend

The following data refers to domestic and international overnight visits, as available for the dumfries & Galloway and Ayrshire & Arran* areas. It accounts for visitor numbers and tourism expenditure, as presented in Figures 3-11 and Figure 3-12.

46 ECONOMIC ACTIVITY AND LOCATION IMPACTS REPORT | 3 So CI o-E C ono MIC B ASELI n E
Area Part-Time Employee Jobs 2015 2016 2017 2018 2019 Percentage Change 2015 – 2019 dumfries & Galloway 21,000 21,000 20,000 20,000 22,000 +5% South Ayrshire 17,000 16,000 16,000 16,000 17,000 0% East Ayrshire 14,000 15,000 15,000 15,000 15,000 +7% Scotland 822,000 818,000 829,000 833,000 831,000 +1%


47 ECONOMIC ACTIVITY AND LOCATION IMPACTS REPORT | 3 So CI o-E C ono MIC B ASELI n E
FIGURE 3-11: DOMESTIC & INTERNATIONAL OVERNIGHT TOURISM, AYRSHIRE & ARRAN REGION*, 2015-2019
*Ayrshire & Arran region includes the East, north and South Ayrshire Council areas
Figure 3-11 suggests the Ayrshire & Arran region has most recently experienced a decline in the number of domestic trips, following consecutive years of incremental increase in the period 2015-2018. The year 2019 registered a 9% fall in domestic trips from 2018. The number of overseas trips was found to peak in 2018 at 106,000 overnight trips, in comparison to 39,000 overseas trips to the dumfries & Galloway region. In 2019, however, international visits and expenditure in the region were both at the lowest in a decade.

Figure 3-12 shows a decline in domestic travellers to dumfries & Galloway, from just over 800,000 in 2018 to 740,000 in 2019. despite this domestic travel to this region is found to be the strongest in the study area and the number of domestic visits in 2019 was the third highest in the period 2015-2019. Metadata made available by Visit Scotland for the period 2017-2019 describes most domestic visitors to the region to be residents of England and Wales, accounting for 59% of the overnight trips. A rise in international visitors from the 2018 reference point was seen in dumfries & Galloway in 2019. Total expenditure, accounting for domestic and international visitors, was the lowest in 2019 in three years.
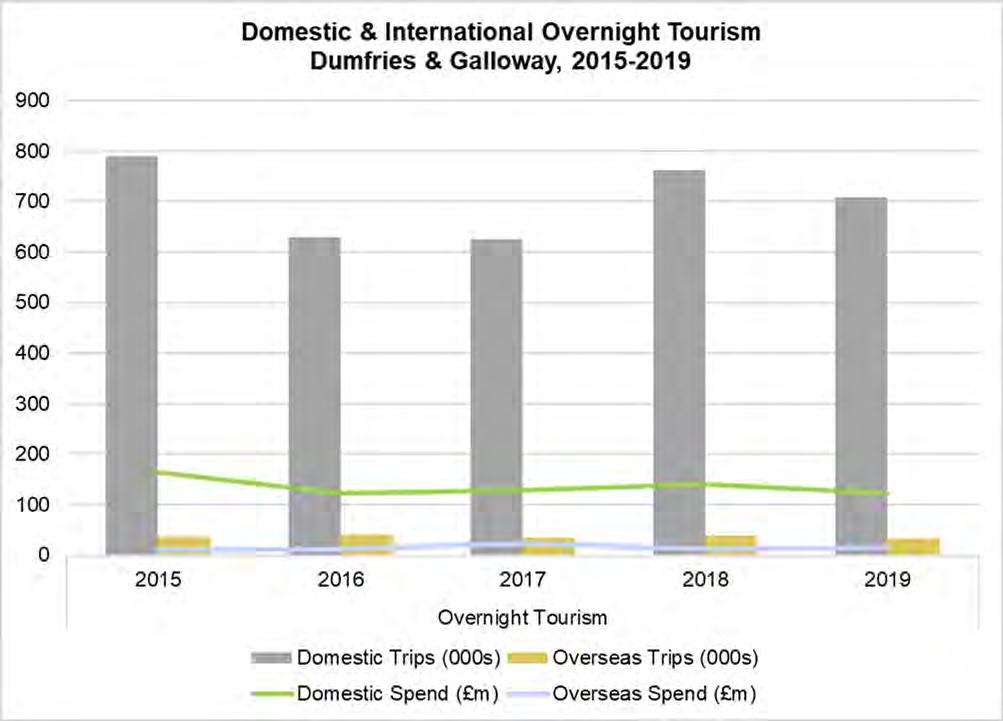
Visit Scotland also provide information on seasonality within the tourism industry. observations include the continued increase of spring trips to dumfries & Galloway and a decrease in winter travel. To Ayrshire & Arran, the popularity of autumn visits increased in the period 2017-2019 while winter and summer travel declined

3.5.2 Tourism Employment
Visit Scotland also provides statistics on tourism employment in Scotland with the most recent data available from the year 2017. These statistics show the importance of tourism related jobs in each local authority area, relative to the respective population and employment profiles. Table 3-20 outlines this data for the study area.
48 ECONOMIC ACTIVITY AND LOCATION IMPACTS REPORT | 3 So CI o-E C ono MIC B ASELI n E
Source: Visit Scotland (2021) Insight department: Ayrshire & Arran Factsheet 2019, dumfries & Galloway Factsheet 2019
FIGURE 3-12: DOMESTIC & INTERNATIONAL OVERNIGHT TOURISM, DUMFRIES & GALLOWAY REGION, 2015-2019
TABLE 3-20: TOURISM JOBS PER LOCAL AUTHORITY AREA, 2017
Source: Visit Scotland (2018) Insight department: Tourism Employment in ScotlandTable 5 Table 3-20 shows tourism to be a noteworthy contributor to employment in dumfries & Galloway and South Ayrshire, representing 9% and 12% of total employment in each area respectively. For both local authority areas this is higher than the Scottish average of 8% and not significantly less than the highest proportion of 15% in Argyll & Bute. The level of tourism employment in East Ayrshire is amongst the lowest in the country, the lowest being East renfrewshire (3%).
KEY POINT
The tourism industry in Ayrshire and Arran is relatively well developed yet tourism revenue has most recently seen a slow decline. In dumfries & Galloway, the tourism industry is well established, and the area is popular for domestic trips with the highest proportion of British travellers visiting in the whole of Scotland. Jobs in the tourism industry in South Ayrshire and dumfries & Galloway are over-represented relative to the national average. A key matter for exploration is the extent to which the area’s current transport infrastructure in the area is constraining the important tourism sector and through-trips to the Ports of Cairnryan.


3.6 Property
Property prices and levels of development are indicators of an area’s economic activity and desirability. Locations with significant planned development and higher than average house prices provide an indication of high demand, which itself is driven by employment opportunities, transport connections and quality of life factors. This section considers the residential property market in the study area.
3.6.1 New Dwellings
Table 3-21 presents the number of new dwellings which came forward in each Local Authority area in 2019.
TABLE 3-21: SCOTLAND’S NEW HOUSING SUPPLY BY LOCAL AUTHORITY (2019)
Source: Scottish Government (2019) Housing Statistics 2019 – Key Trends
East Ayrshire is seen to have led the way in house building during this period, with an addition of 367 dwellings to the area’s housing supply. The percentage of private and housing association new builds within this total is in line with the Scottish averages, 71% and 19% respectively, while the number of local authority new builds exceeds the Scottish average by 4%.
49 ECONOMIC ACTIVITY AND LOCATION IMPACTS REPORT | 3 So CI o-E C ono MIC B ASELI n E
Area Tourism Jobs per 1,000 of Population % Tourism Employment of Total Employment in Local Authority Area % Tourism Jobs of Scotland Total dumfries & Galloway 40 9% 3% South Ayrshire 53 12% 3% East Ayrshire 21 5% 1% Scotland 38 8% 100%
Area New Housing Supply Private new Build Housing Association new Build Local Authority new Build rehabilitation Conversions Total dumfries & Galloway 141 (72%) 56 (28%) 0 (0%) 0 (0%) 0 (0%) 197 South Ayrshire 119 (48%) 124 (50%) 0 (0%) 0 (0%) 4 (2%) 247 East Ayrshire 261 (71%) 66 (18%) 35 (10%) 0 (0%) 5 (1%) 367 Scotland 15,710 (71%) 4,169 (19%) 1,413 (6%) 316 (1%) 665 (3%) 22,273
In the dumfries & Galloway and South Ayrshire areas, private and housing association new builds comprise the majority, if not all, of the new housing supply.


KEY POINT
In 2019 housing development in the region was dominated by private new builds in line with the Scotland-wide trends. In South Ayrshire housing association new builds represented 50% off all new housing supply. East Ayrshire led the way in house building during this period, with an addition of 367 dwellings to the area’s housing supply.
3.6.2 Housing Values
residential property transactions and values are recorded by registers of Scotland and analysis of the supplied sales data is made available by the Scottish Government on a yearly basis. Table 3-22 presents the median prices for second hand and new build sales that were recorded/ registered in the period 2015 – 2019 in the Local Authority areas that comprise study area.
TABLE 3-22: MEDIAN RESIDENTIAL PROPERTY PRICES BY LOCAL AUTHORITY AREA, 2015 - 2019
Source: Scottish Government, register of Scotland (2021) House Price Statistics
Median residential property prices in the study area in 2019 were found to be significantly lower than the Scottish average of £155,000. The Scottish average has risen steadily since 2017 and gained an 11% increase in the period 2015-2019. This pattern was not found to be true across the study area, particularly in Ayrshire where peak property prices experienced in 2018 fell considerably in 2019. dumfries & Galloway recorded the greatest increase in the study area in the period 2015-2019 at 8%, representing a change in median prices from £120,000 to £130,000.
Property prices are also made available at the lower data zone (2011) geography level. Figure 3-13 utilises this spatial data to show the median house prices across the study area, according to registers of Scotland records from 2019.
50 ECONOMIC ACTIVITY AND LOCATION IMPACTS REPORT | 3 So CI o-E C ono MIC B ASELI n E
Area New Housing Supply 2015 2016 2017 2018 2019 Percentage Change 2015 – 2019 dumfries & Galloway £120,000 £120,000 £124,000 £130,000 £130,000 +8% South Ayrshire £132,000 £130,000 £131,050 £135,000 £130,000 -2% East Ayrshire £95,000 £96,500 £101,888.50 £110,000 £98,235 +3% Scotland £140,000 £140,000 £145,000 £151,000 £155,000 +11%
The lowest property prices, within the £0 - £38,000 bracket, are found dispersed throughout the study area. Figure 3-13 shows these to be primarily located along the central section of the A75 in dumfries & Galloway and on the outskirts of towns in Ayrshire, including Ayr and Kilmarnock. By contrast, the highest property prices are found in rural areas of dumfries & Galloway, including near Moffat, dalbeattie and Castle douglas, while in South Ayrshire these are located mainly on coastal and rural land south of Ayr and in the vicinity of Turnberry.

KEY POINT

overall, house prices in South West Scotland are lower than the Scottish median and, in the period 2015 – 2019, have not matched the rate of increase seen in Scotland as a whole. The median residential property price across Scotland has risen steadily since 2017, while those in South and East Ayrshire have declined despite a peak in 2018. House prices in dumfries & Galloway remained at the peak seen in 2018. Improved accessibility as a result of the A75/A77 proposals may increase the price of existing properties and stimulate demand for new properties.

51 ECONOMIC ACTIVITY AND LOCATION IMPACTS REPORT | 3 So CI o-E C ono MIC B ASELI n E
FIGURE 3-13: MEDIAN RESIDENTIAL PROPERTY PRICES (2019)
3.7 Local Development Plans – Allocated Sites

dumfries & Galloway and South Ayrshire Councils have adopted respective Local development Plans (LdPs) and the strategic land allocations and spatial priorities contained within have been reviewed in the context of their interaction with the A75 and A77 routes.

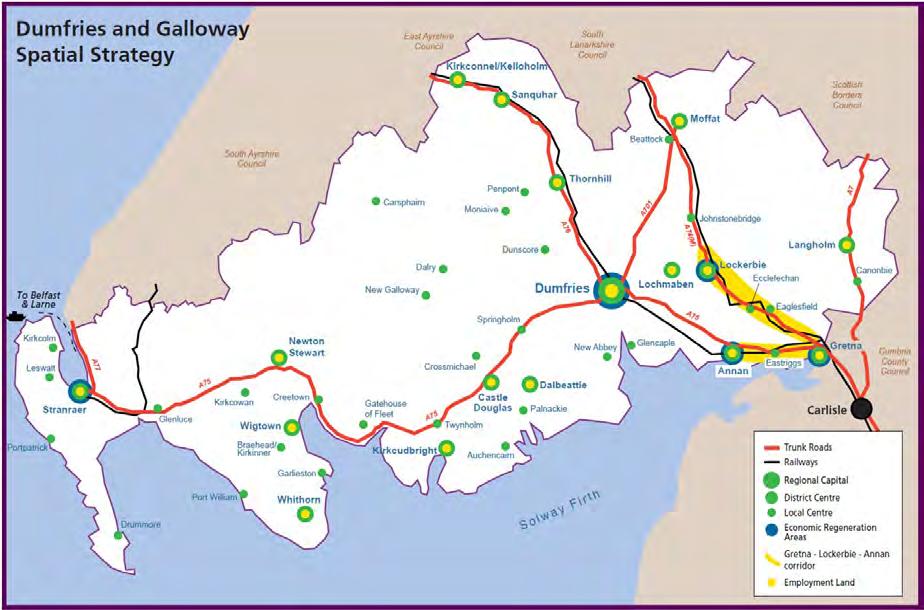
3.7.1 Dumfries & Galloway
Local development Plan 2 (LdP2) (2019) covers the whole dumfries & Galloway council area and provides the planning framework and guidance for the future use and development of land in towns, villages and the rural area.
The spatial strategy set out within recognises the challenges presented by the area’s rural nature and dispersed population, particularly in relation to reducing private vehicle use and in decreasing carbon emissions. The strategy, as presented in Figure 3-14, responds to this challenge by largely concentrating future development to existing settlements with a good range of services, facilities and employment opportunities. This translates to most new development being focused on dumfries and the district and Local Centres highlighted in Figure 3-14.
Source: dumfries & Galloway Council (2019) Local development Plan 2
The allocated sites for housing, business/ industry and mixed-use development have been reviewed in more detail for the regional Capital dumfries and the district centre of Stranraer at the western extent of the A75 route.
3.7.1.1 dumfries
LdP2 emphasises dumfries’ position as the regional Capital and plans for investment in the town to strengthen this role. Figure 3-15 maps the allocated sites for development across the housing, mixed-used and business & industry land uses, as defined in the LdP. There is a clear focus on housing development throughout the town, aligning with the Council’s Housing Supply Target 2017-2029. Meeting of this target requires the delivery of 2,798 homes in dumfries, 53% of the overall target for 2029.
52 ECONOMIC ACTIVITY AND LOCATION IMPACTS REPORT | 3 So CI o-E C ono MIC B ASELI n E
FIGURE 3-14: DUMFRIES & GALLOWAY LDP2 SPATIAL STRATEGY
Site Ref. Proposed Development Quantum
dFS.H1 259 residential units
dFS.H2 1,000 residential units
dFS.H4 176 residential units
dFS.H5 489 residential units
dFS.H6 32 residential units
dFS.H7 500 residential units
dFS.H8/ H205 374 residential units

dFS.H218 261 residential units
dFS.H221 26 residential units
dFS.H236 Mixed-use/ 40 residential units
dFS.H262 104 residential units
dFS.H263 7 residential units
dFS.H265 52 residential units
dFS.H270 30 residential units
Total 3,350 residential units

shows a significant number of sites are allocated for housing development across the town. These vary in scale and include several smaller infill and brownfield sites and larger suburban sites. This level of housing delivery is not antiwcipated to be completed within the LdP2 period (2019-2029) and therefore is likely to comprise incremental growth over an extended period.
Figure
The allocated business & industry and mixed-use sites are intended by the Council to provide a supply of land across the town to meet industrial/ commercial and mixed-use needs. It is highlighted that several sites, including on established estates, include vacant land and units which provide an opportunity for reuse.
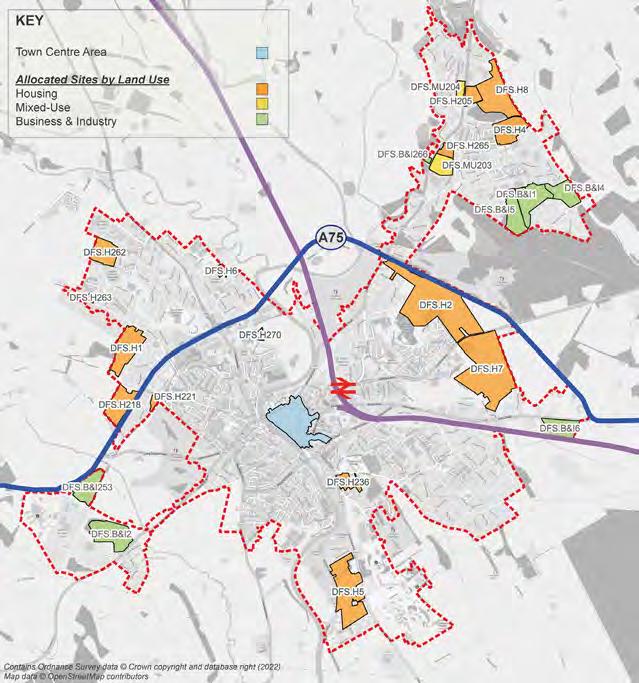
53 ECONOMIC ACTIVITY AND LOCATION IMPACTS REPORT | 3 So CI o-E C ono MIC B ASELI n E
TABLE 3-23: ALLOCATED HOUSING SITES, DUMFRIES (UP TO 2029)
Site Ref. Site Area Business & Industry dFS.B&I1 10.89 ha dFS.B&I2 12.31 ha dFS.B&I4 7.12 ha dFS.B&I5 8.34 ha dFS.B&I6 8.46 ha dFS.B&I253 9.12 ha dFS.B&I266 0.54 ha Mixed-use dFS.Mu203
0.5
TABLE 3-24: ALLOCATED BUSINESS & INDUSTRY AND MIXED-USE SITES, DUMFRIES (UP TO 2029)
5.47 ha/ 70 residential units dFS.Mu204 2.39 ha dFS.Mu205
ha
3-15
FIGURE 3-15: ALLOCATED SITES, DUMFRIES (UP TO 2029)
Source: South Ayrshire Council (2022) Local development Plan 2 Spatial Strategy
3.7.1.2
Stranraer is designated as a district Centre in the region. The Council have outlined several planning objectives for the town, most significantly to maximise and redevelop the waterfront area given the relocation of the Stena ferry terminal to Cairnryan.
TABLE
Site Ref. Proposed Development Quantum
STr.H2 158 residential units
STr.H3 49 residential units
STr.H4 74 residential units
STr.H5 18 residential units
STr.H6 9 residential units
STr.H7 63 residential units
STr.H8 35 residential units
STr.H204 18 residential units
Total 424 residential units

Source: dumfries & Galloway Council (2019) Local development Plan 2

Figure 3-16 shows planned housing development within the Stranraer settlement boundary to be largely located along the western extent with select redevelopment sites located to the south of the town centre. Business & industrial sites are similarly allocated at the town’s edge and lie adjacent to existing sites of this nature.
The town’s one mixed-use site allocation (STr.Mu1) comprises the redevelopment of Stranraer Waterfront. A Masterplan has been adopted as planning guidance for the site and its main aim is to improve the relationship between the waterfront and the town centre.
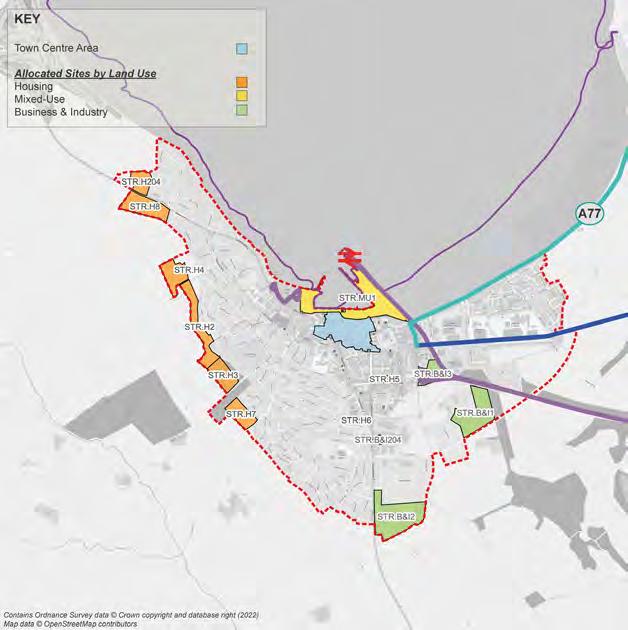
54 ECONOMIC ACTIVITY AND LOCATION IMPACTS REPORT | 3 So CI o-E C ono MIC B ASELI n E
Stranraer
3-25: ALLOCATED HOUSING SITES, DUMFRIES (UP TO 2029)
FIGURE 3-16: ALLOCATED SITES, STRANRAER (UP TO 2029)
Site Area Business & Industry STr.B&I1 6.73 ha STr.B&I2 9.82 ha STr.B&I3 3.38 ha STr.B&I204 0.44 ha Mixed-use STr.Mu1 13.17 ha
TABLE 3-26: ALLOCATED BUSINESS & INDUSTRY AND MIXEDUSE SITES, DUMFRIES (UP TO 2029)
Site Ref.
3.7.2 South Ayrshire
South Ayrshire Council’s current Local development Plan, LdP1, was adopted in 2014 to outline spatial development aims and guidelines for the period 2014-2024. This document, and the subject specific ‘Town Centre and retail development Plan’ (2017), remain the incumbent guidance, however the Council has this year published but not yet adopted LdP2. LdP2 is set to supersede these documents, once adopted, and is therefore considered in this study.

The spatial strategy set out within LdP2 splits the Council area in two, between the Kyle and Carrick Investment Areas. Figure 3-17 shows the mostpopulated towns of Ayr, Prestwick, and Troon to be located within the Kyle Investment Area. Girvan and Maybole, also designated as Core Investment Towns, are the most populous of the southern region.
The allocated sites for the proposed range of land uses have been reviewed in more detail for Ayr, as the municipal centre, and the adjoining Prestwick, and the town of Girvan at the southern extent of the A77 route.
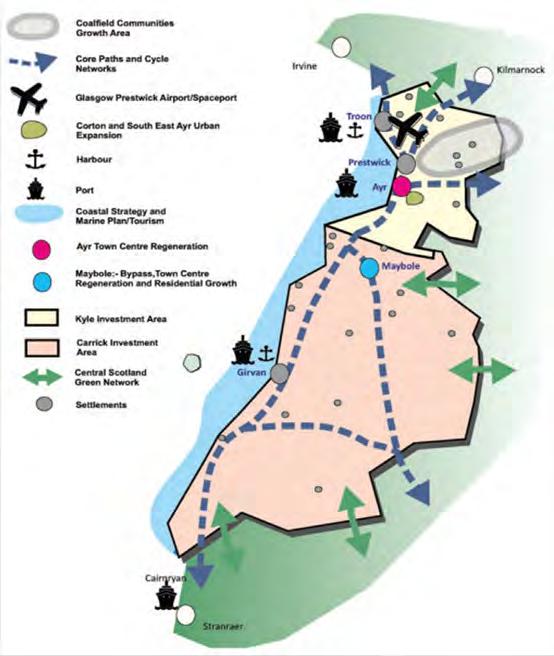

3.7.2.1 Ayr and Prestwick
Ayr and Prestwick, alongside Troon, have been identified as key areas in which to increase the provision of affordable housing. Across the settlement plans pictured in Figure 3-18, large housing release sites are found to the north and south of Ayr town centre and at the eastern and western extents of Prestwick. The housing allocation sites are detailed in Table 3-27.
Source: South Ayrshire Council (2022) Local development Plan 2 Spatial Strategy
55 ECONOMIC ACTIVITY AND LOCATION IMPACTS REPORT | 3 So CI o-E C ono MIC B ASELI n E
Settlement Site Ref. Site Name Indicative Capacity Status Ayr AYr AH1 dunlop Terrace 10 Proposed AYr AH2 Westwood Avenue 25 Proposed AYr1 Mainholm 160 Existing AYr2 Holmston House 33 Existing AYr4 South East Ayr 2,700 Existing Prestwick PrES AH1 Afton Avenue & Afton Park 25 Proposed PrES2 St Cuthbert Golf Club 45 Proposed
TABLE 3-27: HOUSING ALLOCATION SITES, AYR AND PRESTWICK
FIGURE 3-17: SOUTH AYRSHIRE LDP2 SPATIAL STRATEGY
Source: South Ayrshire Council (2022) Local development Plan 2 Spatial Strategy
Table 3-27 shows site AYr4 (South East Ayr) to comprise the largest housing allocation site with a total capacity of 2,700 dwellings. Further housing infill sites are planned throughout Ayr and Prestwick and two larger housing realise sites are proposed along the coast in Prestwick and south of Prestwick International Airport.

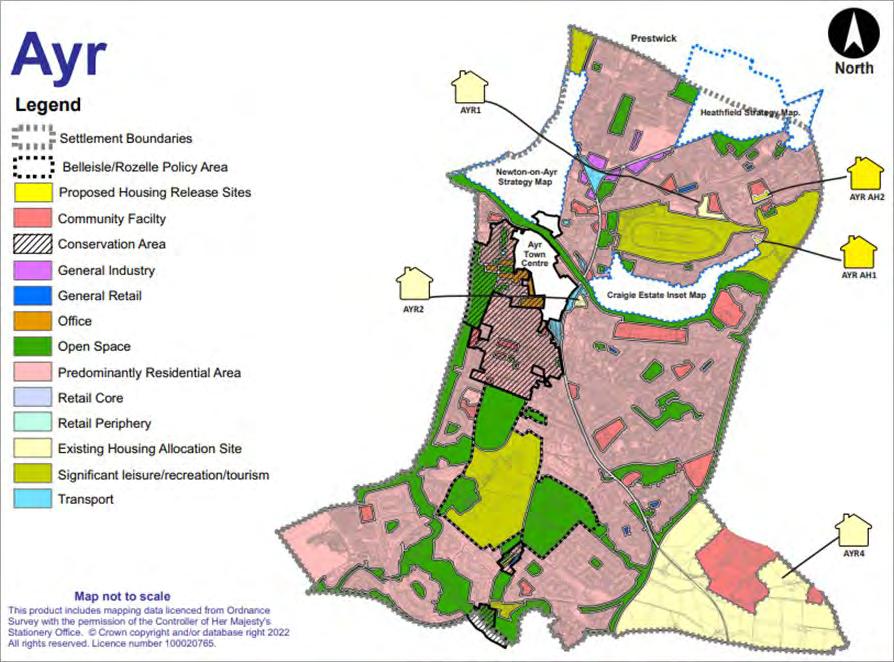
FIGURE 3-18: ALLOCATED SITES & LAND USE DESIGNATIONS, ALL LAND USES, AYR AND PRESTWICK

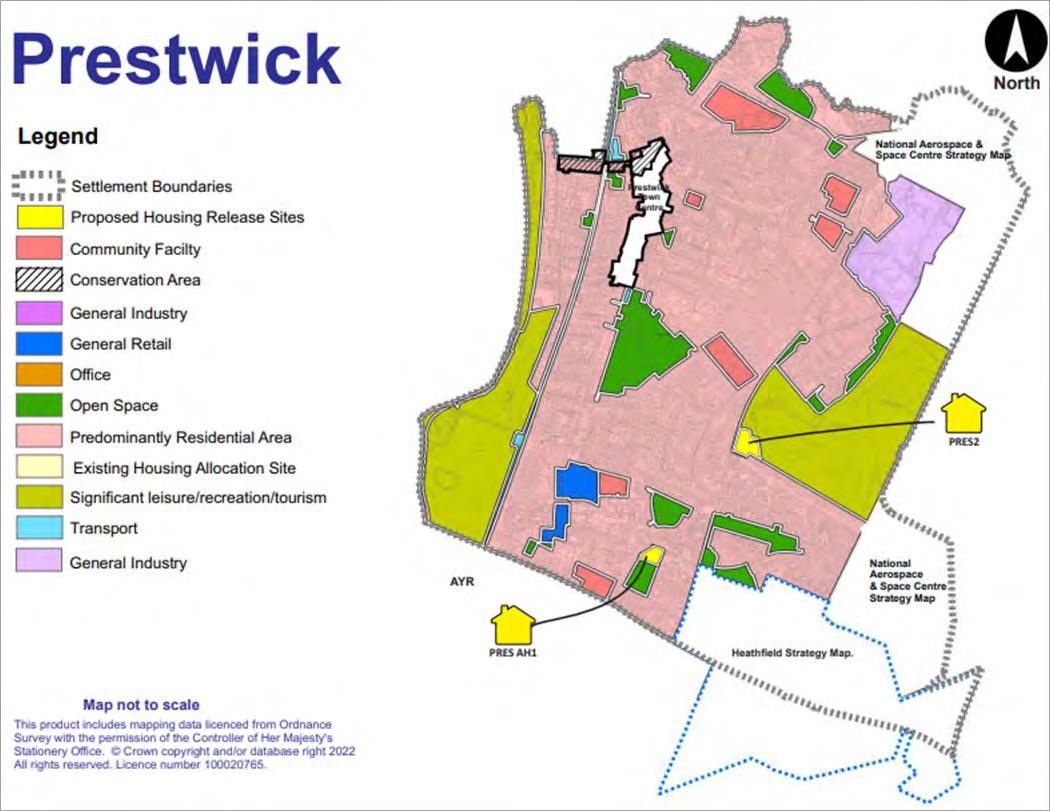
56 ECONOMIC ACTIVITY AND LOCATION IMPACTS REPORT | 3 So CI o-E C ono MIC B ASELI n E
3.7.2.2
Girvan is the southernmost populous town in the South Ayrshire Council area and is dissected by the route of the A77. The town comprises a substantial residential area and planned development within the existing settlement boundary seeks to add limited housing opportunity and create a significant leisure/ recreation/ tourism destination and establish industry around the port and harbour. The allocated sites and land use designations are pictured in Figure 3-19.
FIGURE 3-19: PROPOSED SITE ALLOCATIONS & LAND USE DESIGNATIONS, GIRVAN
The housing allocation sites are detailed in Table 3-28.
TABLE 3-28: HOUSING ALLOCATION SITES, GIRVAN

Source: South Ayrshire Council (2022) Local development Plan 2 Spatial Strategy

Table 3-28 shows housing allocation sites in Girvan to comprise infill sites amongst existing residential areas. GIr1, the largest of the sites, plans for an extension of the settlement in the south-eastern area.
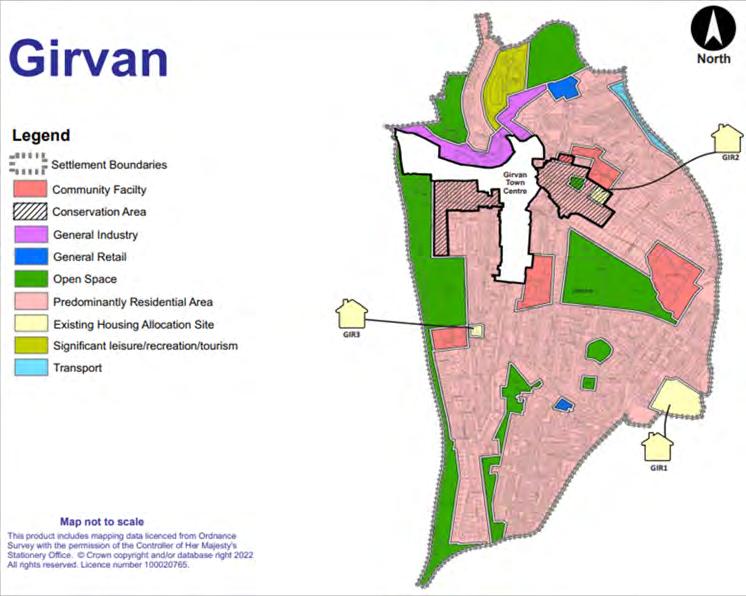
57 ECONOMIC ACTIVITY AND LOCATION IMPACTS REPORT | 3 So CI o-E C ono MIC B ASELI n E
Girvan
Site Ref. Indicative Capacity Status GIr1 48 Existing GIr2 25 Existing GIr3 17 Existing
3.8 Summary
This chapter has presented a detailed profile of the economy in the South West Scotland region. The key point of note is that a ‘twospeed economy’ is apparent, with a more affluent and in many cases well-qualified population concentrated along the populous areas of the Ayrshire coastline and in the urban areas of dumfries & Galloway.

Analysis of the socio-economic data for the region suggests the economy of South West Scotland is less robust and less productive than that of Scotland as a whole. This is manifested through higher unemployment levels, lower productivity, lower incomes, and greater dependence on the public sector for employment. Access to employment opportunities is therefore important in ensuring equality of access to economic and educational centres for those living in the area and supporting the long-term sustainability of rural communities.
Analysis has suggested that the economy is heavily dependent on dumfries & Locharbriggs as a local hub of population and centre of employment. There is limited integration with the economies of neighbouring areas, potentially given the problems associated with more strategic longer distance travel in and out of the region.

The relocation of the ferry port from Stranraer to Cairnryan in 2011 has resulted in vacant land and an opportunity for redevelopment of Stranraer Waterfront. It should be noted, however, that good transport infrastructure and strong connectivity is required to support such redevelopment. dumfries & Galloway Council’s Strategic outline Programme, reshaping Stranraer and the West region, states that repurposing the waterfront is essential to align Stranraer with marine leisure and tourism opportunities, and that an expanded Marina Project will serve as a major economic driver upon which the whole town redevelopment will pivot. The inactive Ministry of defence site at Eastriggs and the former nuclear power station at Chapelcross (currently decommissioned) both offer development opportunities with their potential better realised if easier and better accessibility to the sites is enabled.
The region has a strong tourism offering with a long coastline, forests, and green spaces. The Southern upland Way, a 214-mile-long footpath between Cockburnspath on the north Sea coast and Portpatrick close to Stranraer, the 7Stanes mountain bike sites, multiple castles, museums, golf courses, Galloway Forest Park, festivals, and the unESCo Biosphere are examples of the range of attractions on offer for tourists. The Lake district suffers from overcrowding, particularly during the summer months and areas such as the Galloway Forest could attract tourists. However, inadequate transport connections have inhibited this potential with poor connectivity including long journey times within and to the region considered a major deterrent to attracting visitors to the area. This in turn could encourage tourism employment in the area.
58 ECONOMIC ACTIVITY AND LOCATION IMPACTS REPORT | 3 So CI o-E C ono MIC B ASELI n E
4 Public Engagement
4.1 Introduction
To fully explore the transport and economic issues identified throughout this report, an extensive public engagement exercise was undertaken. The purpose of this outreach was to gather public views on the problems and opportunities facing the South West Scotland region, and to allow for public input to influence decision making and the direction of the A75/ A77 study.
4.2 Engagement Objectives
The public engagement exercise was guided by two sets of objectives. The first of these served to ensure communications were wellpromoted and inclusive, with the aim of involving a wide audience and encouraging contributions, while the second served to direct communications to capture meaningful data/ responses.
4.2.1 Engagement Reach Objectives
The engagement reach objectives have been designed to get more people to see and engage with the overall A75/ A77 study. In doing so, the objectives also ensured the engagement process was fair and aimed to gather results reflective of the study area’s wider population.
The established engagement reach objectives are as follows:
• To reach members of the public situated across the South, north and East Ayrshire, and dumfries & Galloway Council areas


• To provide an online platform for engagement that is accessible to all
• To encourage contributions and gather feedback from a wide audience
• To gain support and buy-in from residents/ the local population
4.2.2 Data Collection Objectives
data collection objectives were also developed to align the public communications and intended data collection. The principal data collection method comprised an online survey and, as such, the following objectives influenced the survey design:
• The main reasons for travel along the A75 and A77
• The main methods of travel along the A75 and A77
• The main issues along the A75 and A77
• The methods to improve actual and perceived safety for route users
• Where there are missing connections primarily relating to accessibility
• How the community feels improvements would impact them, both positively and negatively
4.3 Methods of Engagement
Several engagement methods were employed to ensure a wide audience was reached and to achieve a fair representation of the view of the study area’s wider population. Participants were offered several ways to interact with the study and this was seen as an effective way to gather different forms of feedback, increase interest and offer alternatives to those who may find certain methods of engagement inaccessible.
The methods of engagement, and indeed their promotion, aimed to be as accessible and inclusive as possible. offering options for online, email and telephone feedback meant that members of the public could voice their opinions regardless of internet availability and technology skill level. A short email address (A75A77@sweco.co.uk) was also regularly promoted, offering further support to those that may require it.
The following sections describe the methods of engagement.
4.3.1 Digital Storytelling Platform
The ArcGIS StoryMaps builder was used to create a digital storytelling platform which was hosted online at https://storymaps.arcgis. com/stories/f02832874ebd4c78b892e46fccfb4ffe. A sample of the end webpage is provided in Figure 4-1.
59 ECONOMIC ACTIVITY & LOCATION IMPACTS (EALI) STUDY 4 Pu BLIC En GAGEME n T
The webpage was clear in its origins from the outset, featuring the logos of the study’s commissioning organisations and providing a clear introduction as follows:
“The A75 and A77 are part of Scotland’s trunk road network which connects the country’s major cities, towns, airports and ports, and enables the movement of people, goods and services.
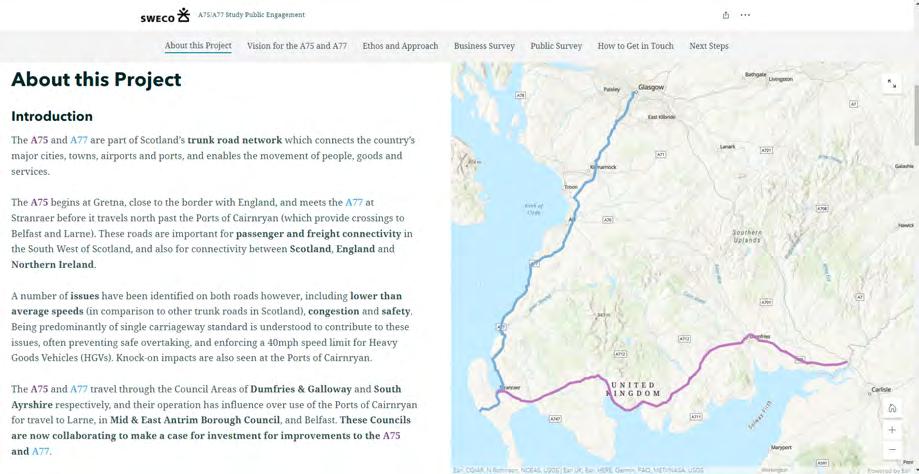
The A75 begins at Gretna, close to the border with England, and meets the A77 at Stranraer before it travels north past the Ports of Cairnryan (which provide crossings to Belfast and Larne). These roads are important for passenger and freight connectivity in the South West of Scotland, and also for connectivity between Scotland, England and Northern Ireland.
A number of issues have been identified on both roads however, including lower than average speeds (in comparison to other trunk roads in Scotland), congestion and safety. Being predominantly of single carriageway standard is understood to contribute to these issues, often preventing safe overtaking, and enforcing a 40mph speed limit for Heavy Goods Vehicles (HGVs). Knock-on impacts are also seen at the Ports of Cairnryan.
The A75 and A77 travel through the Council Areas of Dumfries & Galloway and South Ayrshire respectively, and their operation has influence over use of the Ports of Cairnryan for travel to Larne, in Mid & East Antrim Borough Council, and Belfast. These Councils are now collaborating to make a case for investment for improvements to the A75 and A77.”
4.3.1.1 digital design and outreach
To ensure the webpage was inclusive, previous feedback from the royal national Institute of Blind People (rnIB) on the South Ayrshire Active Travel Strategy was referred to. The rnIB recommended that an email address be provided to allow for further comment beyond any character limit in the associated survey.

The webpage was also designed in collaboration with dumfries & Galloway Council’s Community Planning and Engagement department to ensure the engagement process and material met with the national Standards for Community Engagement1

A webpage was deemed to be the most appropriate principal method of engagement for this study, primarily due to its geographic reach. Access to broadband is also high throughout the study area, meaning the webpage should be accessible to a large percentage of the population. Where internet access is not possible, the communications progressed as part of the promotional strategy crossed several media channels (including radio) and provided telephone contact details.
The public webpage received 1,162 visits in total.
1 Scottish Community development Centre (2022) national Standards for Community Engagement, accessed 23/08/2022 at https://www.voicescotland.org.uk/national-standard
60 ECONOMIC ACTIVITY & LOCATION IMPACTS (EALI) STUDY 4 Pu BLIC En GAGEME n T
FIGURE 4-1: SAMPLE OF THE DIGITAL STORYTELLING PLATFORM
4.3.2 Online Survey
A feedback survey was also created and linked within the digital storytelling platform. The survey was designed according to the data collection objectives featured at Section 4.2.2 and included questions on the themes of usage of the A75/A77, mode of travel and place of residence.
The survey also featured on the Councils’ online Consultation Hubs. It was live for a period of 9 weeks, from 28th March to 30th May 2022.
4.4 Promotional Strategy
With the aim of reaching a wide and diverse audience, and ensuring fair representation across the region, an effective promotional strategy was vital. The promotion team, which included Council officers, played a pivotal role in promoting the engagement exercise by circulating posters, running radio adverts, posting across social media, emailing lists and including promotions across the Council websites.
These media channels were used for promotional means as follows:

• Radio
over a 7-day period beginning 14th May 2022, the advertising group Bauer Create transmitted a 30-second advert across the Absolute radio, Magic, Kiss, Scala, GHr, Planet rock, Kerrang! radio, Heat and Jazz FM radio stations. This broadcast reached 3,285 listeners and Bauer Create reported a total impressions delivered of 17,058.
• Social Media
Facebook and Twitter were used to share the engagement exercise and feedback survey. Posts were shared from Council accounts on the 10th and 15th May 2022. Engagement statistics show the Twitter posts to have generated 1,840 impressions, Facebook posts to have culminated in 17,339 impressions and the feedback survey received 97 direct clicks.
• Email and Telephone
A promotional email was circulated to 4,800 Council staff across the region and 28 Ward Councillors and Chief officers were sent a more comprehensive briefing note on the study. A further 11 South of Scotland MP’s and MSP’s were also contacted regarding the engagement.
A project-specific Sweco email address was set up and promoted on all materials and communications, and dedicated phone numbers were provided for Council officers at South Ayrshire and dumfries & Galloway Councils.

4.5 Feedback Survey Results
4.5.1 Overview
The online feedback survey was live for a period of 9 weeks and in that time a total of 624 responses were registered. respondents were asked their regional location and postcode, and initial analysis was undertaken with this data to summarise where most respondents are in relation to the A75/ A77 routes. Figure 4-2 displays the centroids of postcodes which represent 5% or more of the total postcodes supplied.
61 ECONOMIC ACTIVITY & LOCATION IMPACTS (EALI) STUDY 4 Pu BLIC En GAGEME n T
4.5.2 Quantitative Data Summary

4.5.2.1

Mode of Travel
All participants were asked their most common travel mode. The majority of respondents (90%) registered car. This percentage, while more than the regional average, is not unexpected as it is assumed such a roads-based survey, based on strategic trunk roads, would attract mostly private vehicle users. Figure 4-3 shows the complete modal split.
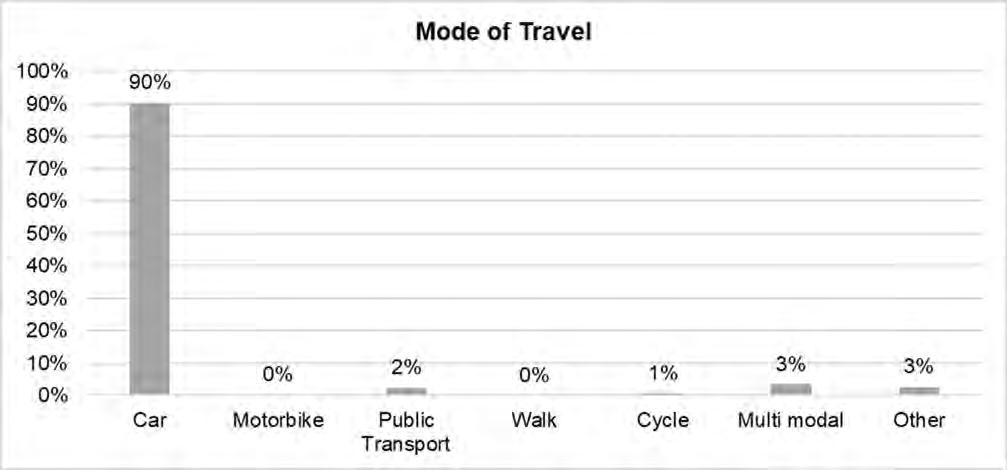

62 ECONOMIC ACTIVITY & LOCATION IMPACTS (EALI) STUDY 4 Pu BLIC En GAGEME n T
FIGURE 4-2: MOST COMMON POSTCODES OF RESPONDENTS
Figure 4-2 highlights most responses were received from residents of Ayr and Stranraer. It should be noted that public engagement was not undertaken in Mid and East Antrim.
FIGURE 4-3: PUBLIC FEEDBACK SURVEY - MAIN MODE OF TRAVEL
4.5.2.2 reason for Travel
respondents were also asked their typical reasoning for using the A75/ A77 routes, covering both their primary and secondary reasons. The primary uses of these routes were found to be work related, while secondary uses were most commonly related to errands and leisure/ social activity. The results are shown in Figure 4-4.
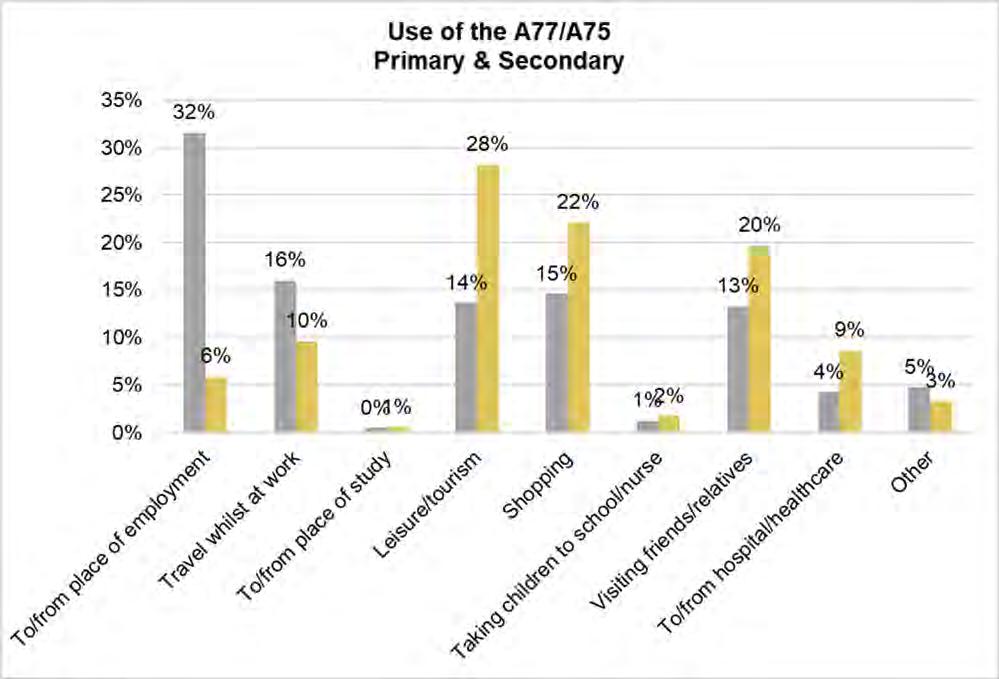
4.5.3 Qualitative Data Summary
All respondents were provided the opportunity to write a closing comment. Initial analysis of the comments provided has categorised them based on the following themes/ areas:
• dualling
• Bypassing villages
• Improving safety on the routes
• Improving road conditions on the routes
• Sustainable travel options
• Improving services along the routes


• Economic benefit/ risk of changes
Table 4-1 shows a selection of comments received under each category. Most comments received relate to the need to dual the A75 and A77, and/or add extra passing places/ overtaking opportunities.
63 ECONOMIC ACTIVITY & LOCATION IMPACTS (EALI) STUDY 4 Pu BLIC En GAGEME n T
FIGURE 4-4: PUBLIC FEEDBACK SURVEY - PRIMARY AND SECONDARY USES OF THE A75/ A77 ROUTES
TABLE 4-1: PUBLIC COMMENTS ACCORDING TO IDENTIFIED THEMES
Category Comment
Dualling Any future improvements should be to dual carriageway standard, with a view to linking all upgrades in future creating fully dualled roads.
Both roads need dualling. roundabouts are a stupid idea because they just increase journey times. That’s before you take in to account the environmental impact of HGVs having to slow/stop and build up speed again
More overtaking lanes
needs to be more dual carriageways and the bad corners at Kirkcowan need to be addressed
Bypasses
By-Pass the remaining towns and villages (Girvan, Kirkoswald,etc)
The stretch between Girvan South and Smyrton, 3-miles south of Ballantrae, badly needs something done to straighten out some of the bad corners. There have been far too many avoidable deaths. Ballantrae should be by-passed too
Bypass the remaining 2 villages on the A75 Crocketford and Springholm
I believe there is another junction being added to the a75 in the village of Springholm this will cause more problems


Safety Long overdue for this upgrade will make journey safer, faster connectivity and keep traffic away from towns where possible
Make it less dangerous- winter it’s terrifying with huge lorries - dual or motorway upgrade to dual carriage way would be safer for all who use the road on a regular basis, also would be more beneficial for all emergency services
The road through Cairnryan is in constant state of disrepair, and the village is heavily impacted by the amount of trucks going through - often breaking the speed limit. other vehicles are also often racing through to try to meet the ferries
Road Condition Fix the potholes and standing water in a lot of places
Are potholes/ruts in road going to be improved from what they are at present?
Both road surfaces are badly in need of repair/replacement, the potholes are very damaging to my car and make driving more hazardous
The entire road needs a massive resurface and could possibly benefit from relocations due to blind corners and impatient commuters
Sustainable Travel
A new railway constructed parallel to the A75 would be desirable, complete cycle path
Please re-instate the dumfries to Stranraer railway to take some of the freight lorries off the road
More cycle paths/paths to help the safety by providing alternate route
Bring back train line instead of more trucks on A75
Services May I suggest considering a couple of service stations along the A75 between Annan and Stranraer? Preferably with public toilets please?
More laybys to allow HGV/LGV to take mandatory breaks & for tourists/visitors the chance to take a break
Economy Village shops, the pub, the Inn on the Loch and others rely on the passing trade to survive
Make it dual carriageway to help improve the economy, links within the regions but mostly to make it safer to pass & cope with volumes of traffic, reduce driver frustrations & save lives
dualling the A75 would make the road safer bring more accessibility to the port and other parts of the region attracting jobs firms and people of working age
It’s not worth it - a worthwhile and effective use of the money would be to drastically improve public transport across the region, especially dumfries & Galloway
64 ECONOMIC ACTIVITY & LOCATION IMPACTS (EALI) STUDY 4 Pu BLIC En GAGEME n T
4.6 Summary
The following key messages can be extracted from the public engagement undertaken to date:
• The most popular primary reason for travelling along the A75 and A77 routes is for work


• The most popular secondary reason for travelling along the A75 and A77 routes is for running errands and/or for leisure/ social activities
• The A75 and A77 are heavily used, with 79% of respondents using these corridors weekly and 34% using them daily
• There is an overarching feeling amongst the population that dualling of the A75 and the A77 is needed. However, if this could not be achieved, extra passing places and overtaking opportunities could relieve some issues experienced
• road safety along both routes is a serious concern amongst the public. Creating bypasses around villages along the A75 and A77 corridors would go some way in improving safety for these settlements
• Improvements to the A75 and A77 would help support the local economy, through increased tourism, trade, and port accessibility
• Increasing capacity along the A75 and A77 will lead to increased HGV movements. Targeted investment in alternative freight transport, such as rail, will better future proof the region
It is recommended that as the study progress, additional targeted consultation should be completed to ensure that up-to-date public contributions are used in a meaningful way.
65 ECONOMIC ACTIVITY & LOCATION IMPACTS (EALI) STUDY 4 Pu BLIC En GAGEME n T
5 Business Engagement
5.1 Introduction
To achieve a wider understanding of how transport connectivity impacts business operations in the region, an important task in the wider study was to carry out a business survey. The business survey targeted firms located across the South, East and north Ayrshire and dumfries & Galloway Council areas.
5.2 Engagement Objectives
The business engagement exercise, like the public engagement, was guided by a set of objectives. The first of these served to ensure communications were well-promoted and inclusive, with the aim of involving a wide audience and encouraging contributions, while the second served to direct communications so as to capture meaningful data/ responses.
5.2.1 Engagement Reach Objectives
The engagement reach objectives have been designed to involve the maximum number of businesses and encourage their participation with the overall A75/ A77 study. In doing so, these objectives also ensured the engagement process was fair and aimed to gather results reflective of the study area’s business population.
The established engagement reach objectives are as follows:
• To reach businesses based across the South, north and East Ayrshire, and dumfries & Galloway Council areas


• To provide a clear survey that is accessible to all
• To encourage contributions and gather feedback from a wide audience
• To engage with key decision makers within businesses
5.2.2 Data Collection Objectives
In addition to the engagement reach objectives, data collection objectives were also created to guide the business engagement process. The principal data collection method comprised an online survey and, as such, the following data collection objectives influenced the survey design:
• The main sectors that operate in the vicinity of the A75 and A77
• Current businesses freight activity
• Current business views on the A75/ A77 routes
• Business attitudes to improvements, such as dual carriageways, bypasses and rail stations and lines
• Key drivers behind sustaining and growing a business in the region
5.3 Business Survey
5.3.1 Overview
The business survey was carried out by telephone campaign during the 6-week period between 16th March and 27th of April 2022. A telephone campaign was chosen as the principal method of engagement as it was deemed the most direct and reliable way of reaching key decision makers in businesses.
A total of 126 responses were registered from the business survey. The geographical spread of responses was found to be successfully concentrated along the A75 and A77 routes, as shown in Figure 5-1.
66 ECONOMIC ACTIVITY & LOCATION IMPACTS (EALI) STUDY 5 Bu SI n ESS En GAGEME n T
To support the telephone campaign, an online landing page for the study was made available for businesses wanting to understand more about the project. The landing page, hosted at https://storymaps.arcgis.com/stories/44fabcbce7dc4f918e8e494eee30c39e, featured an introduction to the study, including the Councils’ vision, next steps and contact details. A sample of the webpage is included at Figure 5-2.
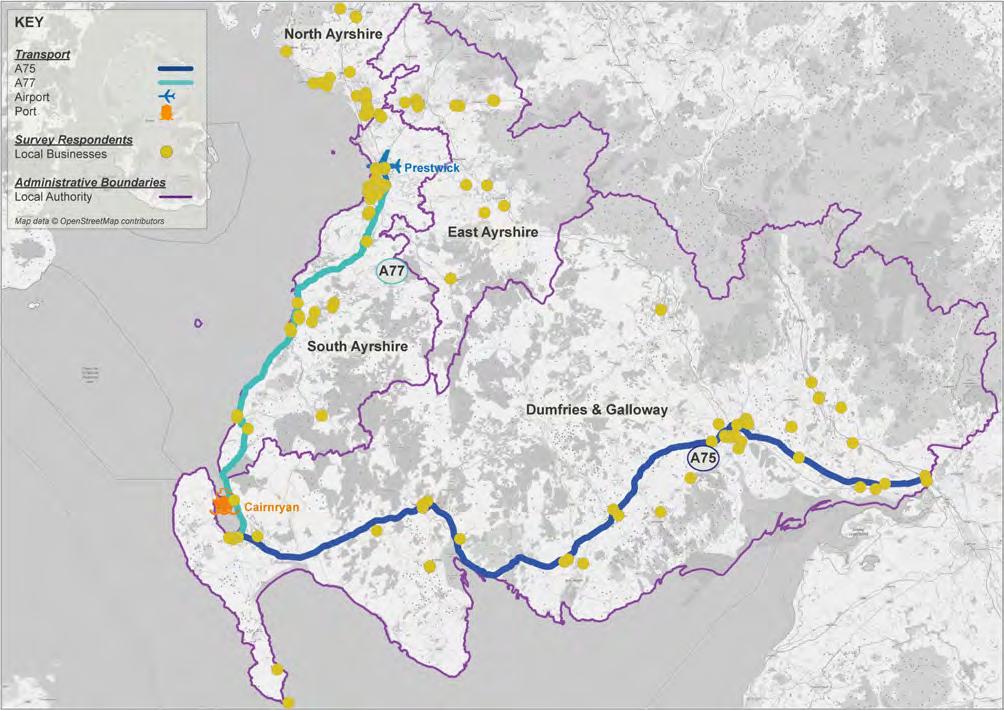


67 ECONOMIC ACTIVITY & LOCATION IMPACTS (EALI) STUDY 5 Bu SI n ESS En GAGEME n T
FIGURE 5-1: BUSINESS SURVEY - GEOGRAPHICAL SPREAD OF RESPONDENTS
5.3.2 Business Survey Results
A summary of the business survey results is provided below and is set out according to key business characteristics and identified transport and economic themes. Where appropriate the results are analysed according to business sectors, as grouped by the ‘freight intensive’ and ‘non-freight intensive’ descriptors. Freight intensive sectors were established as follows:
• Agriculture, Forestry & Fishing
• Mining, Quarrying & utilities

• Manufacturing
• Construction
• retail
5.3.2.1 Location
The geographic spread of participating businesses fell equally within the South Ayrshire (43%) and dumfries & Galloway (43%) Council areas, reflecting the survey’s target audience. The businesses within these areas are currently most affected by the conditions of the A75 and A77 and would be anticipated to experience the greatest impact if an improvement package is progressed. A small pocket of businesses located in north Ayrshire also partook in the survey (12%), as well a handful of responses from businesses in East Ayrshire (2%) and the wider region (1%). These results are shown in Figure 5-3.

68 ECONOMIC ACTIVITY & LOCATION IMPACTS (EALI) STUDY 5 Bu SI n ESS En GAGEME n T
FIGURE 5-2: SAMPLE OF BUSINESS ENGAGEMENT ONLINE LANDING PAGE
5.3.2.2 Principal Sectors


Most of the participating business were found to operate in the retail (20%), education (16%) and manufacturing (15%) sectors. The survey was, however, able to reach a strong range of businesses operating in further sectors, as shown in Figure 5-4.
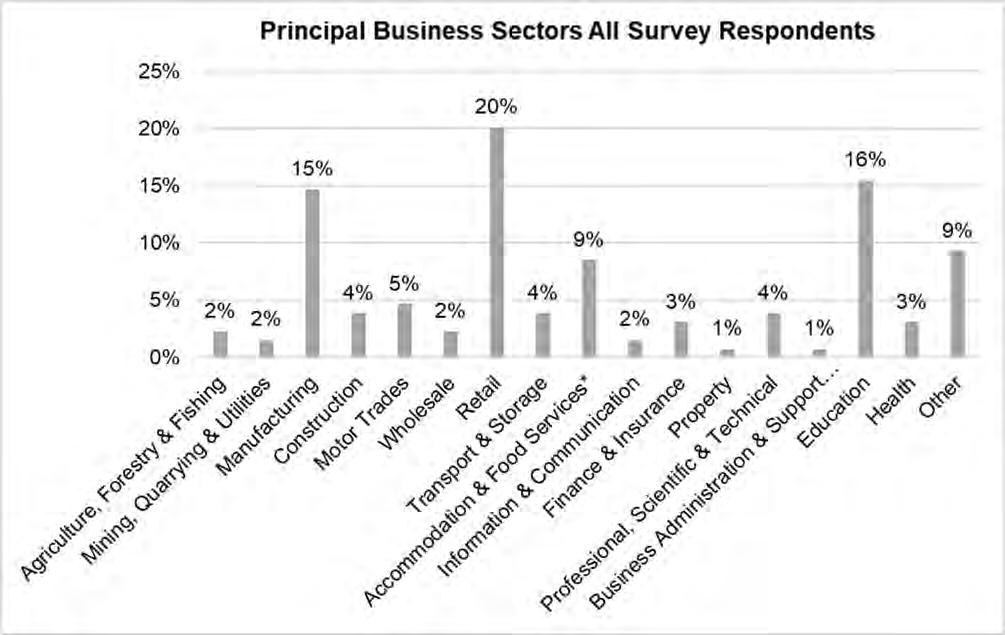
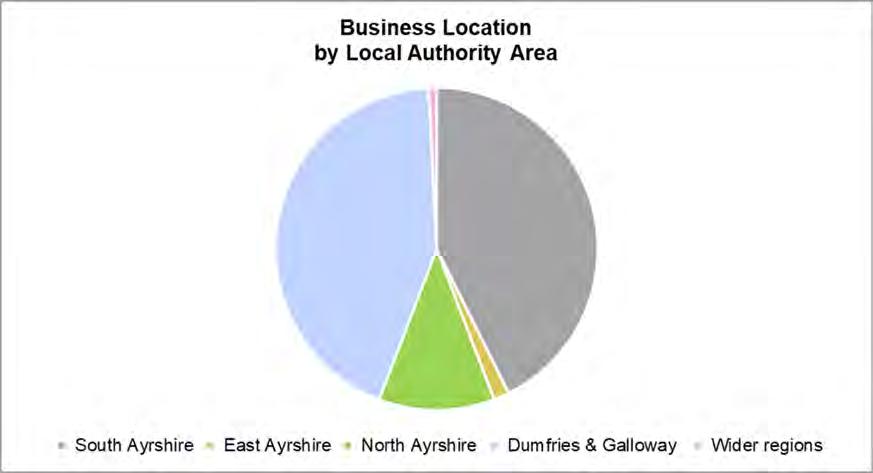
69 ECONOMIC ACTIVITY & LOCATION IMPACTS (EALI) STUDY 5 Bu SI n ESS En GAGEME n T
FIGURE 5-3: LOCATION OF PARTICIPATING BUSINESSES
FIGURE 5-4: PRINCIPAL BUSINESS SECTORS, PARTICIPATING BUSINESSES
5.3.2.3 Freight related Activity
respondents were asked the nature of their main freight-related activities. The results, presented for freight-intensive and nonfreight intensive industry sectors, are shown in Figure 5-5.
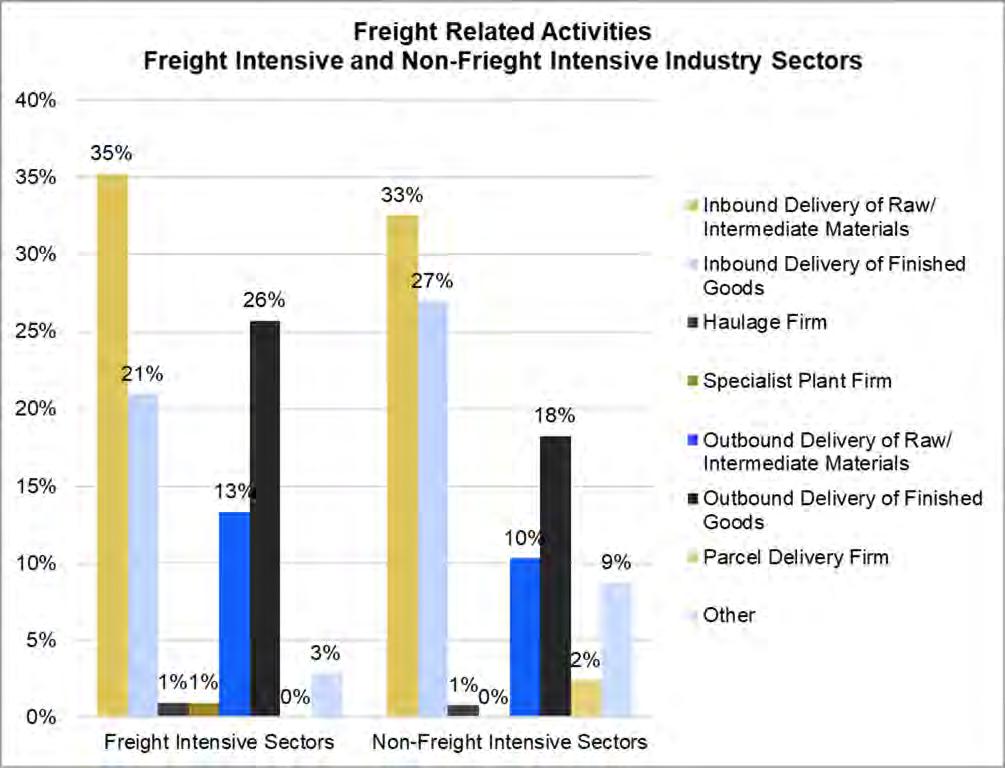
Most participating businesses, across the freight-intensive and non-freight intensive sectors, were found to use freight in the delivery of raw/ intermediate materials and finished goods. For freight intensive sectors, this is most apparent for the inbound delivery of raw/ intermediate materials (35%) and the outbound delivery of finished goods (26%) which accords with the wellrepresented manufacturing industry. Also significant for the non-freight intensive sectors is the inbound delivery of finished goods (33%) as sectors such as education and accommodation/ food services receive goods essential for their operation.
5.3.2.4 Freight Transportation Modes

An insight into the principal modes of freight used by businesses was also recorded. The results are presented for freight-intensive and non-freight intensive industry sectors in Figure 5-6.

70 ECONOMIC ACTIVITY & LOCATION IMPACTS (EALI) STUDY 5 Bu SI n ESS En GAGEME n T
FIGURE 5-5: BUSINESS FREIGHT RELATED ACTIVITIES
As per the national trend, road freight transport is shown to be the dominant mode amongst the surveyed businesses. For the freightintensive sectors, HGVs (or lorries) are most-used (52%) while LGVs (or vans) represent a lesser but important mode for transferring goods (37%). The non-freight intensive sectors typically employ HGVs and LGVs equally (41%).
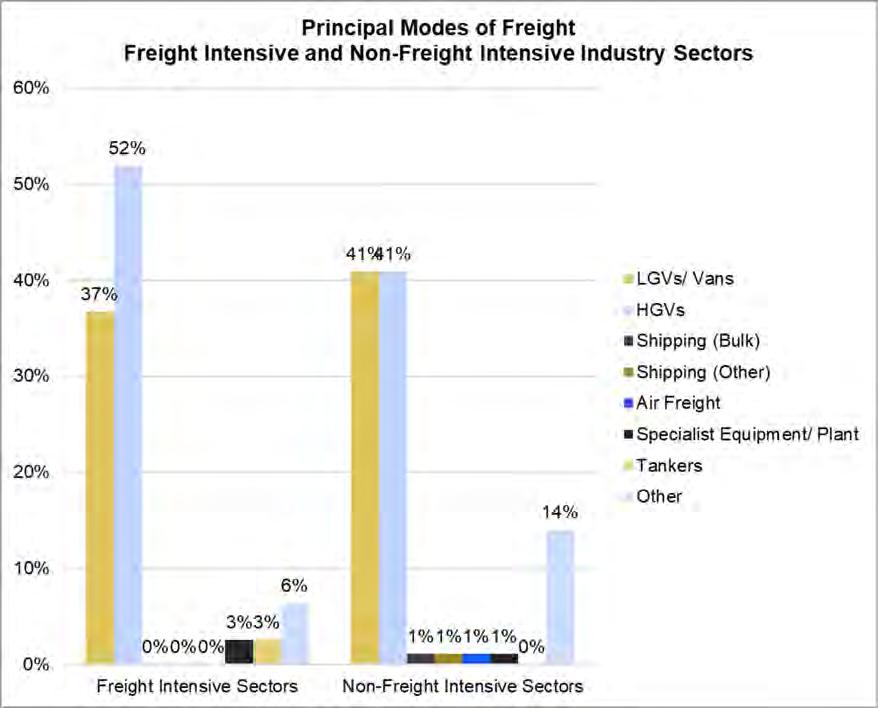
The ‘other’ responses were investigated for this question, considering the number returned. For the freight-intensive sectors, ‘other’ was found to mean alternative methods such as container shipments and shipping services such as uPS. For the non-freight intensive sectors, however, these responses were found to be from organisations, such as schools or those in the finance sector, who have no freight-related activities.
5.3.2.5 Importance of the A75/ A77 routes to Businesses

Participants were then asked questions specifically relating to the A75/A77 routes. Figure 5-7 shows the responses to the question ‘How significant are the A75/ A77 corridors to your business in the following respects?’ and participants were provided with a list of select business activities.

71 ECONOMIC ACTIVITY & LOCATION IMPACTS (EALI) STUDY 5 Bu SI n ESS En GAGEME n T
FIGURE 5-6: PRINCIPAL MODES OF FREIGHT
Across the respective industry sectors the A77/ A75 are found to be most important for the following activities: deliveries to site (by both LGVs and HGVs); collections from site; and customers accessing the site. The routes are considered less significant to business travel.


5.3.2.6 Existing road network Issues
The impact of existing road network issues on business operations was also questioned. Participants were presented with a range of problems regularly reported/ evidenced on the A75/ A77 trunk roads and were asked to describe the significance of these to their business. The results are displayed in Figure 5-8 for the freight-intensive and non-freight intensive sectors.
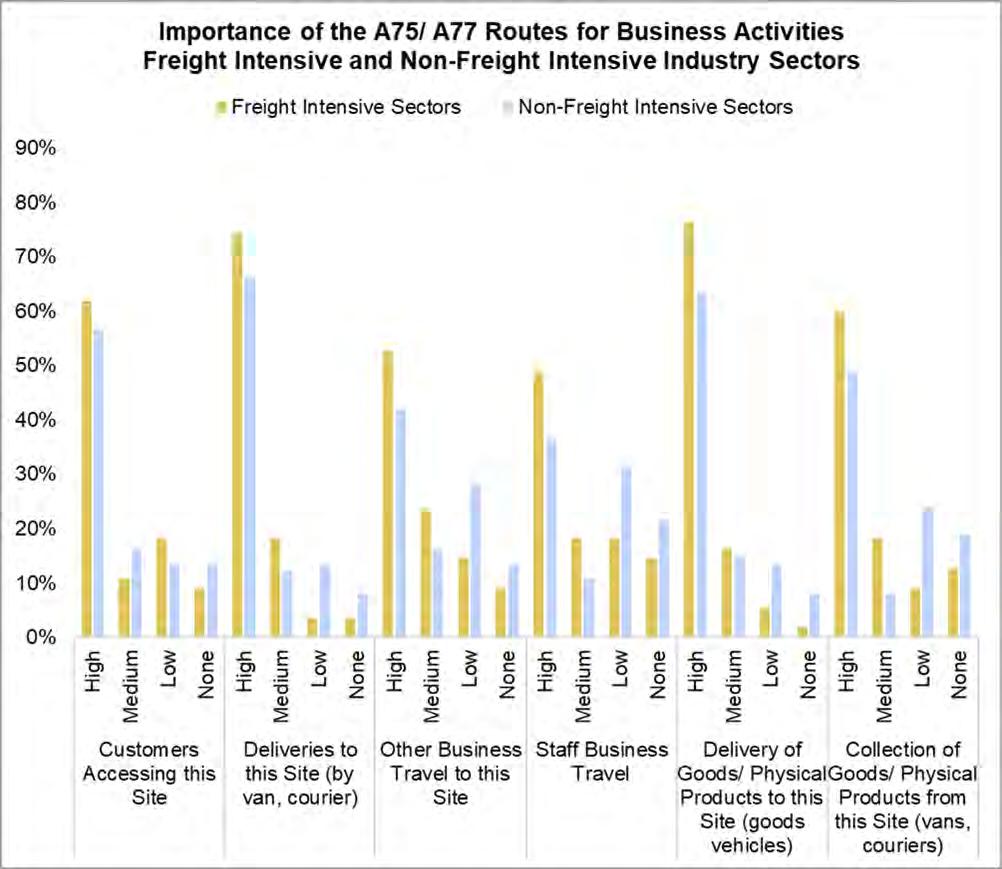
72 ECONOMIC ACTIVITY & LOCATION IMPACTS (EALI) STUDY 5 Bu SI n ESS En GAGEME n T
FIGURE 5-7: IMPORTANCE OF THE A75/A77 ROUTES TO BUSINESSES
of the issues presented, the most impactful on business operations across the freight-intensive sectors were found to be: ‘congestion on the A75’ (47% high/ medium significance responses), ‘congestion on the A77’ (44% high/ medium significance responses), ‘poor journey time reliability’ (42% high/ medium significance responses). These results compound wider reports of freight inefficiencies experienced by businesses using the A75 and A77.
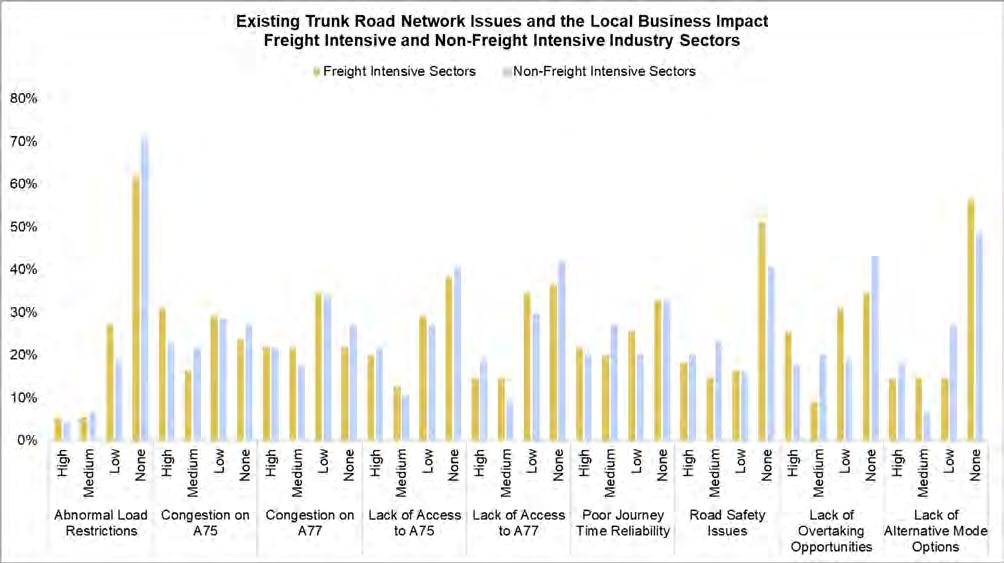

For non-freight intensive sectors, the most pertinent issues were found to be: ‘poor journey time reliability’ (47% high/ medium significance responses), ‘congestion on the A75’ (45% high/ medium significance responses), road safety issues (43% high/ medium significance responses), and ‘congestion on the A77’ (39% high/ medium significance responses).
‘Abnormal load restrictions’ and a ‘lack of alternative mode options’ were not considered a significant issue amongst the survey sample.

5.3.2.7 road network Improvements
Business perceptions on the proposed improvements to the A75/ A77 routes, specifically upgrading the routes to dual carriageway status, were captured in relation to a number of key success criteria. Figure 5-9 shows the results for the freight-intensive and nonfreight intensive sectors.
73 ECONOMIC ACTIVITY & LOCATION IMPACTS (EALI) STUDY 5 Bu SI n ESS En GAGEME n T
FIGURE 5-8: EXISTING ROAD NETWORK ISSUES & BUSINESS IMPACTS
Figure 5-9 shows the freight intensive sectors anticipate dualling of the A75 and A77 trunk roads will benefit them most in terms of: ‘future regional investment plans’ (80% overall positive impact), ‘ease delivery of supplies’ (78% overall positive impact), and ‘delivery of products to market’ (76% overall positive impact). High positive results were also found across the ‘access to labour market’, ‘staff business travel’ and ‘customer/ visitor numbers’ indicators.
The non-freight intensive sectors were found more likely to anticipate no impact from this type of road-based intervention. Businesses within these sectors did, however, rate positive impacts on similar success criteria: ‘future regional investment plans’ (66% overall positive impact), ‘customer/ visitor numbers’ (57% overall positive impact), ‘ease delivery of supplies’ (54% overall positive impact) and delivery of products to market’ (50% overall positive impact).
The majority of businesses considered the upgrade would have no impact on stock and inventory levels, their ability to compete and their continuing presence at their location.

5.3.2.8 rail network Improvements

Business perceptions on the proposed rail-based improvements along the A75/ A77 route corridors were captured in relation to the same key success criteria. Survey respondents were asked on the business impact of rail connectivity parallel to the A75/ A77 trunk roads and the results are presented in Figure 5-10.
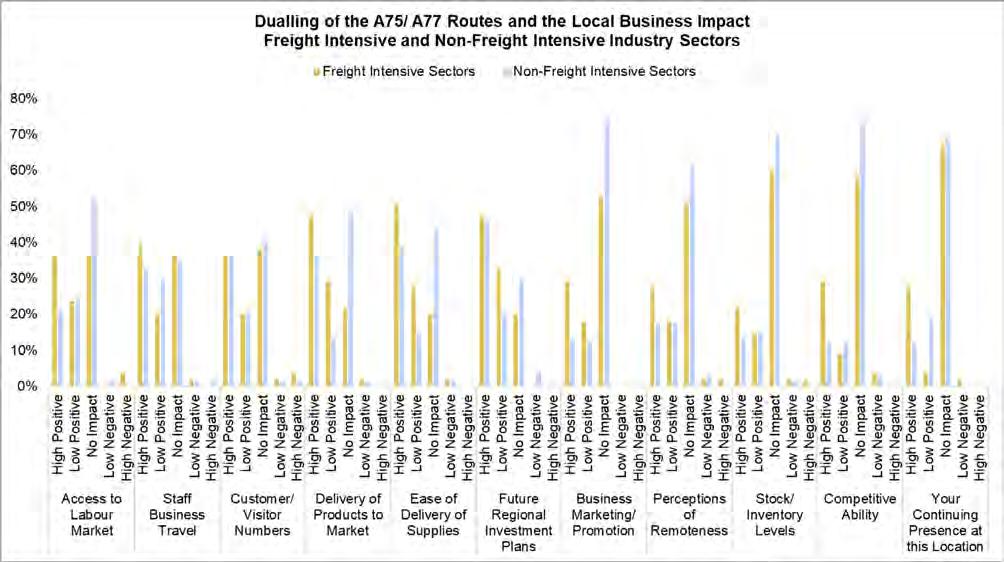
74 ECONOMIC ACTIVITY & LOCATION IMPACTS (EALI) STUDY 5 Bu SI n ESS En GAGEME n T
FIGURE 5-9: ROAD NETWORK IMPROVEMENTS & RESULTING IMPACT ON BUSINESSES
Figure 5-10 shows that, across most success factors, the majority of businesses anticipate no impact from rail-based interventions. This response isn’t entirely unexpected as respondents comprise established businesses with existing, and likely vehicle-based, transportation plans/ strategies. Additionally, it is thought that without more detailed description or visualisations of this type of intervention, it may be difficult for respondents to fully understand the potential impact of rail-use on their business operations.
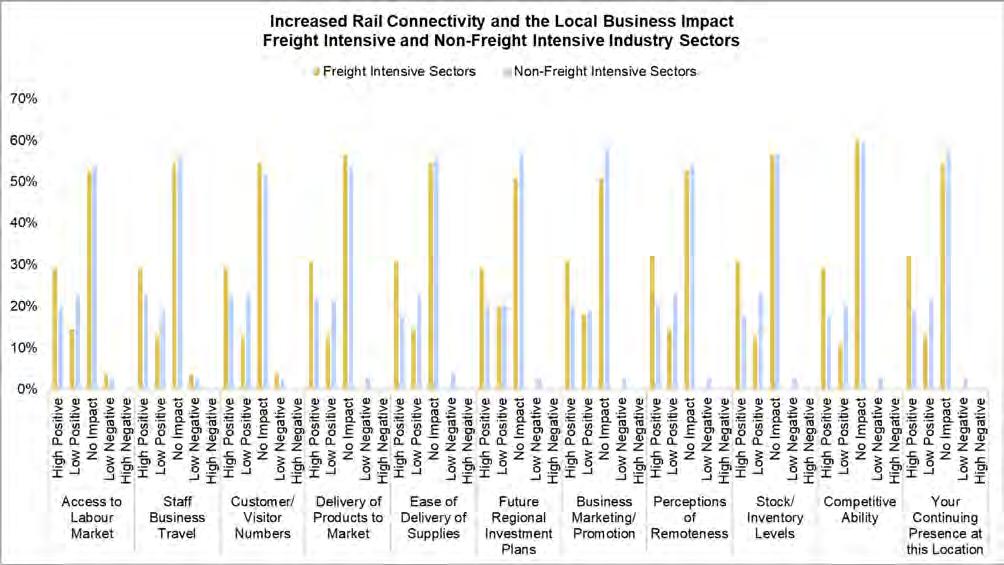
Within this, however, the freight intensive sectors are found to show a more positive reaction to rail interventions regarding ‘your continuing presence at this location’ and ‘perceptions of remoteness’ (both at 33% high positive impact). This response relays an appreciation for rail in terms of increased accessibility, and likely for the shorter journey times compared to road-based travel. Benefits are also anticipated for the ‘delivery of products to market’, ‘ease of delivery of supplies’, and ‘stock/ inventory levels’, showing positive indications for the use of rail-freight.
5.3.2.9 Closing Comments
Table 5-1 presents a summary of optional closing remarks left by some businesses. The closing remarks show there a consensus that improvements to the A75 and A77 are needed, and that any improvements delivered would bring significant benefits to businesses.
Closing Comments
A very welcomed addition to the South of Scotland, they have lots of volunteers who help out at the site, so improvements will be welcomed albeit stressful with diversions are in place

Bypasses need to be dual carriageway, widening of roads needed and overtaking opportunities essential
All improvements are eagerly welcomed
Any improvement is appreciated and beneficial
Consideration needs to be made about property access if dualling is to proceed
There is a lack of overtaking opportunities dual carriageway needed urgently

75 ECONOMIC ACTIVITY & LOCATION IMPACTS (EALI) STUDY 5 Bu SI n ESS En GAGEME n T
FIGURE 5-10: RAIL NETWORK IMPROVEMENTS & RESULTING IMPACT ON BUSINESSES
TABLE 5-1: BUSINESS SURVEY - CLOSING COMMENTS
Closing Comments
dual carriageway would definitely improve the roads in many ways
For business it will be a good thing, allow businesses to be more accessible and busier. May not be as beneficial for locals as it could lead to the area being busier and it losing its charm
Hoping the business survives and improvements are made
Huge environmental impact on building this dual carriageway
Investment in buses in more local areas

More information the better when roadworks start etc and traffic they will cause road quality currently is bad, potholes exist along significant sections of both routes road conditions are really bad, any upgrades on the roads would be positive and have a great impact on businesses and everyone locally
Something that needs to be done, there will be more potential for all the surrounding areas and businesses

Very much overdue and eager for any improvements
The A77 is not fit for purpose as a trunk road/major route to Europe and hasn't been for quite some time
A714 diversion due to an accident closing the A77 adds almost double the journey time. Another handful of times I've had to take a diversion for that diversion (north of new Luce) due to both roads being closed, which consists of a one lane track with cattle grids
We are left behind as a region and the transport infrastructure is a huge barrier to progress
5.4 Summary
Engagement with businesses found that the main issue associated with the A75 and A77, and indeed transport connections generally in South West Scotland, is that congestion and journey time reliability negative impacts business operations in the area. This is particularly for businesses whose customers/goods come from elsewhere. It was widely acknowledged that dualling of the A75 and A77 would have a significant positive impact, especially on future investment plans, ease of delivery of supplies, and delivery of final products to market. It is also believed that these improvements could transform the way in which South Ayrshire and dumfries & Galloway in particular is viewed by external customers and suppliers.
76 ECONOMIC ACTIVITY & LOCATION IMPACTS (EALI) STUDY 5 Bu SI n ESS En GAGEME n T
6 Transmission Mechanisms
6.1 Overview
The rationale for the proposed improvements to the A75/ A77 routes is focused on supporting and developing the regional economy in South West Scotland, and on improving transport onnectivity between the nations of the united Kingdom.
This chapter demonstrates how the improved A75/ A77 routes will contribute to these economic development and transport connectivity outcomes. It continues on to provide a breakdown of the key aspects of the strategic and economic assessments, which were undertaken to estimate the benefits and impacts of a transport intervention using information on travel demand, traffic flows, journey times and further data extracted from the traffic model (TMfS) and other reliable data sources. The benefits and impacts of each package have been categorised as established monetised impacts, evolving monetised impacts, indicative monetised impacts, and additional monetised impacts.
The assessment results presented in this chapter are based on the ‘do-maximum’ package of improvements as follows:
• Full dualling of the A75 and A77 routes

• Bypasses of settlements including Kirkoswald, Girvan, Ballantree, Spirngholm and Crocketford
• Junction improvements on the A75 and A77 routes
• Electrification of the rail line between Stranraer and Ayr
• Installation of rail freight hubs at Stranraer and Barrhill.
6.2 Recapping the Problem
In making a case for investment it is vital to explore the context of the problems and seek a ‘solution’ that directly addresses and resolves such problems. Chapters 3 and 5 have drawn upon economic data and the experiences of existing businesses in the study area, summarising the main economic problems as being:
• Low productivity and income levels and a higher rate of unemployment, culminating in a less robust and less productive economy than the Scottish average
• Having a ‘two-speed economy’, with a more affluent and in many cases well-qualified population concentrated along the populous areas of the Ayrshire coastline and in the urban areas of dumfries & Galloway

• A strong perception of remoteness, which evidence suggests is limiting business investment, access, and tourism in certain areas.
These problems result in lower-than-average rates of economic activity and possible under-employment, hinting at a relatively restricted regional economy. This is further impacted by the limited integration between the region’s rural and urban economies, and between the economies of neighbouring areas, potentially given the problems associated with more strategic longer distance travel in and out of the region.
The following sections consider how improved transport connectivity could ‘transmit’ through to improved performance in the South West Scotland economy. In terms of the Economic Activity and Location Impacts, this is how the desired economic development outcomes could be attributed to the proposed package of transport improvements.
6.3 Transport Economic Efficiency
6.3.1 Overview
Transport Economic Efficiency (TEE) analysis captures the contribution of a transport option or proposal towards elements including travel time savings and vehicle operating cost savings. Vehicle operating costs (VoC) are defined as those which incur through vehicle usage and include fuel, maintenance and wear and tear.
The impact of the proposed package of transport improvements on both travel times and vehicle operating costs was assessed using the latest department for Transport’s TuBA program available at the time of assessment (version 1.9.17). TuBA is a bespoke software package developed on behalf of the dfT to estimate the impacts of transport schemes in terms of the costs and benefits experienced by users and providers of the transport system, and the associated indirect taxation impacts. All impacts are considered in monetary terms.
77 ECONOMIC ACTIVITY AND LOCATION IMPACTS REPORT | 6 Tr A n SMISSI on M ECHA n ISMS
TuBA compares transport conditions in a ‘with package’ scenario against conditions in a ‘without package’ scenario. To this end, for transport schemes, TuBA uses information from the TMfS model to:
• Calculate user benefits by vehicle type and for each element of journey cost (such as travel time and vehicle operating costs)
• Calculate the changes in the indirect tax income received by the government (for highway schemes this primarily reflects the levels of indirect taxation incurred on fuel cost)
The results of the TEE analysis are outlined in the following sections for highway, bus and rail users.
6.3.2 Transport Economic Efficiency Results
6.3.2.1 Highways
The introduction of the proposed package of transport improvements is predicted to reduce journey times along the A75 and A77 and on the wider network. A variety of changes in journey speed and distance are also likely to occur, due to the following reasons:
• Traffic transferring onto the higher capacity A75 and A77 will experience less delay, travel at faster speeds, and therefore have quicker journeys. However, some of the traffic rerouting onto the A75 and A77 will travel slightly longer distances (even if they are quicker)


• other local trips are likely to experience improved travel times because of the reduced levels of traffic on the wider local network.
Full dualling of the A75 and the A77 routes, along with bypasses at key towns and targeted junction improvements, is anticipated to generate over £700 million worth of journey time and vehicle operating cost benefits. These benefits have been analysed further based on trip purpose, as detailed in Table 6-1.
Table 6-1 indicates that approximately 60% of the benefits are experienced by business trip purposes, 25% due to other trips and 15% due to commuting trips. This is expected because strategic roads, like the A75 and A77, are likely to have a higher proportion of business trips. The A75 in particular provides direct access between Stranraer and dumfries, two key economic hubs and destinations in the South West of Scotland. Business trips also have a higher value of time therefore leading to large benefits, and in general, travel longer distances.
Commuting and other purpose trips experience VoC disbenefits. These disbenefits are expected as vehicles (making long distance trips) are travelling longer distances, albeit at faster speeds. The increased trip distances drive the vehicle operating cost disbenefits.
In terms of the geographic distribution of benefits, the highest benefit is found in areas (or ‘sectors’) which are directly served by the A75/A77 routes. A total of 55 sectors are considered in TMfS, covering the whole of Great Britain. The A75 is located in the sectors labelled dumfries, dalbeattie and Castle douglas, newton Stewart, and Stranraer. The A77 is located in the sectors labelled Stranraer, Girvan, and Ayr. Figure 6-1 and Figure 6-2 map the origin and destination benefit results for each sector.
78 ECONOMIC ACTIVITY AND LOCATIONS IMPACTS REPORT | 6 Tr A n SMISSI on M ECHA n ISMS
Trip Purpose Journey Time Benefits Vehicle Operating Costs Total User Benefits Business £387.13 £20.43 £407.56 Commuting £122.55 -£14.89 £107.66 other £237.63 -£33.23 £204.40 Total £747.31 -£27.69 £719.61
TABLE 6-1: USER BENFITS BY TRIP PURPOSE, £ MILLIONS (DISCOUNTED 2010 PRICES)


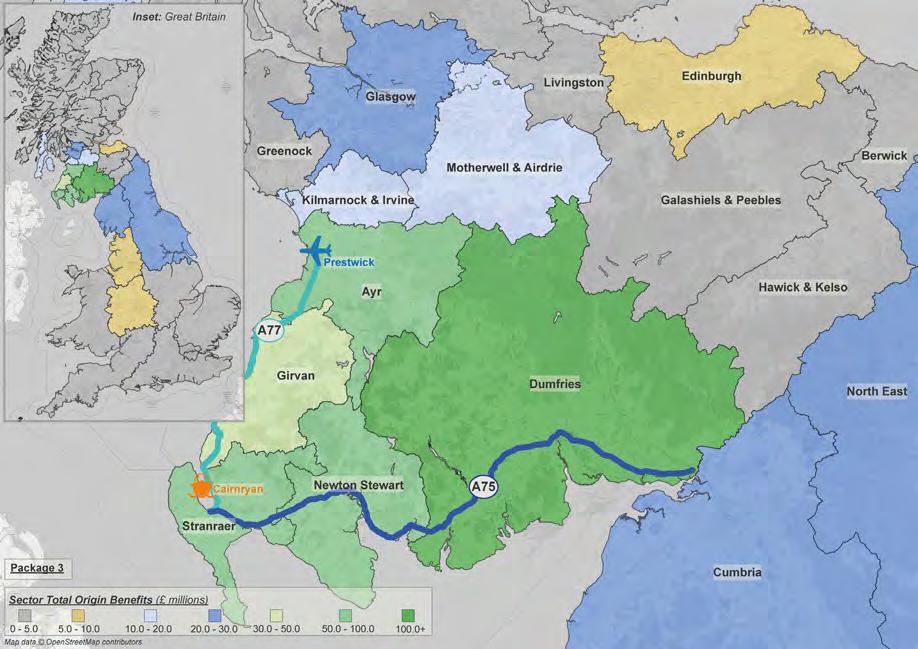
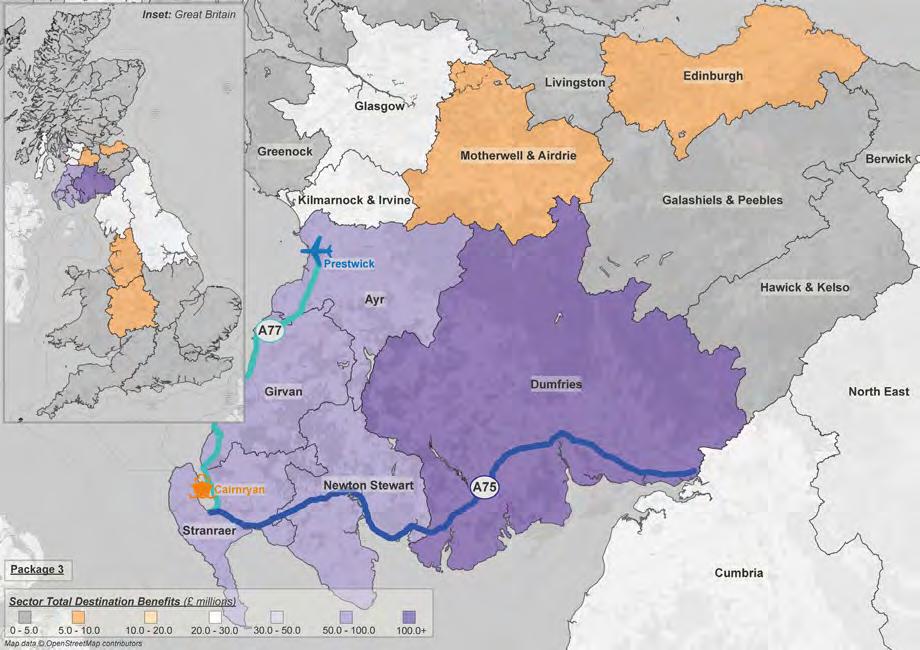
79 ECONOMIC ACTIVITY AND LOCATION IMPACTS REPORT | 6 Tr A n SMISSI on M ECHA n ISMS
FIGURE 6-2: HIGHWAY USER BENEFIT SECTOR DESTINATION RESULTS, £ MILLIONS (DISCOUNTED 2010 PRICES)
FIGURE 6-1: HIGHWAY USER BENEFIT SECTOR ORIGIN RESULTS, £ MILLIONS (DISCOUNTED 2010 PRICES)
Figure 6-1 and Figure 6-2 show dumfries to accrue the largest share of both origin and destination benefits, more than £100 million in each case. other sectors through which the A75 passes, namely newton Stewart and Stranraer are also expected to experience significant benefits because of the proposed bypasses and junction improvement measures delivered along the route.
South Ayrshire, comprised of the Girvan and Ayr sectors across Figure 6-1 and Figure 6-2, is similarly expected to accrue origin benefits in the range of £30 – 100 million and destination benefits between £50 – 100 million as a result of interventions along the A77.

Benefits are also seen across the Scottish Central Belt, in north Ayrshire, Glasgow, Motherwell & Airdrie and Edinburgh, which are connected by the A77, while the A75’s link to the M6 sees benefits reach northern and Western England as far as the West Midlands. This makes clear the large reaching impact of the proposed improvement package.
6.3.2.2 Bus
Bus passengers are anticipated to benefit from the proposed improvement package, yet to a lesser extent than the highways benefits. This is expected as the demand for bus travel in the study area is significantly lower and the packages do not directly include dedicated bus improvements.
The results of the TEE analysis show that buses experience modest improvements to journey times, equating to approximately £9 million worth of benefits, due to the improvements in road capacity on the A75 and A77 which will cause a reduction in congestion and delays. Most notably for bus trips will be the impact of reduced congestion on the wider and local road network, which is used more frequently by bus services. The ability of the proposed improvement package to attract traffic onto the A75 and A77 will improve the reliability of bus services using the wider and local road network.
Currently, only bus user time benefits have been considered in this assessment. There are, however, other elements that would accrue relating to buses. operator revenue and user fare changes would occur because of the interventions as mode shift may occur due to increased attractiveness of the bus network, but these impacts are likely to be minimal.
6.3.2.3 rail
rail passengers are also forecast to experience positive time benefits and, in the same vein as the bus user time benefits, these are not seen to the same scale as the highway benefits. This is expected because the rail improvements considered within the strategic and economic impact assessment are largely focused on rail freight, as opposed to passenger rail. This is with the aim of removing HGVs from the highway network and increasing freight efficiencies.
rail users are anticipated to experience improvements to journey times, equating to approximately £22 million worth of benefits, due to the improvements in rail provision and capacity by upgrading the existing line and the creation of a new station. This would improve the frequency and availability of services, improving reliability which leads to a reduction in travel times for rail users.
Currently, only rail passenger user time benefits have been considered but there are other economic impacts that would accrue for rail passengers. operator revenue and user fare changes would occur as a result of the proposed interventions as mode shift may occur due to increased attractiveness of the rail network.
6.4 Wider Economic Impacts Results – Static

Wider economic impacts (WEI) refer to the additional benefits or disbenefits that can arise as the impact of transport improvements is transmitted into the wider economy, beyond those businesses and passengers that are directly affected by the transport change. The key metric is “economic welfare”, not GVA or GdP; this is the basis for including non-traded benefits such as time savings in leisure travel.
The WEIs have been assessed according to ‘static agglomeration’, ‘labour supply impact’ and the ‘output change in imperfectly competitive markets’. Static agglomeration directly refers to connectivity benefits as it defines the perceived closeness of markets and businesses. The complete results are presented according to Local Authority area in Figure 6-3.
80 ECONOMIC ACTIVITY AND LOCATIONS IMPACTS REPORT | 6 Tr A n SMISSI on M ECHA n ISMS
Figure 6-3 shows the WEI impacts are positive and suggests the proposed improvement package will have a positive outcome on non-transport markets, contributing to an increase in productivity and government income. The highest contribution comes from agglomeration impacts. This suggests that business users are the main beneficiaries from the enhanced connectivity and congestion reductions brought about by the improved transport connectivity.

The lowest wider economic impact is related to taxes arising from the labour supply increase. Calculations for this element are based on the link between the cost of going to work (commuting benefits) and the increase in labour supply. This suggests that commuters currently in work have relatively low benefits. It does not reflect the movement or increase in people joining the labour force as a result of the packages of improvements but is the increase in taxes arising due to the increase in the labour force.
The total WEI monetary benefit is over £220 million and can be described as a large positive impact for the regional economy. For the full set of static agglomeration and labour supply impacts, please refer to the accompanying document ‘A75 A77 Strategic and Economic Assessment’ and associated appendices.
6.5 Wider Economic Impacts Results – Transformational Impacts


The potential for a transport option or proposal to have transformational effects on the number and location of homes and jobs, thereby generating further WEIs, is reflected, with assessments of ‘dynamic agglomeration’ (i.e., in the context of induced land-use change), and the effect of people moving to more productive jobs (MTMPJ) in response to the combination of transport improvements and land-use change.
The dynamic agglomeration results are presented in Figure 6-4 and show an overall positive impact, suggesting increases in employment growth, and therefore economic activity, can be expected.
81 ECONOMIC ACTIVITY AND LOCATION IMPACTS REPORT | 6 Tr A n SMISSI on M ECHA n ISMS
FIGURE 6-3: STATIC AGGLOMERATION, LABOUR SUPPLY IMPACT & OUTPUT CHANGE IN IMPERFECTLY COMPETITIVE MARKET RESULTS, £ MILLIONS (DISCOUNTED 2010 PRICES
The proposed improvement package produces a large positive impact/benefit, totalling over £9 million. This assessment also relays the importance of improved connectivity and congestion reductions to the A75 and A77, but specifically the A75, as it will result in greater impacts than just journey time savings. It will drive employment growth in the South West of Scotland, thus helping to boost economic activity.

For the full set of static agglomeration and labour supply impacts, please refer to the accompanying document ‘A75 A77 Strategic and Economic Assessment’ and associated appendices.
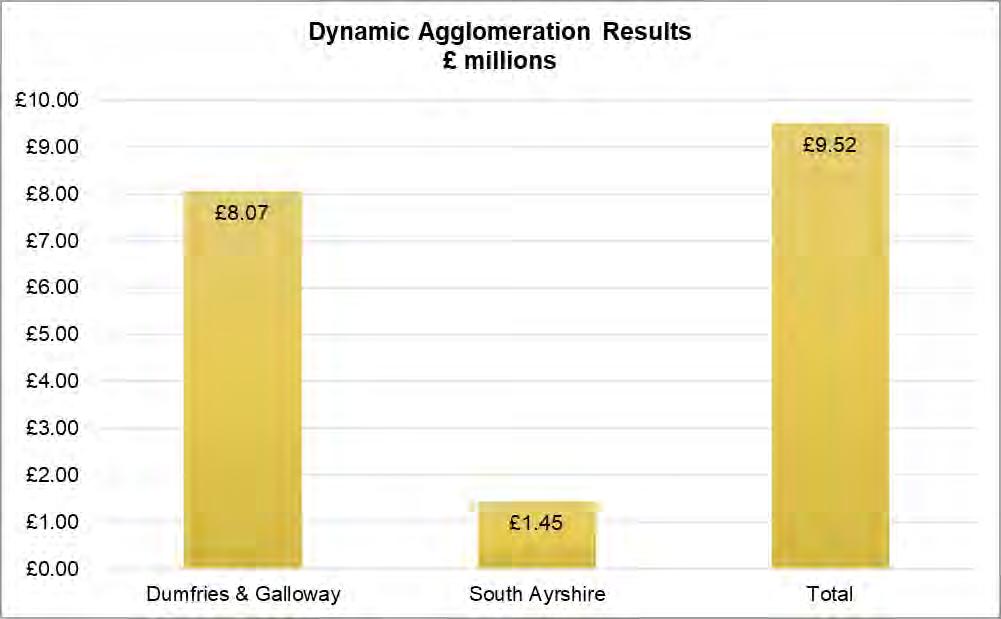
6.6 Wider Spatial and Social Context Results - Additional Welfare Benefits

The wider spatial and social context of the proposed public expenditure has also been assessed by the accessibility-based land-use and transport appraisal software uLTrA (unified Land-use / Transport Appraisal). The approach is to measure benefits and disbenefits to households and other actors, using measures of benefit from improved accessibility as the means of capturing both the direct benefits of transport improvement and land-use effects.
note, that the choice of approach means that direct effects of transport change appear in the accessibility variable. These represent the value that actors in the land-use markets – households and firms – place on accessibility to destination, as opposed to the value that users in the transport system place on time savings.
Table 6-2 presents the results from uLTrA which considers the proposed highway and rail-based improvements combined.
82 ECONOMIC ACTIVITY AND LOCATIONS IMPACTS REPORT | 6 Tr A n SMISSI on M ECHA n ISMS
FIGURE 6-4: DYNAMIC AGGLOMERATION RESULTS, £ MILLIONS (DISCOUNTED 2010 PRICES)
TABLE 6-2: WIDER SPATIAL AND SOCIAL CONTEXT RESULTS (ULTRA), £ MILLIONS, DISCOUNTED 2010 PRICES


83 ECONOMIC ACTIVITY AND LOCATION IMPACTS REPORT | 6 Tr A n SMISSI on M ECHA n ISMS
Benefits / Costs Scotland Dumfries & Galloway Cairnryan Households Accessibility £2,917.50 £2,163.94 £625.65 Car ownership costs -£5.96 -£4.64 -£1.33 Income £167.02 £306.86 £99.42 Leisure time -£21.87 -£66.94 -£21.21 Housing quality £43.74 £89.47 £25.19 Housing consumption £5.30 -£92.12 -£24.52 Commuting cost -£25.85 -£45.73 -£9.94 Total £3,079.88 £2,350.84 £693.26 Firms Accessibility £315.48 £210.10 £62.30 Costs -£75.56 -£125.93 -£45.73 Production £0.00 £182.92 £63.63 Corporation tax savings -£3.31 -£14.58 -£0.66 Total £236.61 £252.51 £79.53 developers -£95.44 -£47.72 -£21.87 rental income £108.69 £499.06 £150.45 Property owners' tax savings -£3.98 -£22.53 -£4.64 Total £9.28 £428.81 £123.94 Public sector Income tax revenue £94.11 VAT revenues £19.22 unemployment benefit savings £53.02 Council tax revenues £1.99 business rates revenues £8.62 Tax on profit £3.31 Property owners' tax revenues £3.98 Total £184.25 £0.00 £0.00 rebalancing benefits Shadow value of jobs for workers in deprived zones £26.51 £52.36 £23.20 Social infrastructure savings £5.30 -£10.60 -£1.99 Total £31.81 £41.75 £21.21 Total £3,541.83 £3,073.92 £917.93
6.6.1 Benefits to Households
6.6.1.1
Accessibility

The benefits to households represent the most significant part of the overall benefits at all spatial levels. The benefits to households are dominated by the benefits in accessibility as one would expect due to the nature of the interventions being tested. These gains arise primarily from the transport improvements themselves (incorporating the time savings achieved), allowing easier access to employment and to services, but are supplemented by the increase in local opportunities for work and services resulting from the employment gains in the corridor authorities.
The package of interventions generate significant accessibility benefits to households and firms at a national level and most of these benefits occur in dumfries & Galloway (30% of the benefits are in Cairnryan and Stranraer) while very little benefits accrue in South Ayrshire. This highlights that in South Ayrshire there is a conflict between the A75 and A77 dualling improvements.

6.6.1.2
Income and Housing
Housing quality benefits generally arise where new housing is being built or where incomes are increasing (allowing better maintenance and more improvement). These benefits therefore tend to be positively correlated with incomes and negatively correlated with housing consumption benefits.
The largest impacts in income and housing quality are in dumfries & Galloway. At a national level there are very small disbenefits in terms of housing consumption which are to be connected to the increased rents. These disbenefits are much larger in dumfries & Galloway where the increase in residential rents is more significant; this means that there are benefits from other local authorities that are mitigating the disbenefits in dumfries & Galloway at a national level. There is a small benefit in housing consumption at the national level from the package of interventions.
6.6.1.3 Car ownership
Changes in car ownership contribute to accessibility benefits (or disbenefits). The car-ownership costs line shows that there are costs from increased car ownership; the workings of the car ownership model are such that these tend to be directly related to increases or decreases in income.
The results for benefits in car ownership costs, and leisure time are all negative as would be expected from the increased employment and higher incomes. The disbenefit in car ownership costs implies that more cars are being owned at national level. Most of these negative impacts are in dumfries & Galloway while South Ayrshire gets very small benefits.
Leisure time and commuting costs are generally positive (more leisure time, less commuting cost) where employment is lost, and negative where it is gained. As such these are negatively correlated with the benefits in changed incomes. As result of increases in income due to more household members in work, there is a loss in leisure time and an increase in commuting costs.
6.6.1.4 Housing Consumption
Housing consumption shows benefits accruing to households from occupying more housing floorspace or paying less for it. In a spatial system where the supply of housing is relatively inelastic, these benefits also tend to be negatively correlated with the changes in employment and in income, in that where the demand for housing increases (typically through a mixture of incomes increasing and additional households arriving in response to improvement employment opportunities), the housing supply usually does not (or cannot) respond proportionately. rents then increase, giving a disbenefit in the housing consumption measure. Where demand decreases, supply (new building) may be reduced, but typically not in proportion; rents then fall, and benefits accrue to residents. This pattern is observed when considering housing consumption.
6.6.2 Benefits to Firms
The benefits to firms show significant positives in terms of accessibility at all spatial levels. The accessibility benefits represent the expected savings in costs from the changes in the transport system (business travel and goods vehicle movement) and from land uses impacts affecting the distribution of destinations that need to be reached.
It is worth to note that the direct accessibility benefits to households are much greater than those to firms. This reflects the greater importance of local public transport, in personal travel rather than for business travels.
Costs are essentially rent-related costs, which tend to be negative (malefits) where the demand for floorspace is increasing and positive (benefits) where it is decreasing. The disbenefits due to the increase in rents are much greater relative to the accessibility benefits for firms than for households; this reflects the forecast that additional housing will be built in the local authority on a scale comparable with the increase in households, while that does not happen for employment space and jobs.
84 ECONOMIC ACTIVITY AND LOCATIONS IMPACTS REPORT | 6 Tr A n SMISSI on M ECHA n ISMS
Production represents the gains to firms’ profits (after paying wages and salaries) from gains in productivity due to agglomeration effects or moving to more or less productive locations. The greatest gains occur in dumfries & Galloway (with some large benefits in Cairnryan and Stranraer), and there are very little or negative figures for South Ayrshire. The benefits in dumfries & Galloway are outweighed by disbenefits in South Ayrshire and other local authorities.


Corporation tax savings are positive if the profits made by firms decrease (less tax paid), and negative if profits increase (more tax paid).
6.6.3 Benefits to Developers
development costs are savings to the sector from developing less or cheaper floorspace – so any intervention which, say, induces a net increase in housebuilding will tend to show a negative total on this line. rental income means what it says, counting both real and imputed rents. Both combine results for all modelled floorspace types.
As one would expect for a transport improvement, the largest categories of benefits are the accessibility gains to households and firms, though a large proportion of these are “captured” by property owners in the form of rents received (rental income). As a result, there are disbenefits to households in housing consumption (more rent paid for less floorspace) and to firms in costs (of space). Those are usually referred to as indirect benefits (e.g., rent income to property owners and developers).
The rent income results are positive in the corridor, and negative elsewhere. The overall result at national level is positive (i.e., a gain of income to owners) and even larger benefits are produced at local authority level for dumfries & Galloway (which suggests that there are negative impacts in other local authorities).
6.6.4 Benefits to Others
Benefits in “regeneration” or “rebalancing” are often excluded from formal cost benefit analysis. In the regeneration effects in dumfries & Galloway, the shadow value of locating jobs to benefit workers in deprived areas is positive, showing that on balance the redistribution of jobs is towards the more deprived areas; however, the social infrastructure savings is negative, indicating that on balance, households are being attracted from cheaper to more expensive locations, adding to the costs of providing schools and hospitals. Very small rebalancing and regeneration effects are occurring in South Ayrshire.
6.6.5 Benefits to the Public Sector
As corporation, income and property tax receipts increase from the enhancements to accessibility and increases in employment, there is a net gain to the public purse. Likewise, a marginal gain is seen for rebalancing benefits – reflecting successes in bringing working age people out of unemployment.
The increase in employment, forecast to be captured by the public sector contribution, comes from the reduction in government expenditure due to less unemployment benefits paid. All of the improvements result in new jobs created at national level which means that more opportunities will be created for people to enter in the job market and hence the government will have to pay less unemployment benefits.
A significant part of the overall benefit is forecast to be captured by the public sector in additional tax revenues (note that this is simply by existing taxes, without additional value capture measures; note also that this is before considering how profits might be reused or distributed, which would modify the tax results).
6.6.6 Summary
Households benefit the most of all the actors included. of the household impacts, by far the most significant is accessibility, incorporating the time savings achieved. Across the board, household income is expected to increase, and household leisure time is expected to decrease – a clear indicator of the employment benefits. Positive income benefits also accrue in housing quality, as homeowners invest in their physical environment. Increased costs of car ownership and commuting reflect a higher level of work and therefore a higher need for each.
Firms, too, gain significantly from accessibility. offsetting accessibility gains, however, are increased costs – most likely in rent, as demand for floorspace increases with enhanced accessibility. Higher expected revenue results in a slight increase in corporation tax. For developers, rental incomes are expected to be positively impacted, reflecting the increased demand for floorspace, and quality of housing. This is however offset by increased development costs.
As corporation, income and property tax receipts increase from the enhancements to accessibility and increases in employment, there is a net gain to the public purse. Likewise, a marginal gain is seen across the board for rebalancing benefits – reflecting successes in bringing working age people out of unemployment.
85 ECONOMIC ACTIVITY AND LOCATION IMPACTS REPORT | 6 Tr A n SMISSI on M ECHA n ISMS
In all, reflecting synergy between the A75 and A77, the package of interventions is estimated to produce £3.5 billion worth of benefits. For the complete additional welfare benefit assessment, please refer to the accompanying document ‘A75 A77 Strategic and Economic Assessment’ and associated appendices.
6.7 Rail Freight Benefits

opportunities for a mode shift from road to rail within the freight transportation sector, specifically for the transport of timber from the Arecleoch and Glentrool Forests, have been explored by this study. Achieving this requires the development of a timber loading terminal in the Barrhill area (located on the Ayr to Stranraer line) and the operation of a new rail freight service. The option to transport freight by rail to and from the ports at Cairnryan has also been explored. Achieving this requires the development of a suitable transhipment facility at Stranraer, and operation of a new rail freight service. The objective of this would be to deliver mode shift from road to rail for the transfer of freight for onward shipment to northern Ireland.
The principal benefits relate to carbon (Co2e) savings. An assessment to calculate the carbon savings resulting from the mode shifts from road to rail was undertaken for the proposals at Barrhill, Ayr, and Stranraer, as presented in Table 6 3, Table 6 4 and Table 6 5. For this assessment, the monetary value of the Co2e savings has been calculated using data from the TAG databook.

86 ECONOMIC ACTIVITY AND LOCATIONS IMPACTS REPORT | 6 Tr A n SMISSI on M ECHA n ISMS
Emissions Calculations - Barrhill - Carlisle Kingmoor Yard Road Rail (via Mauchline Branch) Rail (via Mauchline Kilmarnock) Tare weight t 19 909 909 Payload t 25 1,275 1,275 Total weight t 44 2,184 2,184 distance km 162 201 223 Laden Co2e kg/t.km 0.06 0.03 0.03 unladen Co2e kg/t.km 0.04 0.02 0.02 Co2e per train equivalent kg/t.km 27,553 15,343 16,969 round trips per day 51 1 1 days operation per year 260 260 260 Total Co2e kg/year 7,164,009 3,989,406 4,412,124 Total Co2e t/year 7,164 3,989 4,412 Value of Co2e £ £20.72 £11.54 £12.76 Value of CO2e vs. Road £ £0 £9.18 £7.96
TABLE 6-3: BARRHILL - CARLISLE KINGMOOR YARD RAIL FREIGHT FACILITIES RESULTS (CARBON SAVINGS), £ MILLIONS, DISCOUNTED 2010 PRICES
TABLE 6-4: STRANRAER – HAMS HALL RAIL FREIGHT TERMINAL RESULTS (CARBON SAVINGS), £ MILLIONS, DISCOUNTED 2010 PRICES
Stranraer – Hams Hall Rail Freight
TABLE 6-5: AYR – TRAFFORD PARK RAIL FREIGHT TERMINAL RESULTS (CARBON SAVINGS), £ MILLIONS (DISCOUNTED 2010 PRICES)

As can be seen in Table 6-3, Table 6-4 and Table 6-5, when operating purely diesel traction the reduction in Co2e is substantial. The development of a timber loading terminal in the Barrhill area could save over 3-million-kilogram Co2e equating to a monetary saving in excess of £7.9 million. The rail freight terminal in Stranraer could save over 20-million-kilogram Co2e equating to a monetary saving in excess of £60.2 million. Lastly, the Ayr rail freight terminal, could save over 9-million-kilogram Co2e equating to a monetary saving in excess of £26.4 million.

87 ECONOMIC ACTIVITY AND LOCATION IMPACTS REPORT | 6 Tr A n SMISSI on M ECHA n ISMS
Emissions Calculations -
Terminal
Rail (via Kilmarnock) Tare weight t 16 406 Payload t 28 914 Total weight t 44 1,320 distance km 492 592 Laden Co2e kg/t.km 0.10 0 Co2e per train equivalent kg/t.km 90,448 16,402 round trips per day 30 1 days operation per year 312 312 Total Co2e kg/year 25,940,733 5,117,658 Total Co2e t/year 25,940 5,117 Value of Co2e £ £75.03 £14.80 Value of CO2e vs. Road £ £0 £60.23
Road
Emissions Calculations - Stranraer
Rail Freight Terminal Road Rail Tare weight t 16 572 Payload t 28 1,462 Total weight t 44 2,034 distance km 338 369 Laden Co2e kg/t.km 0.10 0 Co2e per train equivalent kg/t.km 50,825 15,766 round trips per day 24 1 days operation per year 260 260 Total Co2e kg/year 13,214,426 4,099,240 Total Co2e t/year 13,214 4,099 Value of Co2e £ £38.20 £11.85 Value of CO2e vs. Road £ £0 £26.35
– Hams Hall
The proposed operation of a rail freight would bring significant benefits to the South West of Scotland, and the increased throughput may in turn unlock further rail-based freight flows and timber extraction opportunities. Although there is a requirement for investment in infrastructure, a rail freight service would make a very substantial contribution to reducing the carbon impacts of HGV haulage, as well as reducing the number of these using the surrounding highways network.
If dedicated rail freight facilities were to be established, it would however require significant mode shift from road to rail to be viable. For rail freight to be successful on this corridor it is likely that there would be a need for either a wider change in policy to promote substantial mode shift and/or a change in the economics of road haulage, driven either by tariffs and taxes or by a rise in the cost of fuel or driver costs. Furthermore, there would need to be a shift from the use of trailers to containers for short and medium distance freight traffic.
This chapter has presented a wide array of economic results relating to the proposed improvement package along the A75 and A77 routes. These results include established monetised impacts, evolving monetised impacts, indicative monetised impacts, and additional monetised impacts.

Figure 6-5 provides a summary of all the benefits and impacts captured for the proposed improvement package. It should be noted the below summary includes additional elements, such as road safety benefits, which have been directly explored through EALI. These are assessed fully in the ‘A75 A77 Strategic and Economic Assessment’.
These results show that dualling of both the A75 and A77 would bring about widespread benefits, to transport users, businesses, the working population, and the region through increased economic activity. However, improvements to the A75 should be a priority over the A77, with dualling of the A75 accruing almost double the benefits of the A77. The results stress the importance of the A75 and the benefits that would be experienced by significantly improving accessibility between Cairnryan, dumfries, and England.


88 ECONOMIC ACTIVITY AND LOCATIONS IMPACTS REPORT | 6 Tr A n SMISSI on M ECHA n ISMS
6.8 Summary
FIGURE 6-5: SUMMARY OF ECONOMIC ASSESSMENT RESULTS - TOTAL PVB
Figure 6-5 shows the proposed improvement package to generate close to an overall £5 billion worth of positive benefits and impacts.
7 Economic Activity and Location impacts
7.1 Overview
1.1.1 Why Carry out an EALI?
The Economic Activity and Location Impact (EALI) analysis provides an assessment of the impact of transport investment or policy measures on the economy, measured in terms of income (GdP or GVA) and/or employment. The EALI analysis assesses the distribution of the national impacts captured through the Transport Economic Efficiency (TEE) and Wider Economic Benefits (WEB), identifying the impacts on different areas. The EALI does not generally identify additional economic impacts that could be added to the TEE or WEB results. Where market failures exist (the impact of negative perceptions, for example), however, the EALI analysis may capture the economic impacts that the TEE analysis may not have fully assessed. note that the EALI Guidance also states that “It is important to recognise that perceptions of problems with the transport system by users, operators, the public at large and politicians can be equally as important as problems that can be quantified through analysis of data”.
The A75 and A77 (/M77) are integral to local/regional and national trips and the commissioning local authorities are therefore interested in the economic impacts at each of these levels/scales.
1.1.2 Gross and Net Impacts
The net impact of a transport option on the Scottish economy is captured by the TEE and WEB analysis. According to STAG, EALI analysis can be reported in two ways:
• As a net impact at the Scotland level
• In terms of its gross components, which will distinguish impacts on particular areas and/or on particular groups in society
1.1.3 EALI as the Rationale for Transport Investment
In developing the case for transport investment, it is necessary to consider the extent to which that case rests on economic development or regeneration impacts, rather than on direct transport impacts.
To identify and assess the scale of any potential EALIs, it is necessary to develop an understanding of how the transport option will generate impacts in terms of GdP (or GVA) and employment. This can be thought of as developing a credible chain of cause and effect, linking a transport scheme (inputs) to its final economic outcomes, namely output and employment impacts. It is therefore necessary to consider:
• How individual (gross) impacts arise
• How these affect particular areas and/or groups
• How these combine to give net impacts at “local” and national levels
In undertaking this analysis, it is necessary to consider how the transport option potentially affects economic activity, first at a local level and then at the Scotland level.
7.2 EALI Assessment
The suggested way of bringing together an EALI is to analyse the potential impact of an option on individual ‘sectors’, namely:
• Manufacturing and processing
• Locally traded services


• Externally traded services
• Mobile/inward/foreign direct investment
• Tourism
• day trippers and shopping
• residents
• Sectoral interactions/synergies
Given available data, a streamlined approach has been applied to summarise the ‘manufacturing and processing’, ‘locally traded services’, and ‘externally traded services’ assessments under a broader banner of ‘businesses and services’, while ‘mobile/inward/ foreign direct investment’ is not included as this data was not made available during the production of this report.
89 ECONOMIC ACTIVITY AND LOCATION IMPACTS REPORT | 7 E C ono MIC A C TIVITY A nd Lo CATI on IMPACTS
The analysis in the following EALI tables is based on a combination of the consultation and business survey results; original baselining analysis and the detailed transport modelling and regional economic assessment exercises undertaken for the scheme. Elsewhere, professional judgement has been applied using the information at our disposal and we believe that the data collected provide a consistent ‘story’ on the potential impacts of the proposed improvements on the A75/A77.
The impacts are assessed on the seven-point scale detailed in Table 7-1.
TABLE 7-1: APPRAISAL SCALE ASSESSMENT
Major Benefit
Moderate Benefit
Major benefits or positive impacts which should be taken into consideration when assessing an option's eligibility
The option is anticipated to have a moderate benefit or positive impact. Moderate benefits and impacts are those which taken in isolation may not determine an option's eligibility, but taken together do so
The option is anticipated to have only a small benefit or positive impact. Minor benefits or impacts are those which are worth noting, but the practitioner considers are not likely to contribute materially to determining whether an option is taken forward no Benefit/Impact
Minor Benefit
The option is anticipated to have no or negligible benefit or negative impact
Minor Cost/negative Impact

Moderate Cost/negative Impact
Major Cost/negative Impacts
The option is anticipated to have only a minor disbenefit or negative impact. Minor disbenefits or impacts are those which are worth noting, but the practitioner considers are not likely to contribute materially to determining whether an option is taken forward
The option is anticipated to have a moderate disbenefit or negative impact. Moderate disbenefits/negative impacts are those which taken in isolation may not determine an option's eligibility, but taken together could do so
Major disbenefits or negative impacts which should be taken into consideration when assessing an option's eligibility
The assessment against each sector is provided in Sections 7.2.1 to 7.2.5.
1.2.1 Businesses and Services
TABLE 7-2: BUSINESSES AND SERVICES ASSESSMENT SUMMARY TABLE
The main drivers of the South West Scotland economy are tourism, farming and forestry, while business representation in the construction, retail and professional, scientific and technical sectors is high. A strong reliance is placed on the A75 and A77 for the region’s economic success as the principal east-west and north-south routes. They act as the area’s key road freight routes for the import and export of goods to Scottish and uK markets. The A75 provides a strategic link for freight between north West England, Scotland, and northern Ireland, while the A77 is the sole strategic route between Glasgow (and the Scottish Central Belt), Ayrshire and Cairnryan. The A75, for example, is pivotal in the transport of timber imports/exports, as evidenced by the number of timber exit points along the route and the level of timber tonnages in the wider dumfries & Galloway area, which is only expected to increase in the future. The A77 meanwhile connects the key economic centre of Glasgow with manufacturing and processing hubs in north and South Ayrshire, and with the Ports at Cairnryan for onward travel to northern Ireland. of note along the A77 corridor is the Enterprise Area located at Monkton, comprising Prestwick International Airport and Prestwick International Aerospace Park, which is the focus of a funding stream of the Ayrshire Growth deal which aims to position Ayrshire as one of the uK’s leading centres of Aerospace and Space activity. Local businesses place the highest importance on the A75 and A77 relative to inbound and outbound deliveries. These businesses will see journey time and vehicle operating cost benefits directly resulting from the proposed package of transport improvements, with benefits anticipated as far as Glasgow. The TEE analysis shows dumfries to accrue the largest share of the benefits, while areas such as Stranraer, newton Stewart, dalbeattie, Castle douglas and newton Stewart are expected to experience benefits because of the bypasses and junction improvements delivered along the A75 and A77. Sectors including agriculture are anticipated to experience small increases in competitiveness from being able to move produce to market more quickly and at a marginally lower cost.
Major Benefit

90 ECONOMIC ACTIVITY AND LOCATIONS IMPACTS REPORT | 7 E C ono MIC A C TIVITY A nd Lo CATI on IMPACTS
Type of Impact Qualitative Assessment Quantitative Assessment
Market Competitiveness/Context
Land/Property Impacts
The South West Scotland labour market is relatively self-contained at present, with the most-travelled-to workplaces in the region (as per Scotland’s Census 2011) largely concentrated in north and western Ayrshire and dumfries/Kingholm. The proposed package of transport improvements would expand the potential travel-to-work market but there is little evidence of labour supply issues in the manufacturing sector, so any benefit is anticipated to be minor at best.

The evidence collected shows there is sufficient development land which has been allocated, primed, and promoted to businesses in this sector, most notably at Monkton through the Ayrshire Growth deal funding stream and at Hawick and dumfries through the Advancing Innovative Manufacturing in the South of Scotland (AIMS) project. The proposed package of transport improvements will add to the attractiveness of these areas for businesses and lessen perceptions of remoteness, through improved routes to market. The scheme is also anticipated to realise cluster development, and overall assist the development of the regional economy.
Minor Benefit

Moderate Benefit
Product Market Impacts
Local Improvements to the A75 and A77 trunk roads would facilitate an increase in the efficiency of product markets, particularly in the aerospace manufacturing and agriculture sub-sectors.
national A gain in efficiency in terms of accessing sites throughout South West Scotland and in England and northern Ireland will be seen throughout Scotland, particularly for business in the Central Belt.
Local Gainers Improved competitiveness would have a positive impact on SMEs located along the A75 and A77 routes, and on the manufacturing hubs at large employment centres located in and around Irvine, Kilmarnock, and Monkton for example.
Local Losers none expected.
overall Impacts
1.2.2 Tourism
Moderate Benefit
Major Benefit
Moderate Benefit
no Benefit/ Impact
national Gainers
The proposed package of transport improvements to the A75 and A77 trunk roads will better connect South West Scotland to the national economy.
Major Benefit national Losers none expected. no Benefit/ Impact
TABLE 7-3: TOURISM ASSESSMENT SUMMARY TABLE
Type of Impact
Qualitative Assessment
Market Competitiveness/Context
domestic trips dominate the tourism sector in South West Scotland and dumfries & Galloway proves to be the most popular destination in the region, in terms of visitor numbers. Most of the domestic visitors to dumfries & Galloway are residents of England and Wales (they accounted for 59% of the overnight trips and 63% of the overnight tourism expenditure between 2017 and 2019), suggesting increased transport connectivity to the region from south of the border via the M6. Ayrshire has a favourable geographic location for domestic tourism within Scotland, being positioned close to the highly populated Central Belt, and is served by the Glasgow-Ayr-Stranraer railway Line and Prestwick International Airport in addition to the A77. It has however declined in popularity with a fall in domestic and international trips in the period 2018/2019. The A77 provides the only trunk road connection through Ayrshire and requires serving the competing demands of tourism and through-trips, with traffic travelling to/from the Ports of Cairnryan, Prestwick International Airport and coastal and golf resort locations, and resident and workforce traffic to/from the many coastal settlements and employment hubs in South Ayrshire, East Ayrshire, and the Glasgow City region. Improvements to the A75/A77 could go a long way to enhancing connectivity in South West Scotland and would tackle current problems including long journey times, lack of network resilience and the associated negative perceptions of the area, drawing in more tourists. The improvements would also better support travel to/from the Ports of Cairnryan, which also seen declining passenger numbers in 2017/2018, by providing improved journey times and increased attractiveness for tourism-use.
Quantitative Assessment
Major Benefit
91 ECONOMIC ACTIVITY AND LOCATION IMPACTS REPORT | 7 E C ono MIC A C TIVITY A nd Lo CATI on IMPACTS Type of Impact Qualitative Assessment Quantitative Assessment
Labour Market Impacts
Labour Market Impacts
Land/Property Impacts
Product Market Impacts
Tourism jobs as a percentage of the total employment in each local authority area are higher in dumfries & Galloway (9%) and South Ayrshire (12%) than the Scottish Average (8%). The tourism sector constitutes an important part of the regional economy, and it is reasonable to assume an increase in tourism would stimulate job creation.

Each local authority has a strategy in place to expand their share of the tourist market and maximising Marine Tourism is one common goal. redevelopments of the Stranraer Marina and Irvine Harbourside, for example, evidence investment in ‘coastal destinations’ to attract new visitors to the area and have the potential to spur adjacent mixed-use property development.
Local Potential increase in demand for locally produced products, especially in food and catering.
national For tourism, which is not displaced, there may potentially be an increase in demand for Scottish produced products.
Local Gainers Local tourism businesses and retail firms which would benefit from spin-off expenditure.
Local Losers none expected, although there is a risk in terms of the impact on property availability and prices.
Major Benefit
Moderate Benefit
Moderate Benefit
Minor Benefit
Major Benefit
no Benefit/Impact
overall Impacts
national Gainers Bringing new additional tourists to Scotland would benefit the country overall, in line with the plan for sustainable growth presented in ‘Scotland outlook 2030’, the new national tourism industry strategy.
Moderate Benefit (seen in local GVA and jobs benefit, relative to nondisplaced elements)
national Losers Possible displacement of tourism from elsewhere in the country. Moderate Cost/ negative Impact (if displacement occurs)
1.2.3 Day Trippers /Shoppers
TABLE 7-4:
DAY
Type of Impact
TRIPPERS/SHOPPERS ASSESSMENT SUMMARY TABLE
Qualitative Assessment
Market
Competitiveness/ Context
The region’s retail market is relatively self-contained. Stranraer, dumfries, and Ayr Town Centres provide the most significant retail destinations and respective retail Impact Studies have confirmed these centres to have wide regional catchment areas. By improving connectivity to these centres which lie along the A75 and A77 routes, retail businesses would experience improvements to visibility, market awareness and ultimately increased trade opportunities from an increased customer base.
Quantitative Assessment
Minor Benefit
Labour Market Impacts
Possible stimulus to job creation through thriving retail sector.
Land/Property Impacts none expected, although small possibility of increased business interest and letting/sale of vacant town centre units.
Product Market Impacts
Local Likely to have a positive impact as a result of increased trade opportunities and better performing retail centres.
national none expected.
Moderate Benefit (if increased trade opportunities are realised)
Moderate Benefit (if increased trade opportunities are realised)
Moderate Benefit (if increased trade opportunities are realised)
no Benefit/Impact

92 ECONOMIC ACTIVITY AND LOCATIONS IMPACTS REPORT | 7 E C ono MIC A C TIVITY A nd Lo CATI on IMPACTS Type of Impact Qualitative Assessment Quantitative Assessment
Labour Market Impacts
Land/Property Impacts

Increased integration is expected to occur on two levels: inter-region (as connectivity increases through the most populous and rural areas of South Ayrshire and dumfries & Galloway) and inter-country (as connectivity increases between Scotland, northern Ireland, and England through improved access to the Ports of Cairnryan and the M6).
The proposed package of transport improvements will result in improved connectivity to key economic, education, health and cultural centres for residents living close to the A75 and A77 routes, and for those living in the Scottish Central Belt and South of Scotland/north of England. This will also result in two associated market responses: Existing residential properties will be more desirable to a wider market; and demand will be stimulated for new properties within the corridor/region.

Enhanced road connections and improved journey times by car and bus to other settlements in the region and to the Scottish Central Belt could open opportunities for out-commuting to higher value employment.
Perceptions of remoteness within South West Scotland may be eased with the increased connectivity brought by the proposed package of transport improvements and there may be some in-migration to the region, particularly amongst higher-paid individuals keen to combine higher wages with the high standard of living offered in the area. This in turn could support the financial viability of residential developments.
Enhanced employment opportunities and improved access to education, health, and cultural centres for study area residents and, in the longer-term, potentially increased housing development in the area.
93 ECONOMIC ACTIVITY AND LOCATION IMPACTS REPORT | 7 E C ono MIC A C TIVITY A nd Lo CATI on IMPACTS Type of Impact Qualitative Assessment Quantitative Assessment overall Impacts Local Gainers Local SME retail businesses. Moderate Benefit (if increased trade opportunities are realised) Local Losers none expected. no Benefit/Impact national Gainers none expected. no Benefit/Impact national Losers none expected. no Benefit/Impact
1.2.4 Residents
Type of Impact Qualitative Assessment Quantitative Assessment
Competitiveness/ Context
TABLE 7-5: RESIDENT’S ASSESSMENT SUMMARY TABLE
Market
Major Benefit
Benefit
Moderate
Minor Benefit Product Market Impacts Local none expected. no Benefit/Impact national none expected. no Benefit/Impact overall Impacts Local Gainers
Minor Benefit Local Losers none expected. no Benefit/Impact national Gainers none expected. no Benefit/Impact none expected. no Benefit/Impact
1.2.5 Sector Interactions and Synergies
TABLE 7-6: SECTOR INTERACTIONS AND SYNERGIES ASSESSMENT SUMMARY TABLE
Enhanced tourism and inward investment would foster higher spending in the South West Scotland economy, with consequent multiplier impacts.
Moderate Benefit
Labour Market Impacts
Land/Property Impacts
Product Market Impacts
Increased employment as a result of an overall increase in economic activity, although this is likely to be marginal.
Increased development viability stemming from increased economic activity and enhanced regional connectivity to key employment hubs.
Local Higher spending anticipated in the South West Scotland economy

national Potentially increased demand in national product markets if net additional inward investment and tourism is attracted to Scotland.
Local Gainers Local SMEs would benefit from enhanced economic activity in the region.
Local Losers none expected.
overall Impacts
7.3 Summary
national Gainers Scotland as a whole would benefit from increased connectivity with the united Kingdom through more efficient passenger and trade routes, and this could result in additional tourism and inward investment.
Minor Benefit
Minor Benefit
Moderate Benefit
Minor Benefit
Moderate Benefit
no Benefit/Impact
Major Benefit
national Losers none expected. no Benefit/Impact
Table 7-7 provides a summary of the sectoral assessment tables and presents an overall EALI Summary Table for the proposals as follows:
• road: Full dualling of the A75 and A77 routes, bypasses of settlements including Kirkoswald, Girvan, Ballantree, Spirngholm and Crocketford, and associated junction improvements
• rail: Electrification of the rail line between Stranraer and Ayr, and the installation of rail freight hubs at Stranraer and Barrhill
TABLE 7-7:
SUMMARY ASSESSMENT TABLE
Year of Assessment
Summary of Impacts
2015 Local National Sector Gains
overall Moderate Benefit
none overall Major Benefit
Businesses and Services

Increased efficiency of product markets, expected to most positively affect the aerospace manufacturing and agriculture sub-sectors
overall Major Benefit
none
Improved connections to the national economy none
overall Moderate Benefit
Tourism
Local tourism businesses and retail firms will benefit from increased number of tourists as travel to the area becomes more attractive
Increased number of tourists as connectivity with the uK is increased and travel to Scotland becomes more attractive
no impact
94 ECONOMIC ACTIVITY AND LOCATIONS IMPACTS REPORT | 7 E C ono MIC A C TIVITY A nd Lo CATI on IMPACTS
Qualitative
Type of Impact
Assessment Quantitative Assessment Market Competitiveness/ Context
Losses
Losses
Gains
improve access to services

make the region more attractive for new
Local - overall moderate benefit driven by increases in efficiency for local businesses and through-trade, and potential for increased trade and employment opportunities
national – Improved connectivity between Scotland and uK markets and potential for increases in tourism and inward investment for Scotland
Summary
Local – dumfries and Galloway receives the highest benefits from the scheme, with over £100m in highway user benefits in the dumfries sector alone.
national – some potential displacement of tourism and inward investment

95 ECONOMIC ACTIVITY AND LOCATION IMPACTS REPORT | 7 E C ono MIC A C TIVITY A nd Lo CATI on IMPACTS Year of Assessment Summary of Impacts day Trippers and Shopping Moderate Benefit Increased connectivity/attractiveness of existing retail centres at Ayr, Stranraer, and dumfries none none none residents Minor Benefit Increased connectivity will
housing development none none none Sectoral Interactions/ Synergies Moderate Benefit Local SMEs will benefit from enhanced economic activity in the region none overall Major Benefit Scotland will benefit from increased connectivity with the uK, in terms of improved passenger and
routes which may result in additional tourism and inward investment none Total Gross Impacts Moderate Benefit no Impact Moderate Benefit no Impact net Impact
Impact
for existing residents and
residents/ increased
trades
overall
of distributional Impacts
8.1 Overview
This report has considered the potential economic activity and location impacts (EALIs) of the proposed package of transport improvements, the highlights of which include full dualling of the A75 (Gretna – Stranraer) and A77 (Stranraer – Ayr) and electrification of the rail line between Stranraer and Ayr.
It accompanies and supplements the Strategic and Economic Impacts report undertaken, which captures benefits categorised as ‘established monetised impacts’, ‘evolving monetised impacts’, ‘indicative monetised impacts’, and ‘additional monetised impacts’.
The EALI analysis has considered the consultation and business survey results; transport and socioeconomic baselining analysis and the detailed transport modelling and regional economic assessment exercises undertaken for the proposed scheme.
8.2 Transport Connectivity
The consultation with local businesses has identified a series of issues with transport connectivity in the region and highlights a particular reliance on road freight and the A75 and A77 for business operations. The principal focus of their feedback was on congestion and road safety, highlighting a need for resilience, reliability, and safety improvements.

research has further identified a series of constraints and outstanding issues with the trunk road network in the region. The A75 and A77 currently see a diverse mix of local and strategic traffic, including trade and tourist traffic, which compete for road space and limited overtaking opportunities primarily due to limitations of the single-carriageway roads. The additional function of these roads as the key routes to the Ports of Cairnryan, uK Irish Sea Ports, sees the formation of long platoons, often led by HGVs travelling to and from the ports.
Long vehicle-based journey times are experienced because of these issues and concerns have been raised by stakeholders about the competitiveness of the Ports of Cairnryan with other uK Irish Sea Ports, due to perceptions of poor connectivity.
Consequently, there are also perceived long journey times by bus and an overall negative impact on the local population’s ability to effectively access key economic, education, health, and cultural centres, including Glasgow. There are large areas of the region where there is low/no access to bus and rail services, adding to an overall perception of remoteness. This is compounded by the region’s rurality which sees rural, and in some cases dispersed, communities place a high reliance on the private car.
8.3 The South West Scotland Economy
The research undertaken in this study has identified the following key economic issues in South West Scotland:
• A ‘two-speed economy’ in which uneven economic growth is found across the region, with more affluent and in many cases well-qualified population concentrated along the populous areas of the Ayrshire coastline and in the urban areas of dumfries & Galloway

• Limited integration between the rural and urban economies, and between the economies of neighbouring areas
• Perceptions of remoteness, which evidence suggests is limiting business investment, access, tourism, and overall attractiveness of the region
These problems appear to be closely linked and have resulted in a regional economy which is less robust and less productive than that of Scotland as a whole. This has manifested through higher unemployment levels, lower productivity, and lower incomes in the region, compared to the Scottish average. The key question in the context of this study was the extent to which current transport connectivity is constraining the productive capacity of the Pembrokeshire economy.
It is noted the impact of the Covid-19 pandemic had a significant impact on the regional and national economies, the extent of which is not addressed in this report which adopts a pre-Covid baseline. A high-level analysis shows the region to have been disproportionately affected by the pandemic, with a large representation (or share of employment) in the highest-risk sectors. These were identified by Scottish Government as manufacturing, construction, retail & wholesale, accommodation & food services and arts, entertainment, and recreation . Additionally, substantial representation of the aerospace industry in South Ayrshire resulted in a further impact on the local economy.
96 ECONOMIC ACTIVITY AND LOCATION IMPACTS REPORT | 8 Con CL u SI on
8 Conclusion
8.4 Economic Activity and Location Impacts
The focus of this study was to consider the potential economic activity and location impacts (EALIs) of the proposed package of transport improvements, including full dualling of the A75 (Gretna – Stranraer) and A77 (Stranraer – Ayr) and electrification of the rail line between Stranraer and Ayr. presents the sectoral and overall impacts of the proposed package of transport improvements.
In summary, the EALI analysis suggests that the proposed scheme will bring moderate benefit at the local and national scale. In the dumfries & Galloway and South Ayrshire local authority areas businesses, residents, and visitors can expect benefits which will arise from improved connectivity and road safety, and decreased journey times. In turn, this has the potential to bring increased trade and tourism opportunities to the region. At the national level, and due to the proximity to the ports at Cairnryan, the proposed scheme will improve uK-wide freight and passenger links and is, therefore, likely to result in additional benefits through tourism and inward investment.


97 ECONOMIC ACTIVITY AND LOCATIONS IMPACTS REPORT | 8 Con CL u SI on


