A75 GRETNA-STRANRAER
A77 AYR-STRANRAER
AND ECONOMIC

A75 GRETNA-STRANRAER
A77 AYR-STRANRAER
AND ECONOMIC
A75 GRETNA-STRANRAER
A77 AYR-STRANRAER STRATEGIC AND ECONOMIC
A75 GRETNA-STRANRAER
A77 AYR-STRANRAER STRATEGIC AND ECONOMIC
Client: Dumfries and Galloway; South Ayrshire; and Mid and East Antrim Borough Councils
Table 1: Strategic and economic impact assessment intervention packages
Table
Improvement
A75/A751 Junction
Glenluce Bypass to Newton Stewart Bypass
Creetown Bypass to Gatehouse of Fleet Bypass
Springholm and Crocketford Bypass
A75/A76 Roundabout
Dumfries Bypass
A75/A701 Junction
A701 Improvement
A709 Improvements
Collin Bypass
Annan Bypass
A75/B721 Junction
Description
Dualling of the A751 between the A75 and A77 including roundabouts at either end.
The provision of at least two additional overtaking opportunities in both directions (two 2 -mile sections in each direction) between Glenluce Bypass and Newton Stewart Bypass (revisit original Muil Farm to Shennanton scheme).
The provision of an additional overtaking opportunity in both directions (one 2 -mile section in each direction) between the Creetown Bypass and the Gatehouse of Fleet Bypass (consider between Carsluith Bypass and Kirkdale House).
A continuous 60mph dual carriageway bypass from the south of Springholm to the north of Crocketford, with a roundabout at either end. The population of each town would still use the local road.
Grade separation of the A75/A76 roundabout (A75 being the through route) to enhance capacity and safety .
Dualling with at-grade junctions over the whole Dumfries Bypass to provide guaranteed overtaking and improved level of service.
Grade separation of this junction (A75 being the through route).
60mph single carriageway bypass of Locharbriggs, realignment and removal of signals at Kinnel Water Bridge.
60mph single carriageway bypass to Torthorald and Lochmaben.
Realignment between Collin Bypass and Car rutherstown to improve overtaking.
Additional overtaking capacity to the Annan Bypass to improve the level of service.
Improve accessibility at this junction.
Dualling between Stranraer and Springholm
Dualling between Crocketford and Dumfries
Dualling between Dumfries and Gretna
Full dualling of the A75 between the A75/A751 junction near Stranraer to Springholm.
Full dualling of the A75 between Crocketford and Dumfries.
Full dualling of the A75 between Dumfries and Gretna.
2: A75 measures and bypasses Table 3: A75 duallingImprovement
Description
A77/A751 Junction Dualling of the A751 between the A75 and A77 including roundabouts at either end.
A77/A713 Junction Signalisation/improved capacity at Bankfield roundabout with left slip southbound to the hospital.
A77/A70 Junction Signalisation/improved capacity at Holmston roundabout.
Connection to Cairnryan This improvement provides a 70mph dual carriageway cutting the corner, moving the A77 inland between Cairnryan and south of Ballantrae in the north, whilst retaining local access.
Ballantrae Bypass A 70mph dual carriageway bypassing Ballantrae but retaining local access with roundabouts.
Lendalfoot Bypass A 70mph dual carriageway bypassing Lendalfoot but retaining local access with roundabouts.
Girvan Bypass A 70mph dual carriageway bypassing Girvan but retaining local access with roundabouts.
Turnberry Bypass A 70mph dual carriageway bypassing Turnberry but retaining local access with roundabouts.
Kirkoswald Bypass A 70mph dual carriageway bypassing Kirkoswald but retaining local access with roundabouts.
Maybole Bypass Opened 31 January 2022.
Minishant Bypass A 70mph dual carriageway bypassing Minishant but retaining local access with roundabouts.
Improvement
Dualling between Stranraer and Ayr
Description
Full dualling of the A77 between the A77/A751 junction near Stranraer to Ayr, excluding those bypassed sections.
Extension to Whitletts Roundabout Full dualling of the A77 between Holmston Roundabout and Whitletts Roundabout.
Table 4: A77 measures and bypasses Table 5: A77 duallingStranraer to Dumfries Construction of a new rail link between Stranraer and Dumfries.
Stranraer to Cairnryan
Stranraer to Cairnryan
Construction of an additional rail link (new rail line and connector to port zone) between Stranraer and Cairnryan servicing the port for P&O Ferries. The existing rail line will only be used for transporting freight.
Construction of an additional rail link (new rail line and connector to port zone) between Stranraer and Cairnryan serv icing the port for Stena Ferries. The existing rail line will only be used for transporting freight.
Girvan to Cairnryan Improvements to the existing rail link between Girvan and Stranraer to service the ports at Cairnryan.
Stranraer to Dumfries New stations at Newton Stewart, Castle Douglas, Stranraer and Dalbeattie.
Stranraer to Cairnryan Passenger rail services will be provided with a split of 90% Cairnryan and 10% Stranraer It is assumed that no park and Ride facilities are to be provided at Cairnryan.
A75 GRETNA-STRANRAER
A77 AYR-STRANRAER STRATEGIC AND ECONOMIC IMPACTS
Client: Dumfries and Galloway; South Ayrshire; and Mid and East Antrim Borough Councils
Systra Ltd was commissioned by Sweco to undertake the TMfS18 modelling to appraise transport and economic benefits of improvements to the A75 and A77 road and rail corridors. Sweco are commissioned jointly by Dumfries & Galloway Council, Mid & East Antrim Counci l and South Ayrshire Council to help inform decision-makers of the economic benefits of the improvements. SYSTRA has appraised three transport intervention scenarios as set out in the original brief. Subsequent to the initial workstream, Sweco requested that a further four scenarios be modelled.
The TMfS18 Do Minimum without policy scenarios for the 2030 BMC and 2045 BQQ forecast years were used as a basis for the test scenario development.
The 2030 and 2045 Reference Case networks were interrogated across the A75 and A77 corridors and a number of coding changes were applied to ensure the network best reflected the real world conditions. Changes implemented to the Reference Case networks included:
• Reduce speed and capacity on links at junction of A75/A751 to be consistent with junction links at the A77/A751. Reduced to 44kph and 1600 capacity
• Dualled section Dunragit bypass on A75 not represented correctly. Coded the links to have higher capacity of 3200 and higher speed of 106kph
• Increase bendiness of the A75 between Collin and Carrutherstown, as it was not reflecting the true nature of the road
• The B723, B722 and B6357 all pass over the A75 at Annan, but in TMfS18 these were coded as junctions. Changed the coding to remove the junctions at these locations
• Increase the east approach capacity at Holmston roundabout to reflect the current roundabout as built
• Maybole bypass links were coded with no capacity index values, which define the junction type at the A node and B node. Recoded capacity index values to reflect the bypass junctions with the A77 at the north and south end and the B7023
• Amended the east and south approach capacities at Whitletts roundabout to better reflect the as built capacities
• The A75 at the A731 was coded as a junction. Recoded the capacity index values to reflect that this is not a junction
• Around Lendalfoot, the reduced speed limit zone was not long enough, so expanded the number of links which were reduced to 61kph
• Multiple overtaking 2+1 sections on both the A75 and A77 were missing. These have been coded in at the following locations:
• A77 south of Lendalfoot
• A77 north of Turnberry
• A75 east of Stranraer
• A75 at Glenluce
• A75 east of Cally Golf Club at the junction with the A755
• A75 west of Twynholm
• A75 north of Castle Douglas
• A75 north of Crocketford
• A75 between the Dumfries Hospital access roundabout and the dualled section west of the roundabout
A range of high-level road improvements on the A75 and A77 were outlined within three packages for modelling in TMfS18. The updated reference case was used as the basis for the packages.
The package 1, package 2, and package 3 models were coded to reflect the road scheme struc ture as outlined below, the details of which follow. Rail improvements package 1 is also detailed and was incorporated into each of the package 1-3 models.
• Package 1: Road scheme package 1 + Rail scheme package 1
• Package 2: Road scheme package 2 + Rail scheme package 1
• Package 3: Road scheme package 1 + Road scheme package 3 + Rail scheme package 1
In addition to the coding changes outlined, link class and link type were altered to suit the new link characteristics where appropriate (i.e., if the capaci ty increased, the link class was also changed from single to dual). The link capacity index was also changed where appropriate, such as the creation of a new junction.
A75 road measures – Stranraer to Gretna – Package 1, 2 and 3
A75/A751 Dualling of the A751 between the A75 and A77 including roundabouts at either
Coding: Increased link capacity to 3200 junction end on A751, speed 106kph
Glenluce bypass to Newton Stewart bypass
Creetown bypass to Gatehouse of Fleet bypass
Springholm and Crocketford bypass
A75/A76 roundabout
Dumfries bypass
The provision of at least two additional overtaking opportunities in both directions (two 2-mile sections in each direction) between Glenluce bypass and Newton Stewart bypass
The provision of an additional overtaking opportunity in both directions ( one 2-mile section in each direction) between the Creetown bypass and the Gatehouse of Fleet bypass
A continuous 60 mph dual carriageway bypass from the south of Springholm to the north of Crocketford, with a roundabout at either end
Grade separate the A75/A76 roundabout (A75 being the through route) to enhance capacity and safety
Dualling with at-grade junctions over whole Dumfries bypass to provide guaranteed overtaking and improved level of service
A75/A701 junction Grade separation of this junction (A75 being the through route)
A701 improvement 60mph single carriageway bypass of Locharbriggs, realignment and removal of signals at Kinnel Water bridge
Coding: Created two 2+1 sections using 89kph and 3200 capacity. First overtake section at Kirkcowan between B733 and B735, second overtake section west of Newton Stewart
Coding: Created two lanes in each direction between Carsluith bypass and Kirkdale House, 89kph, 3200 capacity
Coding: Dual carriageway bypass with roundabouts connecting to the A75, 3200 capacity, 106kph
Coding: Added new link through centre of roundabout allowing connection of the A75, 3200 capacity, 106kph
Coding: Increased capacity on all bypass links to 3200, increased speed to 106kph, as well as increasing the approach link capacity on roundabouts as required
Coding: Added new link through centre of roundabout allowing connection of the A75, 3200 capacity, 106kph
Coding: Single carriageway bypass with roundabouts connecting to the A701, 1800 capacity, 89kph. Straitening of road at Kinnel Water
Table 2-1: A75 road measures – Stranraer to GretnaA709 improvements
60mph single carriageway bypass of Torthorald and Lochmaben
Collin bypass Realignment between Collin bypass and Carrutherstown to improve overtaking
Annan bypass Add overtaking capacity to the Annan bypass to improve the level of service
A75/B721 junction Improve junction/accessibility at this junction
Coding: Two single carriageway bypass with roundabouts connecting to the A709, 1800 capacity, 89kph
Coding: Returned the two sections made more bendy in the reference case back to Class 15 low bendiness/low hilliness
Coding: Increased capacity on two long links of current bypass to 3200 cap, 89.6kph
No action, junction not in TMfS18
Package 2 is as per the measures outlined above but with priority junctions (T -junctions) replacing any access roundabouts
A75 road measures – Stranraer to Gretna – Package 3 only
Dualling between Stranraer and Springholm
Dualling between Crocketford and Dumfries
Dualling between Dumfries and Gretna
Full dualling of the A75 between the A75/A751 junction near Stranraer to Springholm
Full dualling of the A75 between Crocketford and Dumfries
Full dualling of the A75 between Dumfries and Gretna
A77 road measures – Stranraer to Ayr – Package 1, 2 and 3
A77/A751 junction Same as Improvement 1
A77/A713 junction
Signalisation/improved capacity at Bankfield roundabout with left slip southbound to the hospital
A77/A70 junction Signalisation/improved capacity at Holmston roundabout
Connection to Cairnryan
This improvement provides a 70mph dual carriageway cutting the corner, moving the A77 inland between Cairnryan and south of Ballantrae in the north, whilst retaining local access
Ballantrae bypass A 70mph dual carriageway bypassing Ballantrae but retaining local access with roundabouts
Lendalfoot bypass A 70mph dual carriageway bypassing Lendalfoot but retaining local access with roundabouts
Girvan bypass A 70mph dual carriageway bypassing Girvan but retaining local access with roundabouts
Turnberry bypass A 70mph dual carriageway bypassing Turnberry but retaining local access with roundabouts
Kirkoswald bypass A 70mph dual carriageway bypassing Kirkoswald but retaining local access with roundabouts
Maybole bypass Opened 31 January 2022
Coding: All mainline links on the A75 modified to capacity 3200, class 16, speed 106. Link type unchanged
Coding: All mainline links on the A75 modified to capacity 3200, class 16, speed 106. Link type unchanged
Coding: All mainline links on the A75 modified to capacity 3200, class 16, speed 106. Link type unchanged
Coding: Signals not represented in TMfS18. Added slip lane from northeast approach to southeast exit, 1800 capacity. Increased capacity on approaches and circulating lanes to 4200
Coding: Signals not represented in TMfS18. Increased all approaches and circulating lanes to 4200 capacity
Coding: Dual carriageway bypass with roundabouts connecting to the A77, 3200 capacity, 106kph
Coding: Dual carriageway bypass with roundabouts connecting to the A77, 3200 capacity, 106kph
Coding: Dual carriageway bypass with roundabouts connecting to the A77, 3200 capacity, 106kph
Coding: Dual carriageway bypass with roundabouts connecting to the A77, 3200 capacity, 106kph
Coding: Dual carriageway bypass with roundabouts connecting to the A77, 3200 capacity, 106kph
Coding: Dual carriageway bypass with roundabouts connecting to the A77, 3200 capacity, 106kph
No change, fixes made to bypass in the reference case
Table 2-2: A77 road measures – Stranraer to AyrMinishant bypass
A 70mph dual carriageway bypassing Minishant but retaining local access with roundabouts
Coding: Dual carriageway bypass with roundabouts connecting to the A77, 3200 capacity, 106kph
Package 2 is as per the measures outlined above but with priority junctions (T -junctions) replacing any access roundabouts
Road measures – Stranraer to Ayr – Package 3 only
Dualling between Stranraer and Ayr
Extension to Whitletts Roundabout
Table 2-3: Rail measures
Full dualling of the A77 between the A77/A751 junction near Stranraer to Ayr, excluding those bypassed sections
Full dualling of the A77 between Holmston
Rail measures – Packages 1, 2 and 3
Stranraer to Dumfries
Construction of a new rail link between Stranraer and Dumfries
Coding: All mainline links on the A77 modified to capacity 3200, class 16, speed 106. Link type unchanged
Coding: All mainline links on the A77 modified to capacity
Stranraer to Cairnryan (P&O Ferries)
Similar to the above but for Stena Line
Construction of an additional rail link (new rail line + connector to port zone) between Stranraer and Cairnryan, servicing the port for P&O Ferries. The existing rail line will only be used for transporting freight Stranraer to Cairnryan (Stena Line)
Girvan to Cairnryan
Stranraer to Dumfries
Stranraer to Cairnryan (P&O Ferries)
Improvements to the existing rail link between Girvan and Stranraer to service the ports at Cairnryan resulting in 10% journey time improvements
The frequency will be similar to Ayr to Stranraer passenger rail services and the £/km calculation will be derived using the Ayr to Dumfries fares
To complement the construction of an additional rail link between Stranraer and Cairnryan, servicing the port for P&O Ferries, passenger rail services will be provided with a split of 90% Cairnryan and 10% Stranraer
Stranraer to Cairnryan (Stena Line) Similar to the above
Created stations for Dalbeattie, Castle Douglas and Newton Stuart. Determined link distances between stations using GIS and the mapping provided. Created junction east of Stranraer to serve as new rail link between Stranraer and Barrhill, with spurs off to P&O and Stena port locations.
1 AM, 1 IP and 1 PM service per day per direction for the new Stranraer to Dumfries line. Journey time 96 min utes.
Glasgow Central to Stranraer service maintained at 1 NB and 1 SB in the AM and 1 NB and 1 SB in the PM.
All other services are either to/from Kilmarnock and Ayr, which have been changed to serve either Stena or P&O port instead of Stranraer.
Ayr>P&O: 1 AM
Stena>Kilmarnock: 1AM, 2 IP
P&O>Kilmarnock: 1 IP
Kilmarnock>Stena: 2 IP
Kilmarnock>P&O: 1 PM
Glasgow Central>P&O: 1 IP
Partway through the model preparation stage Sweco’s clients wished to expand the modelling scenarios being appraised. The main reason behind this expansion in the scope of the modelling was for the purpose of understanding how each corridor operates in isolation. Preliminary results of packages 1 – 3 had been presented to Sweco, indicating the T -junction model returned marginally better journey time benefits (discussed later in this technical note), so it was decided only four of the following six packages were to be tested, as outlined below:
• Package 4: A75 measures and bypasses (roundabout) + Rail scheme package 1
• Package 5: A75 measures and bypasses (T -junctions) + Rail scheme package 1
• Package 6: A75 measures and bypasses (round abouts) + A75 dualling + Rail scheme package 1
• Package 7: A77 measures and bypasses (roundabouts) + Rail scheme package 1
• Package 8: A77 measures and bypasses (T -junctions) + Rail scheme package 1
• Package 9: A77 measures and bypasses (roundabouts) + A77 dualling + Rail scheme package 1
Sweco advised that packages 4 and 7 were not to be carried forward and have not been modelled or analysed.
The TMfS18 network coding changes highlighted above were updated by changing the following link characteristics as necessary:
• Speed (in kph)
• Capacity (in veh/hour)
• Link type (motorway, A-road or minor)
• Link class (urban or rural; single or dual)
• Link capacity index (value between 1-4, indicating if a junction is present at the A-node or B-node)
The initial workstream journey time results for packages 1 – 3 are presented in Table 3-1 to Table 3-6 for car non-work commute trips (CNWC) and car in-work trips (CIW) respectively. The results have taken the package journey time in minutes and subtracted the reference case journey times, yielding a negligible difference or negative difference in journey time. These are presented as a matrix of journey time differences between towns and villages in the study area. Only the results for the AM period in 2045 are shown.
The results for 2030 consistently showed a similar pattern of differences, except the resulting journey time reduction was either very similar or could be slightly less, by 1 or 2 minutes. The results for the PM also showed a consistent pattern to the AM, but the journey time reduction could be greater by 1 or 2 minutes on origin-destination pairs which already had a large saving of 10 minutes or more.
Results of the analysis of packages 1 and 2 indicate a moderate journey time saving of 1 to 9 minutes with the A75 and A77 measures only in place. The higher savings are seen generally to and from Stranraer due to the bypasses on the A77 and Castle Douglas to and from Annan/Moffat/Peebles, likely due to a combined effect of the bypasses at Crocketford and Lockarbriggs and the dualling of the Dumfries bypass. There was a marginal journey time difference between package 1 (roundabouts) and package 2 (T - junctions), with package 1 yielding slightly longer journey times from 15 seconds longer up to 2 minutes longer (only Stranraer to Ayr/Peebles was 1.5 to 2 minutes longer, other pairs were generally only 30 seconds longer).
Results of the analysis of package 3 indicate a significant journey time saving of 1 to 24 minutes with the A75 and A75 measures and full dualling in place. The greatest savings are seen for Stranraer to and from all other locations compared, with over 20 minutes saved to/from Annan on the A 75 and 15-17 minutes saved to/from Ayr on the A77.
The expanded workstream journey time results for packages 5, 6, 8, and 9 are presented in Table 3-7 to Table 3-14 for CNWC and CIW respectively. Again, only the results for the AM period in 2045 are shown. The results for 2030 consistently showed a similar patter n of differences, except the resulting journey time reduction was either very similar or could be slightly less, by 1 or 2 minutes. The results for the PM also showed a consistent pattern to the AM, but the journey time reduction could be greater by 1 or 2 minutes on origin-destination pairs which already had a large saving of 10 minutes or more.
journey time difference – Package 5 minus reference case, AM period, 2045 (minutes)
Results of the analysis of packages 5, 6, 8, and 9 highlight that when the measures are implemented in isolation, the benefits are generally restricted to that corridor.
Package 5 (A75 measures only, with T -junctions) journey time savings reach a maximum benefit of 5 to 6 minutes and along the A75 only, such as Castle Douglas to and from Annan/Moffat/Peebles and Stranraer to/from Annan/Moffat.
Package 6 (A75 measures and full dualling, roundabouts) mimic the benefits of package 3 along the A75 corridor, with over 20 minutes saved Stranraer to/from Annan. The journey time difference from the reference case for Stranraer to Ayr is zero.
Package 8 (A77 measures only, T-junctions) journey times savings reach a maximum benefit of 8 to 9 minutes Stranraer to/from Ayr only, with a minor 2 minute benefit Stranraer to/from Peebles. There is no difference from the reference case along the A75 corridor.
Package 9 (A77 measures and full dualling, roundabouts) replicates the package 3 savings for Stranraer to Ayr only, along the A77. There is a reduced benefit for Stranraer to/from Peebles of only 7 to 8 minutes, whereas in package 3 the saving was 13-15 minutes. All origin-destination pairs along the A75 show no journey time difference compared to the reference case.
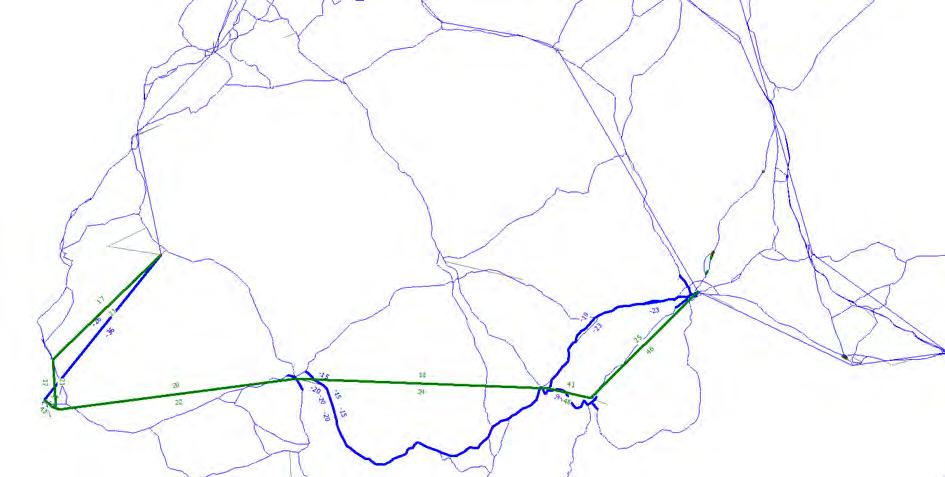
Difference plots of the total traffic flow through the network have been prepared to compare the packages to the reference case. The following figures illustrate a blue line for a reduction in flow of more than -10 vehicles and a green line for an increase in flow of more than +10 vehicles. The flow change values are shown beside the link where possible. The figures are for the AM period in 2045 only.
The PM period will sometimes show new coloured links coming into view, but this is u sually a small increase of just over +10/-10 vehicles on the link. The 2030 networks will generally show coloured links disappearing from the network compared to 2045 because the difference from the reference case is less than the 10 vehicle threshold.


 Figure 4-2: Flow difference plot for package 2 minus reference case, AM period, 2045 (total vehicles)
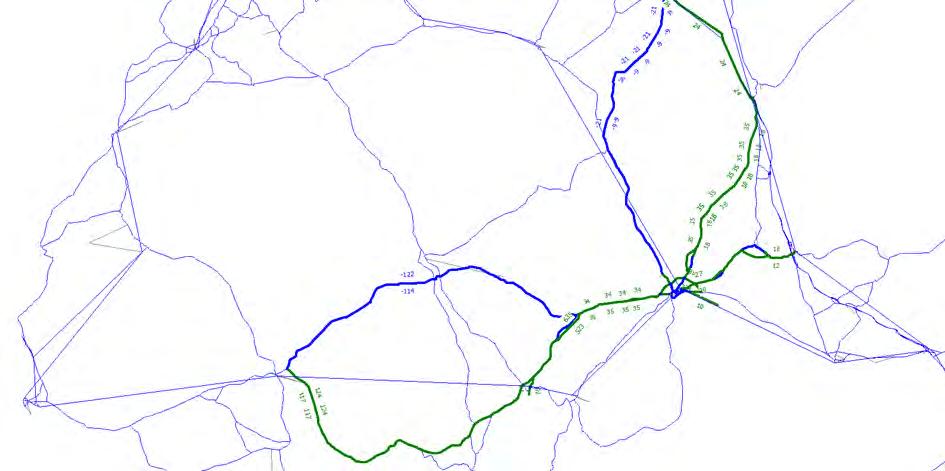
 Figure 4-4: Flow difference plot for package 5 minus reference case, AM period, 2045 (total vehicles)
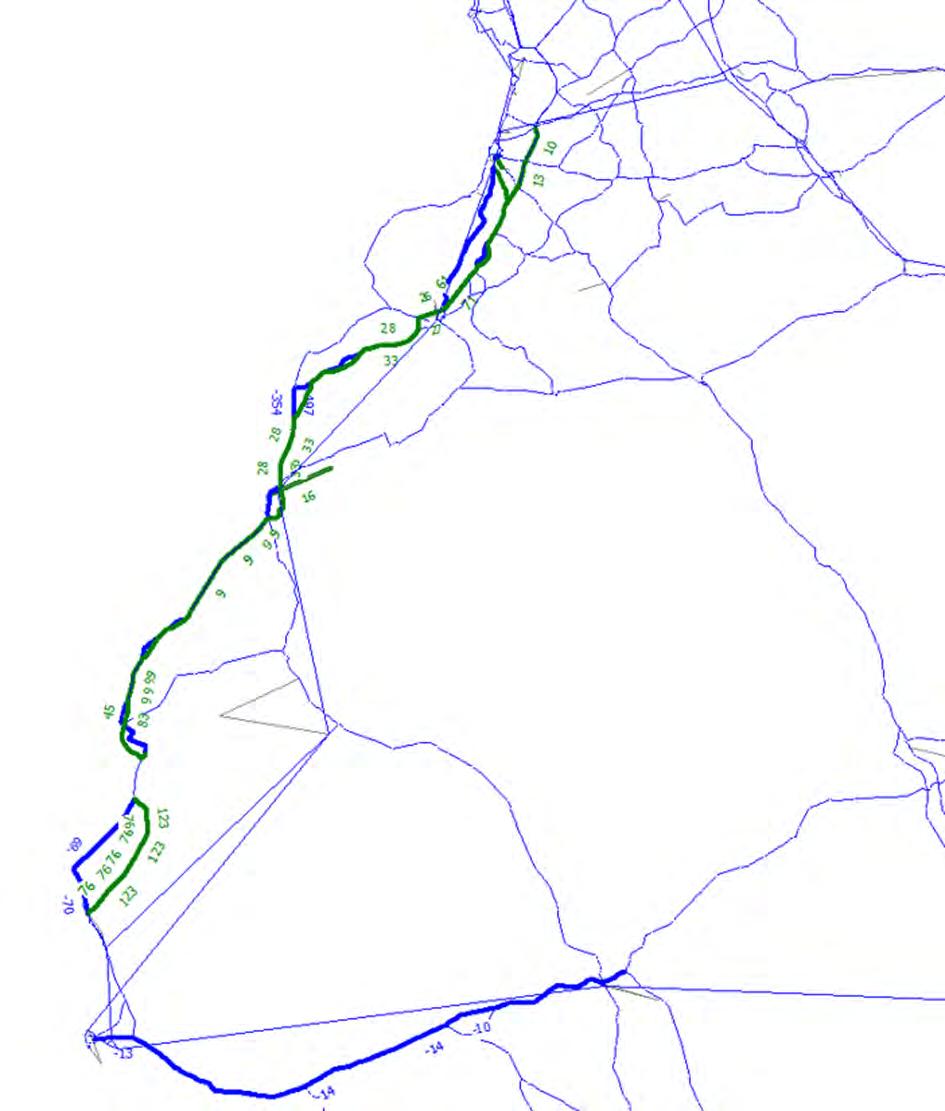 Figure 4-6: Flow difference plot for package 8 minus reference case, AM period, 2045 (total vehicles)
Packages 1, 2, 3, 5, and 6 all included the A75 measures, and the figures above show these packages all resulted in a shift in traffic away from the local road A712 to the A75, in both directions. Packages 1, 2, and 5 included A75 measures only, and the shift was approximately 120 vehicles in each direction. In packages 3 and 6 which also included the full dualling of the A75, the shift was closer to 200 vehicles in each directi on. The A75 measures packages also show a general but smaller shift of around 20 vehicles away from the A702/A76 to/from Dumfries in favour of the A701. Only the full dualling packages 3 and 6 show an increase in traffic of around 70 vehicles on the A75 between Dumfries and Annan.
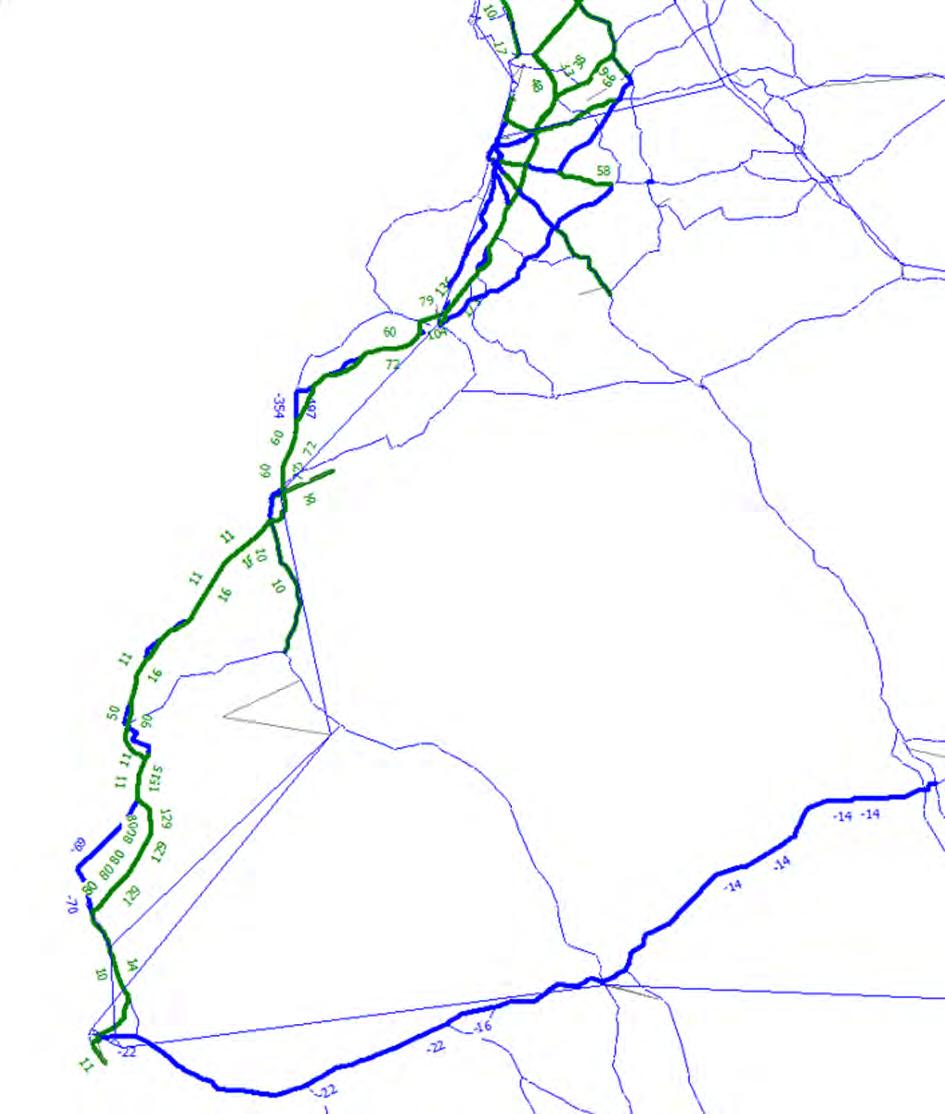 Figure 4-7: Flow difference plot for package 9 minus reference case, AM period, 2045 (total vehicles)
Packages 1, 2, 3, 8, and 9 all include the A77 measures, and the figures illustrate a shift in traffic out of the village centres and onto the bypasses included on the A77. There is a marginal increase in traffic in both directions of around 10 vehicles on the A77 south of Girvan and around 60 vehicles north of Girvan in packages 3 and 9, which include full dualling of the A77. Package 8, which is the A77 measures only, shows a smaller increase in traffic on the A77 of 10 vehicles south of Girvan and 30 vehicles north of Girvan.
Difference plots of the total passenger flow through the network have been prepared to compare the packages to the reference case. The following figures illustrate a blue li ne for a reduction in flow of more than -10 passengers and a green line for an increase in flow of more than +10 passengers. The flow change values are shown beside the link where possible.
The only area to exceed +10 or -10 passenger flow shift was from bus to rail along the A75 corridor. Reviewing the public transport difference plots it became apparent that the change in public transport flow was generally the same volume across all packages, for both 2030 and 2045, for both the AM and PM periods. The AM and PM flows do differ, but they are broadly consistent across all packages. The general pattern that emerged was as follows:
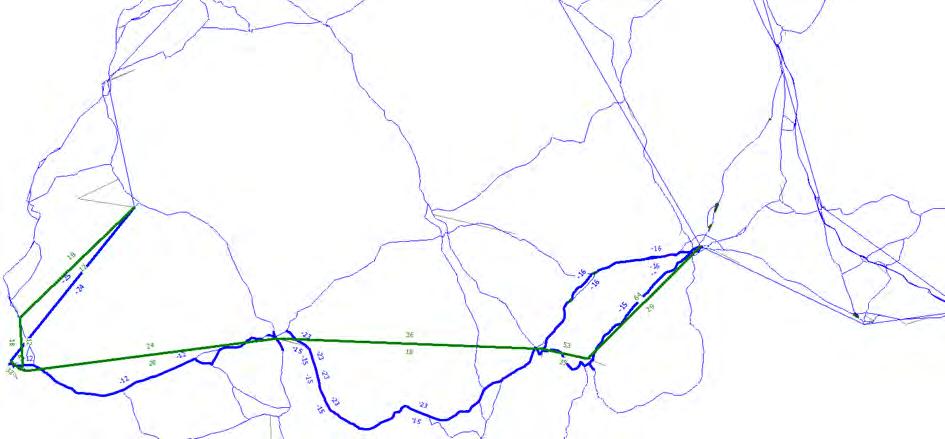
• An overall increase in passenger flow on the new Dumfries -Stranraer rail line
• An overall decrease in passenger flow on buses on the A75
• 2030 showed a larger increase in passenger volume on rail than 2045, though both show an increase
• In the AM period, the eastbound rail flow is larger than the westbound flow
• In the PM period, the westbound rail flow is larger than the eastbound fl ow
• A larger passenger flow increase is shown between Castle Douglas and Dumfries, as opposed to between Castle Douglas and Stranraer
• An overall increase in passenger flow on the upgraded Stranraer -Barrhill rail line
• An overall decrease in passenger flow on buses on the A77 between Stranraer and Barrhill
Figure 4-8 to Figure 4-12 illustrate the passenger shift for package 1 2030 and 2045, in the AM and PM periods. The package 1 results illustrate broadly what the passenger volumes are for all the other packages. Figure 4-12 presents the one exception, that for packages 3 and 6 (both having the full dualling on the A75), the PM shows a small passenger shift (approx. 15 passengers) away from rail to bus for flows entering Scotland from England, in both 2030 and 2045 (2045 is illustrated).
Figure 4-8: Passenger difference plot for package 1 minus reference case, AM period, 2030 (total passengers)
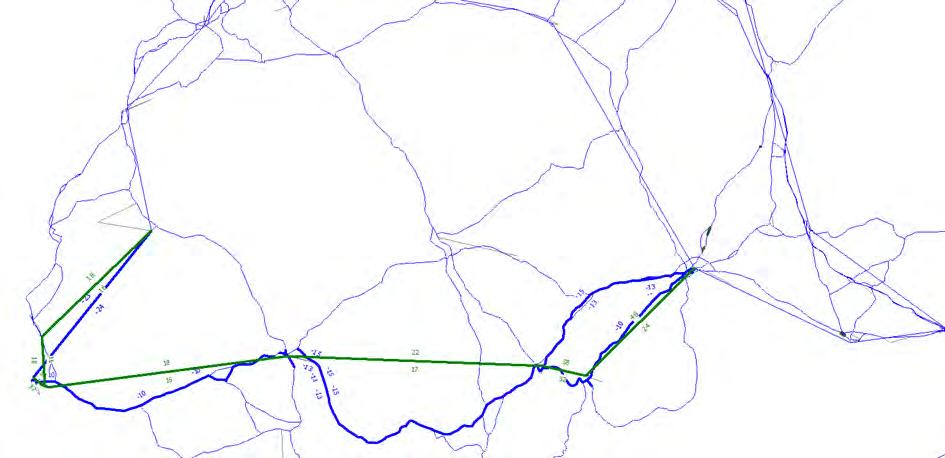 Figure 4-9: Passenger difference plot for package 1 minus reference case, PM period, 2030 (total passengers)
The package 1 figures demonstrate that the maximum passenger shift to rail occurs on the Dalbeattie to Dumfries leg eastbound in the AM period 2030 at around 64 passengers. By 2045 this has dropped to around 48 passengers, though this is still the largest shift in 2045. In the PM period the maximum passenger shift to rail occurs on the Dalbeattie to Castle Douglas leg westbound, with about 59 passengers in 2030, dropping to 48 in 2045.

Passenger flow on rail between Stranraer and Newton Stewart is generall y the lowest of between 15 to 25 passengers each direction and the bus patronage on the A75 generally falls by 15 to 25 passengers, with a slightly larger fall eastbound in the AM period and westbound in the PM period.
Passenger flow on rail between Stranraer and Barrhill is generally higher northbound in the AM period and higher southbound in the PM period. The drop in bus patronage is not balanced with in the increase in rail patronage, with a larger drop in bus passengers compared to the increase in rai l passengers.
Figure 4-11: Passenger difference plot for package 1 minus reference case, PM period, 2045 (total passengers) Figure 4-12: Passenger difference plot for package 3 minus reference case, PM period, 2045 (total passengers)Abbreviation Meaning
APPI Assembly of planning policy information
DELTA Land use/economic modelling package developed by DSC
DETR Department of the Environment, Transport, and the Regions
DfT Department for Transport
DSC David Simmonds Consultancy Limited
GVA Gross Value Added
LATIS Land use and transport integration in Scotland
LUMIT Land use model influenced by transport – typically a LUTI-type model run without using the link from land use forecasts back to transport
LUTEE Land use/transport economic efficiency – now referred to as ULTrA
LUTI Land use/transport interaction
PVB Present value benefits
REM Regional economic model
RoH Rule of a half
STAG Scottish transport appraisal guidance (Transport Scotland)
STPR2 Strategic transport projects review 2
TAG Transport appraisal guidance (DfT)
TCRTM Tay Cities regional transport model
TEE Transport economic efficiency
TELMoS Transport/economic/land use model of Scotland
TfL Transport for London
TfN Transport for the North
TMfS Transport model for Scotland
UK2070 UK 2070 Commission
ULTrA Unified land use/transport appraisal
WEI Wider economic impacts
WIC Wider impacts calculator
This document presents the results of a project commissioned by Sweco to Systra and its sub-consultant DSC to apply the TELMoS18A land use/economic model and associated appraisal tools to the proposals that South Ayrshire, Dumfries and Galloway and Mid and East Antrim Councils are developing for improved road and rail links to Cairnryan. Systra also undertook the TMfS18 transport modelling which has informed this analysis
The TELMoS18A model is the latest version in a long series of land use/transport interaction models for Scotland which have been developed and progressively refined and updated over the past 20 years. Documentation of previous versions is available on the LATIS website.
The use of TELMoS allows dynamic agglomeration effects through the WIC to be calculated, a STAGcompliant appraisal tool developed by DSC. ULTrA goes beyond the wider economic impacts appraisal to address the wider spatial and social impact of transport (and land use) interventions. A relatively new approach, it applies conventional welfare -based cost-benefit analysis to the zonal variables of DELTA and therefore TELMoS18A, to estimate transfers between broad sectors of economic actors at different spatial levels.
This document is divided into two parts.
The first part describes the TELMoS model ( Chapter 2) and presents the results obtained from running the scenario tests through the current version of that model (Chapter 3) These results show the impacts of the proposals tested, i.e., an estimate of what will happen as a result of implementing the proposals, compared with what is forecast to happen if they are not implemented. This part of the report also shows standard wider impact results calculated using T ELMoS18A and the associated software for wider impact calculations (Chapter 4)
The second part of the report ( Chapter 5 onwards) describes the method of ULTrA and the associated results. These results show the estimated benefits of the proposals tested, i.e., which groups of people or organizations, in which areas, will be better or worse off as a result of the proposals being implemented, compared with their situation if they were not implemented.
TELMoS is one half of the national land use/transport interaction model of Scotland. It is an a pplication of the DELTA package, used in interaction with TMfS as the main modelling framework for Transport Scotland’s LATIS programme.
Work on the development of TELMoS started in 2003. Since that original version, there have been successive updates and extensions of TELMoS, carried out under a variety of contractual arrangements, but most recently commissioned directly from DSC by Transport Scotland under Lot 3 of the LATIS Framework contracts. The main versions have been identified as TELMoS07, TELMoS12 , TELMoS14, TELMoS18 and now TELMoS18A – the two-digit number identifying the base year from which the model forecasts forward (and importantly, the base year to which the corresponding TMfS model is updated).
TELMoS18A was developed primarily to support Transport Scotland’s work on STPR2, though other applications have already arisen. STPR2 is a Scotland -wide review of the strategic transport network to identify interventions required to support the delivery of Scotland’s economic strategy, which will inform transport investment in Scotland for the next 20 years. The STPR2 report was published on 20 January 2022.
The TELMoS18A model covers the whole of Scotland, with external zones representing the regions of England and Wales. In DELTA terms, the fully modelled area is Scotland.
The zone system within Scotland has been inherited from TELMoS14 with the exception of some disaggregation in a small number of zones, increasing the number of zones in Scotland from 783 to 787. The additional disaggregation was driven by TMfS18 requirements. For most purposes, the number of external zones remains 16 (there are some additional details in the freight modelling interface).

The model also uses higher-level spatial units called macrozones. These were previously known as areas; that terminology may persist in places. These are aggregations of sets of zones to functional economic areas (based on Census travel to work areas) which the REM and migration model forecast to. The macrozone definitions have been inherited from TELMoS14, except for a small number of adjustments to some zones which have been allocated into adjacent macrozones because of a poor match to travel to work areas identified during TELMoS14 work. There are 44 macrozones covering the whole of Scotland.
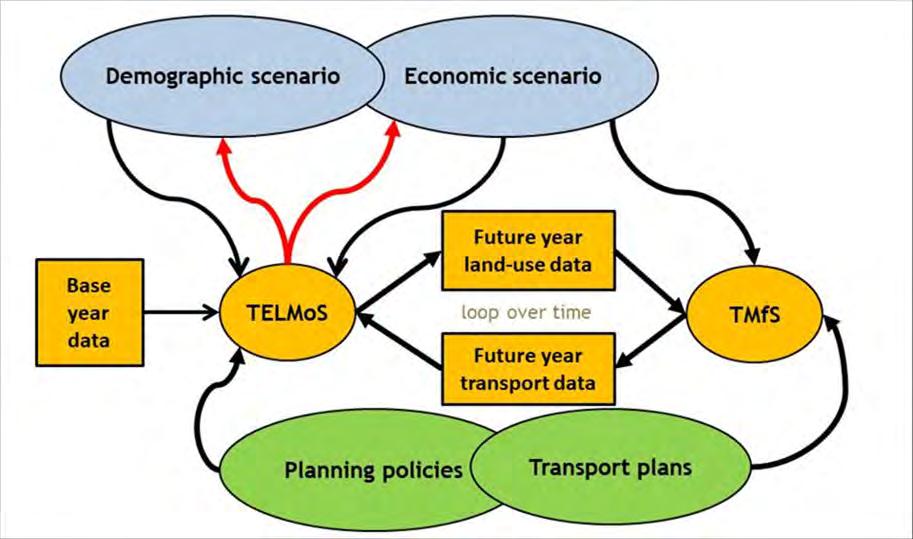
One of the key issues in LUTI modelling is whether the overall scenarios are taken strictly as given or may be modified by the interventions tested (as indicated the red arrows upwards from “TELMoS” in 0).
TELMoS18A is implemented as a variable scenario model but can be constrained to a fixed employment scenario. Since the changes in the total employment scenario come about through effect s on productivity, the variable form is known as the variable productivity model (VPM); the constrained form is known as the fixed scenario model or FSM. Note that output and GVA can vary in both versions, though the scope for change is greater in the VPM. The demographic scenario is fixed in both versions.
Figure 2-1: TELMoS18 zones and macro zonesThe total employment impacts from the VPM may be positive or negative – the model does not assume that plans will have positive consequences. Note that the impacts represent an adjustment of the input scenario for Scotland in response to the plans and policies being tested; they do not make the process circular.
The scenarios implemented in TELMoS18A to date have been specified primarily for use in STPR2. The scenarios consist of:
• One demographic scenario
• Two “traffic level” scenarios reflecting different levels of response to the climate change emergency, diverging after 2020
• Three economic scenarios, reflecting different ways in which the Scottish economy may develop, diverging after 2025
The model used for the A75/A77 package testing uses the rural and resources high traffic scenario (which is the same scenario used for STPR2).
The base year for TELMoS18 and TMfS is 2018. The starting land use databases have been developed in a slightly different method because of the length of time since the last Census. A version of the TELMoS14 model was adapted to the slightly different TELMoS18 zone system and used to produce a “best yet” forecast of change from 2014-2018. This forecast was constrained to observed data on population, households, and employment as well as using observed information on planning policy to ensure consistent growth in the stock of residential and commercial property.
In addition to being the most practical way of estimating the detailed database required for a non -Census year, this approach has the benefit that the time-lagged responses in the early forecast years afte r 2018 can respond to some of the data about changes over the period 2014 -2018. This should give more realistic forecasts than if the model had no information on pre -base year change.
An important characteristic of the model is that the model reads in the given database for the base year, 2018, and produces a forecast database containing the same variables at the same levels of detail for the first forecast year, 2019. It then repeats the process to forecast for 2020, and so on for as long a forecast as required. The definitions of variables in the base year database are therefore also the definitions of the forecast output variables.
Figure 2-2: Overall model structureThere is an interface between the land use (TELMoS18) and transport (TfMS18) models that passes data between the two models.
The transport model requires employment and demographic data as a basis for travel demand. These data, in the form of population and household data by type and socio -economic status, are output from TELMoS18 into formatted files by zones and transferred to the transport model. The output data also includes specific types of employment sectors.
The land use/economic model requires data describing how easy or difficult it is to travel or to move goods between any two zones, or within any zone ( “intrazonal” movements). Ease or difficulty of movement is measured in terms of generalised costs, which reflect the time taken for the journey (including, for public transport journeys, access to/from stations, waiting time, etc.), its money cost and key elements of “inconvenience” such as congestion on roads or the number of changes between trains.
The transport data input to TELMoS18 consists of matrices of generalised costs by mode and purpose, for the base year and for each of the transport model forecast years: 2018, 2025, 2030, 2035, 2040, and 2045. For the purposes of this assessment the ‘without policy’ forecast scenarios were utilised.
The TELMoS18 model runs in one-year steps. It is currently set up to forecast to 2046. The extension of the forecast period beyond the last transport model year would allow the model to capture some (albeit limited) land use impact of that final transport forecast and reflects the types of land use time lags present in responding to transport changes.

Business activity is measured mainly in terms of employment. National growth in emp loyment (and the associated growth in production) is controlled to a given scenario. The present modelling work is concerned with how transport and land use interventions will affect the distribution of economic activity within Scotland and does not allow the totals to vary.
Within each run of the model, the location of employment is determined through processes which represent business choices about :
• Where within Scotland to invest
Figure 2-3: Time marching sequence• Where to trade and to produce
• At a more local level, about where to locate premises
For the majority of sectors, each choice is influenced by accessibility or transport cost terms, as well as by a range of other variables.
The number of households and the size of the population are likewise constrained to a given national scenario. The location and mix of households and residents changes over time through :
• Migration (longer-distance moves, particularly influenced by employment prospects)
• Local moves (particularly influenced by housing availability, but also by accessibility to wor k and services)
• Gaining or losing employment
Changes in the location of businesses affect households over time, by changing the demand for labour in each location; and changes in the location of households affect businesses over time, by changing the supply of labour and the demand for services.
Developer choices are represented by models of how much floorspace to build, and where to build it. Developers’ decisions are driven by expected profits, which in turn are driven by occupier demand Development therefore tends to follow businesses and households, whilst also being constrained by the inputs representing planning policy (which control the amount of development that can take place in any location at any time).
The sensitivities of businesses, house holds and developers to different stimuli are set mainly by adjusting the model so as to reproduce, as far as practical and appropriate, elasticities or other measures of response which have been drawn from previous research.
The land use policy inputs are one of the key inputs to the TELMoS model. They inform the modelling of development. They influence the model’s forecasts of future floorspace, and hence can strongly influence where people live and work. They determine:
• Where development may take place
• In which year land for development is likely to come forward
• The maximum amount of development that may take place in any zone
The APPI18 data are based upon information provided by the 34 local planning authorities ( i.e., the 32 local authorities and two national park authorities) and describe the scale and location of planned development.
Information is included for all 8 of the land uses modelled within TELMoS as shown in Table 2-1.
The data obtained from TMfS18 is combined with TELMoS18A’s own data on land uses to calculate a range of accessibility measures for each zone and macrozone. These are recalculated in each year of each forecast, in non-transport model years, the most recent generalised costs are used as well as the land use forecast for the given year. It is worth reinforcing the concept that accessibility in DELTA is opportunity measured, and changes in planning policy and development can affect accessibility along with cha nges in generalised costs.
Within a single forecast model run, the other sub -models are sensitive to changes in accessibility over time. It is the differences between the accessibilities based on do-something (with scheme/interventions) generalised costs and those based on do-minimum (without scheme/interventions) generalised costs that give rise to the different forecasts and hence show the impact of any interventions tested.
The packages of interventions cons ist of major improvements to the A75 and A77, a branch from the existing Ayr-Stranraer railway line to Cairnryan Port, and a new or reopened railway line (for passengers and freight) from Cairnryan and Stranraer to Dumfries (and thence via the existing lin e to the West Coast Main Line). The present work involves testing packages (“ do-something” tests) against the “do-minimum” test (existing commitments only), under the “ without policy” scenario recently developed for STPR2.
The client group intends to explore the following packages listed below:
• Package 1 = A75 measures and bypasses + A77 measures and bypasses + rail improvements
• Package 2 = As per package 1 but with T-junctions (priority junctions) replacing any access roundabouts
• Package 3 = As per package 1 + A75 and A77 dualling
• Package 5 = A75 measures and bypasses (T-junctions) + rail improvements
• Package 6 = A75 measures and bypasses (roundabouts) + A75 dualling + rail improvements
• Package 8 = A77 measures and bypasses (T-junctions) rail improvements
• Package 9 = A77 measures and bypasses (roundabouts) + A77 dualling + rail improvements
The TELMoS outputs that have been reported are for packages 1, 3, 6 and 9.
The work involved the following steps:
• Running TELMoS18A for the do-minimum high traffic scenario using outputs from Systra’s running of TMfS18, with updated forecasts of employment growth at Cairnryan, and checking the forecasts produced
• Running TELMoS18A again for the 4 do-something packages under the high traffic scenario, using the corresponding outputs from TMfS18
• Running STAG-type agglomeration, more-people-in-work, and moves-to-differently-productive-jobs appraisal calculations on the differences in costs between each package and the do-minimum
• Extracting GVA impacts from those differences
• Running ULTrA to measure the welfare benefits inclusive of land use/economic impacts
• Reporting the work, as described below
This chapter describes the scenarios that were run in conjunction with Systra and their outcome in terms of land use variables.
Table 3-1 presents the list of tests (and test codes) that are mentioned and described in this report. The appraisal is for the period 2030 – 2045 and the results in this report are presented for the final year.
Test Description
ZZ
TELMoS18 do-minimum – includes committed and other “expected” transport improvements across Scotland including area specific network amendments, and development plans based on the data collected from local planning authorities in 2018 [APPI18]
AB Package 1 – A75 measures and bypasses + A77 measures and bypasses + rail improvements
AC Package 3 – As per AB plus A75 and A77 dualling
AJ Package 6 – A75 measures and bypasses + A75 dualling + rail improvements
AK Package 9 – A77 measures and bypasses + A77 dualling + rail improvements
A range of high-level road improvements on the A75 and A77 were outlined within packages for modelling in TMfS18. The updated do-minimum was used as the basis for the packages. Details into each intervention can be found in Appendix A.
The above tests have not been run as full LUTI models, but they were run as LUMIT tests. This means that the land use model received the changes in costs in 2030 and 2045 but the land use planning data was not passed back to the transport model for it to run in the next transport year.
DSC carried out and provided three different analyses:
• Agglomeration, moves to more or less productive jobs (as defined in STAG and implemented in TELMoS)
• GVA impacts
• Land use/transport welfare effects (ULTrA application)
The various measures along the A75 and A77 were coded into the transport model, and the resultant TMfS18 costs fed back to DSC for their assessment. The impacts for each package are shown below.
This chapter presents the land use impacts of the transport improvements included in package 1 in terms of employment, households, rents, floorspace and GVA. The land use changes driven by the package 1 costs (and hence the new accessibilities) are shown i n 2045.
Accessibility is a key concept in TELMoS. There is no single measure of accessibility, but a range of different variables of different kinds at both zone and macrozone levels.
Table 3-1: Definition of scenariosFor passenger travel, the model work s on the hypothesis that the different modes of passenger transport are alternative means of getting from origin to destination. The passenger modes considered are car, public transport, and walking. The car and public transport modes are as defined in TMf S18, and the generalised cost for any journey (inter- or intra-zonal) is that passed to TELMoS18A by the interface. The generalised costs of walking are calculated from journey distances (themselves supplied from TMfS18 base year data) at a fixed speed. All are measured in minutes.
The accessibility measures therefore combine land use data output earlier in TELMoS with transport data mainly from TMfS. Accessibilities can change because of land use changes even when transport costs are not changing at all; this plays a significant role in the linkages between different land use activities. Note that if total employment is increasing over time, all the measures that are related to numbers of jobs or numbers of workers will tend to improve over time, even if t here are no changes in transport and the numbers of jobs and workers increases by the same proportion in every zone.
For households, the accessibility measures are conditional on car ownership, i.e., for each activity in each zone, there is a different measure of accessibility for each possible car -ownership level. Higher carownership levels always have better accessibility . The difference between levels is typically most marked between no-car and one-car, and greater in rural areas than in large urban one s (where public transport is more significant, and equally available to car -owners and non-car-owners).
For practical reasons, in this report the analysis of the costs and the accessibilities has been presented only for selected purposes and measures (commuting for workers belonging to SEL2). The full set of results and graphics is available upon request.
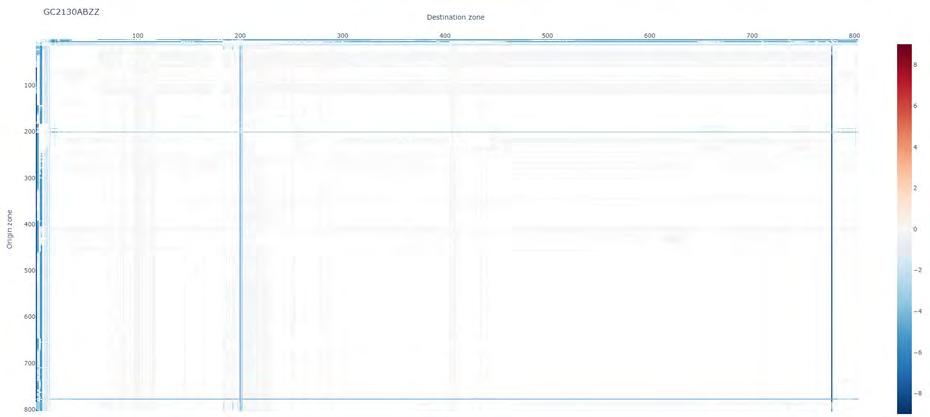
The two heat maps presented in Figure 3-1 and Figure 3-2 show the absolute difference in generalised costs between the package 1 test and the do-minimum test for commuting between each origin/destination pair and for each mode. The difference in costs coming from road improvements ranges between +/ -10 generalised minutes.
The changes in cost originated by the public transport improvements are much larger than the one for the car mode. This is to be expected due to the large size of rail network improvements.
In both graphs, it is evident that the most prominent improvements occur in Dumfries and Galloway and South Ayrshire as one would expect.
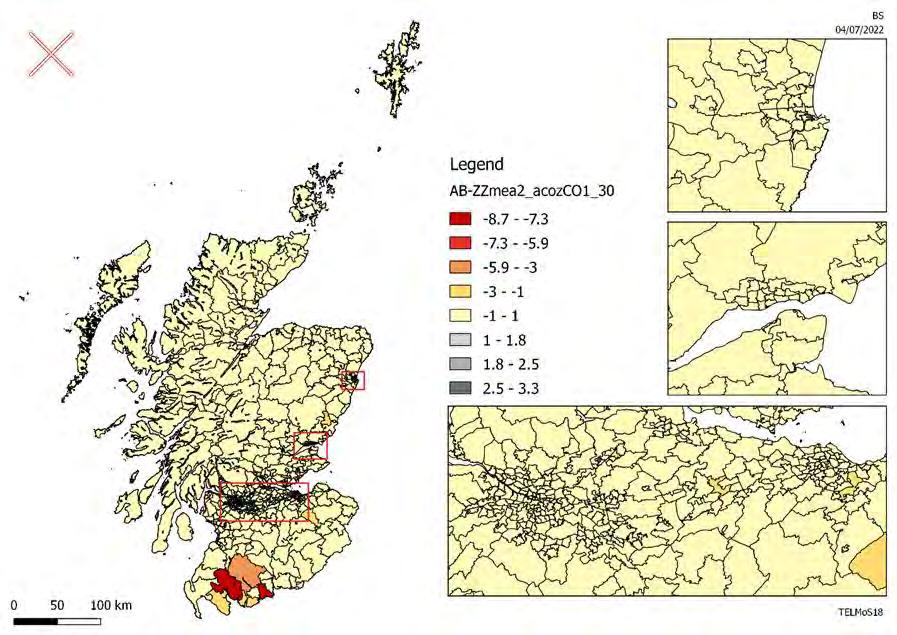
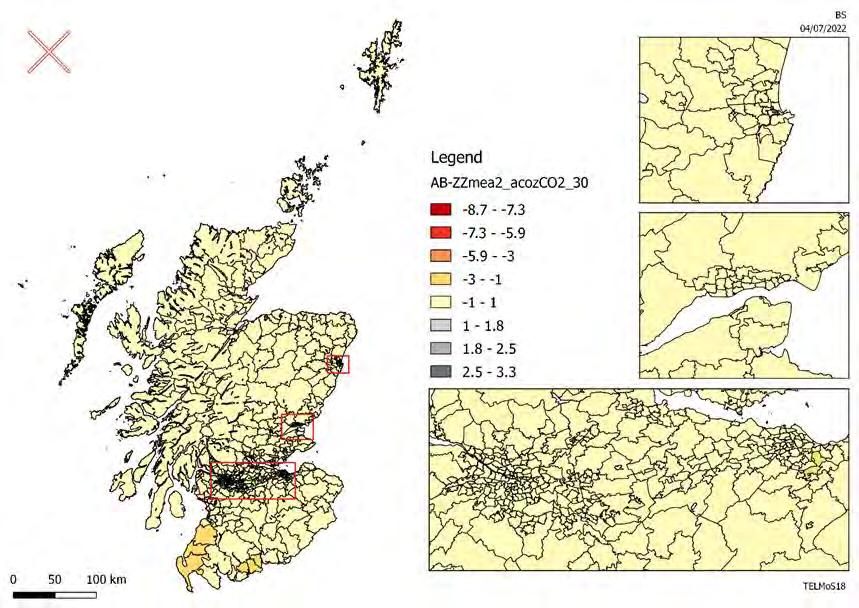
Figure 3-1: Absolute change in car commuting generalised costs (Package 1 – Do-minimum)Figure 3-3 to Figure 3-5 present the impacts of the improvements included in package 1 in terms of accessibility. As mentioned before, the accessibility measures combine land use data with transport data. The maps presented below show the absolute impact of package 1 on accessibility to workplace for workers belonging to SEL2 for each car-ownership level.
The convention used in the maps is that negatives represent an improvement in accessibility, and they are represented in a scale of red. Worsening in accessibility is represented by a positive number and a scale of grey colours. The darker the colour is, the higher the difference in accessibility between the package and the do-minimum test is.
The largest impacts in terms of accessibility are observed for non -car owners. As one would expect, an improvement in the public transport offer would improve the accessibility of people that do not own a car and hence rely completely on trains and buses to access their workplaces.
The other two car-ownership levels show smaller, but still positive impacts from the improvements in package 1.
Dumfries and Galloway shows the largest improvements in accessibility with the largest impact occurring in Newton Stewart and St Johns Town. Small impacts far from the study area (such as in the central belt and south east of Edinburgh) are due to noise in the models and can be disregarded.
 Figure 3-2: Absolute change in public transport commuting generalised costs (Package 1 – Do-minimum)

The dotted graphs below (Figure 3-6 to Figure 3-8) show an alternative method to visualize the same measure of accessibility. Each colour in the graph represents a local authority and this tool shows that the largest changes in accessibility occur in the local authority where the package 1 improvements are being delivered (Dumfries and Galloway and the Ayrshires) and it also shows that ther e are some unexpected changes in accessibility in other local authorities far from the study area, which are due to noise in the model.
Once again, these graphs show that the largest impact of the improvements are for non-car owners.
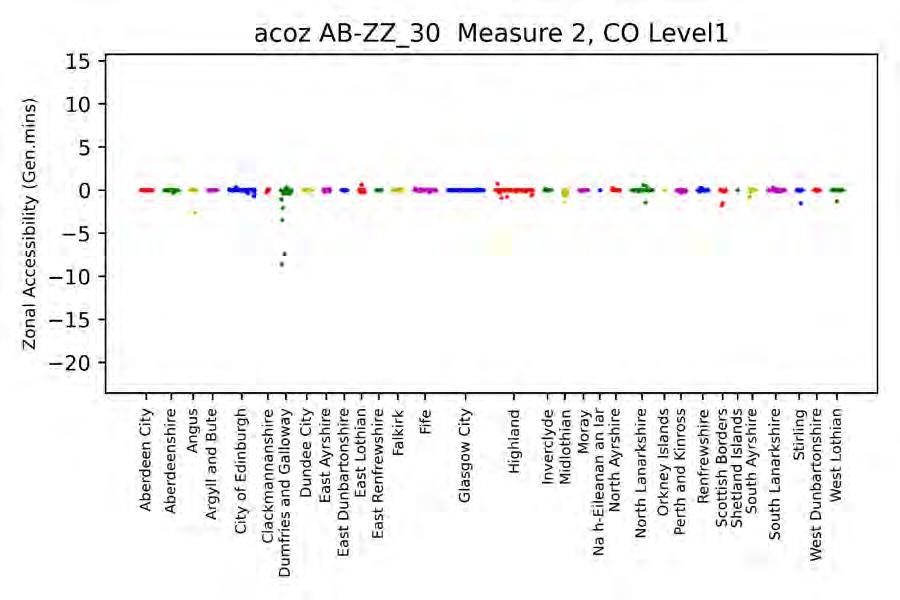

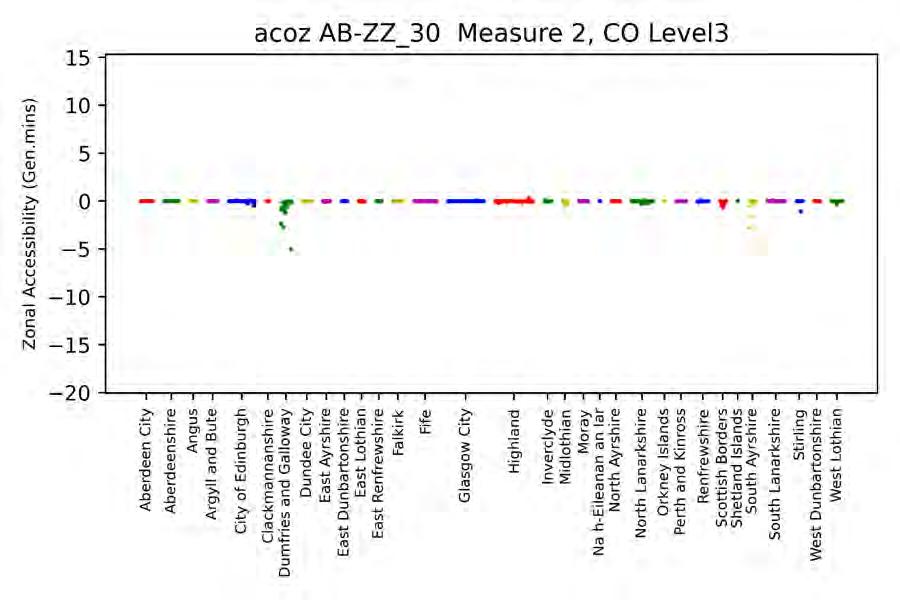 Figure 3-7: Absolute difference in accessibility to the workplace for SEL2 workers – 1 car
Figure 3-8: Absolute difference in accessibility to the workplace for SEL2 workers – 2+ cars
For all employment activities, the distribution of jobs to zones within each macrozone is influenced by the previous numbers of that activity in that zone. The default is that in any one year, each activity will grow or decline by the same proportion in each zone. For most activities, this default assumption is modified by :
• Changes in accessibility
• Changes in the amount of floorspace available
• Changes in the cost of occupying that floorspace, i.e., changes in rent modified by any changes in the floorspace occupied per worker
The effect of floorspace works through:
• Total supply – other things being equal, jobs will tend to distribute in proportion to the available space in each macrozone
• The effect of rent on the cost of locating each job
The rent of each type of floorspace in each zone is iteratively adjusted until all of the available stock is accounted for as:
• Occupied by located jobs (product of number of jobs and floorspace per worker)
• Left vacant by a user-defined input (typically to allow floorspace to be demolish ed in the following year)
• Held vacant by landlords because they do not consider it worthwhile letting at current rents
The proportion of floorspace kept vacant by landlords is the previous level of vacancy adjusted in response to rents i.e., if rents increase, the vacancy rate will decrease, and vice versa. Note that vacant office space may in some circumstances be redeveloped as housing
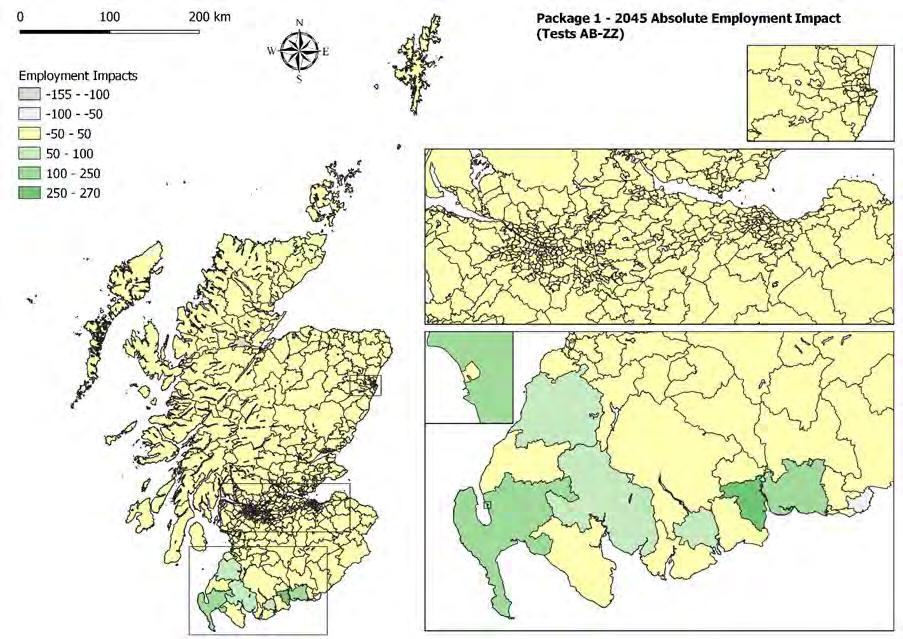
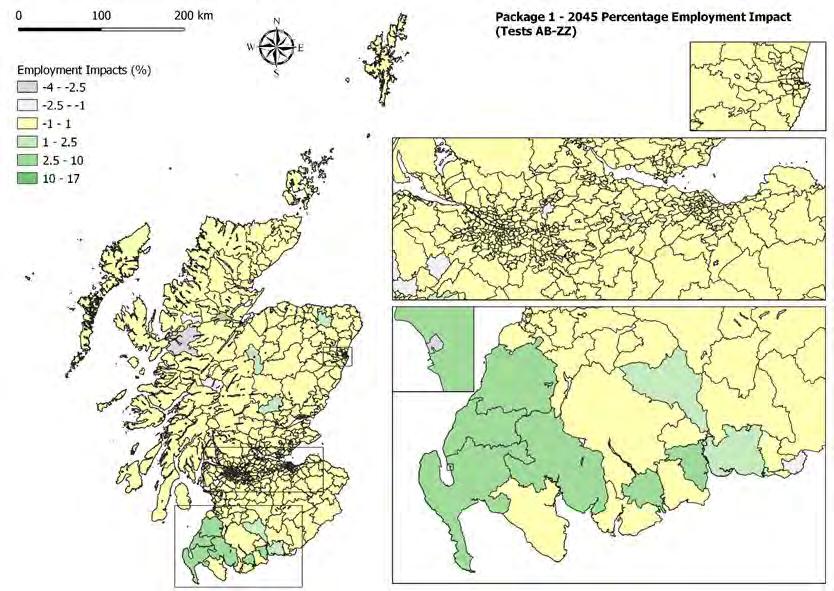
Figure 3-9 and Figure 3-10 present the absolute and percentage impact of the package 1 improvements on employment after 15 years from the opening of the rail and the implementation of the road improvements in package 1.
The convention here and in similar maps below is that gains are shown in a particular colour (in this case green, with darker shades of green for more positive percentages) whilst losses are shown in grey (with darker shades of grey for more negative percentages).
The greatest impacts on employment in 2045 are not surprisingly in Dumfries and Galloway and in South Ayrshire, i.e., the area’s most directly affected by the transport improvement s. Most of the zones in Dumfries and Galloway gain employment, there are a few zones with some small losses where jobs are locating to the neighbouring zones which have better accessibility, but overall Dumfries and Galloway gains about 800 jobs (1.2% more jobs than in the do-minimum) in different sectors and South Ayrshire gains about 122 jobs (part of which are partly displaced from East Ayrshire).
The pattern of employment location clearly shows that jobs are moving towards the zones that gain better accessibilities (Stranraer, Girvan, Ayr, and Dumfries).
The model also forecasts changes in the number, composition and incomes of households, and their responses to changing circumstances. These changes are due to:
• Changes in numbers and composition of households
• Household migration (longer-distance moves within Scotland)
• Household location (shorter -distance moves, and the local detail of longer -distance arrivals) and the housing market
• Employment status and commuting
• Incomes
• Car ownership
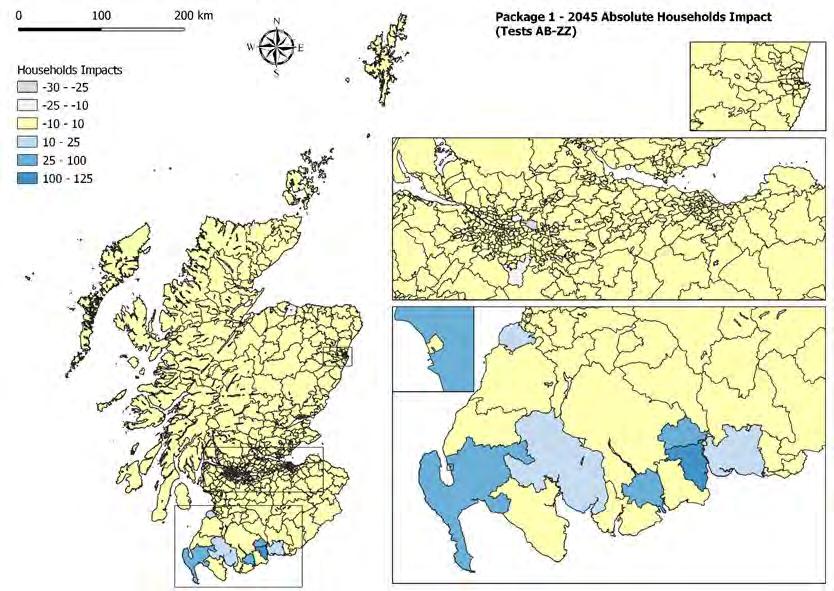
When looking at households (Figure 3-11 and Figure 3-12), the greatest impacts can be seen in Dumfries and surrounding areas, along with Stranraer. Other reductions further afield in the Highlands can be attributed to model noise. As such, the improvement impacts drive a relatively small-scale, local boost in growth in land uses.
There are much less but still significant impacts on the population and the households. Households’ location tends to follow the employment location, but the impacts are usually smaller and develop later in the time period.
Dumfries and Galloway gains about 400 extra households while the impact in South Ayrshire is marginal (the whole local authority only gains about 40 households).

Rents only change in response to changes in the balance of supply and demand. The model solution starts from the rents and vacancy rates in the previous year and calculates where the mobile and pool households will locate at those rents, and how much space each type of household will occupy in each zone. This initially produces a mismatch: households trying to occupy more space than is available in some zones and leaving space vacant in others. The model then adjusts rents, increasing them where too much space is demanded and reducing them where demand is too low. This modifies demand:
• In an inner loop, by increasing the cost of location and reducing the floorspace per household where rents are increasing, thus reducing demand, and vice versa
• In an outer loop, reducing the proportion of housing remaining vacant where rents are increasing, and vice versa
The amount of development that developers would wish to start is itself built up in two components. The first represents development by speculative investors, who consider the whole national market and choose where to build; the second represents more local deve lopment processes, including households and firms building space for their own occupation.
TELMoS focuses only on the residential development, and it should be kept in mind that these are only explicitly modelled in the fully modelled area, so results for English regions south of Dumfries and Galloway are incomplete or unavailable.
The increase in households in the two local authorities, (but mainly in Dumfries and Galloway) leads to increases in demand for residential floorspace which results in higher re nts that in turn encourage developers to provide additional floorspace more quickly.
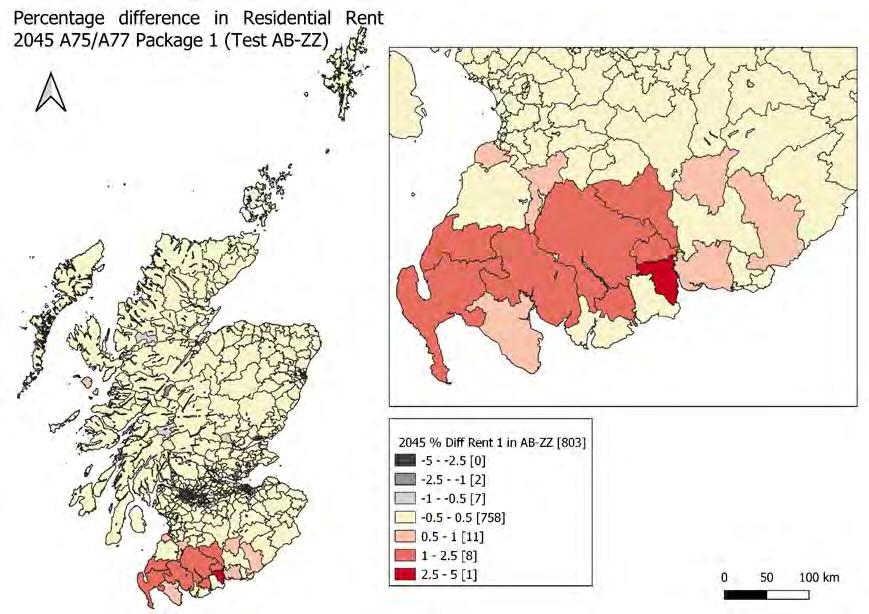
The average residential rent increases by 1% but there is some significant zonal variation where differences range between -1% and +4% (with the maximum increase in Maxwe lltown, Dumfries). As one would expect, the largest increase in rent occurs in the zones that are better connected via the improvements and especially in towns where there is a larger demand and more limited supply of floorspace.
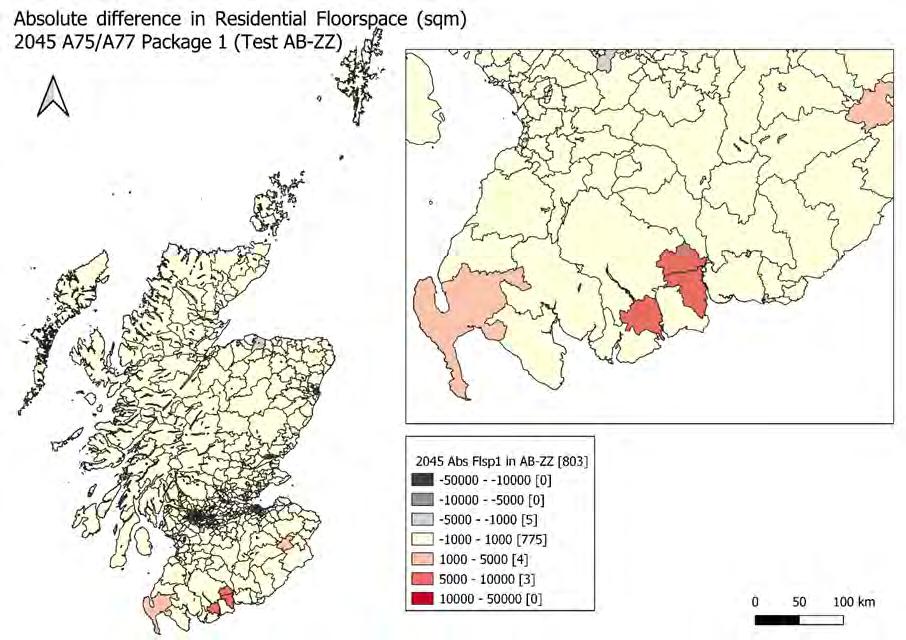
By the end of the forecast period, there are about 25,000 sqm of residential floorspace that gets developed in Dumfries and Galloway. Most of the development takes place in the last 5 years as more households move in these zones and hence the demand for floorspace increases. The de velopment though, doesn’t occur uniformly in all the zones in the local authority and it mainly takes place in Castle Douglas and in Dumfries and Stranraer as shown in Figure 3-13 to Figure 3-15
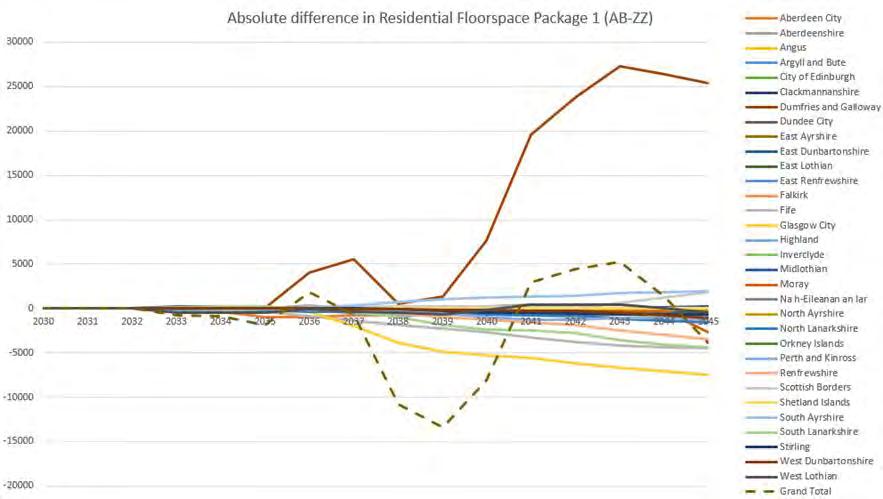 Figure 3-13: Absolute difference in residential floorspace
Economic activity can be measured in terms of employment, output and GVA. Within TELMoS18A, national growth in each of these variables is controlled to a given scenario in the base forecast
Within the model, GVA in any one year is calculated as:
• The forecast number of workers in each workplace zone, economic activity, and socio-economic level (broad occupation group), multiplied by
• Forecast GVA/worker (productivity), likewise by workplace zone, economic activity, and socioeconomic level ( SEL)
The following sections outline how each variable is forecast at zone x activity x SEL detail.
The net effects on national GVA can be summarised as follows:
• The national numbers of jobs change only as a result through multiplier effects: improved productivity (i.e., increased GVA/worker) leads to higher wages, higher incomes and higher demand which can generate additional employment (and vice versa – the effects can be negative if the interventions being tested lead to a reduction in productivity)
National average GVA/worker can vary as a result of:
• Changes in agglomeration effects, brought about by changes in “access to economic mass” (A2EM) i.e., how well jobs are connected to other jobs
• Jobs being located in more or less productive locations
Transport interventions c an affect GVA/worker both through:
• Changes in accessibility which encourage firms to locate in different places (in the do-something compared with the do-minimum) – noting that these effects may be amplified by developers providing more floorspace in respo nse to increased demand
• Changes in connectivity which modify A2EM – which is also affected by changed in job location
Changes in national GVA as a result of transport interventions therefore tend to be the net result of a complex set of effects, nearly always involving gains to some locations and losses to others. Typically, they are very small percentage changes, but these can represent significant absolute sums relative to transport investment costs.
It should be noted at this point that:
• These calculations overlap with, but differ from, those considered in STAG wider economic impacts
• Some of the assumptions underlying the model are subtly different from those underlying STAG
Employment location is modelled at two levels:
• A higher level (also known as the Regional Economic Model or REM), considering location across the 44 macrozones of Scotland
• The lower level, allocating changes in employment to individual zones within each macrozone
At the REM level, employment changes are the net effect of changes in investment by sectoral:
• Changes in transport to markets
• Changes in the size of the market for each sector in each macrozone
Changes in investment are themselves a gradual response to changes in accessibility to markets (taking account of the size of those markets) and changes in costs of production (including rents). Note that the costs of business travel are considered (for business services as well as for most manufacturing sectors) as well as the costs of delivering goods.
The distribution of jobs to zones within each macrozone is influenced by the previous numbers of that activity in that zone. The default is that in any one year, each activity will grow or decline by the same proportion in each zone of the macrozone. For most activities, this default assumption is then modified by:
• Changes in accessibility
• Changes in the amount of floorspace available
• Changes in the cost of occupying that floorspace, i.e., changes in rent modified by any changes in the floorspace occupied per worker
The supply of floorspace in a zone may change over time as a result of a transport intervention, if the effect on accessibility is to increase demand to locate in the zone, and the resulting increases in rent make development more viability, and if planning policy allows additional floorspace to be built in that zone at that time.
The GVA/worker by zone, employment activity and SEL is calculated as the product of:
• An average for each employment activity and SEL, defined i n the Base Test economic scenario
• A differential effect due to access to economic mass (A2EM)
• A residual differential effect
The A2EM effect is very similar to that in STAG i.e., GVA/worker is assumed to be elasticity with respect to the A2EM measure of accessibility, which takes account of:
• Where jobs are located
• How easily they can be reached from the zone whose a2em is being measured
• Note that the a2em calculations in telmos18a take account of active modes as well as motorized travel
By default, within TELMoS18A, jobs that locate in a zone would take on the average GVA/worker of the zone (for the employment activity and SEL in question) ,. Redistributing jobs from low-productivity locations to highproductivity ones would therefore give a simple increase in productivity. This reflects one view of how spatial effects in productivity work. The opposite view is that there is a fixed distribution of productivity across the individuals in the workforce, and that redistribution jobs (and, implicitly, the indivi duals filling those jobs) will change local productivity but not national productivity.
The DELTA software used to run TELMoS18A allows for this range of views. The residual effect in the GVA/worker calculation may be adjusted to modify the effect of jobs being relocated. At one end of the possible scale of adjustment, the residual differential is adjusted so that there is no change in average GVA/worker except that due to A2EM effects (representing a situation in there is a strictly given distribution of GVA/worker values, fixed except for A2EM effects). At the other end of the scale, there is no adjustment of the residual term: relocation of jobs results in workers taking on the productivity of the zone into which they move (comparable to the existing TAG “moves to more productive jobs” effect in English appraisal of wider impacts). The position on this scale is determined by an input coefficient (with a range of 0 to 1) which may differ across employment activities. This coefficient is currently set to 0. 5 for all activities, implying that to some limited extent workers do take on the productivity of the zone the work in.
Whatever the position on that scale, an alternative test may produce a higher or lower average GVA/worker.
Table 3-2 shows the results in terms of the variables here described by local authorities
Dumfries and Galloway shows the largest increase in GVA which mainly results from the increase in the number of jobs (from the table below it is clear that the GVA per worker doesn’t increase in Dumfries and Galloway and all the increase in GVA derives from the almost 800 extra jobs).
Small positive percentage increase in GVA are observed also in North an d South Ayrshire (mainly at the expenses of East Ayrshire which sees about 90 jobs moving away).
The impacts in the other local authorities far from the improvements are due to the noise in the models shown in the accessibility analysis which brought to ho useholds and jobs movements in these local authorities
This chapter presents the land use impacts of the transport improvements included in package 3 in terms of employment, households, rents, floorspace and GVA. The land use changes driven by the package 3 costs (and hence the new accessibilities) are shown in 2045
Like the presentation of the results in package 1, only costs and accessibility analysis for commuting for workers belonging to SEL2 will be shown.
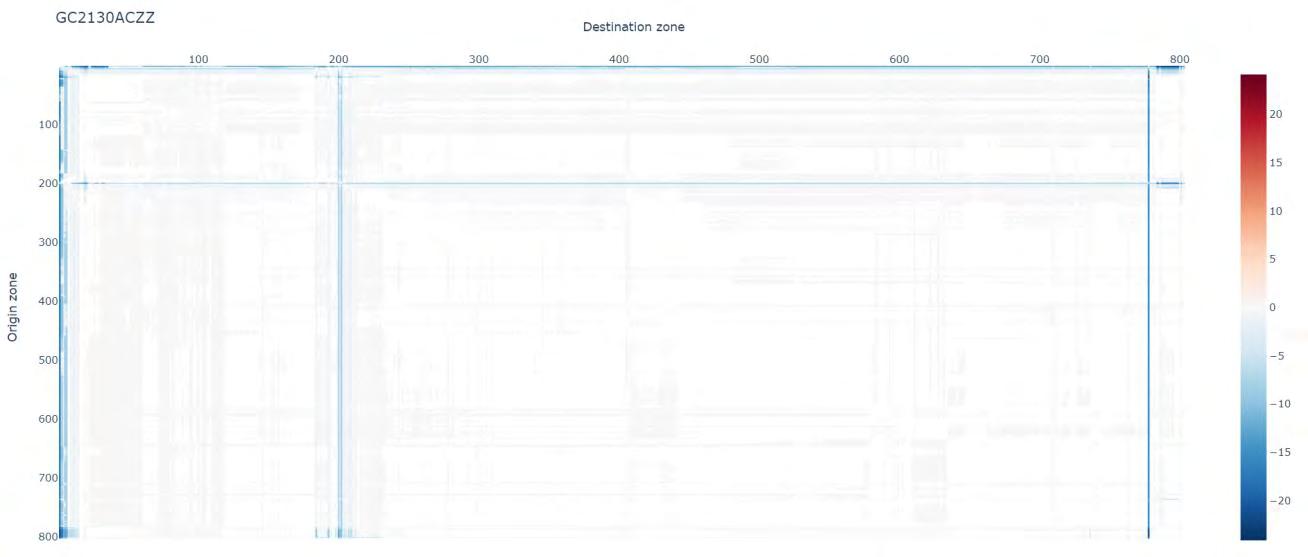
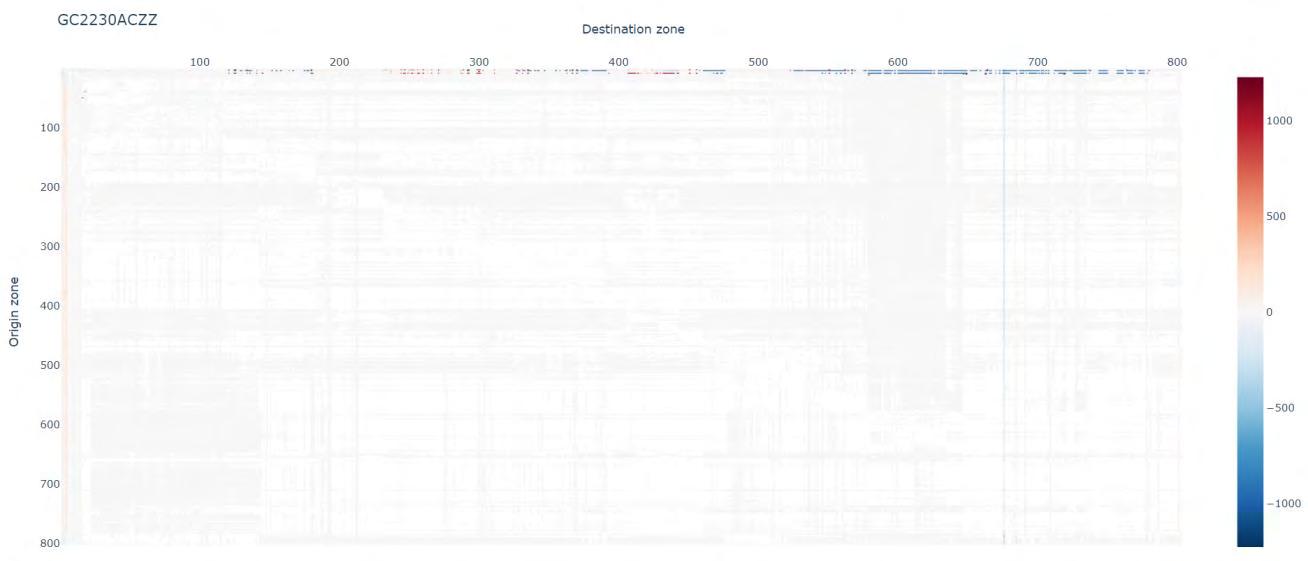
The two heat maps below ( Figure 3-16 and Figure 3-17) show the absolute difference in generalised costs between the package 3 test and the do-minimum for commuting between each origin/destination pair and for each mode. The difference in costs coming from road improvements ranges between +/ -20 generalised minutes (more than double the changes seen in package 1, which is what would be expected being package 3 the most comprehensive package out of the four being presenting).
The changes in cost originated by the public transport improvements are much larger than the one for the car mode. This is to be expected due to the large size of rail network improvements
In both graphs, it is evident that the most prominent improvements occur in the Dumfries and Galloway and South Ayrshire as one would expect
Figure 3-18 to Figure 3-20 show the impacts of the improvements included in package 3 in terms of accessibility. As mentioned before, the accessibility measures combine land use data with transport data The maps presented below show the absolute impact of package 3 on accessibility to workplace for workers belonging to SEL2 for each car-ownership level.
The convention used in the maps is that negatives represent an improvement in accessibility, and they are represented in a scale of red. Worsening in accessibility is represented by a positive number and a scale of grey colours. The darker the colour is, the higher the difference in accessibility between the package and the do-minimum test is.
Dumfries and Galloway shows the largest improvement in accessibility with the largest impact occurring in Newton Stewart and St Johns Town. Small impacts far from the study area (such as in the central belt and south east of Edinburgh) are due to noise in the models and can be disregarded.
In package 3 accessibility is much higher than that seen in package 1, and this is due to the A75 and A77 dualling improvements that are included in this package and that increases the positive impact on carowners.
While the very positive impact on accessibility for non -car owners is localised to a few zones (mainly in Dumfries, Newton Stewart, St. John’s, and Kirkcudbright), the additional road improvements that are included in the package, contribute to accessibility improvements for car -owners on a wider geographical scale (involving most of the Dumfries and Galloway as well as South Ayrshire).
Figure 3-17: Absolute change in public transport commuting generalised costs (Package 3 – Do-minimum)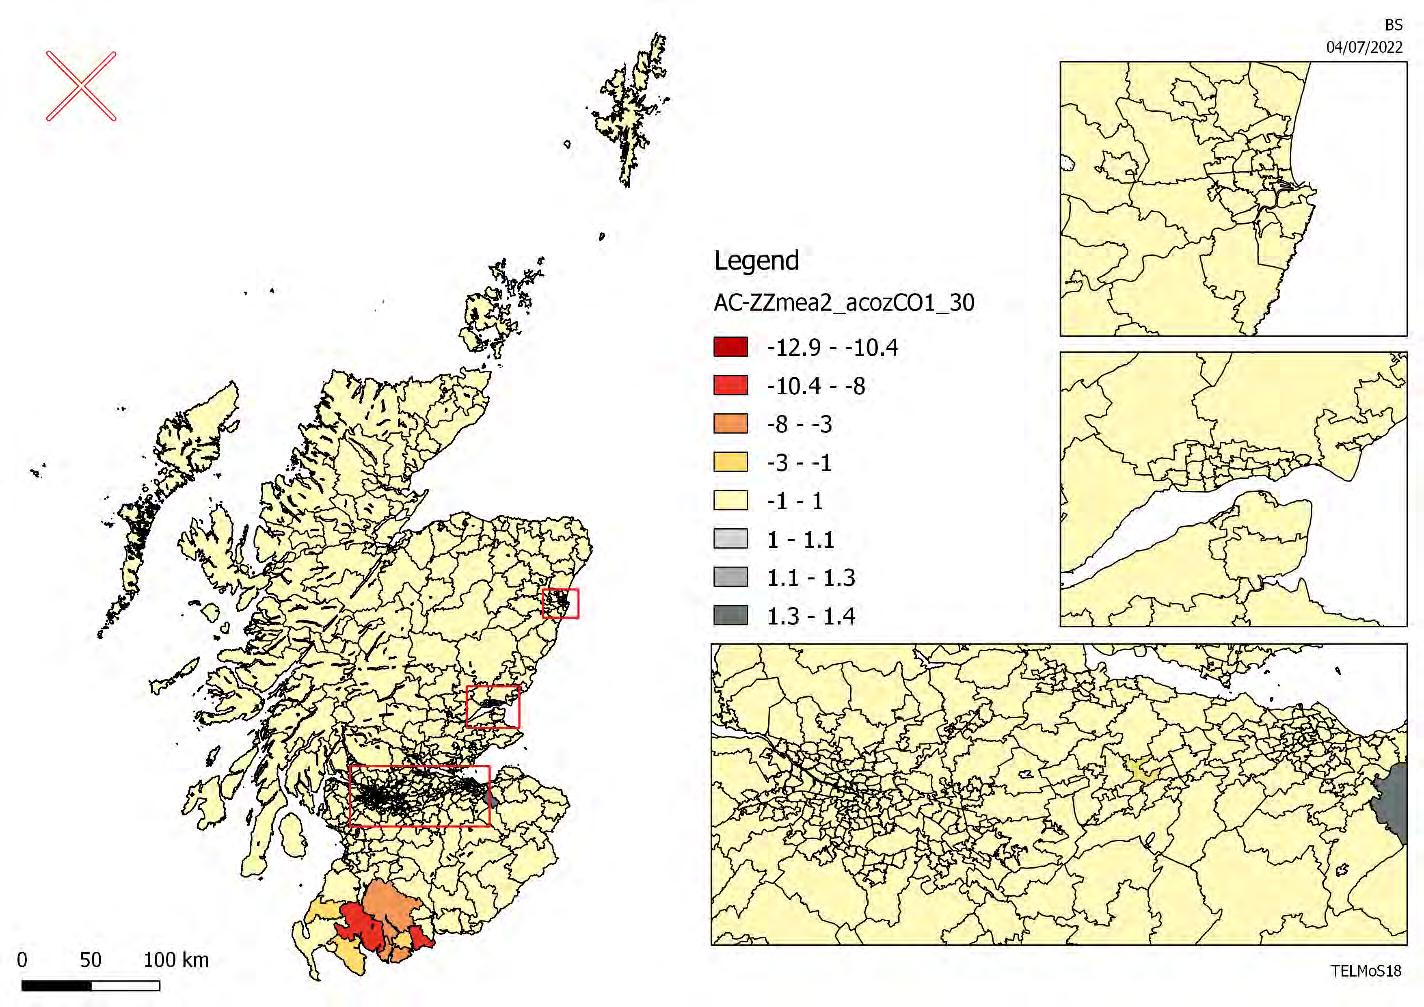
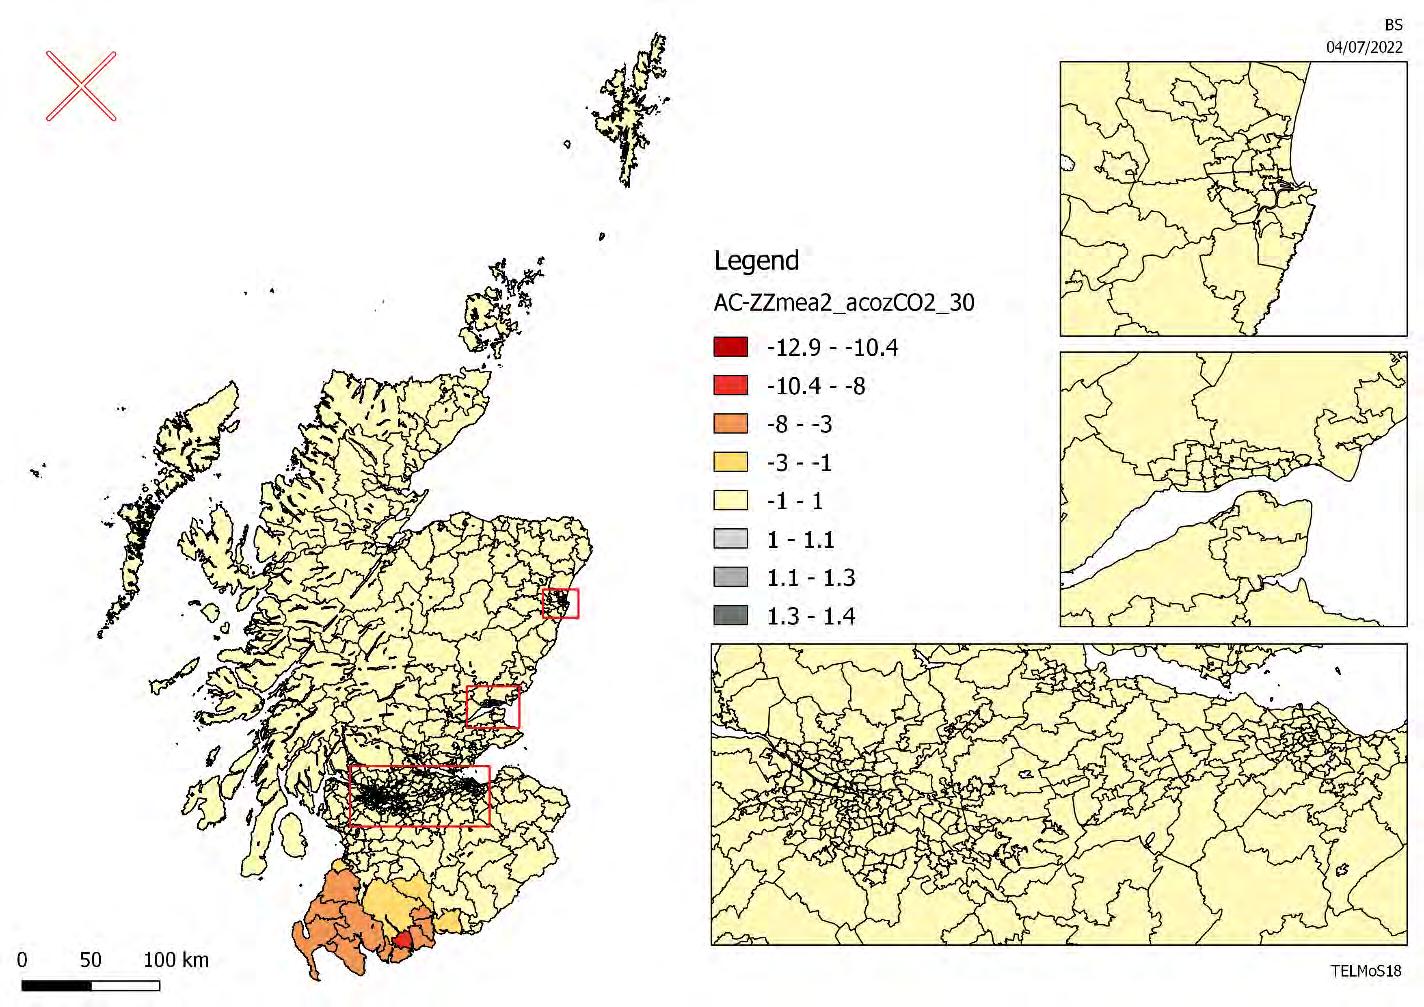
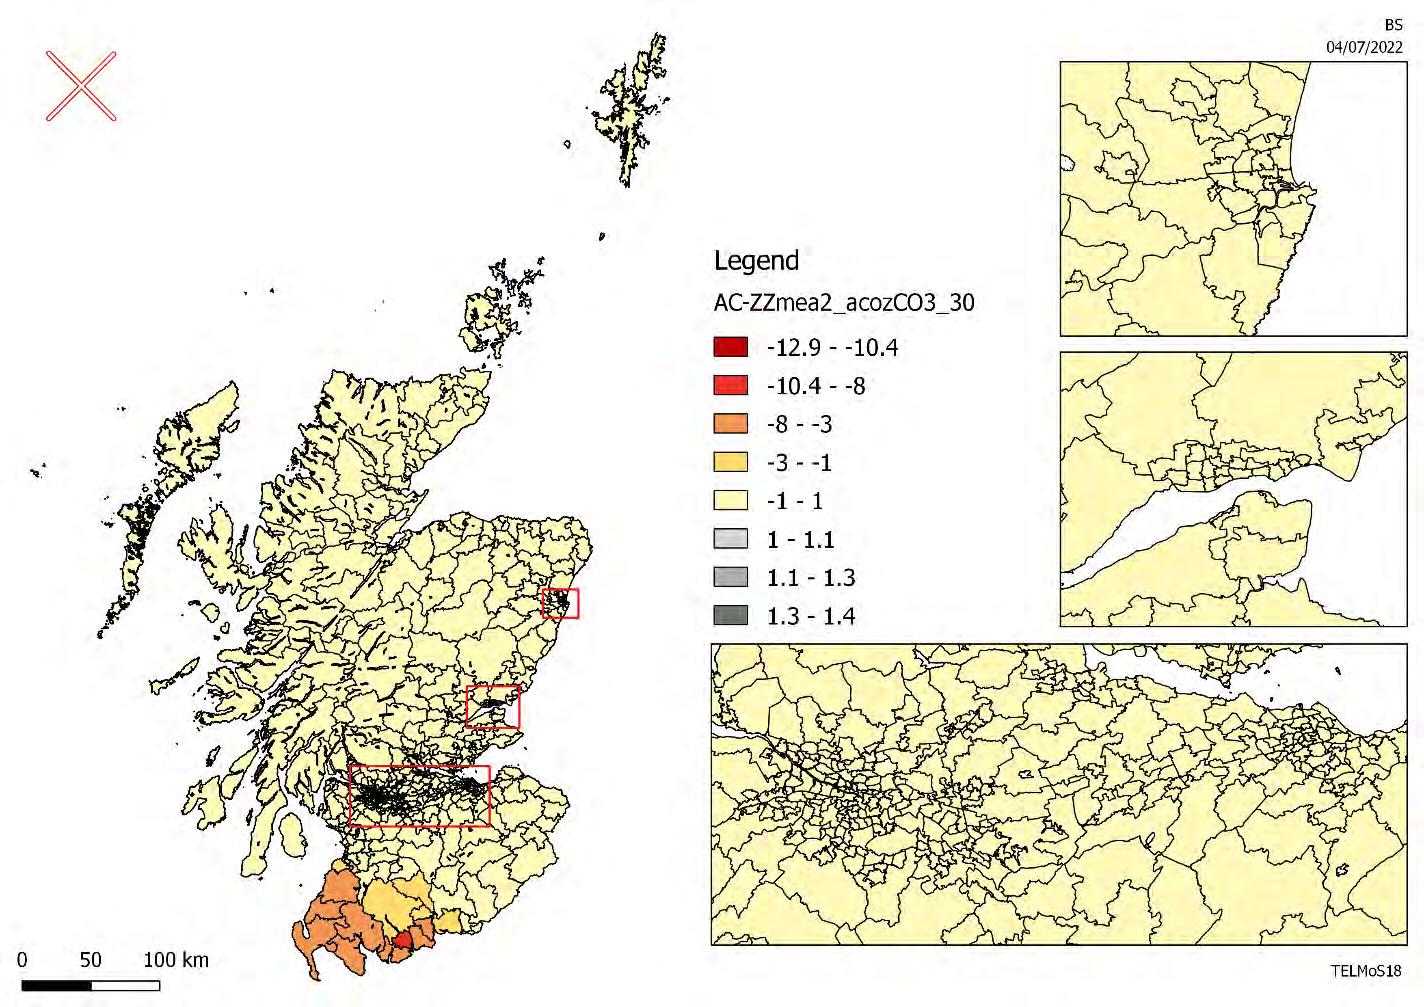
Figure 3-21 to Figure 3-23 show an alternative method to visualize the same measure of accessibility. Each colour in the graph represents a local authority and this tool shows that the largest changes in accessibility occur in the local authorities where the package 3 improvements are being delivered (Dumfries and Galloway and the Ayrshires) and it also shows that there are some unexpected changes in accessibility in other local authorities far from the study area, which are due to noise in the model.
 Figure 3-21: Absolute difference in accessibility to the workplace for SEL2 workers – no cars

 Figure 3-22: Absolute difference in accessibility to the workplace for SEL2 workers – 1 car
Figure 3-23: Absolute difference in accessibility to the workplace for SEL2 workers – 2+ cars
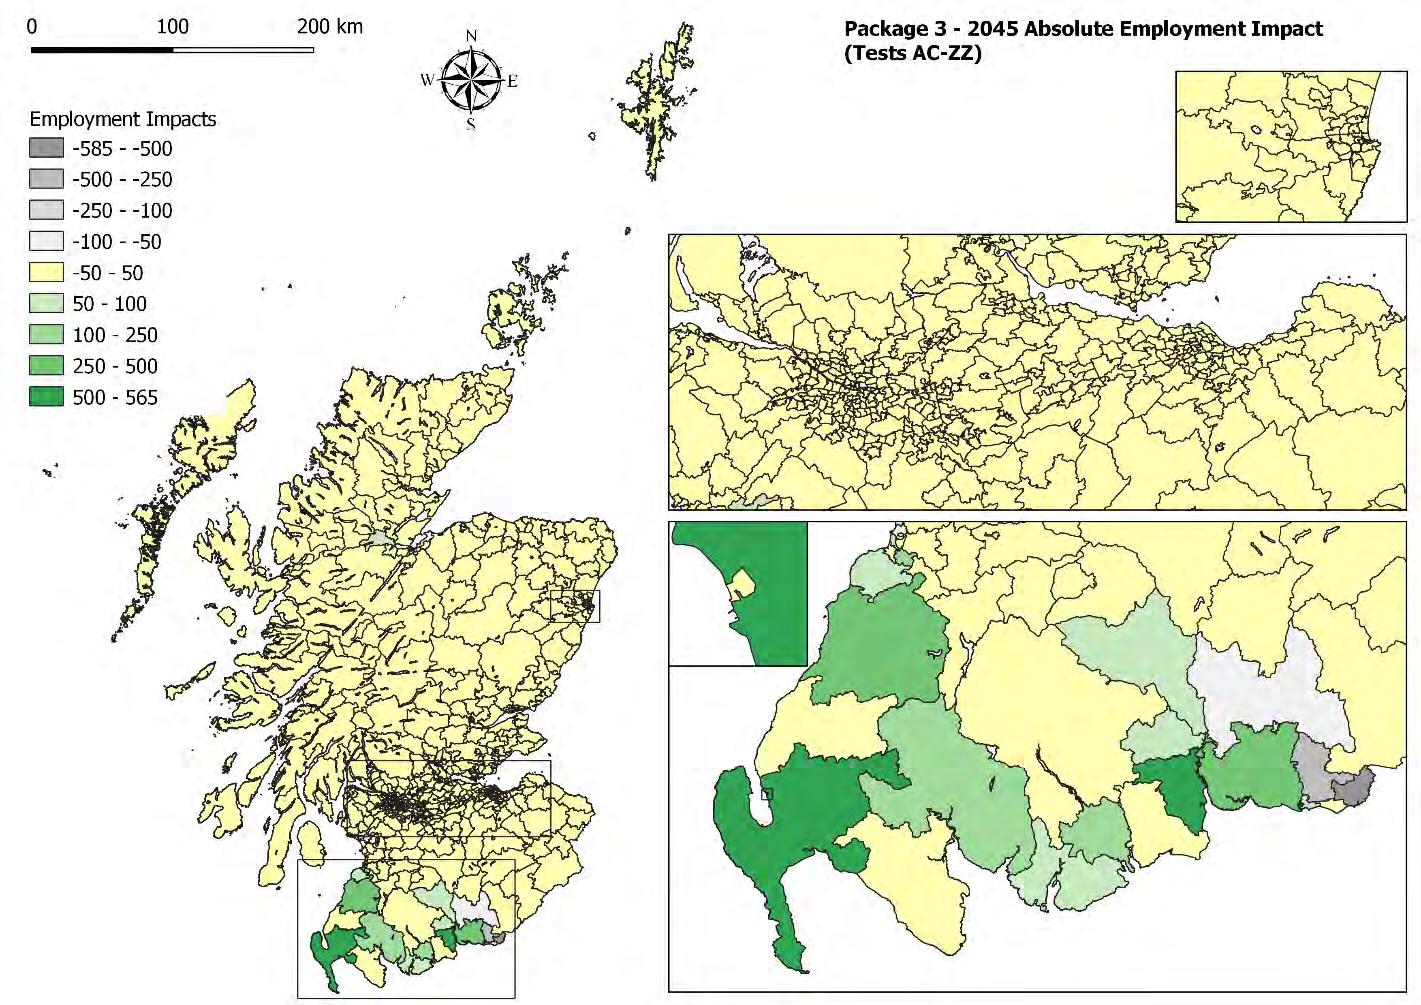
Figure 3-24 and Figure 3-25 present the absolute and percentage impact of the improvements included in package 3 on employment after 15 years from the opening of the rail and the implementation of the A75/A77 improvements included in the package.
The convention here and in similar maps below is that gains are shown in a particular colour (in this case green, with darker shades of green for more positive percentages) whilst losses are shown in grey (with darker shades of grey for more negative percentages).
The greatest impacts on employment in 20 45 are not surprisingly in Dumfries and Galloway and in South Ayrshire, i.e., the area’s most directly affected by the transport improvement. Most of the zones in Dumfries and Galloway gain employment, there are a few zones with some small losses where jobs are locating to the neighbouring zones which have better accessibility.
The location of employment is very much in line with what ha s already been illustrated for package 1, but the geographical scale and the figures are larger, especially for the three Ayrshire local authorities
Overall Dumfries and Galloway gains about 1,500 jobs (2.4% more jobs than in the do-minimum) in different sectors and the South Ayrshire gains about 550 jobs (1.2% more). The impact is almost double tha t of package 1.
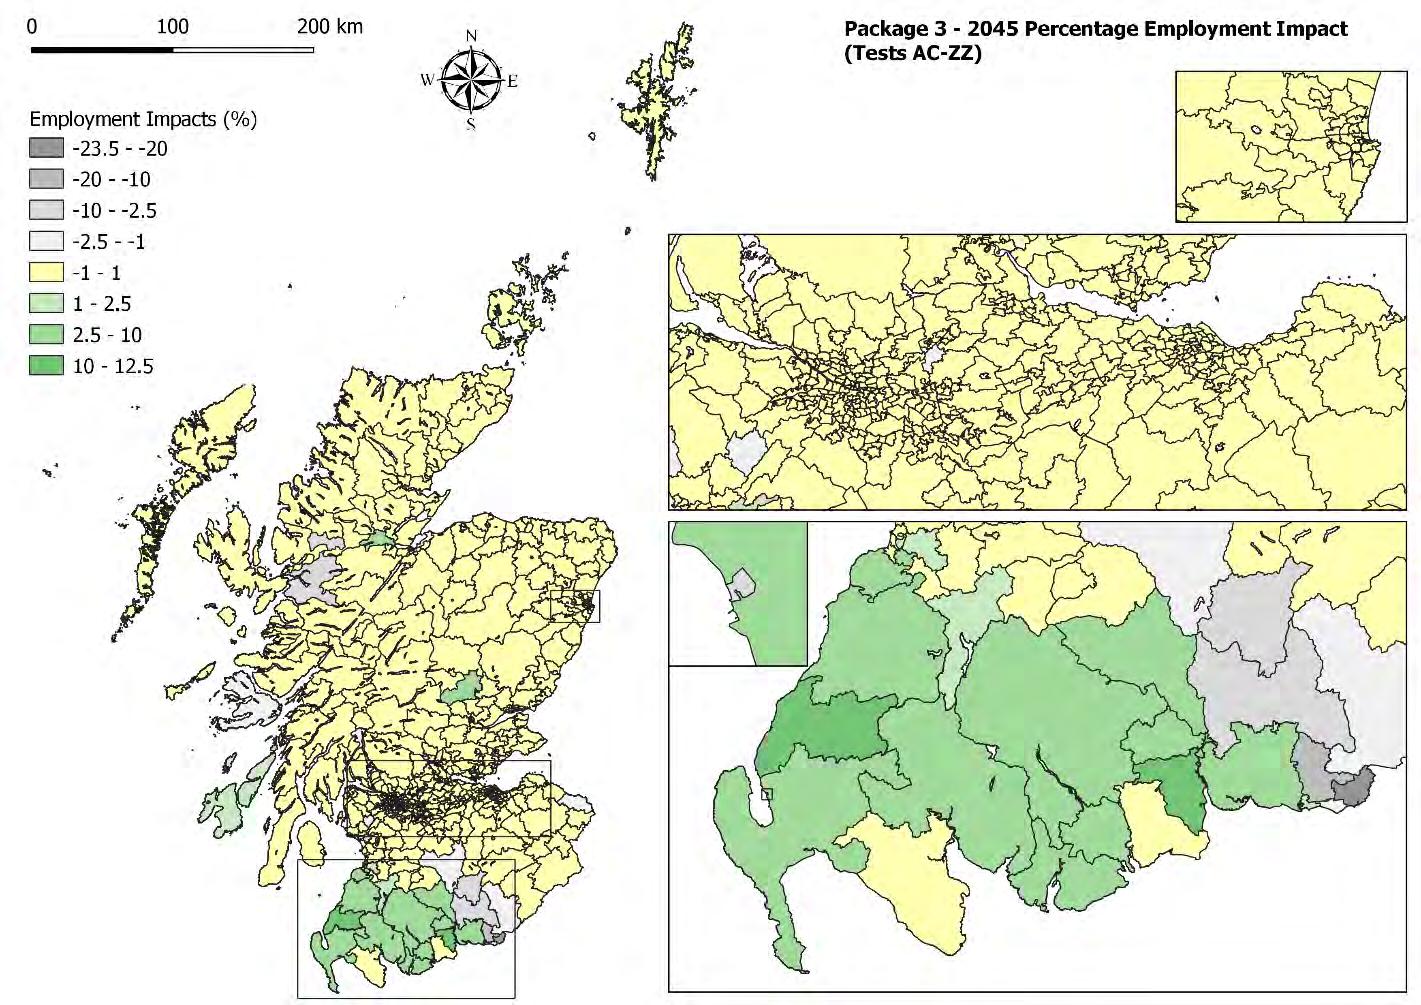
When looking at households, the impacts are larger and much more distributed among the Dumfries and Galloway and South Ayrshire zones in comparison to package 1.
The largest impacts are still show in Dumfries and surrounding areas, along with Stranraer and Ayr The reduction in households further afield in the Glasgow and Edinburgh can be attributed to model noise. The impacts on households and population are less than the impact on employment but they are still significant
Overall Dumfries and Galloway gains about 850 households in different sectors and the Ayrshires all together gain about 350 households.
Likewise, what was happening in package 1, households locate to Dumfries, Stranraer, Ayr, but households are also locating in all of the zones west of Dumfries and south of Ayr as result of the dualling of the A75 and A77.
Figure 3-26 and Figure 3-27 show that for package 3, with full dualling for the A75 and A77 in place, positive impacts in the vicinity of the A75 and A77 corridors, and negative impacts to the east of Dumfries for both households and employment. The impacts seen here suggest growth shifts along the A75 and A77 corridors – northeast to southwest and east to west, respectively . One would expect, given the nature of the scenario, an impact on land uses south of the border with England – though these are not quantifiable in TELMoS18A.
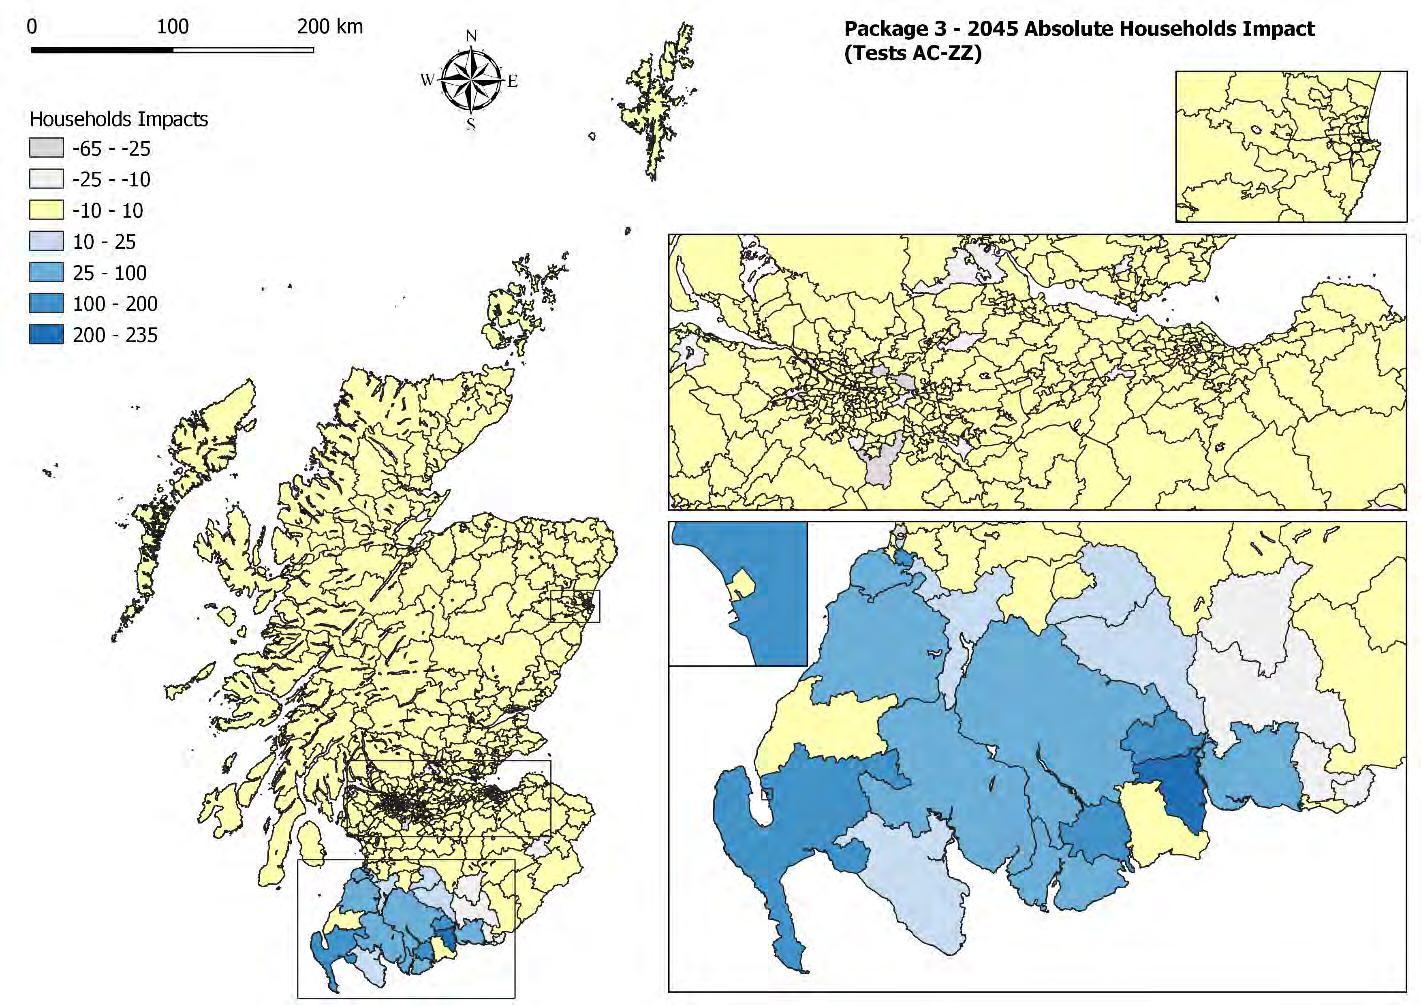

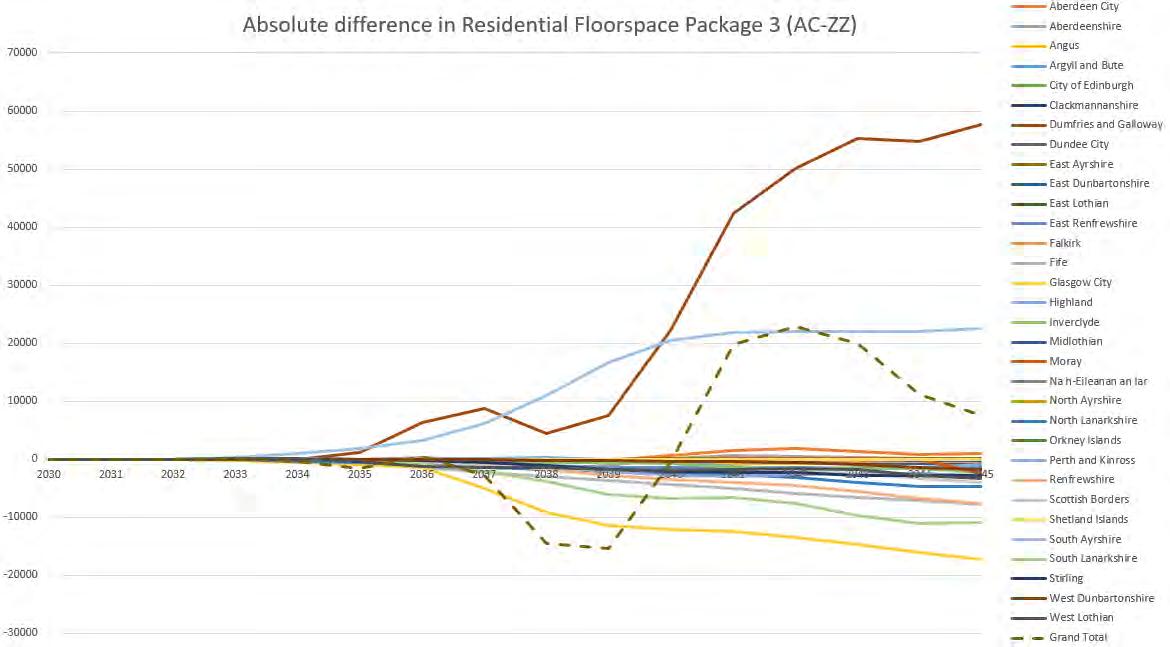
The increase in households in the two local authorities leads to increases in demand for residential floorspace which results in higher rents that in turn encourage developers to provide additional floorspace more quickly as shown in Figure 3-28 to Figure 3-30
The impacts of the package 3 improvements on residential rents is larger than what is seen in package 1 and once again, the impact in South Ayrshire is larger with the introduction of the road dualling improvements.
The average residential rent increases by 1% but there is some significant zonal variation where differences range between -5% and +6% (with the maximum increase in Newtonairds). Some significant changes in residential rent can also be seen in South Ayrshire with th e largest percentage increase occurring in Barrhill and Maybole.
By the end of the forecast period, there are about 22,500sqm of residential floorspace that gets developed in South Ayrshire and about 58,000sqm in Dumfries and Galloway. Most of the development takes place in the last 5 years as more households move in these zones and hence the demand for floorspace increases. The development though, doesn’t occur uniformly in all the zones and it mainly takes place in Castle Douglas , Dumfries and Stranraer in Dumfries and Galloway and in Glenparks, Maybole and Girvan in South Ayrshire.
The extra residential floorspace developed in South Ayrshire and Dumfries and Galloway results in less development occurring in Glasgow, Renfrewshire, and South Lanarkshire, bu t there is also an overall gain for the whole of Scotland due to the improvements implemented.
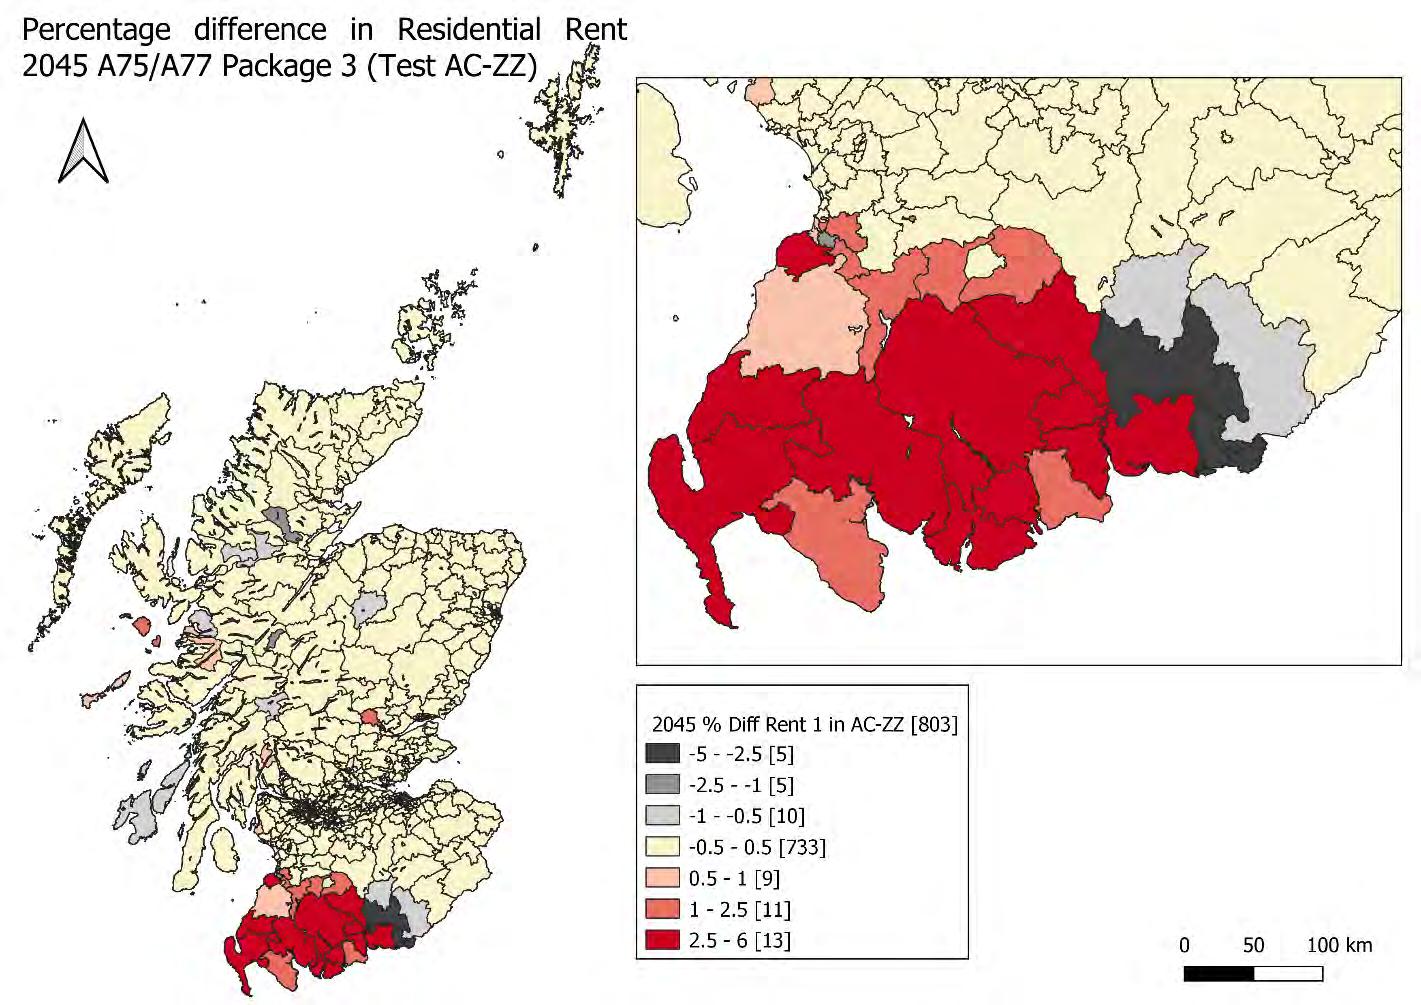
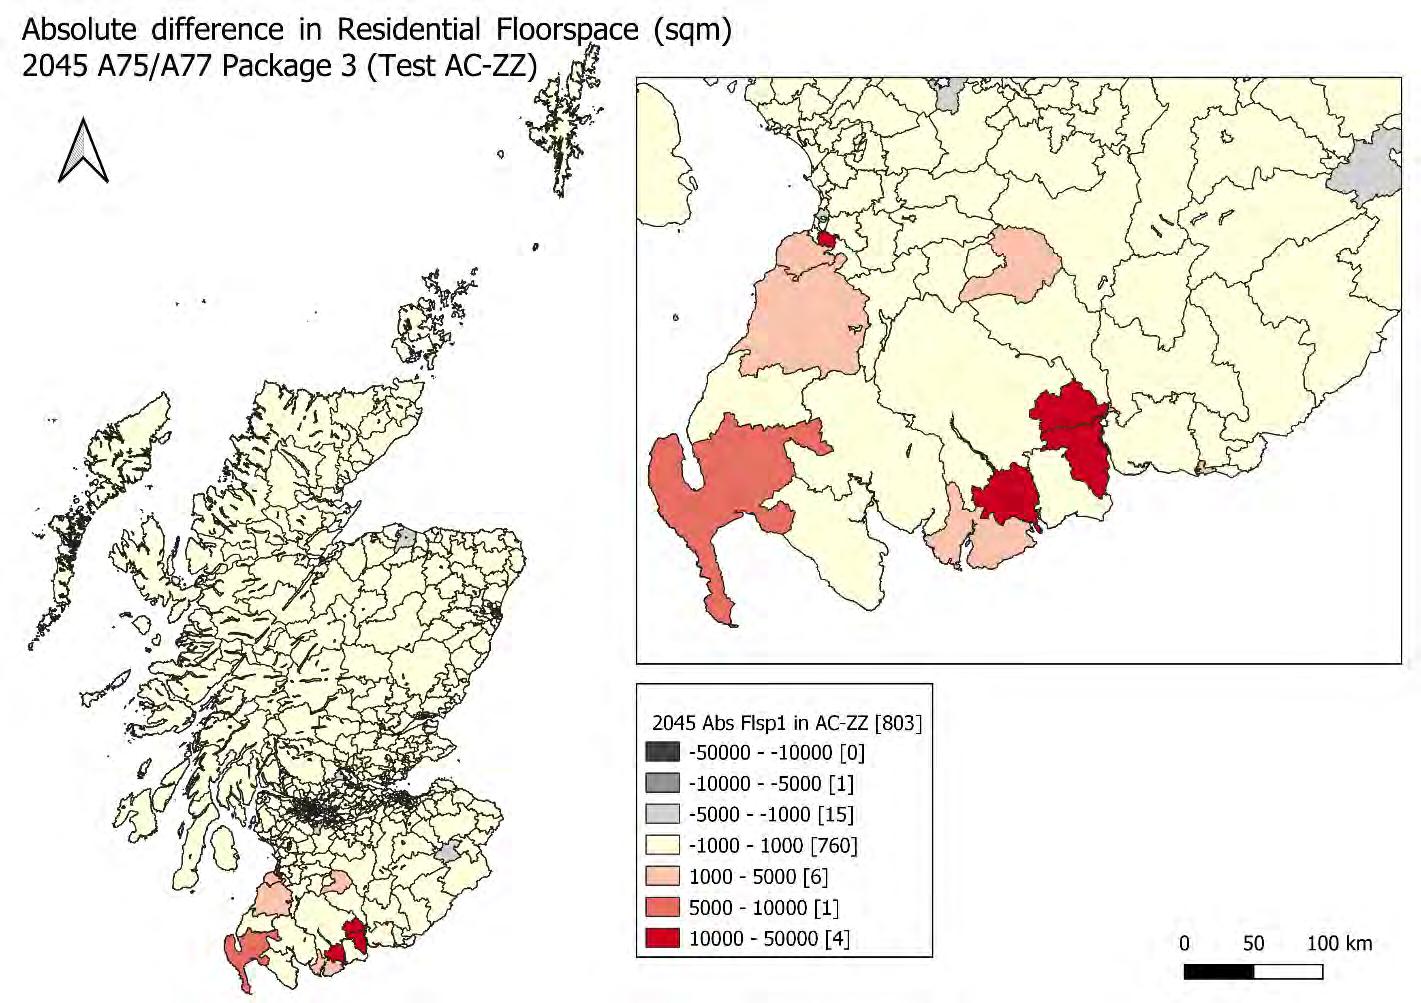
Table 3-3 shows the results in terms of GVA, GVA per worker and employment by local authority
The impacts in terms of GVA and employment in Dumfries and Galloway and in South Ayrshire in package 3 are much larger than the ones seen in package 1.
Dumfries and Galloway shows the largest percentage increase in GVA (1.7%) which mainly results from the increase in the number of jobs . From the table below it is clear that the GVA per worker doesn’t increase in Dumfries and Galloway and all the increase in GVA derives from the 1 ,500 extra jobs.
South Ayrshire shows a smaller but still significant percentage increase in GVA in 2045 (about 0.7%) which is mainly due to the 550 extra jobs that the package 3 improvements bring to the local authority
Small positive percentage increase in GVA are observed also in North Ayrshire (most likely at the expenses of East Ayrshire that loses about 50 jobs).
The impacts in the other local authorities far from the improvements are due to the noise in the models shown in the accessibility analysis which brought to households and jobs movements in these Local Authorities.
This chapter presents the land use impacts of the transport improvements included in package 6 in terms of employment, households, rents, floorspace and GVA. The land use changes driven by the package 6 costs (and hence the new accessibilities) are shown in 2045
Like the presentation of the results in the previous chapters, only costs and accessibility analysis for commuting for workers belonging to SEL2 will be shown.
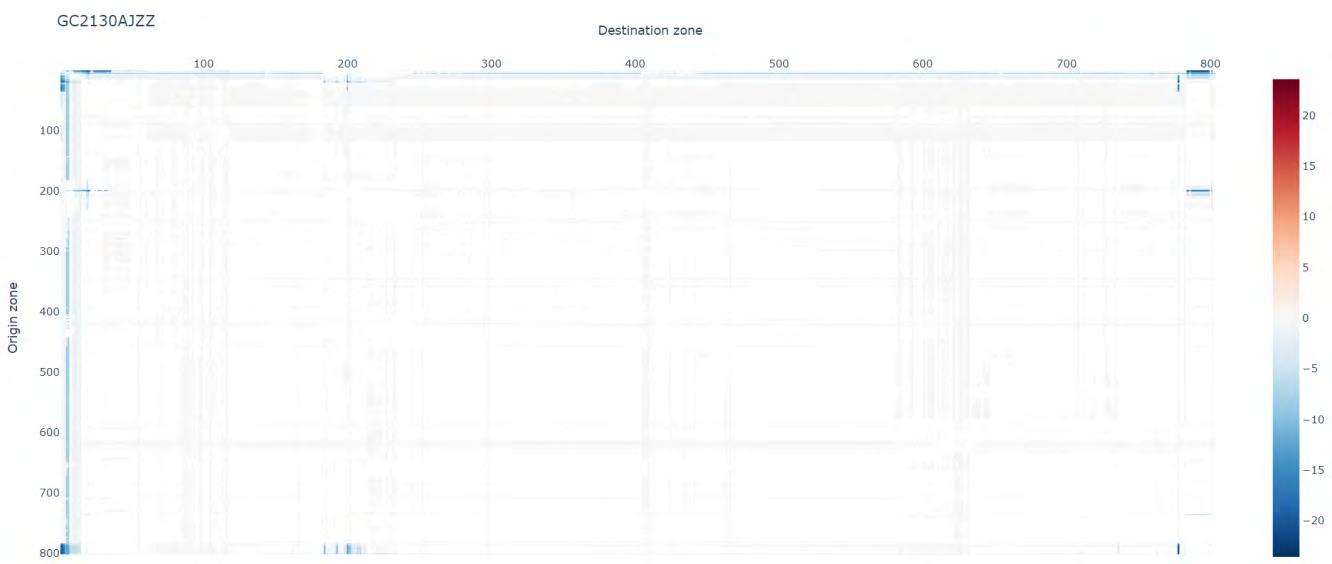
Figure 3-31 and Figure 3-32 below show the absolute difference in generalis ed costs between the package 6 test and the do-minimum test for commuting between each origin/destination pair and for each mode. The difference in costs coming from road improvements ranges between +/ -20 generalised minutes (more than double the changes seen in package 1, which is what would be expected since the latter doesn’t include the dualling of the A75).
The changes in cost originated by the public transport improvements are much larger than the one for the car mode. This is to be expected due to the large size of rail network improvements
In both graphs, it is evident that the most prominent improvements occur in Dumfries and Galloway and South Ayrshire as one would expect
Figure 3-33 to Figure 3-35 show the impacts of the improvements included in package 6 in terms of accessibility. As mentioned before, the accessibility measures combine land use data with transport data. The maps presented below show the absolute impact of package 6 on accessibility to workplace for workers belonging to SEL2 for each car-ownership level.
The convention used in the maps is that negatives represent an improvement in accessibility, and they are represented in a scale of red. Worsening accessibility is represented by a positive number and a scale of grey colours. The darker the colour is, the higher the difference in accessibility between the package and the do-minimum test is.
As one would expect, Dumfries and Galloway shows the largest improvements in accessibility with the largest impact occurring in Newton Stewart, Castle Douglas, Kirkcudbright, and St Johns Town. Small impacts far from the study area (such as in the central belt and south east of Edinburgh) are due to noise in the models and can be disregarded.
In package 6 accessibility is higher than that of package 1 (but obviously lower than package 3), and this is due to the A75 dualling improvements that is included in this package and that increase s the positive impact on car-owners.
While the very positive impact on accessibility for non -car owners is localised to a few zones (mainly in Dumfries, Newton Stewart, St. John’s and Kirkcudbright), the additional road improvements that are included in the package (A75 dualling), contributes to accessibility improvements for car-owners on a wider geographical scale (involving more zones along the A75 corridor).
 Figure 3-32: Absolute change in public transport commuting generalised costs (Package 6 – Do-minimum)
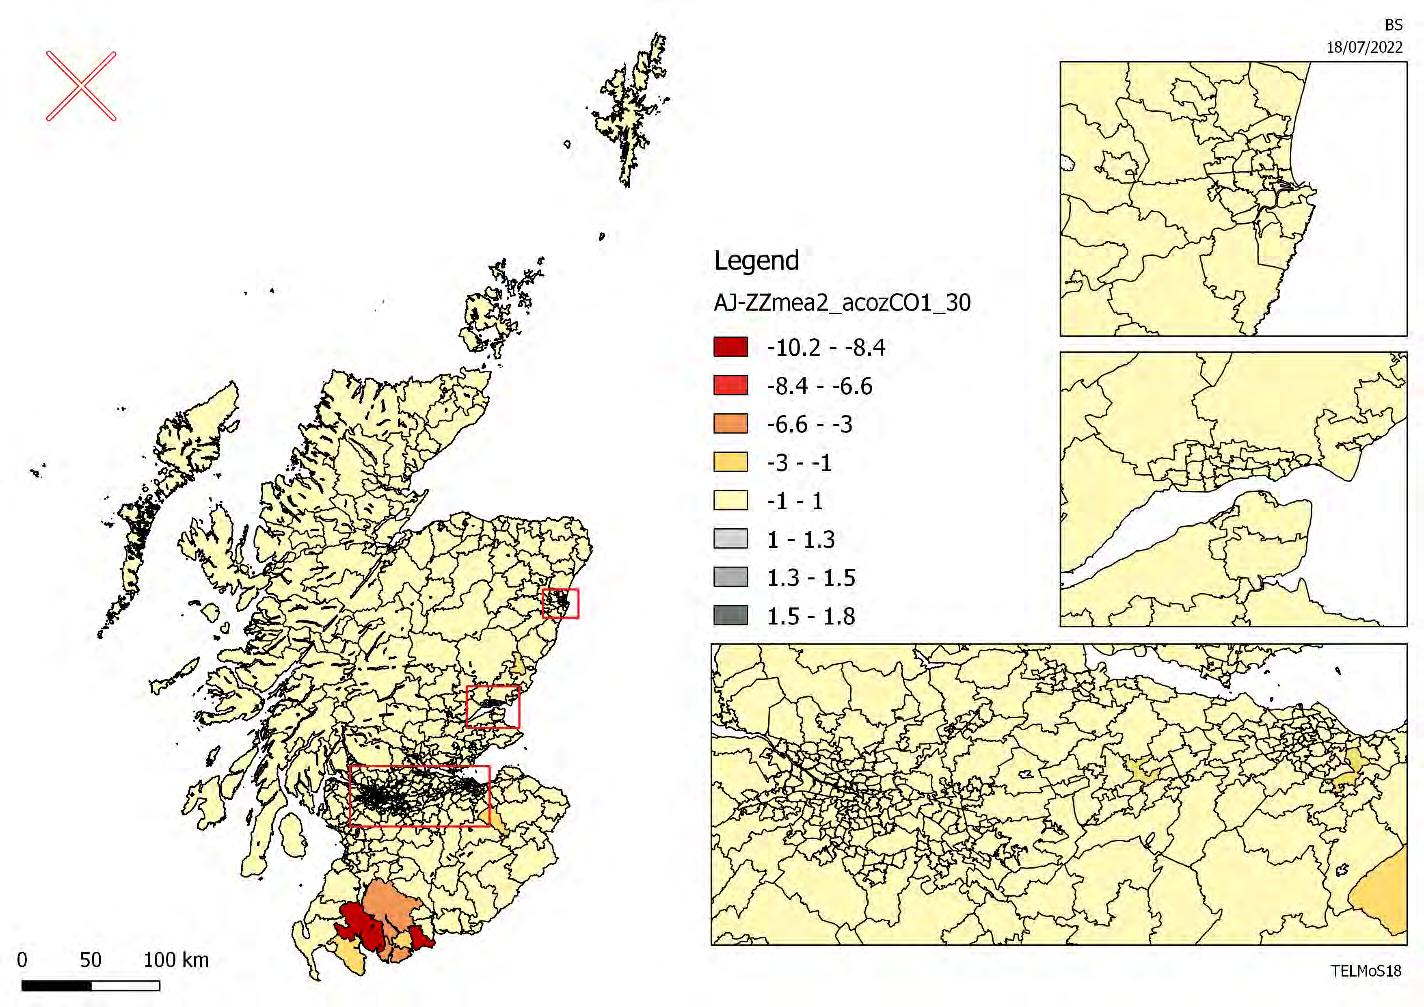
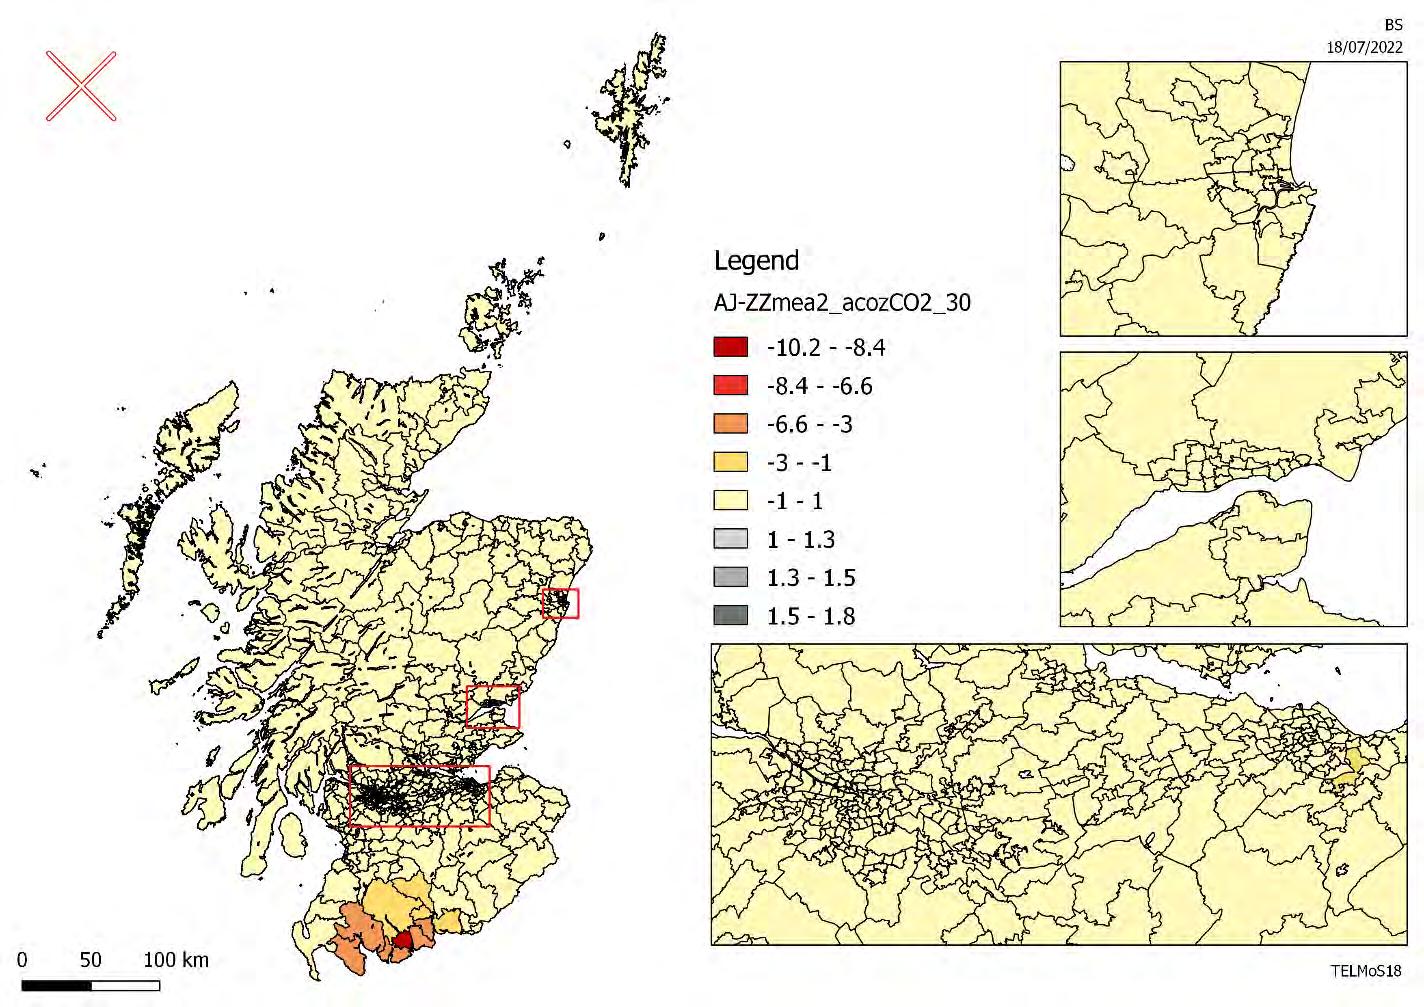
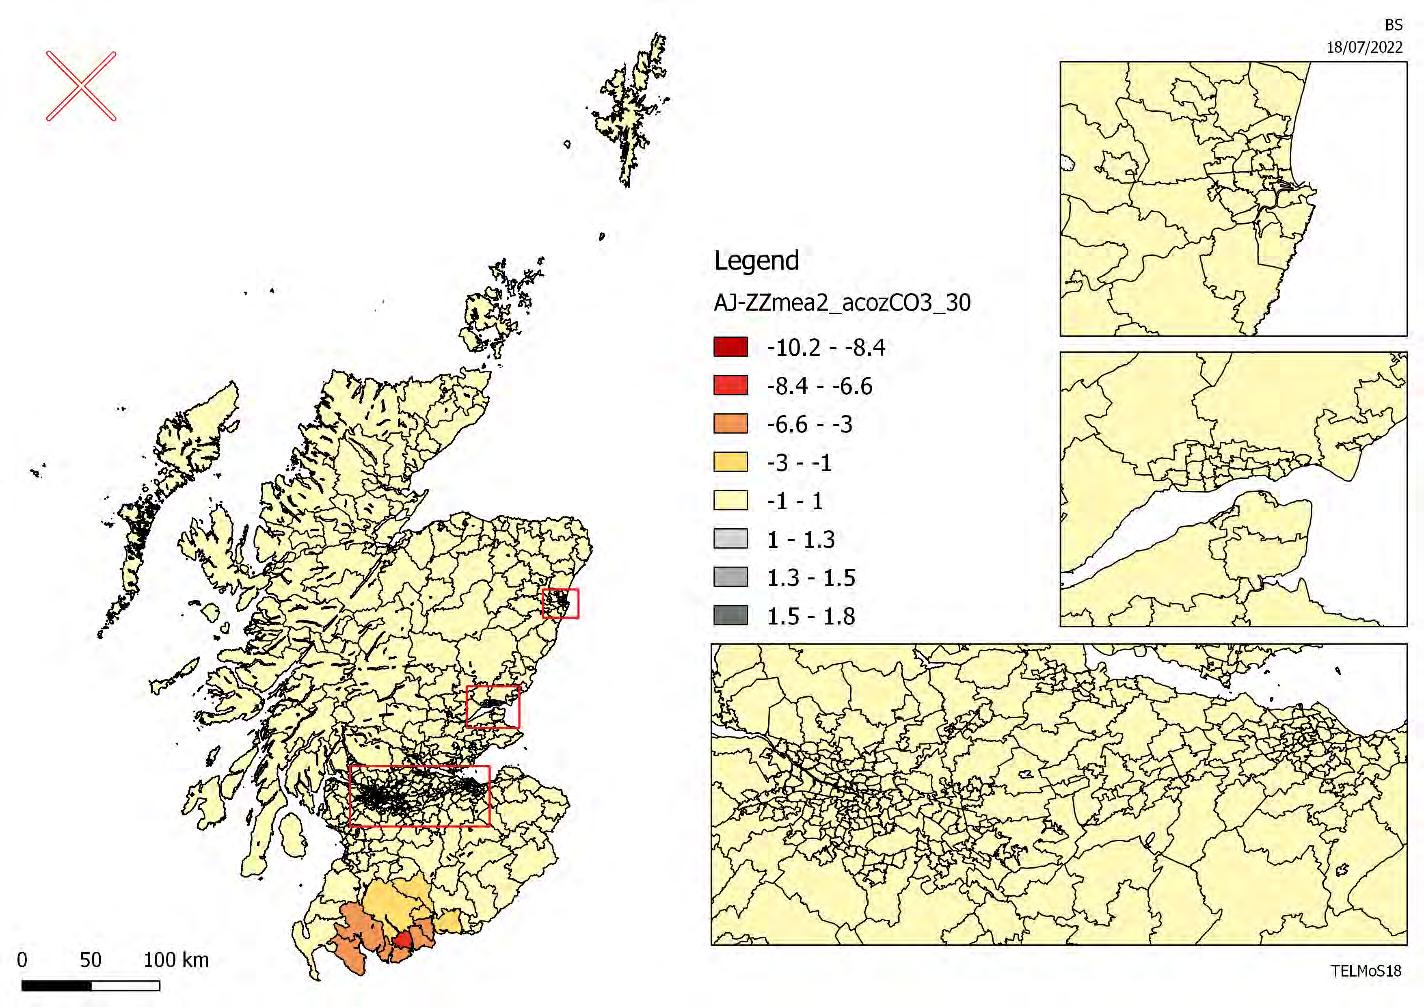
Figure 3-36 to Figure 3-38 show an alternative method to visualize the same measure of accessibility. Each colour in the graph represents a local authority and this tool shows the largest changes in accessibility occur in Dumfries and Galloway where the improvements in package 6 are being delivered and it also shows that there are some unexpected changes in accessibil ity far from the study area, which are due to noise in the model.
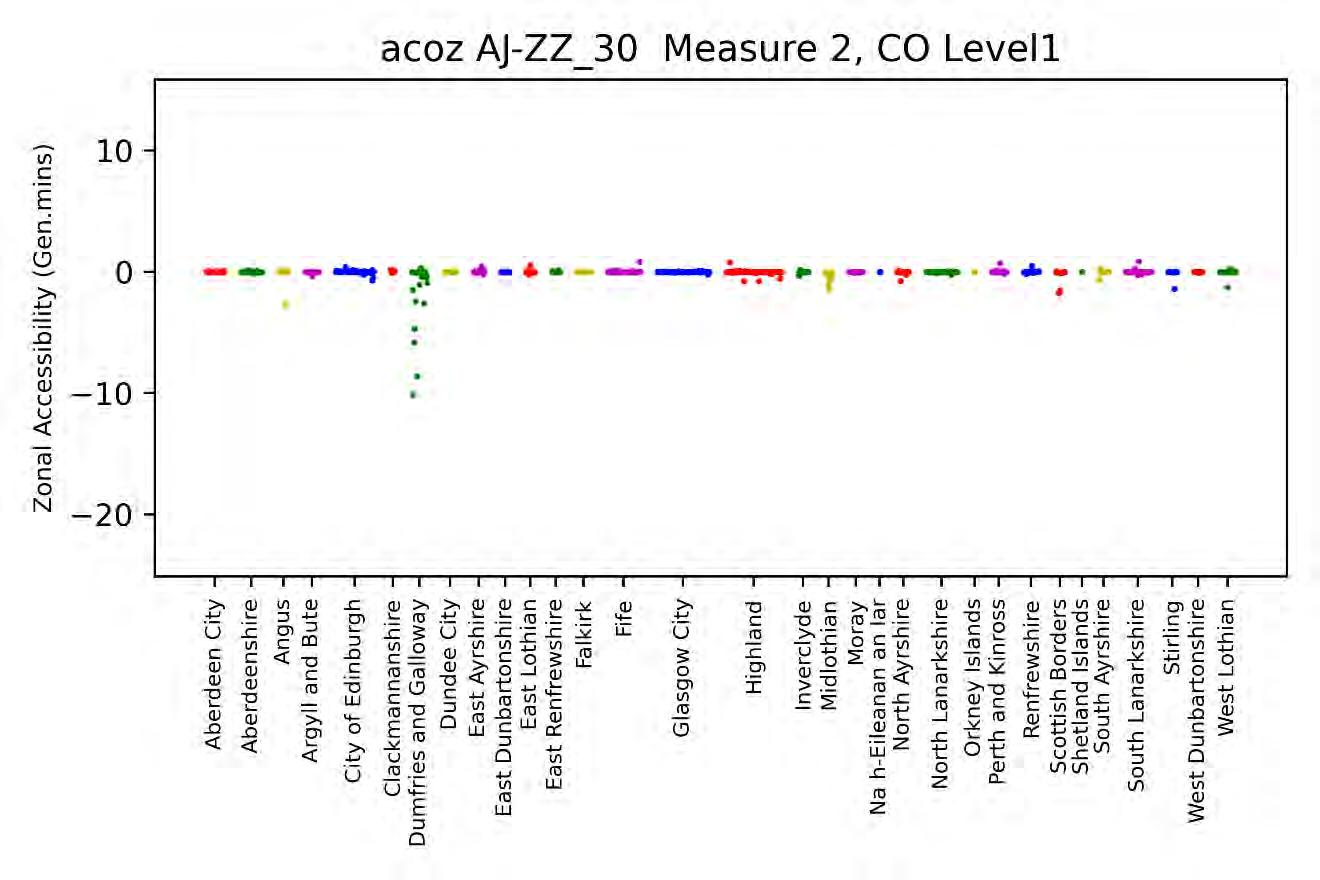 Figure 3-36: Absolute difference in accessibility to the workplace for SEL2 workers – no cars

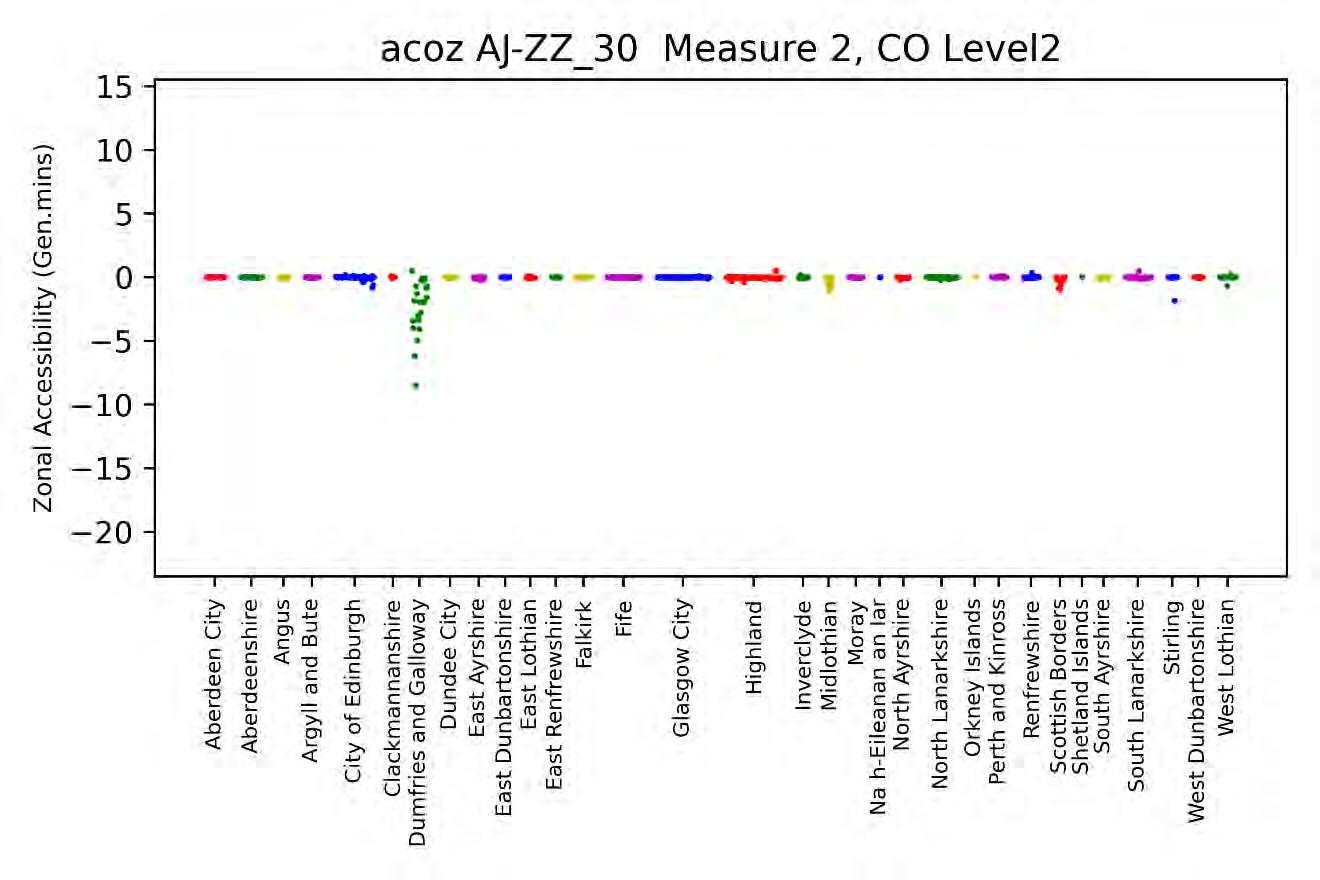 Figure 3-37: Absolute difference in accessibility to the workplace for SEL2 workers – 1 car
Figure 3-38: Absolute difference in accessibility to the workplace for SEL2 workers – 2+ cars
Figure 3-39 and Figure 3-40 present the absolute and percentage impact of the improvements included in package 6 on employment after 15 years from the opening of the rail and the implementation of the A75 dualling improvements included in the package.
The convention here and in similar maps below is that gains are sho wn in a particular colour (in this case green, with darker shades of green for more positive percentages) whilst losses are shown in grey (with darker shades of grey for more negative percentages).
The greatest impacts on employment in 20 45 are not surprisingly in Dumfries and Galloway (i.e., the area’s most directly affected by the transport improvement s) Most of the zones in Dumfries and Galloway gain employment, there are a few zones (east of Dumfries, especially Gretna that loses about 500 jobs) that show some small losses in jobs that locating to the neighbouring zones which have better accessibility.
Overall Dumfries and Galloway gains about 1,100 jobs (1.7% more jobs than in the do-minimum) in different sectors.

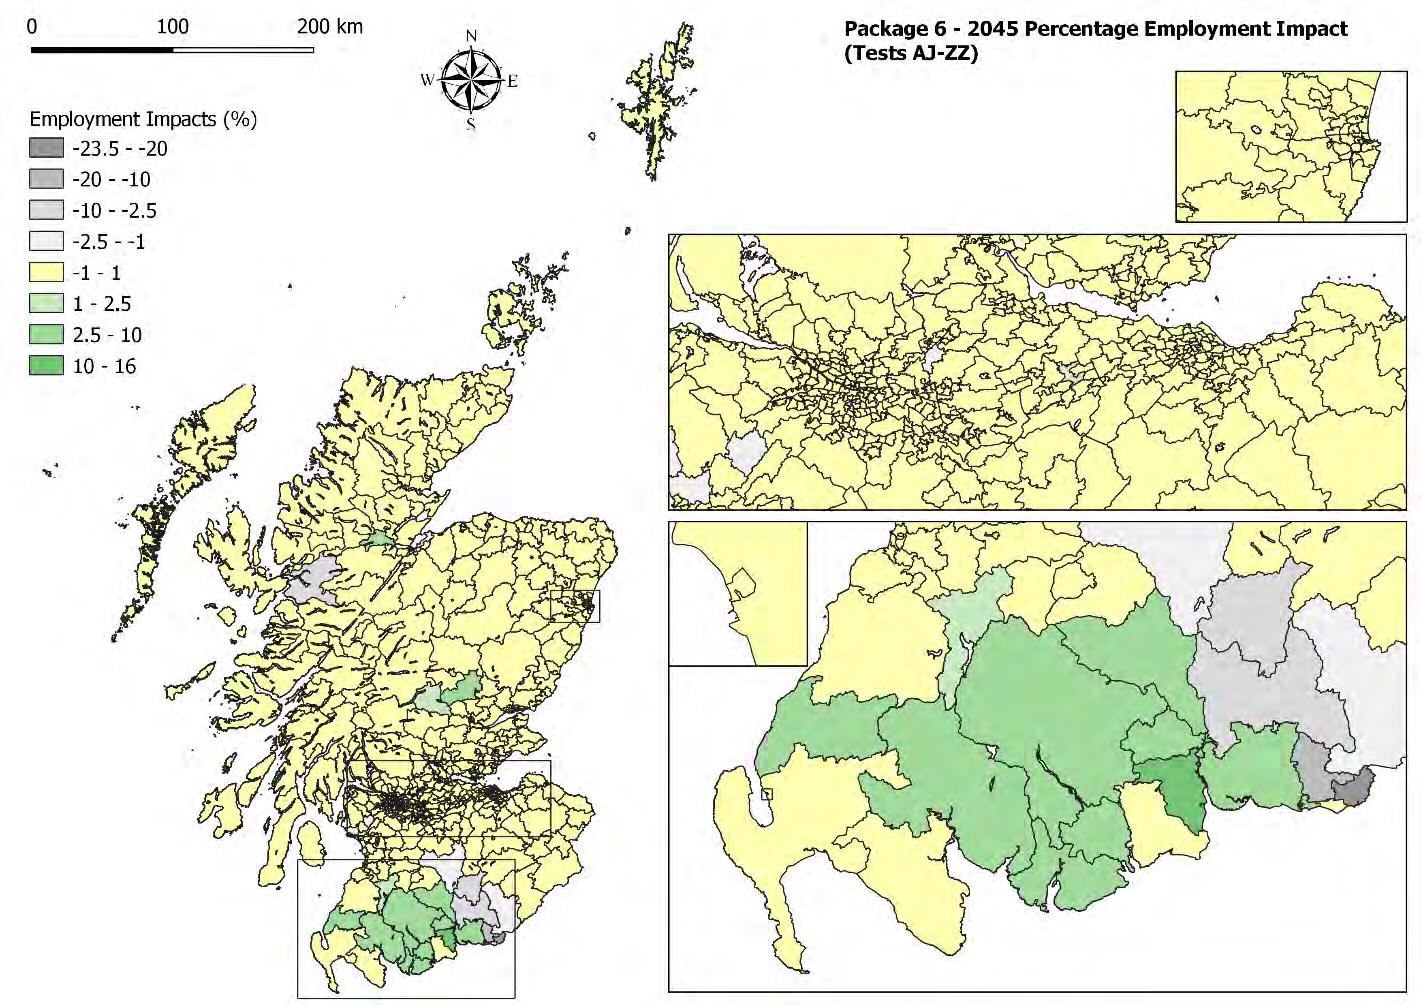
The impacts on households and population are less than the impact on employment but they are still significant. The pattern of household location is very much in line with the employment location as one would expect but the impacts are smaller. The greatest land use impacts are seen at the eastern end of the corridor, highlighting the enhanced accessibility brought about in Dumfries.
Overall Dumfries and Galloway gains about 730 households in different sectors and there are small losses in all other local authority areas. The zones that gain most of the households are the zones along the A75 and the new railway corridors (with the highest number of households moving to Castle Douglas, Newtonairds and Maxwelltown) as shown in Figure 3-41 and Figure 3-42.

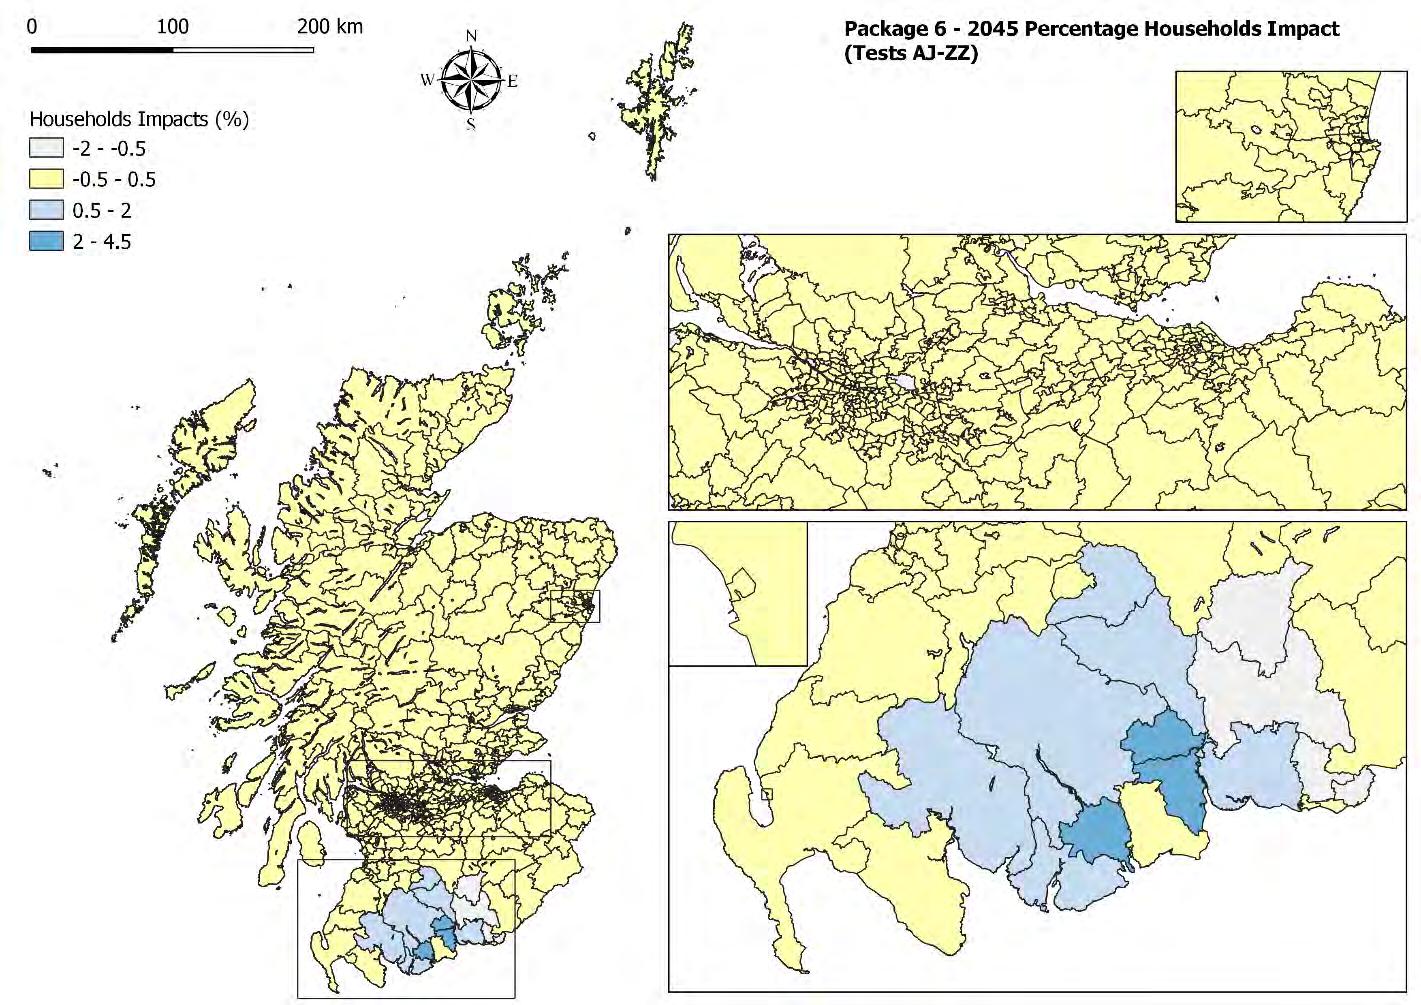
The increase in households in Dumfries and Galloway leads to increases in demand for residential floorspace which results in higher rents that in turn encourage developers to provide additional floorspace more and more quickly. This is shown in Figure 3-43 to Figure 3-45.
The impacts of the package 6 improvements on residential rents mainly localised in Dumfries and Galloway, but there are small impacts also in some of the southern zones of South Ayrshire (though the impact on rents is very small and doesn’t generate any extra development)
The average residential rent increases by 0.6% but there is some significant zonal variation where differences range between -5% and +6% (with the maximum increase in Newtonairds).
By the end of the forecast period, there are about 55,000sqm in Dumfries and Galloway. Most of the development takes place between 2037 and 2042, as result of the increase in demand for floorspace due to households moving in these zones. The development though, does n’t occur uniformly and it mainly takes place in Castle Douglas and in Dumfries.
Also, in package 6 the model forecasts a higher supply of residential floorspace at a national level as shown in Figure 3-43

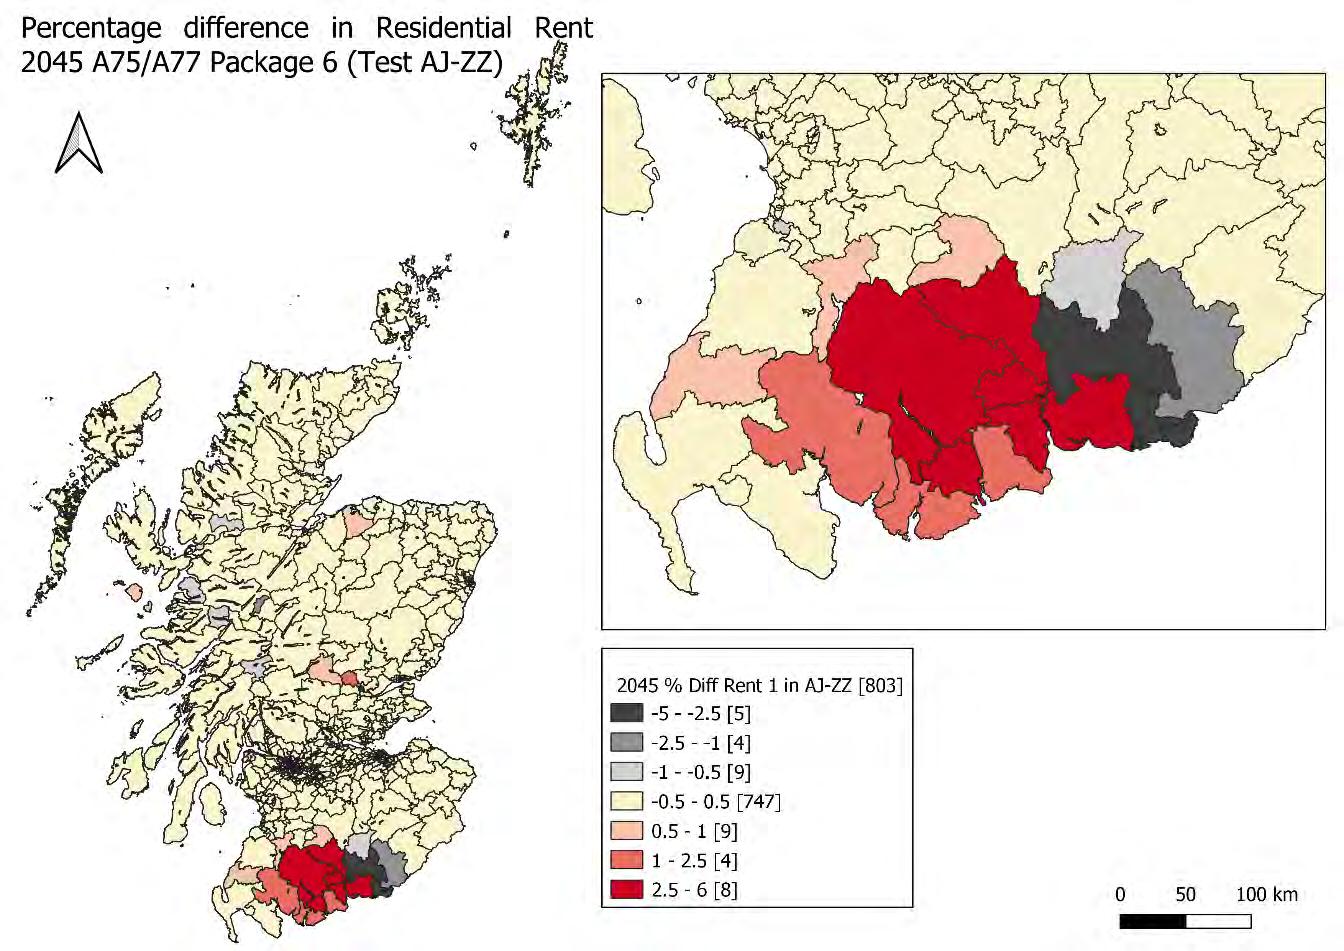

Table 3-4 shows the results in terms of GVA, GVA per worker and employment by local authority
The largest impacts in terms of GVA and employment can be seen in Dumfries and Galloway as one would expect. Dumfries and Galloway shows the largest percentage increase in GVA (1.2%) which mainly results from the increase in the number of jobs (about 1 ,100 extra jobs).
This chapter presents the land use impacts of the transport improvements included in package 9 in terms of employment, households, rents, floorspace and GVA. The land use changes driven by the package 9 costs (and hence the new accessibilities) are shown in 2045
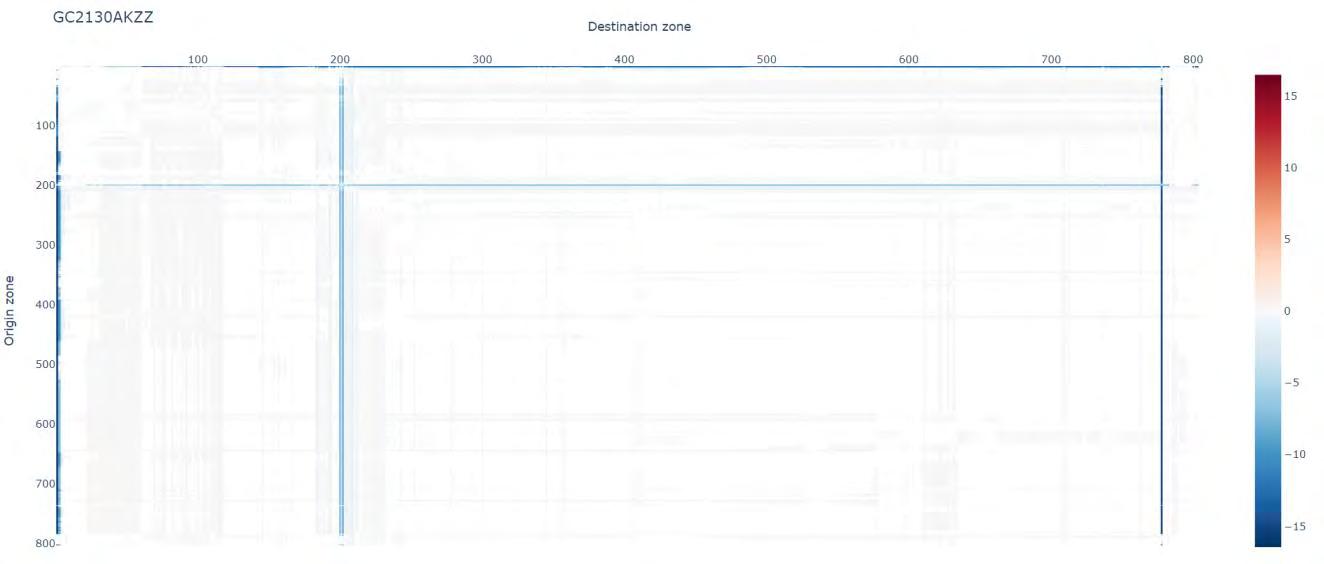
Like the presentation of the results in the previous chapters, only costs and accessibility analysis for commuting for workers belonging to SEL2 will be shown.
Figure 3-46 and Figure 3-47 show the absolute difference in generalised costs between the package 9 test and the do-minimum test for commuting between each origin/destination pair and for each mode. The difference in costs coming from road improvements ranges between +/ -15 generalised minutes (roughly double the changes seen in package 1, which is what would be expected since the latter doesn’t include the dualling of the A77).
The changes in cost originated by the public transport improvements are much larger than the one for the car mode. This is to be expected due to the large size of rail network improvements.
In both graphs, it is evident that the most prominent improvements occur in Dumfries and Galloway and South Ayrshire as one would expect
Figure 3-46: Absolute change in car commuting generalised costs (Package 9 – Do-minimum)Figure 3-48 to Figure 3-50 show the impacts of the transport improvements included in package 9 in terms of accessibility. As mentioned before, the accessibility measures combine land use data with transport data The maps presented below show the absolute impact of package 6 on accessibility to workplace for workers belonging to SEL2 for each car-ownership level.
The convention used in the maps is that negatives represent an improvement in accessibility, and they are represented in a scale of red. Worsening accessibility is represented by a positive number and a scale of grey colours. The darker the colour is, the hig her the difference in accessibility between the package and the do-minimum test is.

As one would expect, Dumfries and Galloway and South Ayrshire show the largest improvements in accessibility due to the combination of the public transport improvement on the railway line and the A77 dualling, measures and bypasses. Small impacts far from the study area (such as in the central belt and south east of Edinburgh and in the Highlands) are due to noise in the models and can be disregarded.
Improvement in accessibility for non-car owners is shown in the Dumfries and Galloway zones along the railway corridor (mainly localised in Newton Stewart, S t. John’s, Dalbeattie and Kirkcudbright) while the increase in accessibility is mainly occurring in the A77 corridor (involving zones in South Ayrshire and in the western area of Dumfries and Galloway) as result of the A77 dualling improvements that are included in this package and that increases the positive impact on car-owners.
Figure 3-47: Absolute change in public transport commuting generalised costs (Package 9 – Do-minimum)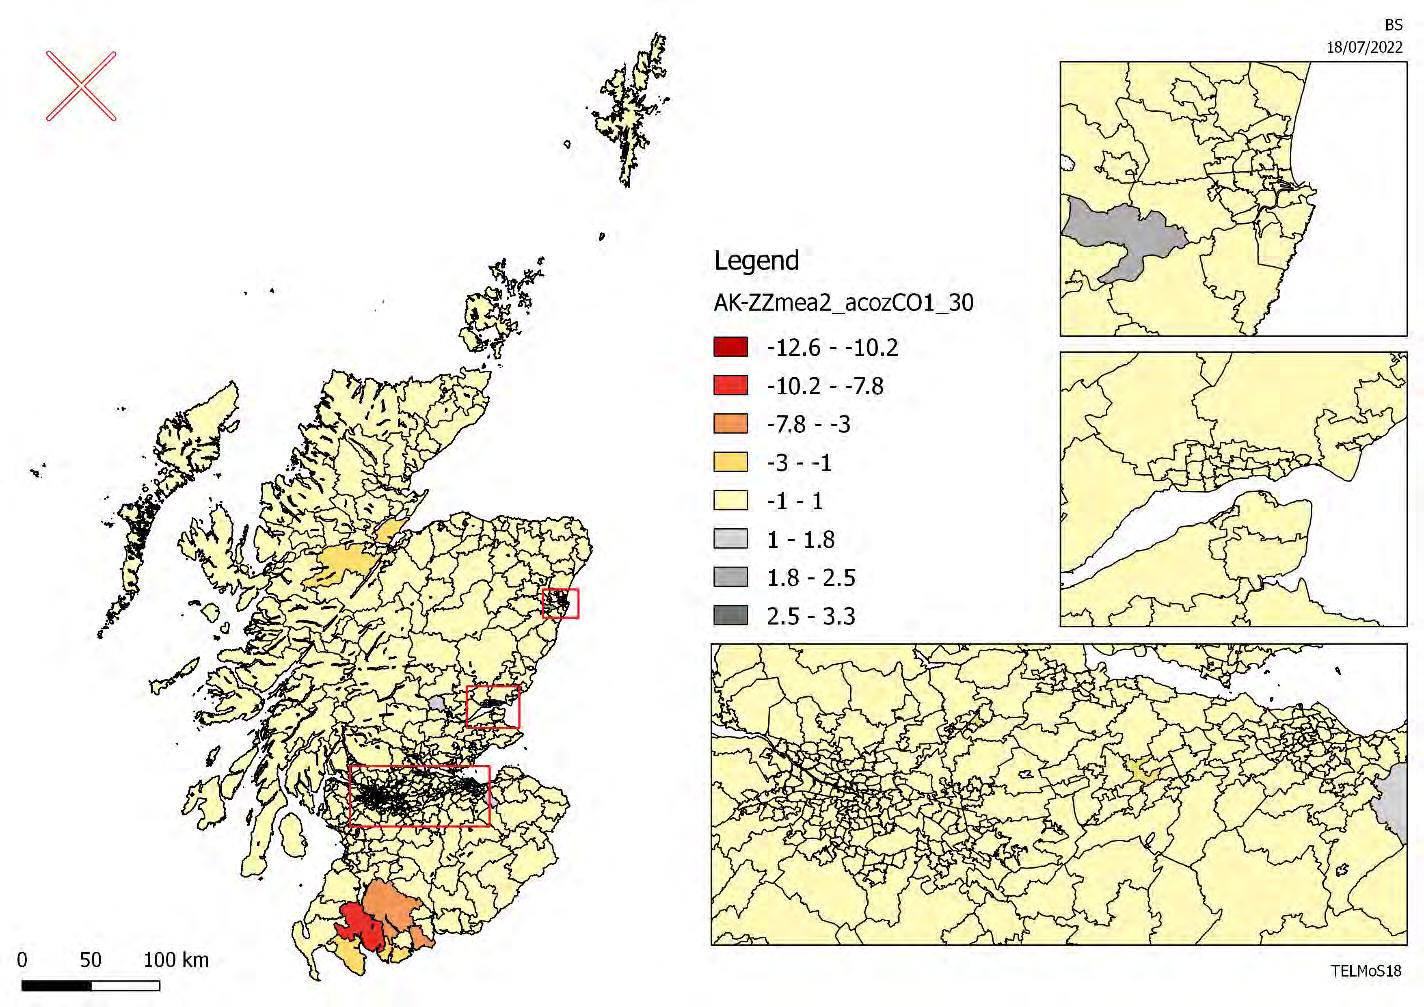

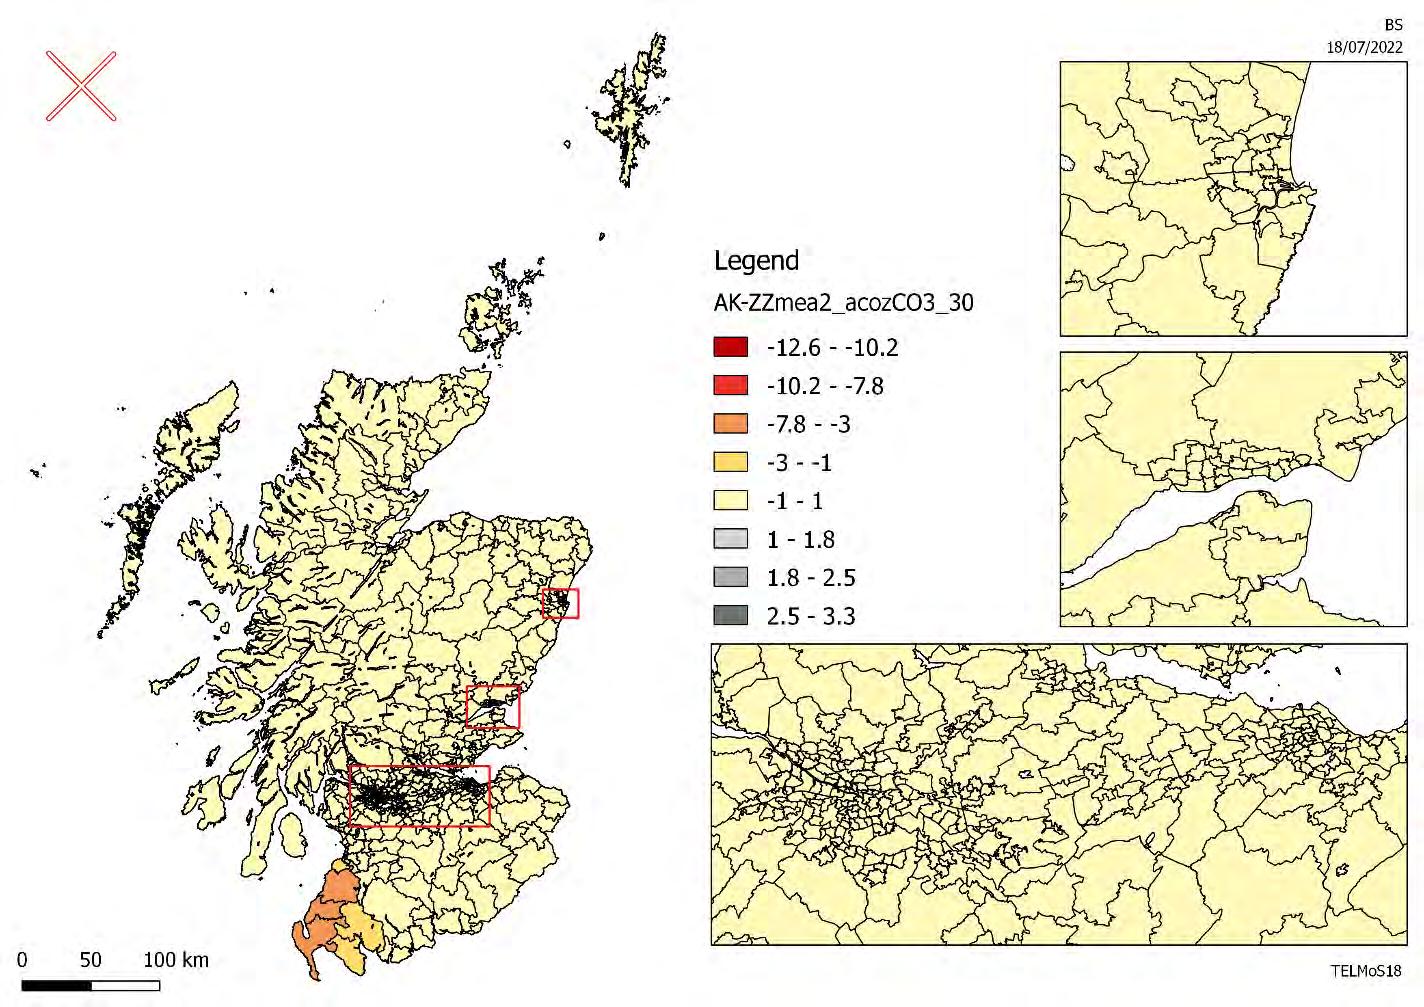
Figure 3-51 to Figure 3-53 show an alternative method to visualize the same measure of accessibility. Each colour in the graph represents a local authority and this tool shows that the largest changes in accessibility occur in Dumfries and Galloway and in South Ayrshire where the improvements in package 9 are being delivered and it also shows that there are some unexp ected changes in accessibility far from the study area, which are due to noise in the model.

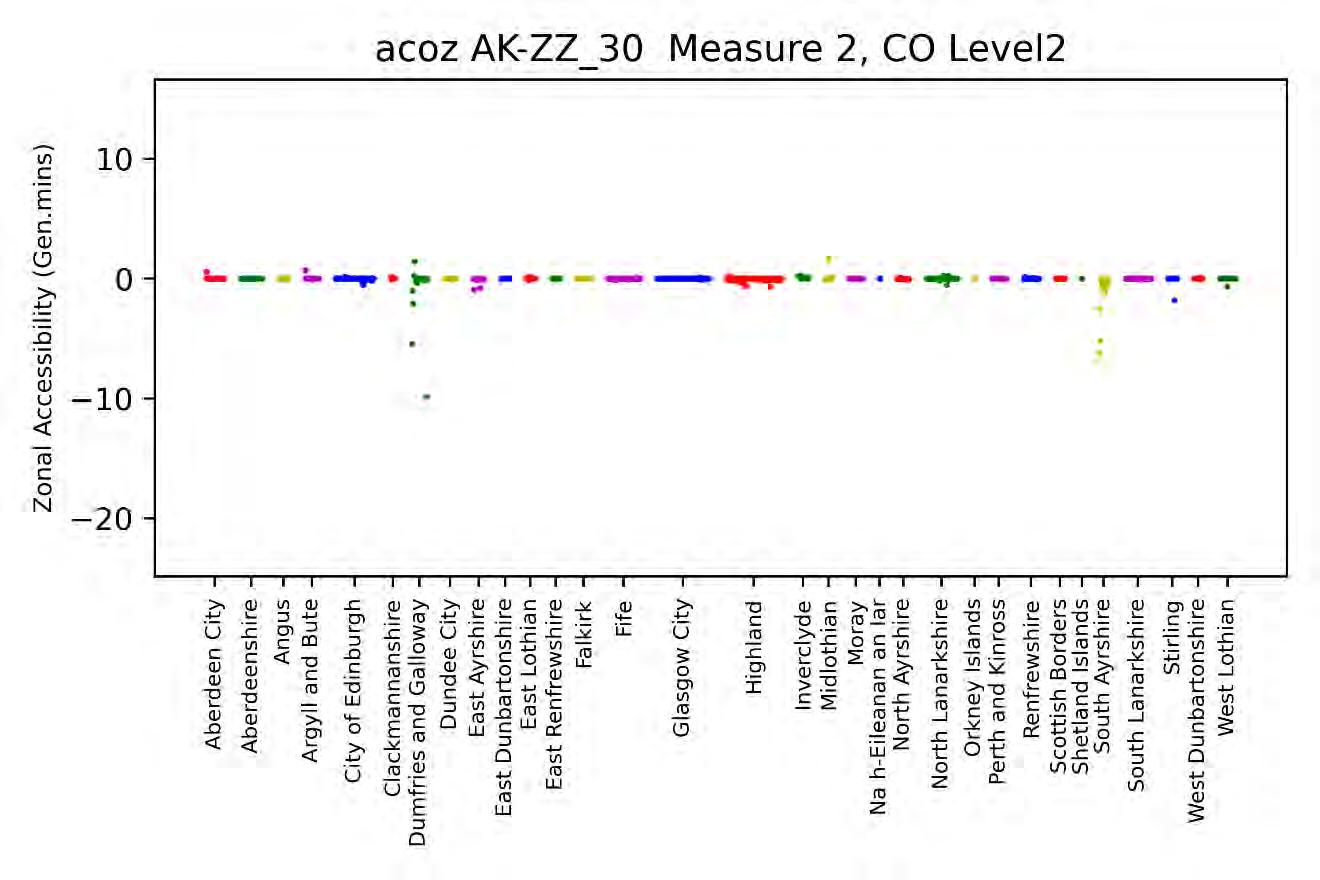
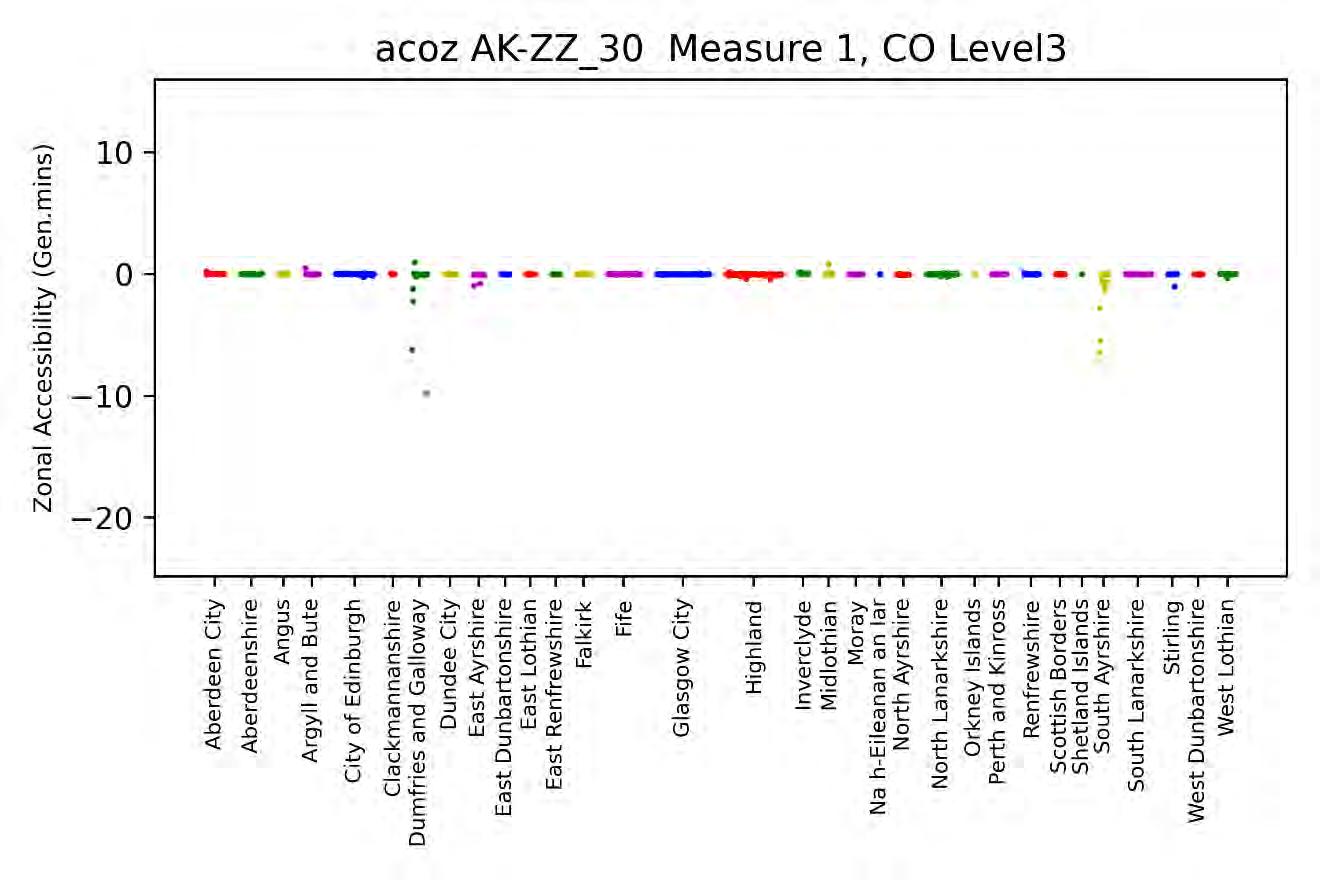 Figure 3-52: Absolute difference in accessibility to the workplace for SEL2 workers – 1 car
Figure 3-53: Absolute difference in accessibility to the workplace for SEL2 workers – 2+ cars
Figure 3-54 and Figure 3-55 present the absolute and percentage impact of the improvements included in package 9 on employment after 15 years from the opening of the rail and the implementation of the A77 dualling improvements included in the package.
The convention here and in similar maps below is that gains are shown in a particular colour (in this case green, with darker shades of green for more positive percentages) whilst losses are shown in grey (with darker shades of grey for more negative percentages).
The greatest impacts on employment in 20 45 are not surprisingly in Dumfries and Galloway and in South Ayrshire (i.e., the area’s most directly affected by the transport improvement s)
There are two zones in Dumfries and Galloway that gain employment: Stranraer and Newton Stewart, while all the other zones show small losses but overall Dumfries and Galloway gains about 406 jobs (0.6% more jobs than in the do-minimum) in different sectors.
South Ayrshire sees 580 extra jobs locatin g in various zones along the A77 corridor (which represent an increase of 1.3% compared to the do-minimum case).
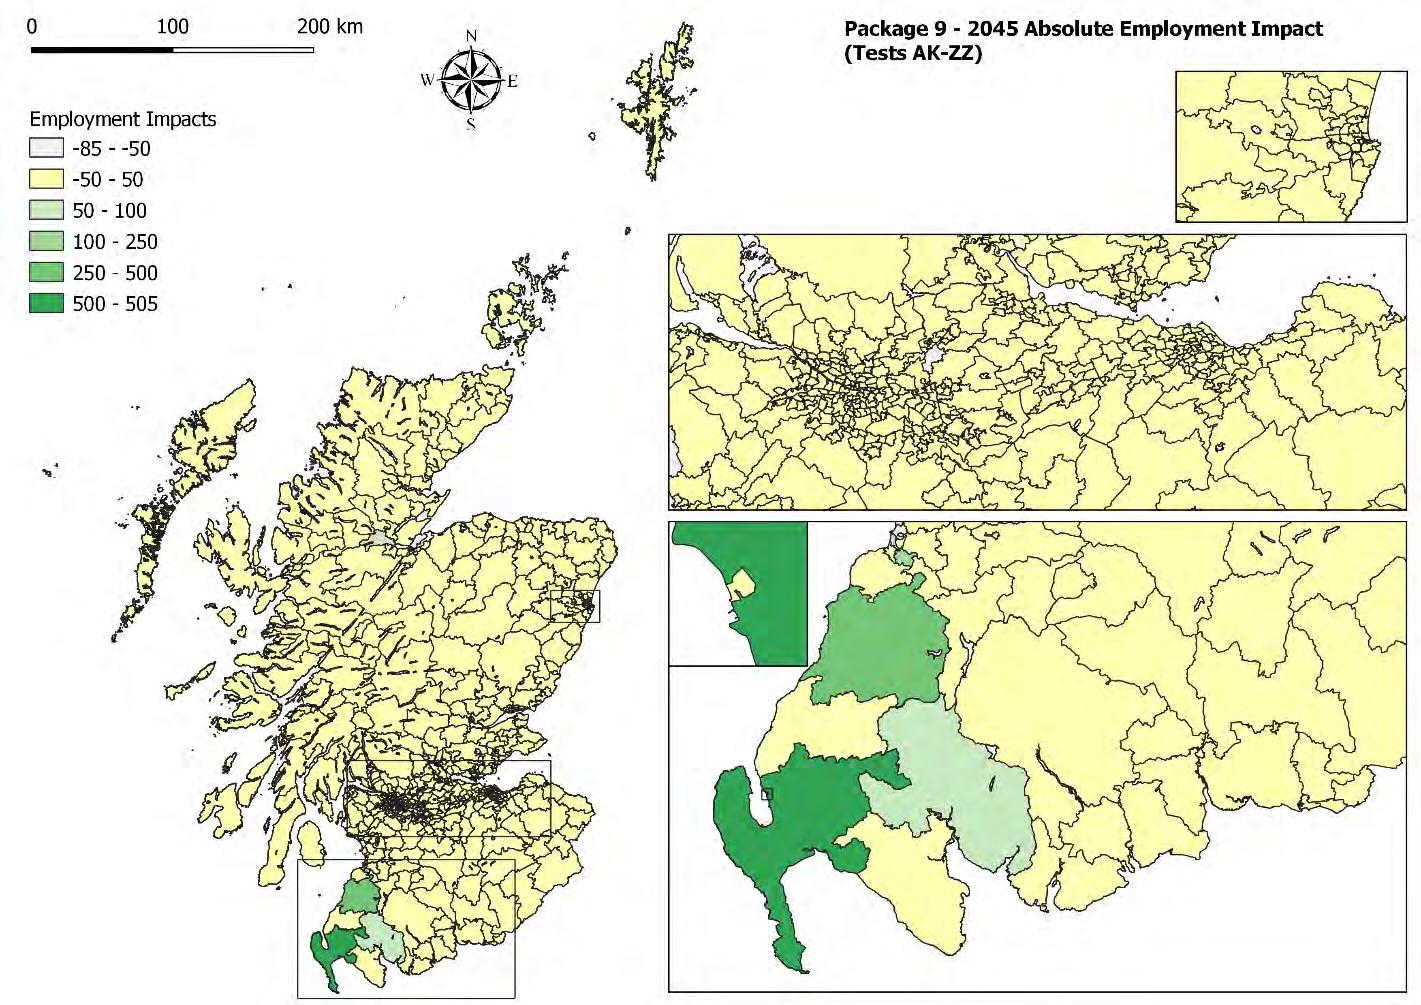
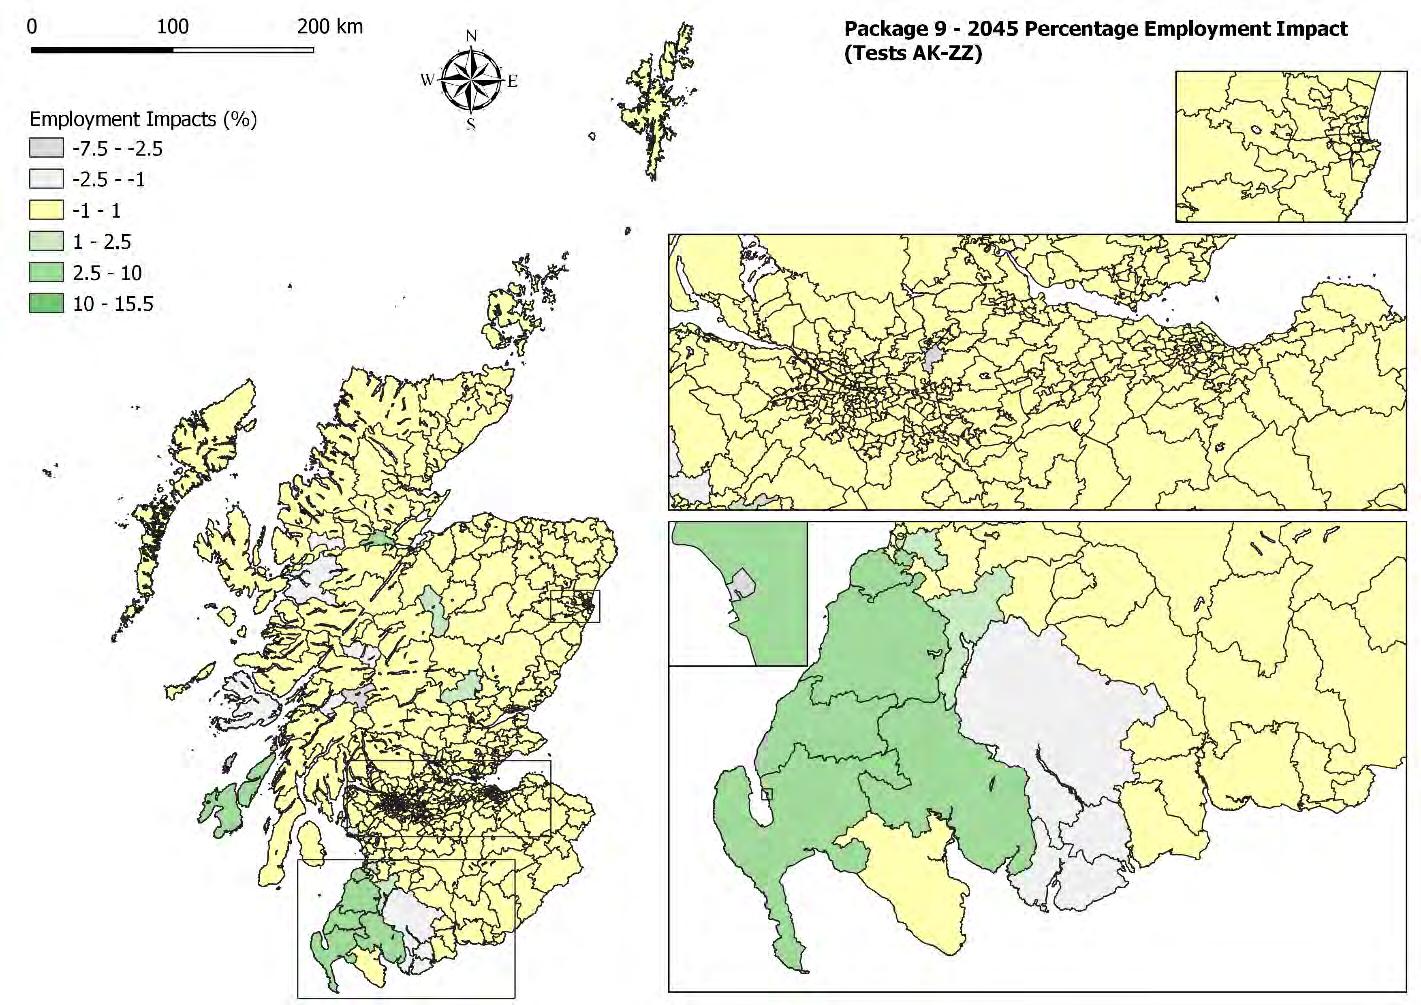
The impacts on households and population are less than the impact on employment but they are still significant. The pattern of household location is very much in line with the employment location as one would expect but the impacts are smaller. The greatest land use impa cts are seen in South Ayrshire and the western end of Dumfries and Galloway, highlighting the enhanced accessibility brought about with the A77 dualling.
Overall Dumfries and Galloway gains only 81 households and they are mainly going to Stranraer as shown in Figure 3-56 and Figure 3-57 South Ayrshire, gains about 275 households (0.5% more than the dominimum case), mainly located in Glenparks, Maybole and Girvan.
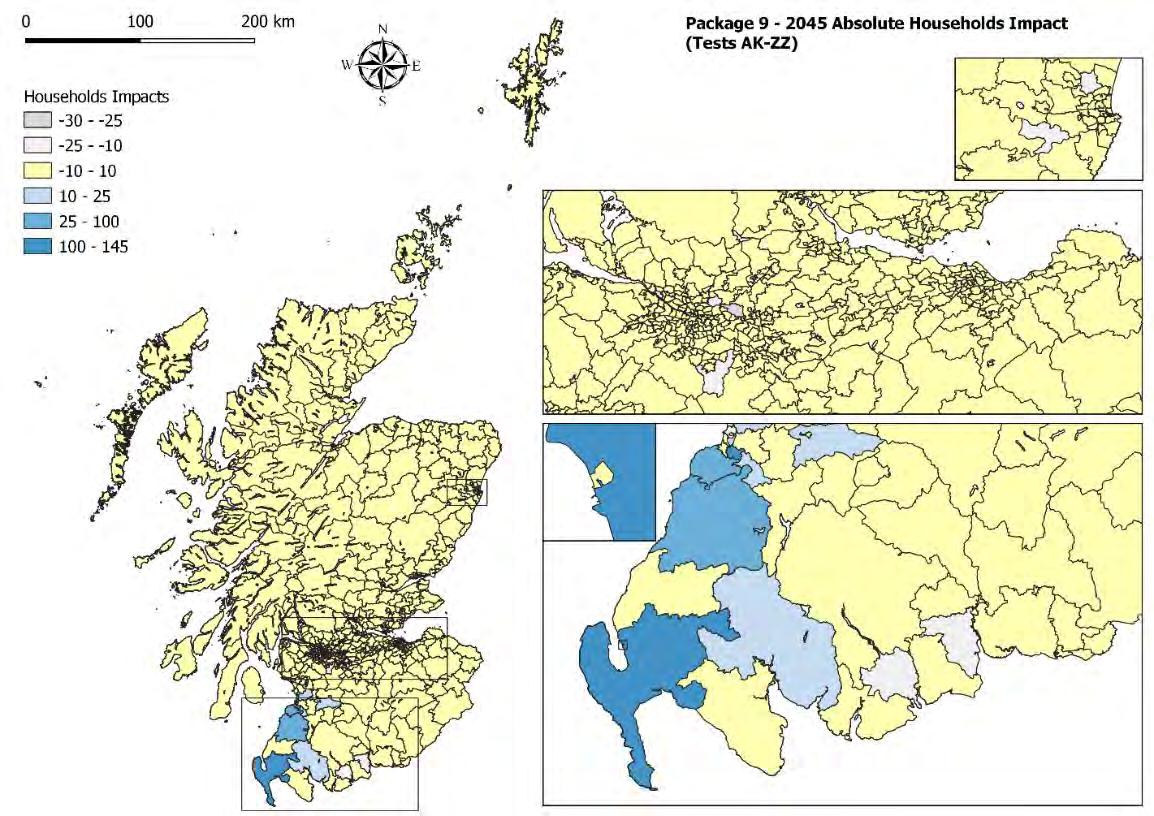

The increase in households in Dumfries and Galloway and in South Ayrshire leads to increases in demand for residential floorspace which results in higher rents that in turn encourage developers to provide additional floorspace more and more quickly.
The impacts of the package 9 improvements on residential rents is mainly localised along the A77 corridor. The impact on residential rent is significant in Stranraer and in all the other South Ayrshire zones along the A77 corridor. The increase in households locating in these zones causes an increase in the average residential rent in South Ayrshire (where the average rents are 0.4% higher than the do-minimum case and Glenparks experiences about 7% increase in rents).
Figure 3-58 shows that by the end of the forecast period, the overall floorspace developed in Scotland is less than what is developed in the do-minimum (about 17,000sqm less). South Ayrshire is the only local authority where more residential floorspace gets developed (ab out 22,000sqm) while Glasgow and South Lanarkshire see less development taking place as shown in Figure 3-58 to Figure 3-60

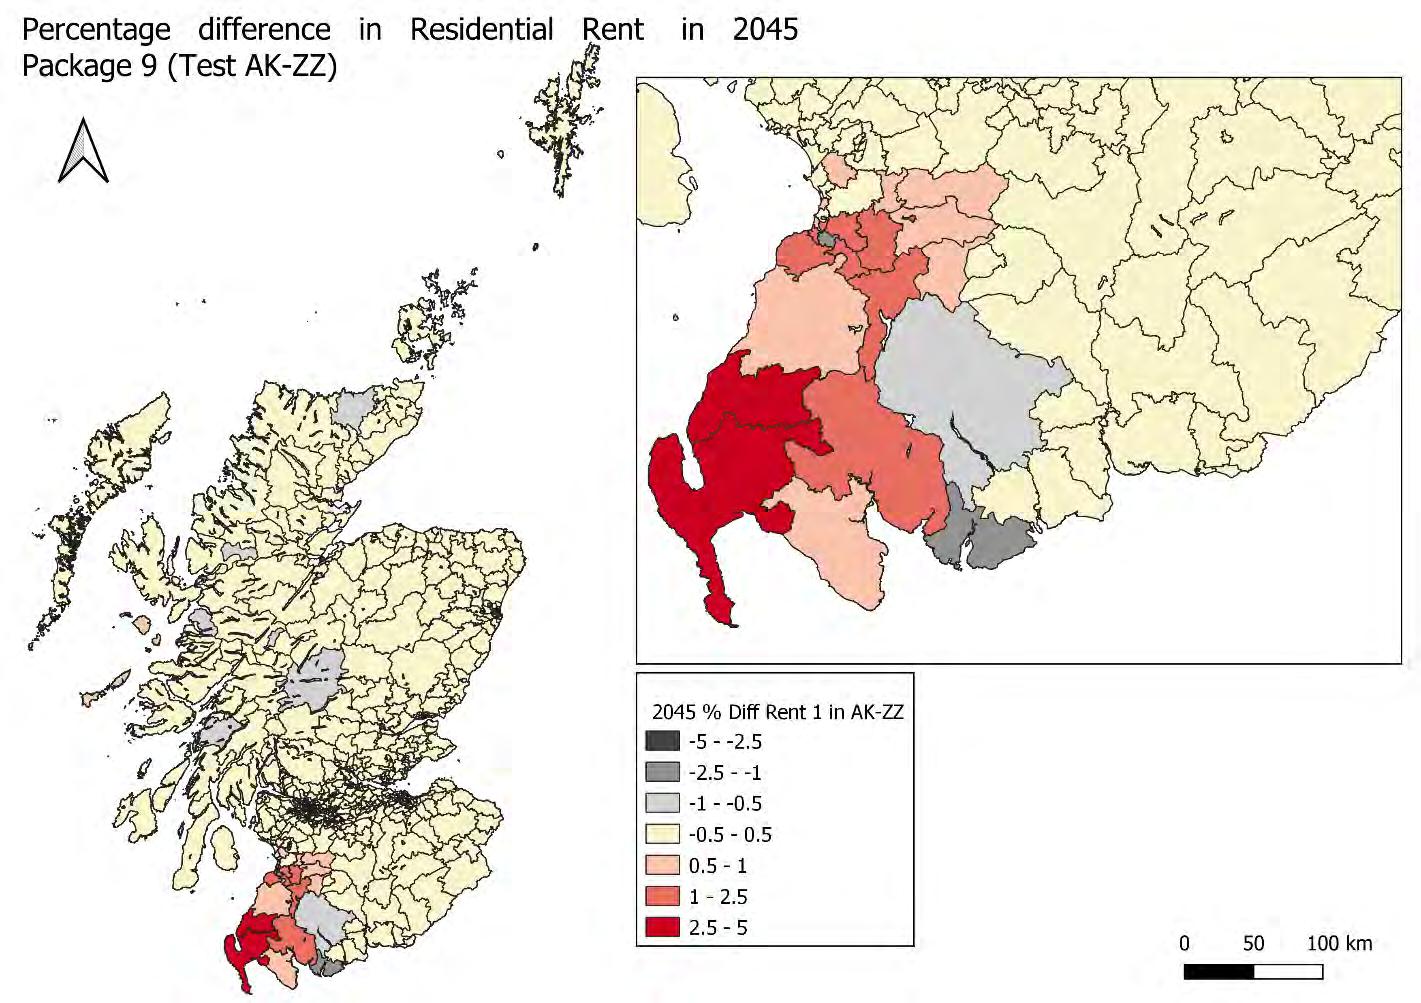
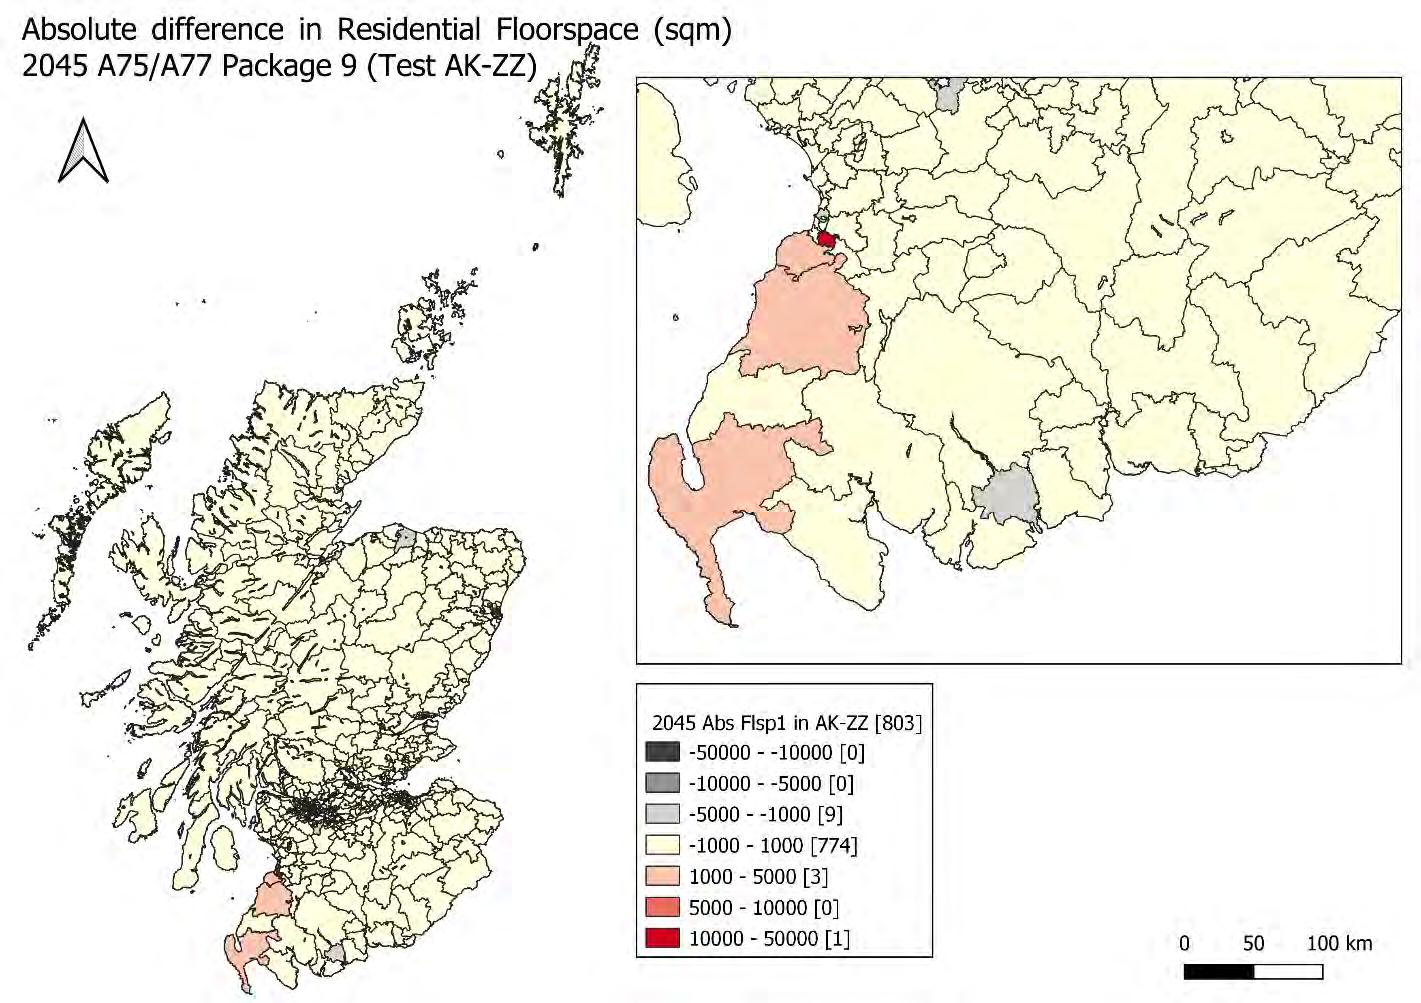
Table 3-5 shows the results in terms of GVA, GVA per worker and employment by local authority
The largest impacts in terms of GVA and employment can be seen in South Ayrshire (0.6% increase in GVA and about 600 extra jobs) and in Dumfries and Galloway (0.4% increase in GVA and 400 extra jobs) as one would expect.
Wider economic impacts refer to the additional benefits or disbenefits that can arise as the impact of transport improvements is transmitted into the wider economy, beyond those businesses and passengers that are directly affected by the trans port change.
The key metric is “economic welfare”, not GVA or GDP; this is the basis for including non -traded benefits such as time savings in leisure travel.
WIC – the Wider Impacts Calculator – was originally developed for TfN for TAG -compliant wider impacts appraisal, and subsequently modified for integration with TELMoS and to be compliant with STAG and Transport Scotland requirements.
As the proposals include cross -border links – M6/Carlisle via A75, NI ferry crossings via A77 – significant impacts would be expected in England and Northern Ireland. These are outside the scope of the modelling undertaken here, and as such the wider impacts presented are not indicative of the overall expected effect of the proposals.
These results should be taken as the possible wider impact benefits using TELMoS18 which have been aggregated as cumulative benefits in £ at 2018 prices and discounted to 2018 Benefits across the border are not included in this analysis.
Table 4-1 shows dynamic agglomeration effects, i.e., taking into account both generalised cost changes and employment location changes in calculating the changes in agglomeration The dynamic agglomeration highlights the impact of employment as forecast under the do -something scenario. The most significant level of investment, package 3 (A75/A77 dualling) produces the highest overall dynamic benefit. Package 6, whose focus is on the A75, produces benefits only to Dumfries and Galloway; packages 1 and 9 provide benefits to both South Ayrshire and Dumfries and Galloway. The negative impact in South Ayrshire in package 6 – is a result of employment growth being drawn into Dumfries and Galloway from South Ayrshire.
ULTrA is Systra’s accessibility-based land use and transport appraisal software. It aims to give attention to the wider spatial and social context of public expenditure, otherwise neg lected by conventional TEE and even WEI appraisal methods. The approach is to measure benefits and disbenefits to households and other actors, using measures of benefit from improved accessibility as the means of capturing both the direct benefits of transport improvements and land use effects. The result is that zonal variables can be used (rather than the zone x zone matrices used in TEE and WEI).
Note, that the choice of approach means that direct effects of transport change appear in accessibility variables. These represent the value that actors in the land use markets – households and firms – place on accessibility to destination, as opposed to the value that users in the transport system place on time savings.
The ULTrA method has been developed through a long series of projects. It applies conventional welfarebased cost-benefit analysis, using the standard rule-of-a-half method for consumer and producer surpluses, to the zonal variables of the model, while:
• Allowing for working with fixed or variable economic scenarios
• Showing benefits by broad sectors or categories of economic actors ( i.e., households, firms, etc )
• Considering transfers between these
• Showing benefits spatially where appropriate
The defined sectors are:
• Households
• Firms
• Property owners
• Government
• Other benefits
This structure aims to make transfers between the different sectors explicit. It is recognized that directly or indirectly, benefits to firms and property will accrue to individuals (for example, as sharehold ers or as the beneficiaries of pension funds) as should savings to government. However, the sectoral structure seems more informative about which benefits flow directly to households, which may benefit them indirectly, as well as indicating potential revenues to government for financial appraisal.
The TELMoS model treats all households, and all firms that are modelled as occupying floorspace, as if they rented the space they occupy. The category of “landlords” therefore covers the owners of all of the mo delled residential and non-residential floorspace. The results presented below are shown in those terms.
The public sector could in principle be disaggregated into local and national government, and potentially other agencies; this has not been pursued to date.
The “other benefits” category is intended to capture estimates of benefits where the beneficiaries cannot be clearly identified, such as reductions in greenhouse gas emissions.
All of the benefits are calculated by year, with benefits in the fina l modelled year (2051) being projected to the end of the appraisal period (2076) and discounted to obtain their present value.
The general design for the treatment of household benefits in ULTrA is the diagram shown in Figure 5-1, which is very conventional but less so in the variables:
• The “price” variable (on the vertical axis) is the disutility of locating in a zone, for a given type of household in a given year
• The “quantity” variable (on the horizontal axis) is the number of households of that type located in that zone in that year
The household location model itself works in terms of “utility of location” rather than “disutility of loc ation”. The disutility is simply the negative of the utility variable. The components of the utility term include:
• Income
• Accessibility to work and services
• Floorspace occupied per households, less rent paid
• Housing quality effects: the externality effect of other households maintaining their property in good condition (modelled as a function of their income), and of higher -quality new housing being built
• Environmental effects from traffic (not modelled or appraised in the current project)
• Less various costs related to acquiring additional cars (which give better accessibility) or accessing additional jobs
Benefits to households are calcula ted for each household type in each zone. Total benefits are found by summing over household types and zones, in the same way that they are found in TEE by summing over purposes, modes, zone pairs, etc.
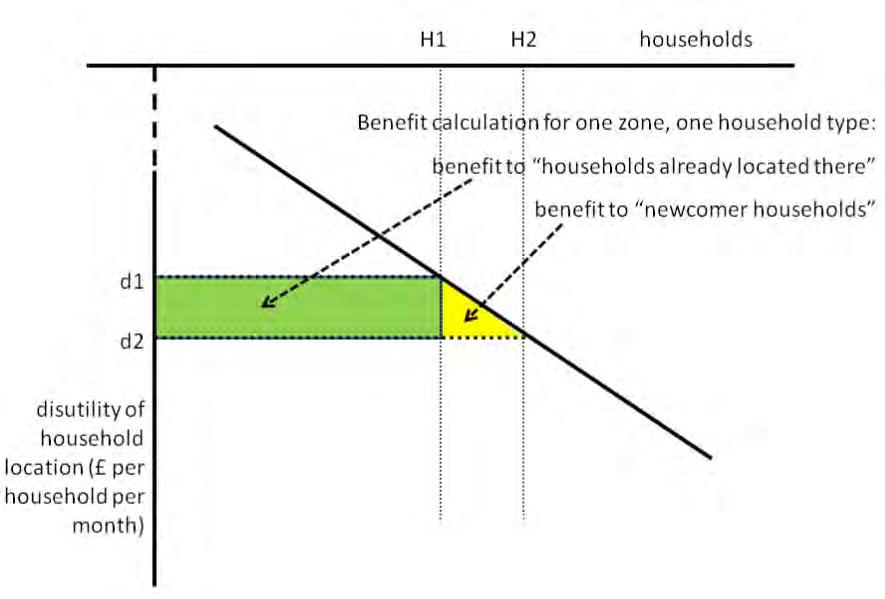
In the urban transport system, much of the equilibr ation between supply and demand takes place through changes in congestion. In the land use market, much of the equilibration takes place (gradually) through rents. The key difference is that prices are paid by one agent but received by another (and may the n be taxed). One of the contrasts between ULTrA and a conventional transport appraisal is that a larger part of ULTrA is about who pays more and who is paid more as a result of changes in rents.
The treatment of firms considers :
• Savings in terms of better accessibility to other businesses (typically to clients/customers)
• Savings in cost of location (i.e., reductions in rent)
• Increases in value added due to agglomeration, relocation, and multiplier effects
All of these would constitute inc reases in profits; a standard tax rate is applied which transfers part of these additional profits from firms to the government sector.
The benefits to property owners and developers (who are treated as a single sector) consist of:
• Increased income from rent (whether from higher rents for the same property, or additional rents for additional property)
• Savings from supplying less floorspace, if this is forecast within the model or imposed as a policy intervention
• Any reductions in taxes paid
Figure 5-1: Main concept for consumer benefit calculationIn many cases, of course, it is hoped to see more floorspace (especially more housing) being supplied as a result of a planning intervention, so then a net benefit in the savings in cost of floorspace item will be seen
The benefits to the public sector consist entirely of additional revenues from taxes and charges paid by households or firms elsewhere in the calculations. Given the different potential applications of profits to firms and property owners (e.g., payment of dividends, reinvestment) the representation of profits and taxes on profits must be taken as indicative rather than exact.
Reductions in greenhouse gas emissions should be valued using the Government’s shadow value for such reductions from non-traded carbon. This requires more detailed transport modelling that is available in the present project. Shadow prices could also be de veloped and applied for other environmental benefits e.g., health benefits from increased walking and cycling (if not allocated to the households whose residents engage in the increased activity).
One of our objectives in the development of ULTRA has been to find ways of measuring and including some of the benefits which policies or investments are seen as delivering to particular areas or regions. It is proposed that possible bases for identifying benefits include:
• Differences in the marginal utility of income
• Externality effects
• Unmodelled issues of “other infrastructure” capacity
Higher marginal utility of income is recognized in the Green Book but there are questions around its application in the kinds of comparison that the present appraisal refers to. The intention is to address this further within the present project but not in this report
Externality effects can probably be grouped into two types:
• Those arising from the presence of derelict, disused or neglected land or buildings, and more specifically from the negative effects that this has on people in or passing through the neighbourhoods affected
• Those arising from concentrations of problems such as (in particular) unemployment, and more specifically from the negative effects that these problems have on other people living in the same area
The shadow value of relocating jobs to a target area is what is being paid to achieve the same effect in other ways (the same principle is used for carbon pricing). This assumes that generating jobs in defined regeneration areas, or (better) generating jobs that are taken up by residents in defined areas of deprivation, creates benefits even if those jobs are displaced from other (non -regeneration or less deprived) areas; and argues that the value of the job must be equal to or greater than the costs incurred in generating such jobs through other policies (assuming that those other policies are rational and reasonably efficient). The present ULTrA calculations therefore apply a value per additional job in most deprived areas that is derived from “average costs per job created” figures published by English Partnerships.
The issues of “other infrastructure” capacity relate to the costs of “other” in frastructure, apart from the “improvement” being evaluated, that would need to be provided in different places as a result of the improvement’s impact, and where this would have cost implications for the public sector. The most obvious categories where such needs arise (as a matter of clearly defined policy of provision) and where the costs would most clearly fall on the public sector would be in education and health. Therefore, estimates of the additional cost of land arising from population locating in di fferent places has been included. Additional costs can arise from moves within regions as well as from moves between regions.
Table 5-1 and Table 5-2 summarise the definitions of each item in the summary table. All summary entries are in monetary units discounted to the appraisal base year. Shaded entries are not currently calculated with the present application.
Sector Item
Accessibility
Household environment
Housing consumption
Definition
Benefit to households from improved accessibility to opportunities for work and services. NB improved accessibility may arise from any or all of better transport provision; higher car ownership; more or better - located opportunities
Benefit to households from reduced traffic (dependent on data passed from transport model – not currently available in TELMoS18)
Benefit to households from lower housing cost per household and/or improved space per household. NB all households are represented as renters.
Househ olds
Income
Benefit to households from increased income net of income tax, Council Tax and VAT on household expenditure. Income per household may increase through more household members in work or higher wages per worker. Wages may increase due to higher wages in particular work zones or increased commuting to zones offering higher wages.
Leisure time and commuting costs
Car ownership costs
Housing quality
Totalhouseholds
Productivity
Accessibility
Benefit to households in increased leisure time and reduced commuting costs if the number of workers per household decreases. ( So, if income increases due to more household members in work, this will be negative i.e., a loss of benefit.)
Benefit to households from reduced expenditure on car ownership. ( So, if increased incomes lead to increased car ownership, some of the benefits in income and accessibility will be offset by a negative here representing increase expenditure on car ownership.)
Benefit to households from improved quality of hous ing areas i.e., from externality effects of higher -quality new development or better maintenance/improvement by other residents
Sum of the household benefit components listed above
Gains to firms’ profits from productivity effects e.g., agglomeration effects (increase in GVA minus increase in wages paid), moves to more productive locations
Benefit from improved accessibility to other businesses
Firms
Rent Benefit from reduced rents
Tax paid
Total - firms
Rent income
Benefit from reduced taxes on profits. This represents the part of the above gains that is taken in corporation tax, so will always be negative (more tax paid) if the sum of the above three items is positive (more profit made).
Sum of the firms’ benefits listed above
Benefit to developers/property owners from increases in (gross) income from rents (housing and commercial floorspace)
Developers
Development and maintenance costs
Tax paid
Benefit to developers/property owners from reduction in development and maintenance costs (housing and commercial) (so an intervention that increases floorspace supply will show a negative here)
Benefits from reduced taxes on profits. Equivalent to tax pai d by firms (see above) except that a proportion of households are assumed to be owneroccupiers and not to pay tax on rent “income”
Table 5-1: Summary of benefits and costs table definitionsSector Item Definition
Total –developers
Income tax revenue
VAT revenue
Unemployment benefit savings
Public sector
Council tax revenues
Business rates revenues
Taxes on profits
Public transport revenues
Total – public sector
Regeneration
Social infrastructure costs
Sum of the above benefits to developers/property owners
Increase in government revenue due to more income tax paid
Increase in government revenue due to more value-added tax paid
Reduction in government expenditure due to less unemployment benefit paid
Increase in (local) government from more council tax paid
Increase in (local) government from more business rates paid
Increase in government revenue due to more corporation tax paid
Sum of above increases in revenue (or reduction in cost) to public sector
Shadow value of net increases in employment for residents in most deprived local authorities
Savings in cost of land for social infrastructure (schools, hospitals) from population locating in areas where land is cheaper
Environmental Shadow value of greenhouse gas reduction (and possibly other benefits)
Total Sum of the benefits to the “other” sector
PVB
Present Value of Benefits = sum of all benefits listed above
The period between the opening year of the intervention to be appraised and the end of the modelled forecast is typically between 20 and 40 years. Current appraisal practice for infrastructure projects typically requires assessment over a 60-year period from opening. As with other approaches, it is therefore necessary to project how the benefits will change in the period that has not been explicitly modelled. This could be done in quite complex ways, making different assumptions for different co mponents of benefit; practice to date has simply been to scale all the benefits in line with a simple assumption of GVA growth.
The resulting 60-year sequences of benefits and costs are then discounted to the appropriate base year “present” values in the usual way.
ULTrA is an alternative method of appraisal, not just an appraisal of additional effects, so ULTrA benefits cannot generally be added to conventional appraisal benefits.
Table 6-1 shows the results of the ULTrA appraisal at different spatial levels for the four transport packages.
Table 6-1 shows the ULTrA benefits/disbenefits for the four packages at three different spatial levels (national, local authority and zonal levels).
Table 5-2: Summary of benefits and costs table definitionsOne of the advantages of ULTrA is that is provides a n explicitly spatial calculation of the benefits to households, firms, and property owners/developers, which in itself is an important contribution to considering spatial effects and whether a proposal tends to benefit areas which are seen as in need of re generation. This refines the output from TELMoS which forecasts where gains and losses will occur.
The focus is clearly on the two local authorities involved in the transport improvements included in the four packages and a more detailed analysis was also carried out for the Cairnryan and the Stranraer zones.
The results shown here are for the tests listed in Table 3-1 and the benefits and costs summary table for each package are shown in Table 6-1 The rows of this table are as defined in Table 5-1 and Table 5-2 at the end of the previous chapter.
For all the four packages tested, the benefits to households represent the most significant part of the overall benefits at all spatial levels. The benefits to households are domina ted by the benefits in accessibility as one would expect due to the nature of the interventions being tested. These gains arise primarily from the transport improvements themselves (incorporating the time savings achieved through each of the packages), allowing easier access to employment and to services, but are supplemented by the increase in local opportunities for work and services resulting from the employment gains in the corridor authorities.
Package 3 is the one with the largest accessibility benefits to households and firms at national level and most of these benefits are occurring in Dumfries and Galloway (30% of the benefits are to be accrued to the Cairnryan and Stranraer zones) while very little benefits are occurring in South Ayrshire. This hig hlights that in South Ayrshire there is a conflict between the A75 and A77 dualling improvements that, when tested separately in packages 6 and 9 bring some significant benefits to the local authority, but when then they are combined in package 3, the result is that most of the benefits are accrued to Dumfries and Galloway instead. Dumfries and Galloway is the local authority that gets the highest household accessibility benefits from all the four packages while South Ayrshire gets much smaller benefits apa rt from package 9 where it gets almost 30% of the overall households’ benefits.
There are slight losses of accessibility in all the local authorities across southern Scotland and the central belt, which are the result of the corresponding small losses in employment and income from those areas.
In all the four packages there is an additional benefit in income and in housing quality at a national level. Housing quality benefits generally arise where new housing is being built or where inco mes are increasing (allowing better maintenance and more improvement). These benefits therefore tend to be positively correlated with incomes and negatively correlated with housing consumption benefits. The housing quality effect has still to be fully analysed but is believed to be a result of higher incomes from increased employment. The largest impacts in income and housing quality in the four packages are in Dumfries and Galloway; South Ayrshire gets some significant benefits in package 9 while showing disbenefits in packages 3 and 6.
Gains in income usually occur where job opportunities are created. However, where the net national impact is very slight (package 1), this is because net additional jobs are only generated through agglomeration effects, and the majority of employment relocation is displacement.
At national level there are very small disbenefit in terms of housing consumption which are to be connected to the increased rents. These disbenefits are much larger in Dumfries and Galloway where the increase in residential rents is more significant; this means that there are benefits from other local authorities that are mitigating the disbenefits in Dumfries and Galloway at national level. The only small benefit in housing consumption at national level comes from package 3.
Changes in car ownership contribute to accessibility benefits (or disbenefits). The car-ownership costs line shows that there are costs from increased car ownership; the workings of the car ownership model are such that these tend to be directly related to increases or decreases in income.
The results for benefits in car ownership costs, leisure time are all negative as would be expected from the increased employment and higher incomes. The disbenefit in car ownership costs implies that more cars are being owned at national level (with package 3 having the highest cost likely due to the fact that both highway improvements are implemented in it). Most of these negative impacts are in Dumfries and Galloway while South Ayrshire gets very small benefits from all the packages apart from package 9.
Leisure time and commuting costs are generally positive (more leisure time, less commuting cost) where employment is lost, and negative where it is gained. As such these are negatively correlated with the benefits in changed incomes.
As result of increase in income due to more household members in work, there is a loss in leisure tim e for all the packages and an increase in commuting costs.
The housing consumption row shows benefits accruing to households from occupying more housing floorspace or paying less for it. In a spatial system where the supply of housing i s relatively inelastic, these benefits also tend to be negatively correlated with the changes in employment and in income, in that where the demand for housing increases (typically through a mixture of incomes increasing and additional households arriving in response to improvement employment opportunities), the housing supply usually does not (or cannot) respond proportionately. Rents then increase, giving a disbenefit in the housing consumption measure. Where demand decreases, supply (new building) may be reduced, but typically not in proportion; rents then fall, and benefits accrue to residents. This pattern can generally be observed across the housing consumption row.
The benefits to firms show significant positives in terms of accessib ility at all spatial levels. The accessibility benefits represent the expected savings in costs from the changes in the transport system (business travel and goods vehicle movement) and from land uses impacts affecting the distribution of destinations that need to be reached. It can be seen that the substantial gains are in Dumfries and Galloway.
It is worth to notice that the direct accessibility benefits to households are much greater than those to firms. This reflects the greater importance of local publ ic transport, in personal travel rather than for business travels.
The accessibility gains are offset by the increased costs. Higher expected revenue results in a slight increase in corporation tax.
Costs are essentially rent-related costs, which tend to be negative (malefits) where the demand for floorspace is increasing and positive (benefits) where it is decreasing. The disbenefits due to the increase in rents are much greater relative to the accessibility benefits for firms than for households; this re flects the forecast that additional housing will be built in the local authority on a scale comparable with the increase in households, while that does not happen for employment space and jobs.
The production row represents the gains to firms’ profits (aft er paying wages and salaries) from gains in productivity due to agglomeration effects or moving to more or less productive locations. The production results at national level are negative or at their best slightly positive (in package 9). The greatest gains here occur in Dumfries and Galloway (with some large benefits in Cairnryan and Stranraer), Dumfries and Galloway there are very little or negative figures for South Ayrshire. The benefits in Dumfries and Galloway are outweighed by disbenefits in South Ay rshire and other local authorities
Corporation tax savings are positive if the profits made by firms decrease (less tax paid), and negative if profits increase (more tax paid).
This category includes all owners and developers of the property (floorspace) modelled. It therefore includes owner occupiers as owners as if they were receiving rent from themselves (i.e., an imputed rent).
There are two significant lines here: development costs and rental income. Development costs are savings to the sector from developing less or cheaper floorspace – so any intervention which, say, induces a net increase in housebuilding will tend to show a negative total on this line. Rental income means what it says, counting both real and imputed rents. Both lines combine results for all the modelled floorspace types.
As one would expect for a transport improvement, the largest categories of benefits are the accessibility gains to households and firms, though a large proportion of these are “captured” by property owners in the form of rents received (rental income). As a result, there are disbenefits to households in housing consumption (more rent paid for less floorspace) and to firms in costs (of space). Those are usually referred to as indirect benefits (e.g., rent income to property owners and developers).
The additional development is reflected in the negative value for property owners’ development costs. Package 1 forecasts a saving in the development costs at national and local authority levels while the other three packages are characterized by some extra developments at National level and also at local authority level.
The rent income results are as one might expect generally positive in the corridor, and negative elsewhere. The overall result at national level is positive for all the packages (i.e., a gain of income to owners) and even larger benefits are produced at local authority level for Dumfries and Galloway (which suggests that there are negative impacts in other local authorities).
In other (English) ULTrA work possible ways of valuing the additional benefit of achieving regeneration in lagging or more deprived areas has been looked at. Benefits in “regeneration” or “rebalancing” are often excluded from formal cost benefit analysis and, at least in the case of transport improvements, are treated as part of the “strategic” case rather than the more formal “economic” case – the implication being that any achievements in regeneration or rebalancing do not contribute to the “val ue for money” assessed in the economic case, despite the long history of public expenditure towards such objectives. It has long been considered that treatment inappropriate, and that it should be possible to bring such effects into the economic case. That would in particular help to inform comparisons between improvements involving different trade-offs, e.g., improvements which deliver different levels of regeneration benefits, at different costs.
In the regeneration effects in Dumfries and Galloway, the shadow value of locating jobs to benefit workers in deprived areas is positive, showing that on balance the redistribution of jobs is towards the more deprived areas; however, the social infrastructure savings is negative, indicating that on balance, households are being attracted from cheaper to more expensive locations, adding to the costs of providing schools and hospitals. Very small rebalancing and regeneration effects are occurring in South Ayrshire.
The public sector (tax) effects are only calculated at the Scotland level, so the overall totals of the local authorities or finer geographic level will n ot include them.
As corporation, income and property tax receipts increase from the enhancements to accessibility and increases in employment, there is a net gain to the public purse across all the packages. Likewise, a marginal gain is seen across the board for rebalancing benefits – reflecting successes in bringing working
The increase in employment is forecast to be captured by the public sector contribution comes from the reduction in government expenditure due to less u nemployment benefit paid. All of the improvements result in new jobs created at national level which means that more opportunities will be created for people to enter in the job market and hence the government will have to pay less unemployment benefits.
Not surprisingly the largest benefits are produced by package 3, the largest package of the four. A significant part of the overall benefit is forecast to be captured by the public sector in additional tax revenues (note that this is simply by existing taxes, without additional value capture measures; note also that this is before considering how profits might be reused or distributed, which would modify the tax results).
Summarizing, at Scottish level, from package 1, there are £1.4 billion of impacts; from packages 6 and 9 in isolation, there are £3 billion and £2 billion, respectively. Reflecting synergy between the A75 and A77 dualling and measures, package 3 may produce £5.3 billion of benefits.
For Dumfries and Galloway, it should be noted that there is an even greater synergy between packages 6 and 9 compared with package 3 which is clearly not present in South Ayrshire.
The more spatially disaggregated results presented for Stranraer and Cairnryan port are for the most part similar to the results presented for Dumfries and Galloway. Cairnryan and Stranraer are capturing a good deal of the benefits in almost all the packages with the exception of package 3 where the benefits are only
10% of the Dumfries and Galloway total benefits. It se ms that the dualling of the A77 brings about more benefits than the corresponding improvement on the A75.
Accessibility effects as a result of the packages have been well represented within Scotland. This has translated well to a reasoned and sound land use effect. There is significant potential to estimate effects farther afield – in England and Northern Ireland – through further modelling and appraisal work. The current limitations in TELMoS18A prevent this being done to the same degree as the work presented here.
The TELMoS modelling showed that each of the package’s results in localised employment effects. For package 1, these are limited in scope; for packages 6 and 9, a greater impact in and around the respective improvement corridors is seen; and for package 3, a synergistic improvement across South Ayrshire and Dumfries and Galloway is seen
Wider economic impacts calculations show benefits from relocated employment (dynamic agglomeration). The package 9 result in particular shows an equitable distribution of impacts across the wider region; the package 1 and 3 results show that Dumfries and Galloway stands to gain potentially considerably more from enhanced accessibility than South Ayrshire; finally, the package 6 result is particularly poor for South Ayrshire.
Scotland-wide WEIs have not been included, as they omit a significant benefit expec ted across the border with England and through connections with Northern Ireland (particularly for B2B connections).
ULTrA appraisal has shown that there is significant potential for each of the packages. Households make up the single largest group across geographies and packages for benefits. Of the benefits, accessibility is the largest, and there are some smaller impacts to incomes and housing quality. For firms, accessibility increases, as do overheads, likely as a result of the increase d accessibility. As a consequence of accessibility-driven demand for floorspace, developers’ revenue increases – however development costs do too.
Comparing across packages, there is significant synergy between packages 6 and 9 (shown in the result for package 3). This holds for Scotland as a whole and down to the Dumfries and Galloway and Cairnryan levels.
A75 GRETNA-STRANRAER
A77 AYR-STRANRAER
AND ECONOMIC
Systra has been instructed by Sweco to review the opportunities for transporting timber by rail from the Arecleoch and Glentrool Forests. Achieving this requires the development of a timber loading terminal in the Barrhill area (located on the Ayr to Stranraer l ine) and the operation of a new rail freight service. The objective of this would be to encourage mode shift from road to rail for the transfer of timber to customers. Within this note two options for the development of loading points are explored. The first is a dedicated facility at Barrhill station, the second is the development of trackside loading points located flexibly along the length of the line. The options, and associated limitations are explored below. The operational issues associated with operating a new service, likely markets and quantify the environmental benefits of mode shift form road to rail are also set out
A large proportion of rural land in South Ayrshire and the southern and western parts of Dumfries & Galloway has been developed as commercial forests largely managed by Forestry Commission Scotland. The forests cover a large and remote area. As trees have matured and been felled they have historically been moved by road to end users. Going forward as there is a need to decarbonise transport more sustainable alternatives to road haulage need to be considered. The Arecleoch and Glentrool Forests both run close to the Ayr –Stranraer railway line and this provides the basis for exploring rail based alternatives, certainly for longer distance movements.
Estimates derived from a combination of the Transport Model for Scotland (TMfS18) model inputs and outputs, and employment statistics suggest that a total of around 13,200 heavy goods vehicle (HGV) movements each year are associated with timber traffic from the Barrhill area.
The line between Ayr and Stranraer is a predominately single track route, served in the May 2022 timetable by six return passenger workings each weekday, from Ayr and Kilmarnock (the first northbound service continues to Glasgow Central, although there is no correspond ing southbound working). On a Sunday the service is reduced to five passenger workings to and from Ayr. There is currently no freight traffic on the route, with the only scheduled non passenger working being Rail Head Treatment Trains (RHTT) operating in Autumn to help maintain adhesion on the route. Passenger services are currently operated by ScotRail using Class 156 DMUs.
This relatively light usage of the line means that there is capacity to operate freight traffic to intermediate locations subject to paths being retained for existing passenger services.
The line contains five passing loops, all controlled by local signal boxes. There is an additional signal box at Stranraer station, however this is only opened when required to accommodate the rare occa sions that more than one train is in Stranraer station. The route is open for traffic originating from Ayr from around 05 :30 to midnight. Operation of any services overnight would incur significant costs as it would require the opening hours of signal boxes to be extended and staffed.
There are currently speed differentials along the line for multiple unit trains. Freight traffic would therefore have to travel at lower speeds than passenger trains. The Network Rail Sectional Appendix also shows that the route is currently restricted to Route Availability 5 (RA5). This limits the route to being used by
locomotives and rolling stock with a low axle loading. This restriction may be a recent development relating to the condition of structures on the route as evidence exists of locomotives that exceed RA5 limits reaching Stranraer. Other routes in Scotland have similar restrictions but locomotives that exceed RA5 have speed restrictions over certain structures. An early action would be to discuss this issue with N etwork Rail.
Barrhill station (Figure 1-1) is located around 35 miles south of Ayr on the boundary of the South Ayrshire and Dumfries & Galloway local authority areas. The station has two platforms, with a passing loop which is controlled by the Barrhill signal box. In the May 2022 timetable trains are not scheduled to pass at this station. The loop at the station does contain two user worked crossings (Cairnlea No. 1 and Cairnlea No. 2) which may impact on the way in which the loop is used.
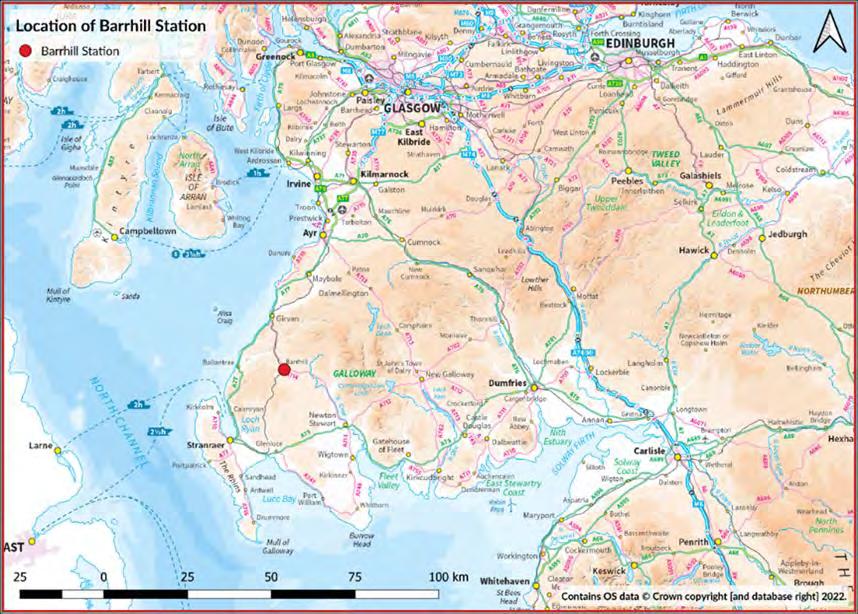
The loop at this station cannot be operated bi -directionally, however the existing layout would allow a locomotive to run round its train if required. The lack of a bi -directional loop is a constraint to train planning as it means that freight traffic has to be clear of the relevant platform when other services are approaching. Whilst more detailed work would be required to explore some of the issues above, the route does provide the scope for operating timber trains within the existing infrastructure, with investment only being required in the development of a timber loading at Barrhill.
There are two approaches to providing timber loading facilities. The first approach is to develop a dedicated terminal, allowing loading to take place away from the line, providing short term storage for timber. The second approach is to consider running line loading where a limited facility is provided at locations where the railway is adjacent to forest and timber can be loaded directly from the forest onto trains. The opportunities for both options are explored below. The requirements for a loading facility would be as follows:
Figure 1-1: Location of Barrhill station• The site would need suitable access for both road and rail, and appropriate level hardstanding with space for the manoeuvring of a loaded timber lorry. At other sites the transfer from road to rail is undertaken using the grabber on the road vehicle. It would be important to note however that using this operating principle means vehicle activity at the site would be concentrated at the train loading time, which may cause traffic issues on the surrounding road network
• An alternative to this would be the provision of storage facilities at the terminal, which would require increased land acquisition and provision of a dedicated telehandler to undertake the loading, however this would allow the terminal to function as a storage location and minimise train on site times while additionally spreading the vehicle load on the surrounding network. This approach would provide greater flexibility for both road hauliers bringing timber to the facility and t he rail freight operating company
• Should night operations be considered, it would be necessary to provide appropriate site lighting facilities, to enable safe operations on both sides of the service, allowing staff to secure the loaded timber to the vehicles
There are two options in the Barrhill station area for a dedicated loading facility to be built. The first would be located on the site of the former goods yard at the south end of Barrhill station. The historic map shown in Figure 2-1 highlights the site of the goods yard.

It would be possible to accommodate two sidings each of around 100m length on the site and accommodate a limited amount of timber storage in the area. The site does however have a number of limitations including:
• It would not be possible to maximise train length with only two 100m sidings. The maximum train length is in excess of 300m therefore operation of shorter train would reduce the overall efficiency of rail freight (though may still be commercially viable)
• Road access to the site is along narrow single track lanes, and the existing turn into the old goods yard is exceptionally steep and requires a turn beyond 90o which may prove problematic for timber
Figure 2-1: Location of previous goods yard at Barrhill station (Reproduced with the permission of the National Library of Scotland)transportation vehicles. This is compounded by the location of a residential dwelling on this turn which may require removal / relocation to enable successful access to the site
• The site appears to still be used by Network Rail as an access point and maintenance base and this would need relocating
 Figure 2-2 below presents the constrained access to the site.
Figure 2-2: Access to former station yard (Source: Google StreetView)
The second option th at would provide greater capacity with fewer constraints would be to draw on third party land to the south of the station, as outlined in purple on Figure 2-3
The land that sits between the railway and road is low quality agricultural land and is unfenced to the road. Figure 2-4 below presents a view from the road, looking north towards the station.
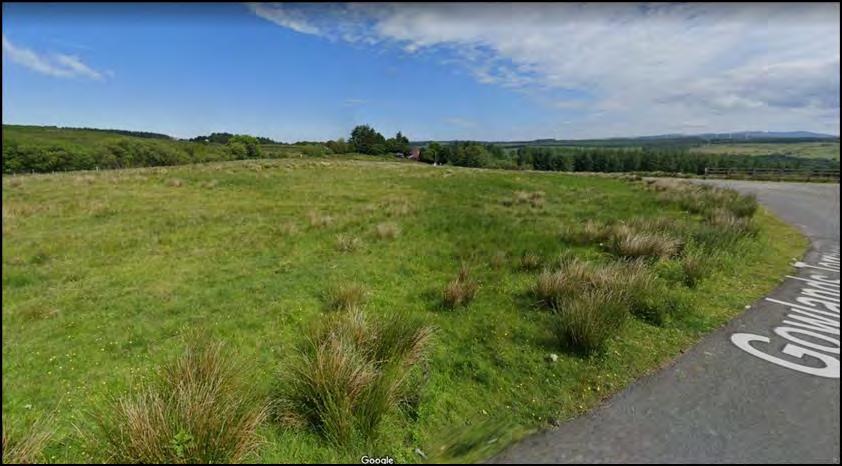
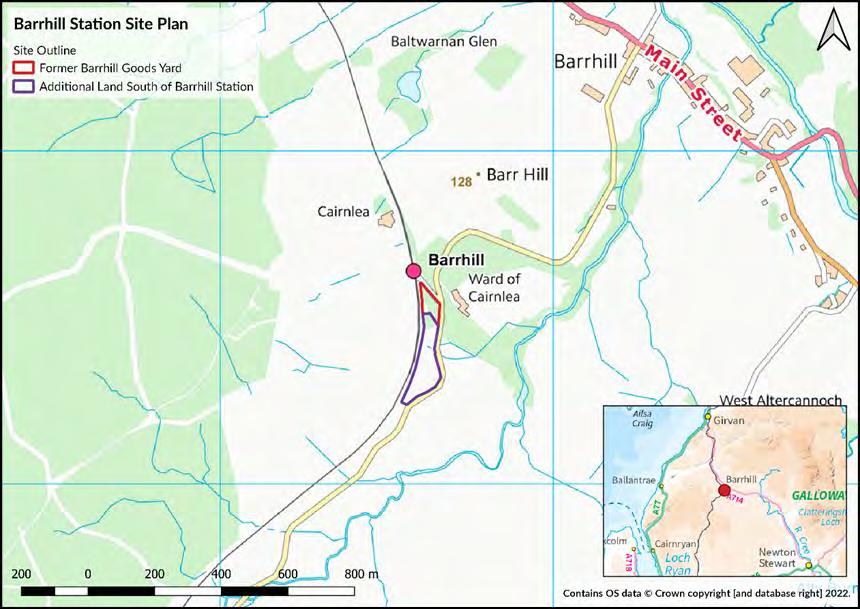 Figure 2-3: Site outline of the former Barrhill station goods yard
Figure 2-4: View of the loading facilities looking north (Source: Google StreetView)
This facility appears to have capacity for two sidings laid with one in excess of 200m and the other in excess of 150m, providing capacity for full length trains. The maximum viable train length on this route being 374m. The sidings could be laid in an arc to allow timber storage to be provided between the sidings. Although a greenfield site, land on the opposite side of the road has already been converted to hard standing for agricultural or other purposes.
The road at this point is narrow and more detailed work would be needed to understand if any upgrades were required, and in the case of both sides a swept path analysis would be needed to explore the site in more detail.
While the proposed sidings would be dead ends, it would be possible to access it via a run around procedure upon arrival in Barrhill station, and setting back into the siding, leaving the locomotive at the north end of the formation. This would enable the loading to be undertaken without impacting upon the passenger servic e, and for the locomotive to depart while the wagons are loaded. The ability to release the locomotive during loading may allow for undertaking of trip working to accommodate the loops on the line, and the formation of longer trains for better utilisation of network capacity, and consolidation of multiple days timber production for onward transfer.
Both of the above options would require signalling works. It is possible (but unlikely) that the interlocking associated with the former goods yard remains in Ba rrhill signal box and could be reinstated. It is more likely however that new works would be required. The most expedient way of achieving this would be to have manually controlled points within the loading facility and a either a ground frame (with electr ic release from Barrhill signal box), or a motorised point controlled directly from Barrhill signal box. Additional shunt signals may also be required to allow the locomotive working timber trains to change ends, because as noted above the current layout at Barrhill does not fully permit bi directional use of each loop line.
The arrangements proposed above are not dissimilar to those in use at other small freight facilities across the UK. If the proposal were to be developed early engagement with Network R ail over signalling issues would be recommended to understand the complexity of upgrading and enhancing signalling at Barrhill. Assuming that regular trains carrying significant volumes of timber were to be operated then a fixed location loading point that allowed full train loads to depart would be the most appropriate solution.
An alternative option, already used in both Scotland and Wales, is running line loading, whereby the train is loaded while waiting on the running line bet ween other services. This provides increased flexibility in loading the train as it can be undertaken at any point where suitable access is available to the railway.
The requirements for a running line loading site are more limited than a fixed loading fac ility. The principal requirement is a small area of hardstanding where timber lorries could arrive and load. Without significant storage space either the amount of timber transferred to each train would be limited or a convoy of road vehicles would need to be close by at the time the train arrived.
At a number of locations, it is possible to access the railway from forestry roads and as such further reduce the impact on the surrounding road network. Depending upon the equipment used in the forestry operati ons, it may be possible to remove dependency on road haulage completely and use internal equipment to transfer the timber to the loading pad and onto the train.
Running line loading would reduce infrastructure requirements, with trains arriving from the no rth, loading at site, before heading south to the nearest passing loop (in this case Glenwhilly), where the locomotive would run round the train before returning north.
With a low frequency passenger service, it may be possible to conduce such operations between passenger services. The alternative of night time operation on this route is unattractive due to the costs associated with staffing signal boxes.
A number of other possible locations have been identified, although these would be subject to detailed inspection for suitability. These are shown in Figure 2-5, and include a site just south of Barrhill station, where loading could either be undertaken in a siding as discussed in Section 2.2 or on the running line, and two sites further to the south which may be suitable for running line loading, both located adjacent to forestry roads.
The two sites located adjacent to forestry roads would enable the transpo rtation of timber with minimal impact upon the public highway network, and potentially reduced land acquisition costs for any facilities required. Dependent upon operational requirements it may be possible to use all sites for loading, minimising the land required at any individual site, and the distance timber must be transported to the nearest loading facility, further reducing emissions.
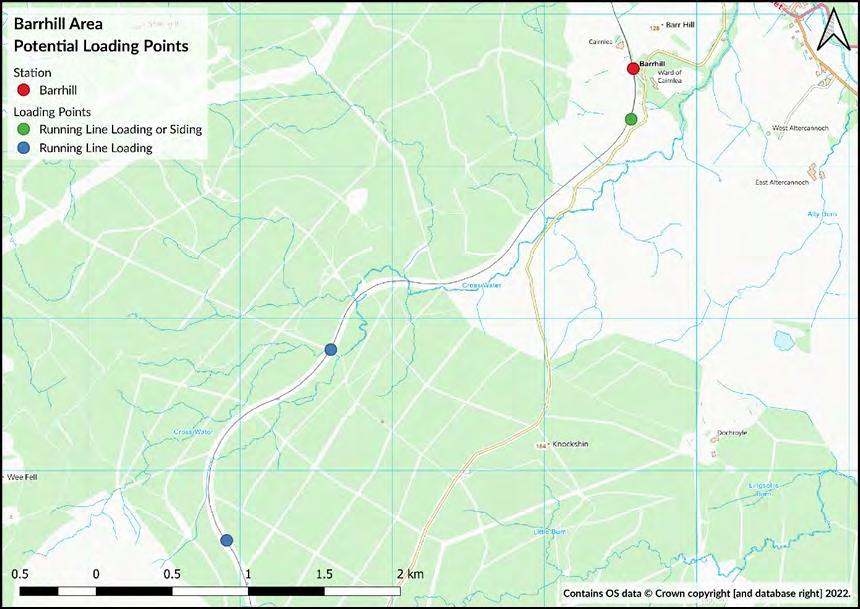
Whilst a low cost option, running line loading does present a number of challenges:
• Running line loading is dependent upon the timetable, with little margin for error, and would also be dependent on the timing of passenger service on the line, with the risk that late running of timber loading impacts on passenger services across the day . Additionally, there is risk of late running passenger operations causing further pathing issues to the timber service
• As highlighted above night time operation on this route incur si gnificant additional operating costs
Timber traffic has existed for many decades on the UK rail network, although there has been something of a resurgence in recent years.
In South West Scotland, Cumbria and Northumberland timber is road hauled to Kingmoor Yard six days a week, with a daily rail departure to Chirk Kronospan. Loading at Kingmoor appears to be undertaken using lorry mounted grabs on the incoming timber lorries split across two sidings, with shunting taking place prior to departure to form a full length service.
Trials at Georgemas Junction on the Far North Line in 2020 made use of a siding facility at the junction to tranship the timber from lorries onto trains which were then taken to Inverness for shipment onto a local mill facility, although the mill is investigating installing a dedicated railhead at the facility.
Figure 2-5: Potential loading sites in the Barrhill areaThe Georgemas Junction trials have led to a further project in Scotland at Altnabreac (Far North Line) focused on using running line loading to avoid the need to take th e heavy timber lorries onto the public highway network. Three trains per week are envisaged for this flow.
In March 2005, trials were undertaken transferring timber from Aberystwyth to Chirk using British Rail MultiPurpose Vehicles sandwiched around timber wagons forming a freight multiple unit, with loading taking place on the running line, with loading completed in approximately 90 minutes with 3 lorries delivering the supply.
The Aberystwyth services have recently began operating again, however this ti me operating as larger loco hauled trains, hauling approximately 800 tonnes of timber from a facility adjacent to the town’s railway station, using a lorry mounted claw to load the service, removing the requirement for permanent facilities to be built.
Further timber trains operate from Baglan Bay in South Wales transporting locally felled timber north through Wales to the Kronospan facility at Chirk, and from Exeter, again transporting locally felled timber to Kronospan Chirk.
Two approaches for providing timber loading points in the Barrhill area have been explored. Each has contrasting strengths and weaknesses. A fixed loading point provides a higher capacity more permanent solution which can serve a wider area, whereas running line loading provid es a lower cost solution suited to less frequent movements serving a limited catchment.
Having explored options for timber loading points the note now moves onto exploring train operations. Within this note estimates of the potential demand for timber trains before exploring destinations, operations and the environmental benefits associated with mode shift to rail are set out
Timber flows from the Barrhill area have been identified using TMfS18 (Transport Model for Scotland 2018) using the 2030 ‘Without Policy’ Reference Case and using research into existing rail based timber flows and potential customers in the Scotland area.
From the TMfS 2030 Reference Case model flows from the Barrhill zone were identified for the AM, IP, and PM periods, and annualised using figures from TN013 – Derivation of Annualisation Factors (Car Driver + PT) (AECOM, 2020) to produce indicative yearly HGV movements from the Barrh ill zone. The annual HGV movements were assumed to be proportional to the employment characteristics of the area, and as such 10.75% of the movements were assumed to be timber lorries based on information from planning data used in the model development.
An average lorry load was assumed for each HGV movement assigned to timber transportation, and as such an indicative annual weight of timber was produced, and in turn factored in 42.5t rail wagon loads for rail transportation.
Using the number of wagons es timated per year it has been possible to identify the number of trains required per day across various operating profiles, where there is excess demand not capable of forming a completely new service it is assumed that this will be absorbed by limited numb er of local uses and road based haulage.
In the standard scenario it has been assumed that the average timber lorry will transport approximately 25t of timber, and as such this has been used to calculate the operational requirements of th e proposed trains.
3.2.2.1
A low level of demand test was undertaken using the assumption that the average timber lorry in the Barrhill area is transporting 19t of timber, and as such produced the following train requirements.
Even in a low demand scenario, there is still scope for 3 to 4 services per week, which a well-designed timber loading facility could accommodate as required.
A high level of demand test was undertaken using the assumption that the average timber lorry in the Barrhill area is transporting 27t of timber, and as such produced the foll owing train requirements.
While a high demand scenario does not result in the creation of additional services, it is assumed that any excess timber that is not transferred by rail will be sold locally via road haulage or used to infill fluctuations in the timber supply throughout the week.
UPM Caledonian is located approximately 34 miles direct from Barrhill at Irvine, and is rail served, although currently receiving timber via road. It is noted that currently UPM Caledonian is receiving and dispatching other materials by rail and places a focus on using locally sourced timber where possible, with 70% of the 2021 timber sourced from Scotland, and the remainder from Europe.
Auchengate Sawmill is located immediately south of UPM Caledonian, again approximately 34 miles direct from Barrhill, and receives paper through the Scottish TimberLINK scheme from the Port of Troon by road. Although significantly smaller than UPM Caledonian, Auchengate is immediately adjacent to the UPM Caledonian exchange sidings.
Timber from the South West Scotland area is transported by road to Carlisle Kingmoor Yard, situated adjacent to the West Coast Main Line, where it is combined with timber from the North of England for onward transportation by rail to Kronospan (Chir k).
Kronospan (Chirk) is a large consumer of rail delivered timber, with deliveries from Carlisle in North West England, Baglan Bay in South Wales, Aberystwyth in West Wales, and Exeter in Devon pathed 5 days a week, with some paths available on Saturday.
Within Scotland it is proposed that timber deliveries to UPM Caledonian could be undertaken by rail replacing existing road based deliveries, with access to the timber yard possible from the existing railhead at the facility.
Caledonian Paper Irvine has additionally recently begun operation of a CHP plant, which although currently burning forestry harvesting residues and pulp and paper mill sludge it may be possible if required to fire on biomass sourced from South Ayrshire and Dumfries and Galloway.
Immediately south of UPM Caledonian is Auchengate Sawmill, also served by the rail spur to UPM Caledonian. Currently Auchengate is receiving timber from the TimberLINK facility at the Port of Troon by road, although it would be poss ible with minimal additional infrastructure for timber to be delivered by rail from the Barrhill area.
Although outside the scope of this project, it may be possible to transfer TimberLINK from the Port of Troon to the Port of Ayr and use the Ayr Harbour branch to undertake timber movements from this location, in conjunction with the service from the freight facility at Barrhill, which would further increase the timber by rail market in South West Scotland.
Timber from the South Ayrshire a nd Dumfries and Galloway area is currently transported by road to Carlisle with onward transportation by rail to Chirk. It is proposed that this timber is moved instead by rail to Carlisle and onward to Chirk.
As mentioned in above there are operational requirements which will need to be considered in the formation of the services, including loop length and route availability. Based on evidence of high route availability (RA) locomotives at Stranraer in recent year s, it is assumed for the purpose of this note that the route availability issues can be mitigated though local operational adjustments and that it will be possible to utilise a locomotive and rolling stock with a higher route availability on this service.
It is envisaged that the service will require shuttle working between Falkland Yard and the timber loading facility at Barrhill, with a limit of approximately 15 wagons per shuttle dependent upon the exact layout of the facility at Barrhill.
Operations will be constrained by signal box opening times, reducing impacts upon residents within the Barrhill area, and the availability of paths between Dalrymple Junction and the facility at Barrhill.
It is proposed that there will be two shuttles each day, five days a week, between Falkland Yard and Barrhill, allowing formation of one longer service onwards from Falkland Yard. Shuttles will operate in the existing gaps between passenger services, with the loading facility shunt procedure occurring in Barrhil l station loop.
It is proposed that the rail service operates between the timber loading facility at Barrhill and the Falkland Yard at Newton-on-Ayr, where both portions can be joined, and if necessary for onward distribution the train can be remarshalled. This may involve the removal of portions for UPM Caledonian and Auchengate Sawmill.
From Falkland Yard it is proposed that the service is routed to Carlisle Kingmoor Yard via Kilmarnock or via Mauchline Jn, dependent upon both operational constraints at Falkland Yard and pathing constraints enroute. If operating via Kilmarnock it may be possible to route via UPM Caledonian and Auchengate Sawmill to deposit loaded wagons for these facilities. UPM Caledonian operate a local shunter, and as such will not require an additional locomotive for shunting operations locally.
Dependent upon demand from consumers, and supply from other forestry areas distribution onwards from Carlisle Kingmoor Yard can either make use of the existing services available, or new flows introduced where required.
The impacts estimated below have been produced assuming all timber is sent to Carlisle Kingmoor Yard, as this is assumed to be the largest flow from the South Ayrshire and Dumfries and Gal loway areas, with an existing rail flow from Carlisle Kingmoor Yard to Kronospan Chirk being well established. The impact assessment has not considered the flow south of Carlisle Kingmoor Yard as this is already an established rail based flow.
While shorter flows within South Ayrshire have been considered above, the impacts assessment has focused on Barrhill – Carlisle Kingmoor Yard as the most likely scenario. It is considered that other flows will result in proportionally comparable results.
The route between Barrhill and Carlisle Kingmoor Yard contains a mixture of both 25KV AC electrified, and unelectrified sections, and as such it may be possible to make use of bi -mode locomotives, including the Class 88 or Class 93 (current on order for a fre ight operator), on electrified sections reducing the emissions impacts of these services.
The electrified infrastructure is in two sections between Barrhill and Carlisle Kingmoor Yard – these being Ayr to Barassie Junctions (7 miles 59 chains) and Gretna J unction to Carlisle Kingmoor Yard (7 miles 7 chains), with the remainder of the route being unelectrified. While it would be possible to undertake the journey from Ayr to Carlisle Kingmoor Yard on entirely electrified infrastructure, this requires operatio n via Paisley Gilmour Street, adding approximately 80 miles when compared to the route via Mauchline Junction. In any case obtaining train paths this route and the West Coast Mainline would be extremely challenging. Emissions have been calculated, using the 2022 UK Conversion Factors for Greenhouse Gas Reporting, for both road and rail, with routes via Kilmarnock and via Mauchline Branch. This assumes 100% load on all journeys, which is assumed to be achievable due to the high density of freshly cut timber in the area. While these emissions factors do not consider empty journeys to and from the depot, the net impact of these is likely to be minimal.
As can be seen in Table 4-1, when operating with purely diesel traction the reduction in CO2e is substantial, with rail freight operation saving over 3 million kilogram CO2e compared to moving the equivalent load by HGV. This in spite of longer routing for rail services via Ayr rather than the more direct road via Newton Stuart.
Using data from TAG A3.4 the value of the CO2e has been calculated and shows a saving of in excess of £7.9 million (discounted present values in 2010 prices) for both routing options when compared to road over a 30 year appraisal period. Assuming rail has a similar operating cost to road this would support investment in facilities of up to £7.9 million (discounted present values in 2010 prices ) whilst still delivering a benefit cost ratio of 1.0.
The Scottish Government has significant electrification plans, including electrification of the Glasgow South Western Line via Kilmarnock to Carlisle, and the line between Kilmarnock and Troon by 2035, and as such sensitivity tests have been undertaken to investigate the potential CO2e emissions of using bi-mode locomotives on the proposed service to Carlisle Kingmoor Yard, making use of this enhanced infrastructure. A sensitivity test, presented in Table 4-2, was undertaken assuming the use of bi-mode locomotives, capable of using 25KV AC overhead electric where available. When routing via Kilmarnock this includes the route between Ayr and Carlisle Kingmoor Yard. When considering routing via the Mauchline Branch electric operation is only considered between Mauchline Junction and Carlisle Kingmoor Yard. The bi-mode sensitivity tests highlights that there ar e savings at point of use in CO2e when using bi-mode traction.
As can be seen in Table 4-2, the use of bi-mode locomotives where available would result in significant CO2e savings compared to road based haulage, and although outside the scope of th is project the use of a bimode locomotive between Carlisle Kingmoor Yard and Chirk Kronospan would allow for further emissions savings when compared to the current use of diesel locos.
As above, using data from TAG A3.4 the value of the CO2e has been calculated for use of bi-mode traction, based on an electrification year of 2035, and shows a saving of in excess of £13.6 million ( discounted present values in 2010 prices) for both routing options when compared to road over a 30 year appraisal period. Assuming rail has a similar operating cost to road this would support investment in facilities of up to £13.6 million (discounted present values in 2010 prices ) whilst still delivering a benefit cost ratio of 1.0. It is important to note that this assumes the re duced carbon emissions from use of a bi-mode locomotive are only realised in 2035, 10 years into the 30 year appraisal period - until this point emissions are based on a diesel locomotive.
One of the key drivers behind the mode shift from road to ra il is the reduction in vehicle miles per year, especially in South Ayrshire and Dumfries and Galloway where due to the nature of the road network timber
extraction places undue demand on roads which are not typically designed for intensive use by heavy goo ds vehicles.
As can be seen in Table 3-1 there are currently estimated to be 13,260 two-way HGV trips per year from the Barrhill area to Cumbria totalling approximately 2.69 million miles per year, the removal of which will have significant impacts for local communities and the local environment , including the removal of road-side emissions and traffic congestion, along with significant road safety benefits.
The use of a dedicated timber loading facility at Barrhill may result in a lower demand for road haulage operators in the surrounding area due to decreased journey times between the forestry and the freight loading facility, although this will be offset by the requirement for operational staff at the proposed freight loading facility in Barrhill, and increased demand for rail opera tional staff on the new flow.
The proposed operation of a timber loading facility and associated rail based timber flows would bring significant benefits to the South West of Scotland, and the increased throughput may in turn unlock further timber extraction opportunities.
Although there is a requirement for investment in infrastructure, a rail freight service would make a very substantial contribution to reducing the carbon impacts of timber haulage, as well as reducing the number of HGV using rural roads.
More work would be required to develop the proposals further with initial tasks being to:
• Undertake an engineering feasibility study of the Barrhill site
• Engage with Network Rail over signalling issues
• Undertake timetable development work
• Engage with the forestry and timber industries to validate demand estimates
• Explore the commercial viability of the service in more detail
• Explore the impacts of a new rail line on freight links between Stranraer and D umfries
A75 GRETNA-STRANRAER
A77 AYR-STRANRAER STRATEGIC AND ECONOMIC IMPACTS
Systra has been requested to review the opportunities for transporting freight by rail to and from the ports at Cairnryan. Achieving this requires the development of a suitable transhipment facility, and operation of a new rail freight service. The objective of this would be to deliver mode shift from road to rail for the transfer of freight for onward shipment to Northern Ireland.
Within this note options for the development of the freight facility, the associated limitations and the operational issues associated with operating a new service, likely markets and quantify the environmental benefits of mode shift from road to rail are explored
The central conclusion is that generating significant mode shift from road to rail would require considerable investment in both road and maritime infrastructure and would also be likely to require a wider shift in the economics of freight traffic on this corridor to favour rail traffic.
The ports at Cairnryan currently offer multiple daily sailings to Belfast (Stena Line) and Larne (P&O Ferries) in Northern Ireland, with over 5.8m tonnes of road freight passing through both ports in 2021. The current shipping service is based on the use of roll on roll off style ferries with shared passenger and freight accommodation, with freight traffic being either via accompanied or unaccompanied trailers rather than containers.
As the closest ports to Northern Ireland, with 2 hour sailings possible, and the only ports serving Northern Ireland in Scotland, Cairnryan is a critical piece of infrastructure in the link between Great Britain and Northern Ireland. Going forward as there is a need to decarbonise transport more sustainable alternatives to road haulage need to be considered. Further to this the nature of the road netw ork in the surrounding area is not currently suitable for increasing levels of traffic to and from the ports.
As part of the Union Connectivity Review (Department for Transport, 2021) it was highlighted there was a need to improve the A75 link, with 2 in 3 of all HGV trips from Cairnryan travelling onwards towards England. Estimates derived from a combination of the Transport Model for Scotland (TMfS18) suggest that a total of around 156,000 HGV movements each year are associated with traffic from the termi nals at Cairnryan.
The rail line between Ayr and Stranraer is a predominately single track route, served in the May 2022 timetable by six return passenger workings each weekday, from Ayr and Kilmarnock (the first northbound service continues to Glasgow Central, although there is no corresponding southbound working). On a Sunday the service is reduced to five passenger workings to and from Ayr. There is currently no freight traffic on the route, with the only schedu led non passenger working being Rail Head Treatment Trains (RHTT) operating in Autumn to help maintain adhesion on the route. Passenger services are currently operated by ScotRail using Class 156 DMUs.
This relatively light usage of the line means that the re is capacity to operate freight subject to paths being retained for existing passenger services.
The line contains five passing loops, all controlled by local signal boxes. There is an additional signal box at Stranraer station, however this is only ope ned when required to accommodate the rare occasions that more
than one train is in Stranraer station. The route is open for traffic originating from Ayr from around 0530 to Midnight. Operation of any services overnight would incur significant costs as it w ould require the opening hours of signal boxes to be extended, with an attendant increase in staffing costs.
There are currently speed differentials along the line for multiple unit trains. Freight traffic would therefore have to travel at lower speeds than passenger trains. The Network Rail Sectional Appendix also shows that the route is currently restricted to Route Availability 5 (RA5). This limits the route to being used by locomotives and rolling stock with a low axle loading. This restriction may be a recent development relating to the condition of structures on the route as evidence exists of locomotives that exceed RA5 limits reaching Stranraer.
Other routes in Scotland have similar restrictions but locomotives that exceed RA5 have speed restriction s over certain structures. Currently the line between Falkland Junction and Stranraer is only gauge cleared to W8 standard, which may preclude the use of hi-cube containers on the route. While pocket wagons may be an option this would result in a reduction of available capacity. Addressing gauge clearance for containers on this route may be complicated by a number of single track tunnels. An early action in considering container traffic on the route would be to discuss this issue with Network Rail.

Stranraer station (Figure 1-1) is located around 41 miles south of Ayr, although due to railway geography it is approximately 59 miles by rail, at the southern end of the Loch Ryan within the Dumfries and Galloway local authority area. The station has two platforms, although only Platform 1 is accessible for passenger use. The station is controlled by Stranraer Harbour Signal Box, although this is only opened when required, wit h regular operation controlled by Dunragit Box using one train in section working. In the May 2022 timetable multiple trains are not scheduled to be in the section at one time.
Stranraer station contains two lines approved for passenger operation, and two goods sidings between the platforms. It is possible to run around a train from both the east goods siding and Platform 2 using the other line (i.e., a train in Platform 2 could be run around using the east goods siding and vice versa). It is currently not possible to run around a train stood in Platform 1 or the west goods siding. As currently configured, the
Figure 1-1: Location of Cairnryan and Stranraer stationtrack layout at Stranraer station would not be conducive to the operation of a freight terminal and would require reconfiguration before freight operations could begin.
The ports at Cairnryan are currently not rail served, although historically the area was served by the Cairnryan Military Railway. While this has since been removed, and in places built upon, the rural nature of the surrounding area means reinstatement may be possible though would be costly.
While more detailed work would be required to explore some of the issues above, the r oute does provide the scope for operating freight trains within the existing infrastructure, with investment being required in the development of a freight handling facility, and if necessary new track to the ports at Cairnryan.
There are two approaches to providing freight loading facilities. The first approach is to develop a dedicated rail / maritime terminal, removing the freight handling requirement from the existing terminals, and allowing the operation to be operated separately to that of the passenger service. The second approach is to consider combined freight / passenger operation at Cairnryan, making use of one of the existing port facilities in conjunction with the reopening of the Cairnryan Military Railway. The opportunities for both options are explored below. The requirements for a loading facility would be as follows:
• The site would need suitable access for both road and rail, and appropriate level hardstanding with space for transhipment from ship to rail, and if required road vehicles. It is important to note however that using this operating principle means activity at the site would be concentrated at the train loading / unloading line, which may cause issues in scheduling both the rail and shipping se rvice
• An alternative to this would be provision of storage facilities at the terminal, which would allow for the short-term storage of containers between rail and ship arrivals. Additionally, this would require additional resources to move containers between the dockside, container stack and railhead. This approach would provide greater flexibility for both the rail freight operating companies and the maritime service
• Should night operations be considered, it would be necessary to provide appropriate site l ighting facilities to enable safe operations and potentially acoustic protection for nearby residents and businesses
It is assumed that a dedicated vessel would be required for load -on load-off operations, as the current roll-on roll-off ferries would not be suitable for container traffic. While P&O have historically operated vessels of this nature, this is not something that has been operated by Stena Line. Limited investigations have been undertaken into the requirements of such a vessel, and it is believ ed that a suitable design of vessel may be available, although detailed investigations would be required to identify the full vessel requirements. There is a likelihood that should a dedicated freight service commence operation, market forces will reduce the demand on one of the existing services. This may either result in the withdrawal of one of the services, or alternatively the co-location of both operations from one terminal, allowing for a terminal to be repurposed for a dedicated container service.
It would be possible within Stranraer to use the existing rail served pier, previously utilised by Stena Line. Currently Stranraer station is located at the north end of the pier, although inconveniently located for the town centre. This site consists predominantly of concrete hardstanding, with the rail connection to the station along the east side of the pier. Figure 2-1 highlights the existing layout of the pier.
It would be possible to accommodate two sidings, each of around 500m length on t he site and accommodate container storage in the pier area, while maintaining access for a run around loop. The site does however have a number of limitations including:
• While Stranraer could accommodate trains up to 500m in length, the existing infrastruc ture on the line would provide a constraint to this, with the exception of Dunragit loop, no other loops on the line south of Ayr can accommodate a train of that length. Dunragit loop however is not practical for regular use by passing trains due to the location of Dunragit Level Crossing
• Road access to the site is through Stranraer town centre, which may cause concerns with local residents and businesses
• The existing station would require relocation, although this would be an opportunity for the station to be located in a more central location within Stranraer. A suitable site exists at the former Stranraer Goods yard, still in railway ownership
• The depth of Loch Ryan close to Stranraer may be a serious constraint to this option. Stena withdrew from Stranraer as the approach to Stranraer Harbour was routinely too shallow for the larger vessels required to operate the service economically. This issue may recur with this proposal and would need early examination
An alternative option is the development of a freight loading facility at either the Stena Line or P&O Ferries terminals at Cairnryan, indicated on Figure 2-2
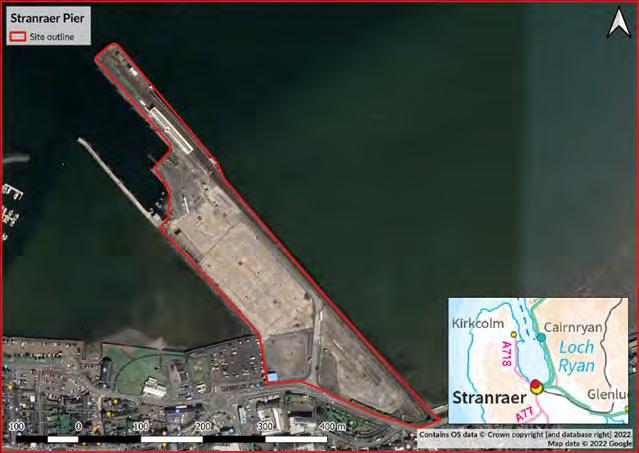 Figure 2-1: Location of Stranraer pier and site outline, including location within Loch Ryan
The land surrounding these terminals is steeply sloping, and both sites are constrained by the A77 road so limited opportunities exist at either terminal. The A77 has been situated in places directly on the alignment of the Cairnryan Military Railway, and as such a new route would be required. Due to the nature of the land, a number of embankments / cuttings would be required which would increase the land required, along with a number of buildings which may require removal or relocation as part of the construction process.
The Cairnryan Military Port was situated approximately half -way between both the Stena Line and P&O Ferries terminals and was served by the Cairnryan Military Railway. The railway alignment however extends to approximately the vicinity of the Stena Line terminal, due to the previous existence of railway buildings in this location.
Access to both terminals by rail would involve crossing the A77, approximately on the level, necessitating use of a level crossing. An alternative option may be possible, whereby the A77 is crossed by bridge, and the train loading / unloading area at the port is accessed by crane / telehandler, alth ough construction of this would incur increased cost.
P&O Ferries would be able to accommodate two 175m sidings within the footprint of the existing freight facilities, although space for storage of containers would be severely constrained while allowing regular operations to continue. Additionally, this would severely constrain the ability of P&O Ferries to accept roadbased freight from the terminal.
While two sidings at P&O Ferries terminal would only accommodate a maximum train length of 350m, the minimum loop length on the single-track section south of Ayr is only 340m. Assuming a path can be found which allows for passing of the passenger service non -stop, the maximum load accommodated at P&O Ferries terminal would be 24 40ft containers.
Stena Line at Cairnryan may be capable of accommodating two sidings of approximately 250m within the footprint of the existing freight handling facilities, with storage for a limited number of containers onsite. Again, as with P&O Ferries, this would constrain the ability to continue to handle road-based freight.
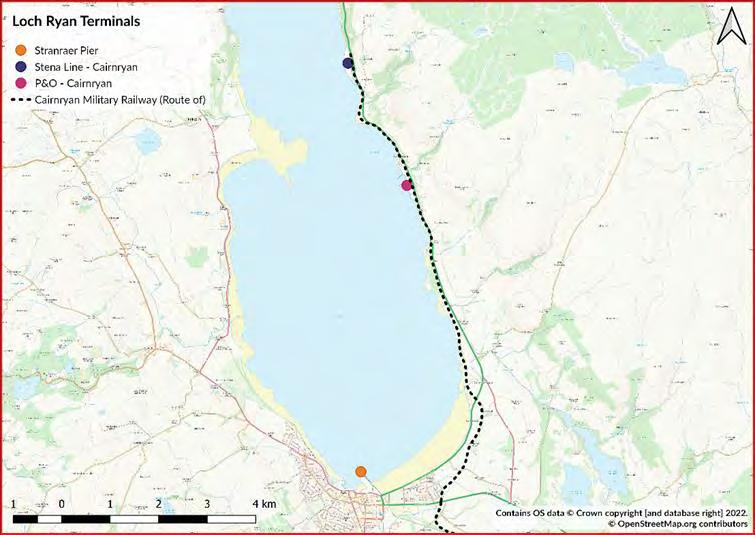 Figure 2-2: Loch Ryan marine terminals
The docking arrangements at Stena Line terminal may not be conducive to use of a container crane to lift the containers on and off of a vessel due to the presence of an enclosed passenger walkway alon g the length of the pier.
Two sidings of 250m each at Stena Line would accommodate approximately 35 40ft containers per service, although again the same pathing constraints would be experienced on the journey between Ayr and Cairnryan.
All siding layouts considered at P&O Ferries and Stena Line are dead ends and would require provision of either a run-around loop in the vicinity of the terminal, or a locomotive at each end which would increase not only operational costs, but additionally limit available cap acity.
Expansion of either terminal would require significant infrastructure works due to the surrounding geography, with Loch Ryan providing the constraint to the west, and the A77 and steeply graded land to the east. While it may be possible to undertake land reclamation to expand either facility, this would require early consultation with specialists in this field.
While maintaining the existing passenger operation unchanged, the use of the terminals at Cairnryan does pose some challenges:
• Very significant capital investment would be required between Stranraer and the terminal at Cairnryan, including earthworks, and permanent way
• Access to either terminal would be required across the A77, potentially at significant cost dependent upon the chosen option
• Conversion of either terminal at Cairnryan to a railhead would result in loss of available space for existing road-based freight operations. While it is assumed a rail-based service would operate to replace some level of this road freight, it is considered l ikely that this will not fully replace all roadbased movements
If regular trains carrying significant volumes of freight were to be operated from Loch Ryan, a dedicated freight loading point that allowed full length trains, and storage to be accommodated would be the most appropriate solution.
To develop a rail served container base at Cairnryan would require one of the two current operators to alter their business model and focus on containers with the other dealing with the remaining Ro -Ro traffic. For this to be commercially attractive would require a sufficient volume of containers to be arriving by road and rail.
Container traffic has existed for many decades on the UK rail network, with many flows existing throughout the country, including within Scotland.
The Port of Felixstowe moves approximately 1,000,000 Twenty -foot Equivalent Units (TEU) of container traffic per year via rail, with 60% of traffic from Felixstowe destined for the North and West Midlands moving by rail. Approximately 78 daily services depart from the three terminals at Felixstowe, with 5 daily roundtrips to Manchester alone.
The Port of Southampton has the capacity to handle approximately 180,000 TEUs per year, with seven daily departures, again with multiple services to the North of England.
Teesport in Teeside offers 25 weekly departures to a range of destinations around the country, and offers services tied to ferry arrival and departures, allowing for rapid onward transportation without containers waiting on the quayside.
Until the late 1980s container traffic was moved to Irish Seaports by rail, but the economics of such flows were unsatisfactory, and they were withdrawn, volumes on these flows being much lower than at the major terminals described above.
The note explores two approaches for providing container loading points in the Loch Ryan area. Each has contrasting strengths and weaknesses. A dedicated loading facility provides the opportunity to configure the site for the railhead, instead of attempting to ac commodate it on an existing site, and if located in Stranraer
would allow the site to be developed without requiring significant new railway construction. Using a terminal at Cairnryan would allow an existing marine facility to be served but would require the reconstruction of the Cairnryan Military Railway.
In both cases considerable investment would be required in terminal and rail facilities.
Having explored options for container loading points the note now moves onto explore container train operations. Within this note the approach to estimating the demand for freight trains before exploring destinations, operations and environmental benefits associated with mode shift to rail is set out
Freight flows from the Cairnryan terminals have been identified using TMfS18 using the ‘without policy’ 2030 Reference Case and research into existing rail based freight flows.
Using the TMfS18 2030 Reference Case model, flows from the Cairnryan Port zone were identified for the AM, IP, and PM periods, and annualised using figures from TN013 – Derivation of Annualisation Factors (Car Driver + PT) (AECOM, 2020) to produce indicati ve yearly HGV movements to and from the Cairnryan Port zone.
It is assumed that each HGV will translate to approximately one 40ft container, as a 44t articulated vehicle has approximately the same payload capacity as one 40ft container. This was in turn u sed to calculate rail wagon loads for rail transportation.
Using the number of wagons estimated per year it has been possible to identify the number of trains required per day across various operating profiles.
In the standard scenario it has been assumed that the main flow will be from the West Midlands , as the cost and time involved in transhipping between road and rail is typically absorbed through journeys of this length. This area is also a major logistics centre which already genera tes a number of rail flows including towards Scotland. It has additionally been considered that any flows from the South West would be captured due to the route to Stranraer passing directly through the West Midlands.
While 24 containers is a relatively short formation, the high level of excess demand experienced over weekday only operation suggests there would be scope to lengthen this should a suitable path be found.
A high level of demand test was undertaken assuming a flow from the North East, Yorkshire, and the Humber as TMfS18 indicates a large flow between these areas and the port at Cairnryan. There are several intermodal terminals in the Yorkshire and Humber area which would be suitable for the operation from Yorkshire and the Humber. As the nearest intermodal terminal to Tyne and Wear and County Durham is at Middlesbrough it has been assumed that this traffic will move from here as a joint flow with Yorkshire and the Humber
A high demand scenario results in the creation of an additional three services each day in a 24-container configuration, and two additional daily services in a 30 container configuration. Were this to be combined with the flow from the West Midlands this results in a potential of up to four trains a day in each direction.
A sensitivity test of major mode shift undertaken based a mode shift of 50% of all HGV flows to and from the terminals transferring to rail. For this sensitivity test Port and domestic waterborne freight statistics (UK Government, 2022) data was used for both Cair nryan terminals from 2021 to ascertain the number of HGVs per year operating through both ports.
As can be seen in Table 3-3, assuming a major mode shift of 50% of all HGV traffic to rail, this would result in the demand existing to run between eleven and fourteen trains per day (approximately 330 containers) resulting in a significant reduction in the number of HGVs to and from the port.
It is proposed that services would predominantly operate from the terminal to destinations within England, including the West Midlands and Teeside. These have bee n identified as having the biggest flows within their zone, although it is recognised that some flows may be possible from other destinations.
Smaller volume flows, the South East and London, could operate either on a less frequent basis allowing for better utilisation of paths, or could be operated to a node terminal, for example Hams Hall in the West
Midlands, on existing flows and then combined into long distance flows. It may be possible to operate five trains per week from the South East and London bas ed on demand identified within TMfS18.
While the flows identified result in resulted in up to three trains per day each day (based on modest but realistic mode shift), the expense required to establish a dedicated container service will be consider able and would require significant mode shift to be viable. It may however be possible to use port to port container vehicles to transfer the containers on the existing Ro -Ro vessels which may be a more viable solution but does introduce a transhipment iss ue.
Making use of the existing ferry services would allow for the establishment of the rail freight service without the requirement for a dedicated terminal and vessel, although it would require significant expenditure on restoration of the route of the Ca irnryan Military Railway.
Should the rail flow become well established, further growth may be possible which would further the case for conversion to a dedicated vessel and terminal when appropriate.
As mentioned above there are operational requirements which will need to be considered in the formation of the services, including loop length and route availability. Based on evidence of high Route Availability (RA) locomotives visiting Stranraer in recent years, it is assumed for the purpose of this note that the route availability issues can be mitigated though local operational adjustments and that it will be possible to utilise a locomotive and rolling stock with a higher route availability on this service.
It is envisaged that the service will exceed the majority of loop lengths between Ayr and Stranraer, and as such will require passing the passenger service in a loop. While this may cause some concern should either service be late running, it would be possible to add dwell time at an appropriate location prior to entering the single track section at Ayr, something which is common operating practice for freight workings.
Operations will be constrained by signal box opening times, and the availability of paths betwe en Dalrymple Junction and the marine facility, with the line currently being closed overnight.
It is proposed that the rail service operates directly between origin and destination with minimal remarshalling on route. This is due to the requirement for a competitive service to be provided when contrasted to road operations.
When considering splitting flows to different destinations, for example between London and the South East it may be desirable to operate the entire service to either terminal, as both terminals are now capable of accommodating longer 775m trains and remarshalling the containers for the other terminal into an interterminal flow.
Where smaller subsidiary flows are identified it may be possible to operate these using a hub and spoke distribution model and existing inter -terminal flows where appropriate, although this in itself implies an increase in containerised rail freight more widely.
The impacts estimated below have been produced assuming that f lows that are transferred to rail were previously heading to similar logistics hubs to those that the rail service would originate from. While this does not reflect the fact that a road-based flow will operate direct to the end destination it is assumed ap propriate as the road based trips to destinations prior to the intermodal terminal will be offset against destinations beyond the terminal.
This assessment additionally does not consider “last mile” haulage; however, this is considered minimal due to the distances involved, and the potential to use electric vehicles for these shorter distance journeys.
While the line south of Ayr is unelectrified, the route north of Ayr is electrified, which via the East and West Coast Main Lines, provide electrified routes across central Scotland and towards England. Going forward it will be possible to make use of bi-mode locomotives, including the Class 88 or Class 93 (currently on order for a freight operator), on electrified sections reducing the impacts of these services.
For services towards the West Midlands, the West Coast Mainline (WCML) would be most suitable which is electrified in its entirety. Accessing the WCML from Stranraer would most likely require use of the Glasgow South Western Line via Kilmarnock. Electrification on this route is currently minimal with only Ayr – Barassie Junctions (7 miles 59 chains) electrified. Beyond Gretna Junction the entire route is electrified (excluding access to terminals). While it would be possible to undertake the journey from Ayr to Gretna Junction on entirely electrified infrastructure, this requires operation via Paisley Gilmour Street, adding app roximately 80 miles when compared to the route via Mauchline Junction. In any case obtaining train paths this route and the West Coast Mainline would be extremely challenging.
Emissions have been calculated, using the 2022 UK Conversion Factors for Greenho use Gas Reporting, for both road and rail, routed via Kilmarnock. This assumes 50% on all journeys, based on all movements consisting of one fully loaded trip, and one empty return trip. While these emissions factors do not consider operational journeys to and from the depot, the net impact of these is likely to be minimal.
As can be seen in Table 4-1, when operating with purely diesel traction the reduction in CO2e is substantial, with rail freight operation saving over 20 million kilogram CO2e compared to moving the equivalent load by HGV. This in spite of longer routing for rail services via Ayr and Kilmarnock rather than the more direct road via Newton Stuart.
Using data from TAG A3.4 the value of the CO2e has been calculated and shows a saving of in excess of £60.2 million (discounted present values in 2010 prices ) for both routing options when compared to road over a 30 year appraisal period. Assuming rail has a similar operating cost to road this would support
investment in facilities of up to £60.2 million (discounted present values in 2010 prices) whilst still delivering a benefit cost ratio of 1.0
The Scottish Government has significant electrification plans, including electrification of the Glasgow South Western Line via Kilmarnock to Carlisle, and the line between Kilmarnock and Troon by 2035, and as such sensitivity tests have been undertaken to investigate the potential CO2e emissions of using bi-mode locomotives on the proposed service to Hams Hall Rail Freight Terminal, making use of this enhanced infrastructure.
A sensitivity test was undertaken assuming the use of bi -mode locomotives, Table 4-2, capable of using 25KV AC overhead electric where available. When routing via Kilmarnock this includes the route between Ayr and Gretna Junction.
The bi-mode sensitivity tests highlights that there are savings at point of use in CO2e when using bi-mode traction. Existing inter terminal freight flows make use of electric traction where available, so there is already established practice in using this traction mode.
As can be seen in Table 4-2, the use of bi-mode locomotives where available would result in significant CO2e savings compared to road based haulage, and although this calculation does not cover the “last mile” road based transfer the emissions from this are likely to be negligible in comparison.
As above, using data from TAG A3.4 the value of the CO2e has been calculated for use of bi-mode traction, based on an electrification year of 2035, and shows a saving of in exces s of £65.2 million (discounted present values in 2010 prices) for both routing options when compared to road over a 30 year appraisal period. Assuming rail has a similar operating cost to road this would support investment in facilities of up to £65.2 million (discounted present values in 2010 prices ) whilst still delivering a benefit cost ratio of 1.0. It is important to note that this assumes the reduced carbon emissions from use of a bi -mode locomotive are only realised in 2035, 10 years into the 30 year appraisal period - until this point emissions are based on a diesel locomotive
One of the key drivers behind the mode shift from road to rail is the reduction in vehicle miles per year. This will be especially evident in Dumfries and Galloway wher e there is already a recognised issue on the A75, caused in part by HGV traffic travelling to the port.
As can be seen in Table 4-1, there are currently estimated to be 18,720 two-way HGV trips per year from Cairnryan to the West Midlands totalling approximately 5.7 million miles per year, the removal of which will have significant impacts for local communities and the local environment, including the removal of road -side emissions and traffic congestion, along with significant road safety benefits.
The movement from road haulage to rail-based transportation may result in lower demand for road haulage operators however, this is likely to be offset as there will still be demand for road haulage for the “final mile” deliveries from intermodal hubs. This will additionally be offset by the requirement for operationa l staff at the port, and increased demand for rail operational staff on the new flow.
The proposed operation of a container loading facility and associated rail -based container flows would bring significant benefits to the South West of Scotland, a nd the increased throughput may in turn unlock further rail-based freight flows.
Although there is a requirement for investment in infrastructure, a rail freight service would make a very substantial contribution to reducing the carbon impacts of HGV haula ge, as well as reducing the number of these using the surrounding highways network.
If a dedicated rail freight facility is established, it would require significant mode shift from road to rail to be viable. It may be possible however to make use of the existing Ro-Ro services and send the containers on unaccompanied port to port dollies, acting in a similar fashion to unaccompanied HGV trailers, while still achieving the ambition of removing HGVs from the road network and assisting in decarbonisation. Th is would however introduce complications with transhipment.
For rail freight to be successful on this corridor it is likely that there would be a need for either a wider change in policy to promote substantial mode shift and/or a change in the economics o f road haulage, driven either by tariffs and taxes or by a rise in the cost of fuel or driver costs. Furthermore, there would need to be a shift form the use of trailers to containers for short and medium distance freight traffic.
More work would be required to develop the proposals further with initial tasks being to:
• Undertake an engineering feasibility study of the Stranraer and Cairnryan sites
• Engage with Network Rail over signalling issues
• Engage with marine specialists over marine operational considerations
• Undertake timetable development work
• Engage with the shipping and haulage industries to validate demand estimates
• Explore the commercial viability of the service in more detail
• Explore other potential destinations, including un-tapped markets which may be released
A75 GRETNA-STRANRAER
A77 AYR-STRANRAER STRATEGIC AND ECONOMIC
Systra has been requested to review the opportunities for a rail freight terminal to be provided near to Ayr, including identification of a suitable site and the works which may be required to achieve this. The objective of this would be to encourage a mode shif t from road to rail for the transfer of freight to and from the surrounding area.
Within this note the options for the development of the freight facility, the associated limitations and the operational issues associated with operating a
The central conclusion is that while there are three potential sites, (one brownfield and two greenfield) each site has challenges which would need to be examined in further detail with relevant stakeholders to understand the extent of the constra ints. The constraints at each site however are not seen as insurmountable, and there is scope to develop a freight terminal in the Ayr area.
Whilst the note has concluded that it is feasible to construct a terminal it is not clear what markets would be served. Some opportunities exist around timber traffic, but other opportunities appear limited, with bulk manufacturers such as the Caledonian Paper Mill having their own sidings.
Historically the Port of Ayr was a major coal export terminal, and the Falkland Yard at Newton-on-Ayr acting as a hub for both the Port of Ayr and various coal loading points in Ayrshire. This has however diminished with the demise of Scottish coal mining, and the reduced demand from power stations.
The line through Ayr forms part of the Glasgow South Western Line, and links Glasgow with Stranraer on the Rhins of Galloway, a branch from Pollokshaws West to East Kilbride, and from Kilmarnock to Carlisle via Dumfries. The Kilmarnock to Carlisle line serves as an important secondary route for freight traffic avoiding the busy West Coast Main Line. Between Stranraer and Dumfries there is a connecting line between Newton-on-Ayr and Mauchline providing a link for freight traffic towards Carlisle and the south.
To the north of Troon, the Ayrshire Coast Line provides an alternative route to Glasgow Central via Kilwinning, which is the route taken by the vast majority of passenger services between Ayr and Glasgow Central.
To the north of Ayr, the line is electrified vi a Kilwinning through to Glasgow Central. Access to the south for electrically hauled freight services is possible via a link from Shields Junction to Larkfield Junction in south Glasgow. It is an ambition of the Scottish Government to electrify the route between Glasgow Central and Carlisle, and between Kilmarnock and Troon, which would result in the creation of an electrified link to the West Coast Main Line at Gretna. South of Ayr the electrification finishes at Townhead Depot, whereby the line reduces to predominantly single track with passing loops at Dalrymple Junction towards Stranraer.
North of Ayr the line is utilised by an average of four trains each way per hour, with occasional additional longer distance services (i.e., Stranraer to Glasgow Central), empty stock movements to avoid excessive platform occupation at Ayr, and intermittent freight movements, although some of these are duplicate paths, and typically not all will operate. Passenger services on this section are operated by a mixture of ScotRail using Class 380 EMUs and Class 156 DMUs.
South of Ayr there are 14 passenger workings each way to Girvan, with six services each way extended to Stranraer, and two retained paths used for Rail Head Treatment Trains in Autumn. Passenger services are currently operated by ScotRail using Class 156 DMUs.
The Network Rail Sectional Appendix shows the route between Glasgow Central, and Ayr is currently cleared to a mixture of Route Availability 8 and 10 (RA8 and RA10). This allows for operation of all classes of locomotive along this line, subject to gauge clearance. Gauge clearance between Glasgow Central and Ayr is capped at W8, although it may be possible, in conjunction with Network Ra il, to identify the limiting factors with a view to upgrades enabling an increased clearance which would allow larger containers to be moved on the route without recourse to low height wagons.
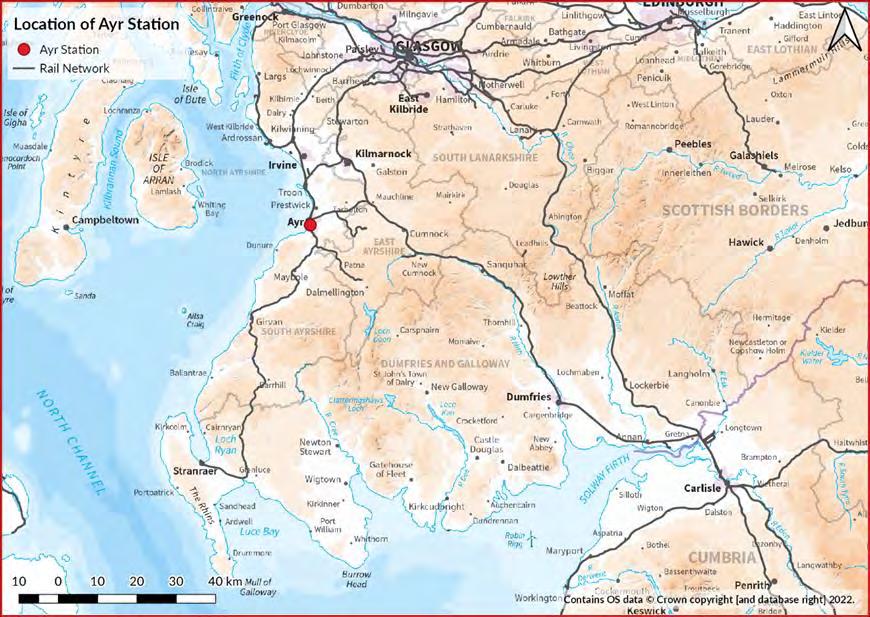
Ayr station (Figure 1-1) is located around 35 miles south west of Glasgow Central in South Ayrshire local authority area. The station has 4 platforms, with 2 north facing bay platforms and 2 through platforms. The local area is controlled by the Ayr workstation at West of Scotland Signalling Centre at Cowlairs.
There are three possible locations for provision of a freight loading facility in the Ayr area, as follows (identified in Figure 2-1):
1. Falkland Yard (located to the north of Newton-on-Ayr station)
2. High Glengall (located to the southeast of Ayr adjacent to Bankfield Roundabout (A77 / A713 / Dalmellington Road))
3. Prestwick Airport
Figure 1-1: Location of Ayr stationThe requirements for a freight facility would be as follows:
• The site would need suitable access for both road and rail, and appropriate level hardstanding with space for transhipment from road to rail. It is important to note however that using this ope rating principle means activity at the site would be concentrated at the train loading / unloading times, which may cause issues on the surrounding road network
• An alternative to this would be provision of storage facilities at the terminal, which would al low for short-term storage of freight, either in containers or as bulk freight between road and rail arrivals. Additionally, this would require additional resources to move containers between the container stack and railhead. This approach would provide gr eater flexibility for both the rail freight operating companies and the road haulage providers
• Should night operations be considered, it would be necessary to provide appropriate site lighting facilities to enable safe operations and potentially acoustic p rotection for nearby residents and businesses
The operation of a viable freight terminal in the Ayr area would depend on a substantial freight flow. Currently the economics of rail determines that the most suitable products for rail transp ort are bulk products or inter-modal container traffic, with the alter requiring critical mass to ensure viability. In the area around Ayr the most likely bulk product would be timber, either via the rerouting of TimberLINK traffic that currently uses the Port of Troon or from forests to the south of Ayr. The other bulk manufacturer in the area, Caledonian Paper at Irvine already has its own rail connection.
The prospects for container traffic are limited, the scale of demand from Ayr and its hinterland wou ld be unlikely to justify full length trainloads each day. Clearly any changes to policy or changes to the differential between rail and road haulage costs will impact on this and could make rail freight more attractive.
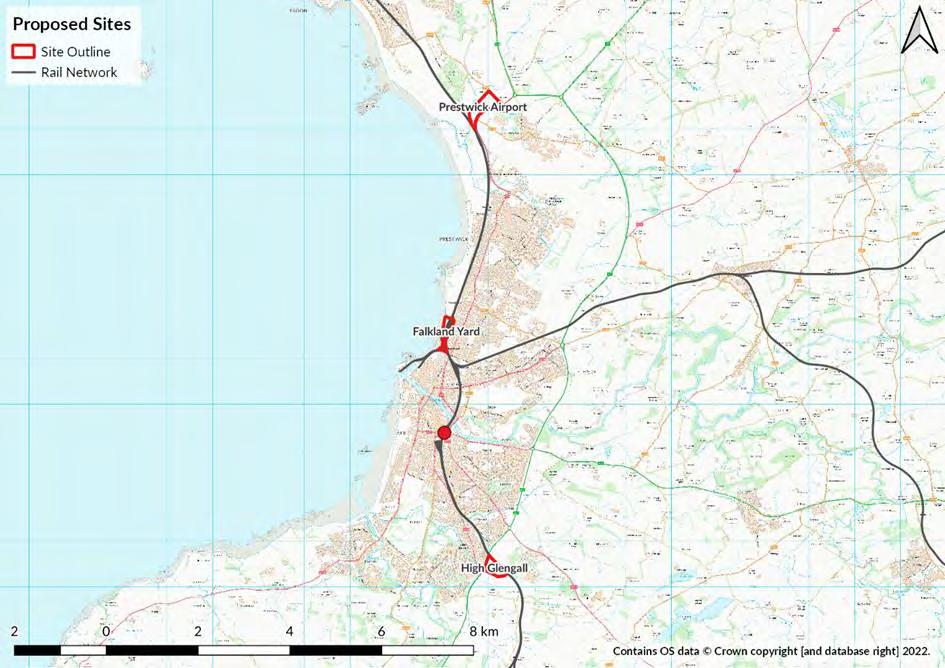 Figure 2-1: Proposed freight terminal sites
The first option is making use of existing facilities at Falkland Yard, located north of Newton -on-Ayr station. Figure 2-2 highlights the extent of these facilities.
This site currently consists of 3 dead -end sidings to the east of the running line, and 2 banks of sidings to the west consisting of 6 dead-end sidings immediately adjac ent to Newton-on-Ayr station, and 3 through sidings and 2 dead-end sidings to the west of this between Promenade and the running line.
Falkland Yard would be ideally situated to operate a freight facility in conjunction with the Port of Ayr, for example the transfer of the TimberLINK operation from Port of Troon to Ayr would allow for a freight facility at Falkland Yard to be utilised for onward transfer of the timber by rail. While there is scope for other flows to make use of a joint facility, that is outside the scope of this report.
It would be possible to accommodate a maximum train length of around 300m on the eastern side of the site, and 360m on the western side of the site, both with a limited amount of container storage. The site does however have several limitations including:
• Road access to the site is constrained, with road access directly to the western side of the site currently only possible from the Port of Ayr, due to a weight constrained bridge to the north of the potential site. This road access however contains several sharp turns which may be unsuitable for heavy freight traffic
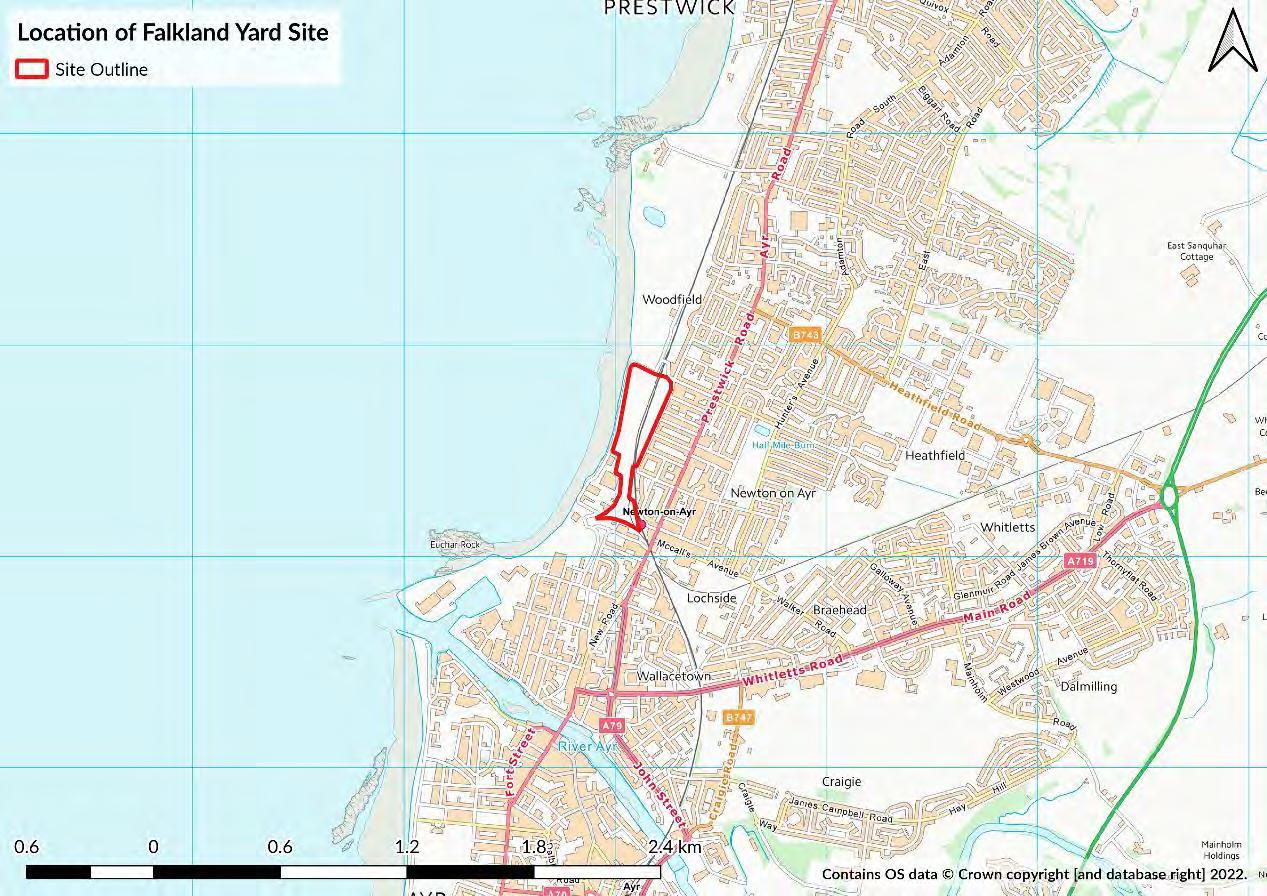
• Road access to the eastern side of the site is only possible from Oswald Road, a residential street in Newton-on-Ayr
• The eastern side of the site appears to be us ed for storage and access by Network Rail, and this may require relocation
• The condition of the existing sidings may require these to be removed and re -laid, although it is not possible to confirm this from a desktop survey, and it would require a detailed onsite inspection to identify the scope of work required
Figure 2-2: Site outline – Falkland Yard• The rail access to Port of Ayr from the north is through the existing yard, and as such may be required to be maintained dependent upon operation requirements at Port of Ayr
• The two sides of the site are separated by the Glasgow South Western Line, and as such any facility operating in this area would need to operationally accommodate this
• Neither side of the site would accommodate a full length train, typically around 500m in length. This would limit the potential number of containers that could be accommodated on this service
• The eastern portion of the site can only be accessed from the south, while the western portion can only be accessed from the north without undertaking a shunt manoeuvre. Whi le there is the potential to develop the rail layout as part of the construction process of a terminal, this would incur additional cost and complexity
Figure 2-3 and Figure 2-4 below presents the constrained access. Figure 2-3: Saltpans Road – Hairpin turn (Source: Google StreetView)It is likely that, were a freight terminal to be cons idered at Falkland Yard , a detailed swept path analysis would be required on the surrounding road network to understand the extents of these constraints , along with a structural survey of the Bellrock Road bridge to understand the opportunities to rectify the weight restriction.

It is considered most likely given the issues explored above that were a yard to be developed at Falkland Yard this would be in the eastern section of the site, due to the limited road access to the western site. The eastern site is largely flat and has evidence of being used a freight facility previously, with reference made to this in the National Sectional Appendix.
Using existing sidings may minimise the amount of signalling work required to link the sidings to the network, though if significant reconfiguration were required the level of signalling work may be no different to other sites considered in this study.
The second option is the development of a facility to the east of Ayr adjacent to the A 77 identified in Figure 2-5
Figure 2-4: Bellroack Road – Weight restricted bridge (Source: Google StreetView)Currently the identified site is agricultural land and as such would require significant investment if this were to be utilised as a freight facility, although, it would allow development of operationally efficient layout from the offset. The site lies alo ng the A77 corridor at the south-eastern extent of Ayr and is identified as a housing release site in the South Ayrshire Local Plan (for up to 750 dwellings). The delivery of these homes would clearly present a barrier to developing a rail freight site and an early action would check the status of these homes.
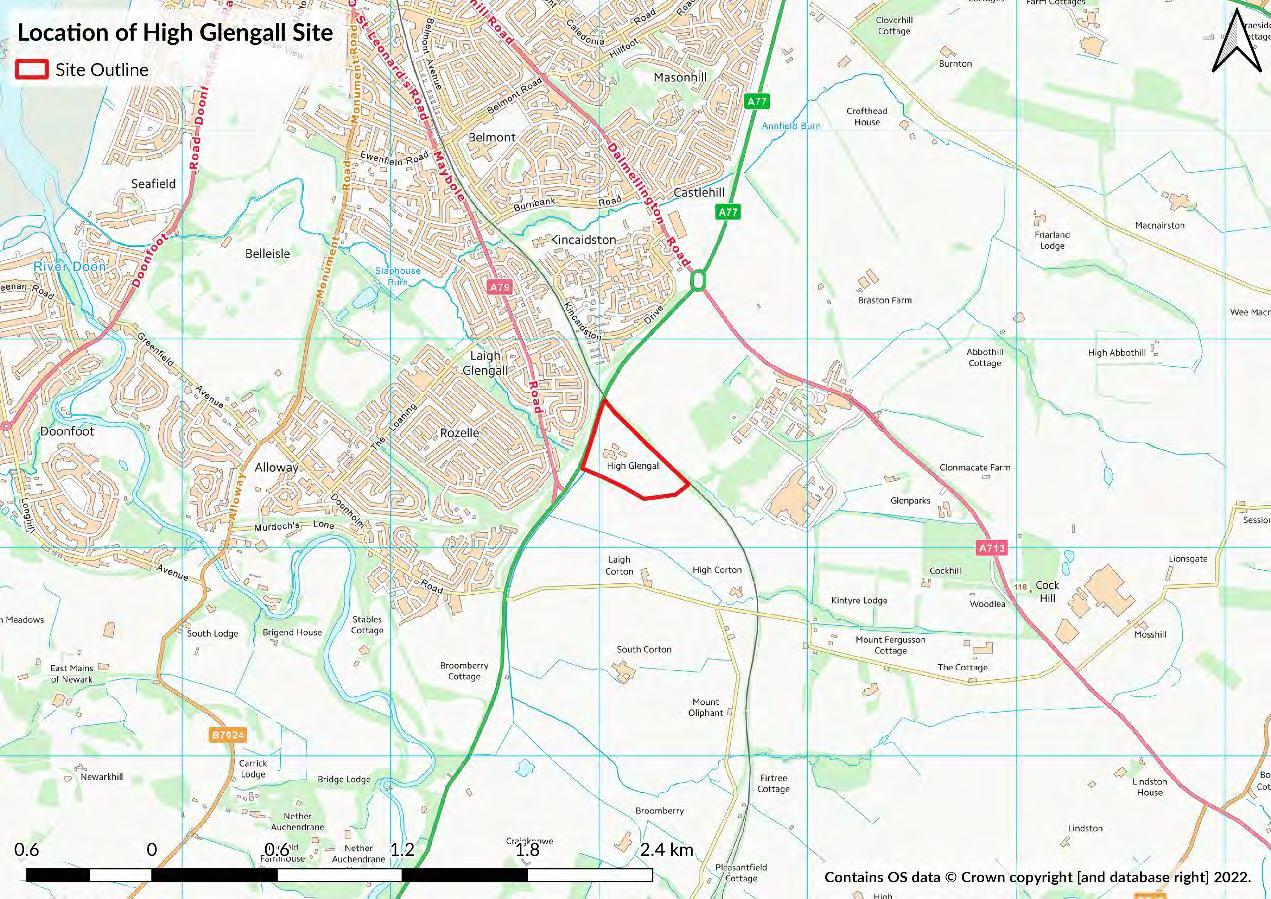
At this site it would be possible to accommodate two sidings of approximately 350m in length and a large amount of container storage. The site does however have several limitations including:
• It would not be possible to maximise train length with only two 350m sidings. It would be possible to extend this to approximately 500m with the diversion of the farm track at the western edge of the site
• Third party land would need to be purchased which would ad d to the cost of the scheme
• There are several farm buildings to the southern edge of the site, which although appear to be abandoned, may require relocation, although this could be coordinated with the diversion of the farm track, and allow for a significantly larger facility to be provided
• There is an unidentified building to the eastern edge of the proposed site adjacent to the railway, from an aerial view this may be a substation, which would require relocation off site. This may come at significant cost, and should be considered early in the process in consultation with the appropriate electricity distribution network operator
• The land around this site is sloping, although at this point the slope is minor, the site falls away from the railway to the south, and as such in order to provide a level hardstanding may require earthworks. This is further compounded the presence of a minor embankment upon which the railway is built, which would require further work to bring the adjacent land to the level of the r ailway
• The proposed site is located adjacent to University Hospital Ayr and Ailsa Hospital, and as such there may be sensitivities regarding noise from the potential site, although this should be minimal due to the nature of the operations being undertaken at the proposed site
Figure 2-5: Site outline – High GlengallRoad access to the proposed site would likely be from the adjacent A77 and would require a new junction to be constructed. An early action on this would be to engage a highways engineer to assess the road and identify the most suitable location for a junction. Dependent upon the scale of the site, it may be possible to create a combine junction with the A77 and Maybole Road, in turn limiting the impacts of several junctions situated close together on the A77.
Signalling work would be r equired to control access to and from the terminal. This would be compounded by the need for a crossover between the southbound and northbound lines to allow trains to access the sidings form the north.
The third option is the development of a facility to the north of Glasgow Prestwick Airport located to the north of Ayr, identified in Figure 2-6.
Currently the identified site is farmland, and as such would require investment in order to be utilised as a freight facility, although due to the agricultural nature of the site, i t would allow development of an operationally efficient layout from the offset. The site is however part of the South Ayrshire greenbelt, as identified in the Local Plan, and as such approval for development on the site may not be possible.
As with the proposed site East of Ayr, it is possible to accommodate at least 2 sidings of approximately 500m in length and a large amount of container storage. The site does however have several limitations, including:
• Proximity to the runway at Glasgow Prestwick Airpor t, which may preclude use of tall structures such as container cranes and floodlighting. While it would be possible to utilise telehandlers for container operators, it would be advisable to engage in early consultation with the operators of Glasgow Prestwick Airport, and the Civil Aviation Authority in regard to height restrictions in this area
Figure 2-6: Site outline - Prestwick Airport• At the western edge of the site, adjacent to the railway, there is a track which appears from Street View imagery to form access to Troon Golf Club, although access is additionally available from B749 to the north of the course
• Rumbling Burn may require diversion into a culvert under the site, although the potential length of potential culvert may be prohibitive – early engagement with an appropriate specialist would be recommended to identify the most suitable option
• The land around this site is sloping, although at this point the slope is minor, the site climbs away from the railway, and as such in order to provide a level hardstanding it may be necessary to undertake earthworks to level the site
• A number of residential dwellings are located to the north of the proposed site, and a holiday park to the south-west. It may be necessary to consider noise from the proposed site, although it is noted these may be minimal due to the nature of the operations being undertaken, and the close proximity of runway 12/30
Road access to the proposed site would likely be from the adjacent A79, and use could be made of the existing A79 / Station Road roundabout, eliminating the require ment to construct a new junction on the A79. Signalling work would be required to control access to and from the terminal. This area is signalled by the West of Scotland Signalling Centre at Cowlairs, and due to the digital nature of this centre, it shoul d be possible to implement the required changed with minimal downtime, although it may be necessary to provide a crossover in between the up and down line in the vicinity of the proposed site, which would increase the signalling complexity. It is recommend ed that early consultation with Network Rail is undertaken regarding this, and potential operation impacts.
Having explored options for freight terminals the note now moves onto explore container train operations and demand. Within this note the approach to estimating the demand for freight trains before exploring destinations, operations and environmental benefits associated with mode shift to rail is set out
Freight flows from the Ayr area have been identified using the Transport Model for Scotland (TMfS18) using the ‘without policy’ 2030 reference case and research into existing rail based freight flows.
Using the TMfS18 2030 reference case model, flows from the Cairnryan Port zone were identified for the AM, inter-peak (IP), and PM periods, and annualised using figures from TN013 – Derivation of Annualisation Factors (Car Driver + PT) (AECOM, 2020) to produce indicative yearly heavy goods vehicles (HGV) movements to and from vicinity of Ayr.
It is assumed that each HGV will translate to approximately one 40ft container, as a 44t articulated vehicle has approximately the same payload capacity as one 40ft container. This was in turn used to calculate rail wagon loads for rail transportation.
Using the number of wagons estimated per year it has been possible to identify the number of trains required per day across various operating profiles. The principal market identified is towards England as the journey length for the majority of trips within Scotland would still favour road h aulage.
The scenarios below have assumed a 60% mode shift. This level of mode shift is required to achieve any form of viable container train. In practice it is felt that this level of mode shift is unlikely to be achievable without significant policy interventions in large part due to the diversity of final destinations and type of freight being conveyed by road currently.
In the standard scenario it has been assumed that the main flow will be from the North West1 , towards a terminal at Trafford Park (Manchester), as the cost and time involved in transhipping between road and rail is typically absorbed through journeys of this length. This area is also a major logistics centre which already generates a number of rail flows including towar ds Scotland.
The model suggests an imbalanced movement of HGVs between the Ayr catchment and North West England, which results in an uneven estimate of train movements. Depending on train length and when averaged by direction between three and five trains a week would be require d. This is viable level of operation but is based on very high mode shift. A mode shift of only 20% would result in only one train per week each way which is unlikely to be viable in the long term.
A high level demand test w as undertaken assuming a flow from the West Midlands as TMfS18 indicates a secondary large flow between the West Midlands and Ayrshire. There are several intermodal terminals in the West Midlands, including at Ham’s Hall, Birmingham.
As with the North West there is an imbalance of flows. A high demand scenario results in the creation of an average of two trains per week in a 24-container configuration, and one train per week in a 30 -container configuration.
Combined with the North West, the inclusion of a secondary flow to the West Midlands would result in a maximum of seven train per week in a 24-container configuration, and four trains a week in a 30 -container configuration, however as highlighted above this is based on exceptionally high levels of mode shift which isn’t plausible in the current policy context.
It is proposed that services would predominantly operate from the terminal to destinations within the North West and West Midlands, as this has the largest demand within England. These have been identified as having the biggest flows within their zone, although it is recognised that some flows may be possible from other destinations.
1 This has not considered road shipment from other regions to the North West, and as such is likely an underestimate of the act ual demand.
Smaller volume flows, for example the South West, could operate either on a less frequent basis allowing for better utilisation of paths, or could be operated to a node terminal, for example Trafford Park in the North West, on existing flows and then combined into long distance flows. It may be possible to utilise this hub and spoke model to increase the number of via ble flows to Ayr.
While the flows identified result in resulted in up to seven trains per week (based on 60% mode shift), the expense required to establish a dedicated container service will be considerable and would require unviable levels of mode shift. This may be due to the nature of the model used, which is focused upon Scotland, with lesser detail on origins and destinations within England, however, the impacts of this are difficult to quantify. Should the rail flow become well established, fu rther growth may be possible which would further the case for the terminal and increased services.
It is proposed that the rail service operates directly between origin and destination with minimal remarshalling on route. This is due to the requirement for a competitive service to be provided when contrasted to road operations.
Where smaller subsidiary flows are identified it may be possible to operate these using a hub and spoke distribution model and existing inter -terminal flows where appropriate, although this in itself implies an increase in containerised rail freight more widely.
The impacts estimated below have been produced assuming that flows that are transferred to rail were previously heading to similar logistics hubs to those that the rail service would originate from. While this does not reflect the fact that a road-based flow will operate direct to the end destination it is assumed appropriate as the road-based trips to destina tions prior to the intermodal terminal will be offset against destinations beyond the terminal.
This assessment additionally does not consider “last mile” haulage; however, this is considered minimal due to the distances involved, and the potential to use electric vehicles for these shorter distance journeys.
The route north of Ayr is electrified, which via the East and West Coast Main Lines, provide electrified routes across central Scotland and towards England . Going forward it will be possible to make use of bi-mode locomotives, including the Class 88 or Class 93 (currently on order for a freight operator), on electrified sections reducing the impacts of these services.
For services towards both the North West and West Midlands, the West Coast Mainline (WCML) would be most suitable which is electrified in its entirety. Accessing the WCML from Stranraer would most likely require use of the Glasgow South Western Line via Kilmarnock. Electrification on this route is currently minimal with only Ayr – Barassie Junction (7 miles 59 chains) electrified. Beyond Gretna Junction the entire route is electrified (excluding access to terminals) . While it would be possible to undertake the journey from Ayr to Gretna Junction on entirely electrified infrastructure, this requires operation via Paisley Gilmour Street, adding approximately 80 miles when compared to the route via Mauchline Junction. In any case obtaining train paths this route and the West Coast Mainline would be extremely challenging.
Emissions have been calculated, using the 2022 UK Conversion Factors for Greenhouse Gas Reporting, for both road and rail, routed via Kilmarnock. This assumes 50% on all journeys, based on all movements consisting of one fully loaded trip, and one empty return trip. While these emissions factors do not consider operational journeys to and from the depot, the net impact of these is likely to be minimal.
As can be seen in Table 4-1, when operating with purely diesel traction the reduction in CO 2e is substantial, with rail freight operation saving over 9 million kilogram CO2e compared to moving the equivalent load by HGV. This in spite of longer routing for rail services via Kilmarnock
Using data from TAG A3.4 the value of the CO2e has been calculated and shows a saving of in excess of £26.4 million (discounted present value in 2010 prices) for both routing options when compared to road over a 30-year appraisal period. Assuming rail has a similar operating cost to road this would support investment in facilities of up to £26 4 million (discounted present value in 2010 prices) whilst still delivering a benefit cost ratio of 1.0.
The Scottish Government has significant electrification plans, including electrification of the Glasgow South Western Line via Kilmarnock to Carlisle, and the line between Kilmarnock and Troon by 2035, and as such sensitivity tests have been undert aken to investigate the potential CO 2e emissions of using electric locomotives on the proposed service to Trafford Park Rail Freight Terminal, making use of this enhanced infrastructure.
A sensitivity test was undertaken assuming the use of bi -mode locomotives, Table 4-2, capable of using 25KV AC overhead electric where available. When routing via Kilmarnock this includes the route between Ayr and Gretna Junction.
The electric sensitivity tests highlights that there are savings at point of use in CO 2e when using electric traction. Existing inter terminal freight flows make use of electric traction where available, so there is already established practice in using this traction mode.
The emissions highlighted in Table 4-2 are based on the use of a diesel locomotive between 2025 and 2035, after which CO2e emissions are assumed to fall to zero based on the use of an electric locomotive supplied with zero emission power.
As can be seen in Table 4-2 the use of electric locomotives where available would result in significant CO 2e savings compared to road-based haulage, and although this calculation does not cover the “last mile” roadbased transfer the emissions from this are likely to be negligible in comparison.
As above, using data from TAG A3.4 the value of the CO2e has been calculated for use of bi-mode traction, based on an electrification year of 2035, and shows a saving of in exces s of £33.5 million (discounted present value in 2010 prices) for both routing options when compared to road over a 30 -year appraisal period. Assuming rail has a similar operating cost to road this would support investment in facilities of up to £33.5 million (discounted present value in 2010 prices) whilst still delivering a benefit cost ratio of 1.0. It is important to note that this assumes the reduced carbon emissions from use of a n electric locomotive are only realised in 2035, 10 years into the 30-year appraisal period – until this point emissions are based on a diesel locomotive
One of the key drivers behind the mode shift from road to rail is the reduction in vehicle miles per year.
As can be seen in Table 3-1 there are currently estimated to be 11,109 two-way HGV trips per year from Ayr area to the North West totalling approximately 2.3 million miles per year, the removal of which will have significant impacts for local communities and the local environment, including the removal of road -side emissions and traffic congestion, along with significant road safety benefits.
The movement from road haulage to rail-based transportation may result in lower demand for road haulage operators however, this is likely to be offset as there will still be demand for road haulage for the “final mile” deliveries from intermodal hubs. This will additionally be offset by the requirement for operational staff at the freight facility, and increased demand for rail operational staff on the new flow.
Three approaches for providing a freight facility at Ayr have been explored. The site at Falkland Yard would require no third party land easing deliverability issues , although access to the site is poor. In contrast greenfield locations would require significant third party land take increasing costs, especially where land has already been identified for development.
The case for a freight terminal at Ayr is hampered by the lack of immediate demand for such a facility in volumes that would allow it to be financially sustainable. Only timber traffic is likely to support such a terminal in the short term, perhaps supported by traffic coming for the proposed site at Barr hill. Longer term policy changes which favoured rail freight would be required to improve viability.
A75 GRETNA-STRANRAER
A77 AYR-STRANRAER
Client: Dumfries and Galloway; South Ayrshire; and Mid and East Antrim Borough Councils
Sweco UK Ltd was commissioned jointly by Dumfries and Galloway , South Ayrshire, and Mid and East Antrim Borough Councils, to assess the transport and economic benefits of a package of proposed improvements to the A75 and A77 trunk roads and adjacent rail corridors
In response to the commission, Sweco has prepared a Strategic and Economic Impacts Report and an Economic Activity & Location Impacts (EALI) Report to capture the full economic impact of the package of proposed improvements to the A75 and A77 corridors, comprising the trunk roads and adjacent rail lines. This technical note appends the Strategic and Economic Impacts Report, hereafter referred to as the ‘main document’.
A full breakdown of the A75/A77 proposed improvement package can be found in the main document, and is summarised as follows:
• Full dualling of the A75 and A77 trunk roads
• Bypasses of settlements including Kirkoswald, Girvan, Ballantree, Spirngholm and Crocketford
• Associated junction improvements along the A75 and A77 trunk roads
• Electrification of the rail line between Stranraer and Ayr
• Installation of rail freight hubs at Ayr, Stranraer and Barrhill
This technical note has been prepared by Sweco to provide an additional layer of commentary on the robust case for the package of proposed improvements to the A75 and A77 corridors. It responds to feedback received during the public and business consultation process pertaining to the committed National Highways project ‘A66 Northern Trans-Pennine’ and the comparative transport and economic benefits. This note therefore continues to:
• Provide the background to the A66 Northern Trans -Pennine project
• Summarise the case for investment for the A66 Northern Tra ns-Pennine project
• Make comparisons between the respective investment cases for the A75/A77 and A66 improvement schemes
• Show that both schemes return journey time savings and associated monetised benefits, and that the A75/A77 returns significant additiona l benefits relating to wider social and spatial context impacts
It is noted that the inclusion of rail network and rail freight improvement measures within the A75/A77 improvement package is a key differentiator between the A75/A77 and A66 schemes. The approach to the development of the A75/A77 improvement package is a multi-modal one, which aims to align with governmental policy objectives on sustainable freight/transport and to improve the efficacy of the trunk roads, largely for tourism and nearby communities, by facilitating a modal shift from road to rail in the regional freight market. There are no direct rail alternatives for passenger or freight movements within the A66 corridor and, as such, this fully -funded National Highways project is not seen to align with recent multimodal and sustainability policies
National Highways has identified the need to improve the A66, between M6 Junction 40 (at Penrith) and A1 (M) Junction 53 (Scotch Corner) , through the A66 Northern Trans-Pennine project. The project proposes a total investment of £693.7 million to dual sections of the A66 along this extent and to improve the junctions with motorways M6 and A1(M).
The A66 is identified as a key national and regional strategic transport corridor and, like the A75/A77 trunk roads, its importance in terms of strategic connectivity across the UK is emphasised. It is also described to carry high levels of freight traffic and to be an important route for tourism and connectivity for nearby communities.
At present the A66 is intermittently dualled between the M6 at Penrith and the A1(M) at Scotch Corner, as pictured in
Figure 2-1 The main transport problems, as summarised in the A66 Northern Trans-Pennine Project Combined Modelling and Appraisal Report (National Highways, June 2022), surround:
• Road safety
• Journey times
• Journey reliability and route resilience
• Local severance
Source: National Highways (2021) A66 Northern Trans -Pennine Project Statutory Consultation, Autumn 2021
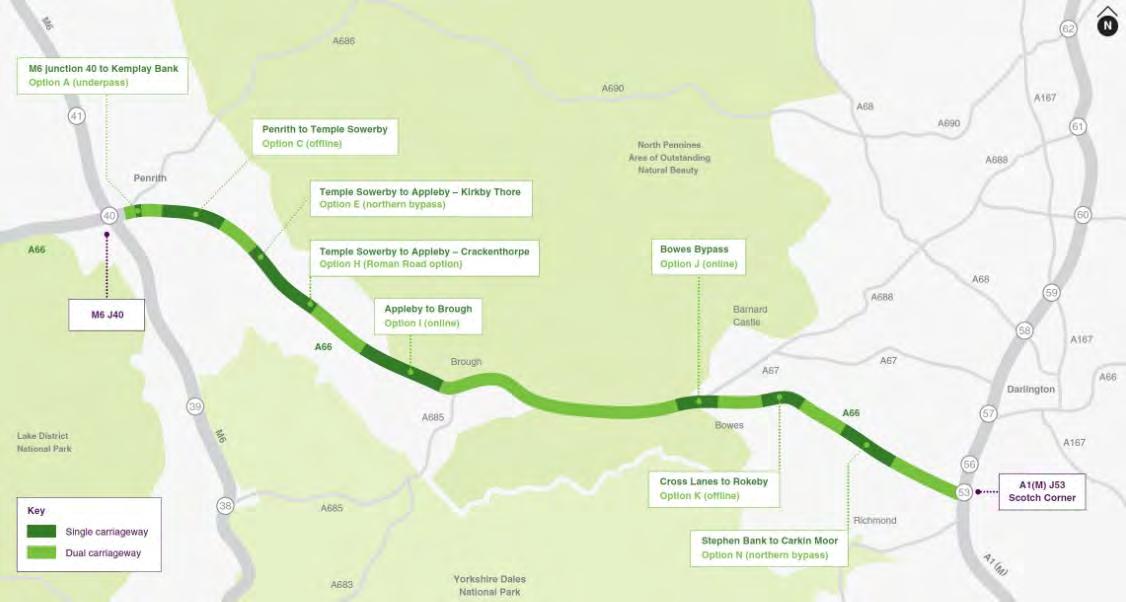
The project comprises eight individual schemes along the 50 -mile section, grouped together by the type of interventions as follows:
• Junction improvement schemes
• M6 Junction 40 to Kemplay Bank
• A1(M) Junction 53 Scotch Corner
• Dualling of existing single carriageway sections
• Penrith to Temple Sowerby
• Temple Sowerby to Appleby
Figure 2-1: A66 Northern Trans-Pennine project map• Appleby to Brough
• Cross Lanes to Rokeby
• Stephen Bank to Carkin Moor
• Bypasses of settlements
• Kirkby Thore
• Crackenthorpe
• Bowes
• Associated junction improvements along the A66 route
The project is classified as a Nationally Significant Infrastructure Project, or NSIP, by the UK Government under the Planning Act 2008 (PA 2008). As such, an application was made to the Planning Inspectorate for a Development Consent Order (DCO) to obtain permission to construct and operate the new A66 in June 2022 Should the DCO receive approval, construction is anticipated to start in 2024.
This chapter establishes and compares results of the respective transport modelling and economic appraisal work undertaken for the proposed A75/A77 and A66 schemes. For the A75/A77 this work is presented in the main document, while the A66 results are extracted from the A66 Northern Trans -Pennine Project Combined Modelling and Appraisal Report.
The results for indicators including forecast journey times, usage by HGVs and a range of monetised benefits are considered for each scheme’s anticipated opening year , unless specified otherwise, as follows:
• A75/A77 – 2030
• A66 – 2029
In reference to the A75/A77 Strategic and Economic Impact s Report and Economic Activity & Location Impacts (EALI) Report (Sweco, 2022), which consider a range of interventions (or packages), it is noted that the results for Package 3 have been employed for the purposes of this technical note. Package 3 can be considered as the ‘do-maximum’ package of improvements and includes full carriageway dualling of both the A75 and A77 trunk roads
In transport scheme appraisal, modelling is used to establish the difference between two forecasts, withoutscheme, and with-scheme scenarios. The outputs provide us with j ourney time changes which have been assessed for the A75/A77 and A66 schemes at their respective opening years. Table 3-1 presents the journey time changes in the AM and PM peak periods anticipated in the respective with-scheme scenarios.
Table 3-1: Comparing the A75/A77 and A66 schemes – Journey time differences - Scheme opening year (AM, PM peak periods)
Table 3-1 shows both schemes generate journey time savings in the AM and PM peak periods. A comparison of the savings shows the most significant journey time reduction will be achieved on the A75, between Stranraer and Annan, totalling 23 minutes in the AM and 22 minutes in the PM peak . Improvements
to the A77 are expected to return journey savings of 14 minutes across both peak periods , between Stranraer and Ayr. Journey time savings resulting from the A66 scheme range from 09:49 – 11:10 minutes, with the greatest time saving forecasted for the A66 scheme occur ring for eastbound travel in the PM peak period
The proportion of HGVs amongst the general traffic on a route can provide an indication of its importance to the transfer of freight and respective freight-intensive industries Table 3-2 presents the percentage of HGVs along the A75, A77 and A66 trunk roads, according to DfT manual count point data for 2019.
*Northbound **Southbound
Source: Department for Transport (2019)
The maximum proportion of HGVs seen in Table 3-2 is recorded on the A77 at the Port of Cairnryan, reinforcing the role of the Port of Cairnryan and Loch Ryan Port in the transfer of goods between Scotland/the UK and Northern Ireland. The highest two -way traffic flow (all vehicle types) is also seen on the A77 northbound as it travels towards Glasgow, a key economic, education, health, and cultural hub. It is recognised, however, that the A66 sees a greater and more consistent traffic demand along the route in comparison to the flows registered on the A75 and A77. The A66 also functions as a key national and regional strategic transport corridor, and it is noted that no direct rail alternatives for passenger or freight movements exist.
The impacts of each scheme on travel times and vehicle operating costs were assessed using the DfT’s TUBA program. The impacts, which are expressed in monetary terms, are presented in Table 3-3.
Table 3-3 shows both schemes provide the greatest benefits for business trip purposes, an expected outcome as strategic roads of this nature are likely to carry a higher proportion of this type of trip. The A66 scheme is anticipated to provide approximately 15% more in benefits for business trips, compared to the proposed A75/A77 scheme. Dualling of the A75/A77, however, is expected to provide more significant benefits for commuting and other users by comparison. The proposed A75/A77 scheme provides an uplift in benefits of 77% for commuters and an uplift of 91% for other users in comparison to the A66 scheme us er benefits. The overall total user benefit for the A75/A77 scheme is £719.61 million compared to £521.26 million for the A66 scheme
Transport user benefits arising due to the predicted impact of each scheme on the number of accidents wer e also assessed. Table 3-4 provides the monetary benefits of accident savings for the A75/A77 and A66 dualling projects.
Full dualling of the A75 and the A77 trunk roads, alongside the implementation of bypasses at key towns and targeted junction improvements, is expected to bring over £250 million worth of accident benefits. This total is largely comprised of benefits accrued by improvements to the A75, stressing the importance of delivering a high standard dual carriageway that bypasses constrained network areas and key settlements to road safety. The A66 scheme provides a total of £29.65 million in accident savings.
Wider economic impacts refer to the additional benefits or disbenefits that can arise as the impact of transport improvements is transmitted into the wider economy, beyond those businesses and passengers that are directly affected by the transport change.
The appraisal work undertaken for each scheme varies regarding wider economic impacts. For both the A75/A77 and A66 schemes, the monetised impacts relative to ‘business output change under imperfect market competition’ (whereby reduced tr avel costs lead to market value of output greater than cost of production) and ‘labour supply change’ (whereby better transport access releases inactive workers into the labour market and provides tax revenue) are considered. For the A75/A77, however, a more comprehensive range of impacts has been assessed. Included is static and dynamic agglomeration, and ‘wider social and
spatial context impacts’ (measuring benefits and disbenefits to households and other actors, using measures of benefit from improved accessibility as the means of capturing both the direct benefits of improvement and land-use effects)
The wider economic impact assessment results for the A75/A77 and A66 schemes are summarised in Table 3-5
Business output in imperfectly competitive market – Journey time changes
Business output in imperfectly competitive market – Journey time reliability changes - £12.47
Labour supply – income tax revenue
agglomeration
Wider social and spatial context impacts
Table 3-5 presents a stark contrast between the wider economic impact of the A75/A77 and A66 schemes, in terms of the level of assessment and the overall monetary benefit. At this level is it shown the funding allocation for the A66 scheme is based on a relatively narrow evidence base, in which benefits largely arise from journey time changes.
The economic appraisal undertaken for the A75/ A77 proposals is shown to be well-rounded and to look beyond the core benefits, seeking the wider spatial and social impact of transport (and land -use) interventions. This level of assessment has shown the proposals to bring a significant level of benefit to the local and regional economies, totalling £3 78 billion
The discounted benefits have been summed to give an overall Present Value of Benefits (PVB). The PVB presents the total monetary benefit/impact of each scheme and is presented in Table 3-6, broken down according to the following levels:
• Established benefits
• Journey time benefits
• Construction delay disbenefits (not captured for the A75/A77)
• Vehicle operating costs
• Accident benefits
• Environmental impacts (not captured for the A75/ A77)
• Indirect tax revenues
• Evolving benefits
• Journey time reliability (not captured for the A75/ A77)
• Static agglomeration (not captured for the A66)
• Labour supply impacts
• Output change in imperfectly competitive markets – journey time changes
• Output change in imperfectly competitive markets – journey time reliability changes (not captured for the A75/A77)
• Indicative benefits
• Dynamic agglomeration (not captured for the A66)
• Wider social and spatial context impacts (not captured for the A66)
• Carbon savings due to rail freight improvements (not captured for the A66 as no scope for railbased improvements)
Table 3-6 again relays a differing approach taken to capture the wider economic impacts of each scheme. For the A66, National Highways have presented an Initial PVB of £358.32 million which excludes journey time reliability and wider economic impacts With journey time reliability and wider economic impacts considered, the adjusted PVB increases to £691.98 million
For the A75/A77 wider economic assessment, a larger array of results is presented which relate to varying improvements along each route corridor. T he results include established monetised impacts, evolving monetised impacts, indicative monetised impacts, and additional monetised impacts, presen ting the PVB at each of these levels/stages. The largest contributor to the overall PVB is the indicative PVB results , totalling £3 55 billion. These represent the value that actors in the land-use markets (households and firms) place on accessibility to destination, as opposed to the value that users in the transport system place on time savings . While a range of improvement packages were assessed for the A75/A77 scheme, as presented in the main document, PVB results were also considered for each corridor/route in isolation Table 3-7 presents the total monetary benefit/impact of improvements to A75 and A77 trunk roads, with interventions comprising full carriageway dualling, settlement bypasses and associated junction improvements.
Table 3-7 identifies that improvements to the A75 will accrue large scale benefits . Dualling of the A75 amasses significant additional benefits when compared to the A77, and indeed the forthcoming A66 scheme These results stress the importance of delivering a high standard dual carriageway to road safety, in particular the bypassing constrained network areas and key settlements
This technical note has provided an additional layer of commentary on the robust case for the package of proposed improvements to the A75 and A77 corridors and responds to feedback received during the scheme’s public and business consultation process. This feedback referred to the committed ‘ A66 Northern Trans-Pennine’ National Highways project and the comparative transport and economic benefits. The A66 is deemed comparable to the A75 and A77 as a trunk road with a role as a key national and regional strategic
transport corridor, while the improvement project also proposes full carriageway dualling, settlement bypasses and associated junction improvements.
The comparison of each scheme’s transport and economic benefits has raised variances in the extent of assessment and the level/range of benefits achieved. The case for the A66, which has securing full funding, demonstrates a range of monetised benefits of the scheme, a large proportion of which can be attributed to journey time savings. This is seen in the highway Transport Economic Efficiency (TEE) results, which comprise significant journey time benefits for business trips totalling £476.28 million, and in the Wider Economic Impacts (WEI) results, of which £60.23 million is based upon journey time and journey time reliability changes. The overall Present Value of Benefits (PVB) for the A66 scheme is £691.98 million.
The case for the A75/A77 has also assessed these core benefits and delves further to investigate the potential wider spatial and social impact of the transport (and associated land -use) interventions. In terms of the scheme’s monetised benefits, this establishes WEI assessment results of £3.78 billion. A proportion totalling £40.76 million is attributed to journey time changes, while further benefits including income tax revenue, static and dynamic agglomeration, and ‘wider social and spatial context impacts’ constitute £3.73 billion. By this measure it is considered that the A75/A77 scheme, and the A75 in particular, will bring significant additional benefit to the local and regional economies.
The transport and economic appraisal undertaken for the A75/ A77 proposals is shown to be comprehensive and well-rounded, and the results to be of significant positive benefit, in comparison to the selected nationally important infrastructure project. Sweco trusts this work will help decision -makers prioritise the package of proposed improvements to the A75 and A77 trunk roads and adja cent rail corridors, as called for by Dumfries and Galloway, South Ayrshire, and Mid and East Antrim Borough Councils
