15 17 TO FEB 2023 Newcastle Australia

Newcastle Exhibition & Convention Centre, (NEX), Newcastle, Australia
Newcastle Oceania

Host Port:


Conference Handbook
Balancing Environmental Considerations with Economic Demands
Sponsor: Gold sponsor: Silver sponsor:

Supported by:

The world’s leading conference on sustainable environmental practice comes to Newcastle Australia.


Join us for two days of conference presentations and learn from the foremost experts in environmental technologies. visit: portstrategy.com/greenport-congress-oceania contact: +44 1329 825335 or email: congress@greenport.com
Media Partners:


PORTSTRATEGY INSIGHT FOR PORT EXECUTIVES
PORT EXECUTIVES
GREENPORT INSIGHT FOR
#GPCOceania
The Partner for Sustainable Change
Ramboll is a global architecture, engineering and consultancy company with more than 17,000 experts who create sustainable solutions for governments and companies all over the world.
As architects, engineers, designers and consultants, we help clients and communities realise their goals and aspirations in a climate of ever-pressing challenges, collectively navigating towards a flourishing sustainable future. We combine vision with insights to drive positive change for our clients and the wider society, in the form of ideas that can be realised and sustained.
We call it: Bright ideas. Sustainable change.

www.ramboll.com
ANDREW WEBSTER Chief Executive Officer, Mercator Media Ltd
Dear Delegate,
On behalf of Mercator Media Ltd and GreenPort Magazine, I would like to welcome you to Newcastle for the inaugural GreenPort Congress Oceania Conference. As the first host port of GreenPort Congress Oceania, Port of Newcastle is committed to driving the principles of sustainability. This applies throughout its operations, frominternal culture and the way it engages with customers and communities, to diversifying its trade into areas such as hydrogen.
The Port of Newcastle currently handles 4,400 ship movements and 164-million tonnes of cargo annually, including dry bulk, bulk liquids, ro-ro, general and project cargoes and containers. With a deepwater shipping channel operating at 50% of its capacity, significant port land available and enviable access to national rail and road infrastructure, it is ideally positioned to further underpin the future prosperity of the Hunter, NSW and Australia.
We are delighted to have so many industry experts on the programme, from senior port officials, policy advisors and senior environmental officers speaking from across Australia and the Oceanic region as well as representation from leading cruise operators, the International Association of Ports and Harbors and supporters Ports Australia and PIANC. The discussion and networking opportunities continue with the interactive question and answer sessions and gala dinner.
We would like to take this opportunity to thank the Port of Newcastle for being hosts and organising the Welcome Reception, Conference Dinner and Port Tour which provide delegates with unparalleled networking opportunities and a chance to see some of the projects covered in the programme in action within the port.
We would also like to thank our Gold sponsor Ramboll as well as the other sponsors, and especially to all the participants and supporters. A special thanks from Mercator Media to our speakers who make our conferences unique and provide such valued content. We hope you will find the conference beneficial and please put 18-20 October 2023 in your diary for the next European event when the host port will be Port of Lisbon.
Best,
Andrew Webster Chief Executive Mercator Media Limited

Welcome letter
3
CRAIG CARMODY CEO, Port of Newcastle

Dear Delegate,
It is with great pleasure that we welcome you to our city, and Port of Newcastle, for the inaugural GreenPort Congress Oceania. We are honoured to make history as the first Port in the Southern Hemisphere to host this globally significant event.
Port of Newcastle is proudly a leader within the Australian port industry in ESG delivery, so it seems a natural fit for the Port to host the Southern Hemisphere’s first GreenPort Oceania Congress. Newcastle is also an interesting case study in transition; the whole region is heavily dependent on the coal trade and looking at how it can diversify, and Port of Newcastle is working to lead the way.
Port of Newcastle is more than a port; existing to build Australia’s prosperity with responsible, integrated and innovative supply chain solutions. As Australia’s deepwater global gateway we are the largest Port on the nation’s East Coast and, with less than 50% of capacity utilised, our Port exists to build Australia’s prosperity through diverse cargoes and responsible, integrated and innovative supply chain solutions.
We are focused on positioning Newcastle as a leading hub for all traditional and future clean energy products and technologies and our vision is for Port of Newcastle to become a global energy gateway and Australia’s first-choice East Coast port, able to accommodate, attract and grow a diverse trade base in an efficient, sustainable and innovative manner.
We are progressing our hydrogen export readiness through the planning and development of our Clean Energy Precinct site and we remain committed that by 2025 our Clean Energy Precinct will be producing green hydrogen and ammonia and 1.6GW of production in five years. This will make us one of the largest early mover facilities of its kind in Australia.
Our ambitious, but achievable, diversification agenda is further pillared by our plan to construct and operate a world-class, highly-automated container terminal that enables NSW businesses to be more sustainable and globally competitive by providing more efficient access to international markets.
We are proud to be delivering these future opportunities and economic strength to our city, state and beyond, with our impact reaching far beyond our commercial footprint. As custodian of a large part of the city’s iconic foreshore, our Port is an existential element of its history
Welcome Address from Port of Newcastle
4
and key to its future possibilities. As custodian of a large part of the city’s foreshore, we are committed to leaving it in a better way than we inherited it. By diversifying our operations we’re not only protecting our Port’s future and its ongoing profitability – we’re supporting the growing prosperity of NSW’s second largest city and a regional skilled workforce of tens of thousands of people.
At Port of Newcastle we pride ourselves on not just talking about what we can do, but in taking action, and to date we have made great inroads in delivering against our ambitious environmental, social and governance targets and objectives. Proudly, we were the first Port in Australia and New Zealand to become a member of the international EcoPorts network have achieved and retained a five-star GRESB rating in a few short years. With an SBTI approved 1.5-degree target underway for Port of Newcastle Scope 1 & 2 emissions, our attention has turned to Scope 3, and we are working with our stakeholders to help minimise these across the value chain. We will also be focusing on biodiversity, looking at our eco-system dependencies and gearing up to Taskforce on Nature-related Financial Disclosures (TNFD) in 2024. And, we are committed to doing more to build on our ESG commitment and sustainability initiatives.
There is no doubt that the future is exciting for Port of Newcastle. Diversification, ESG and supporting our community and economy are our priorities. When you are known nationally and internationally as the ‘world’s largest coal port’ change is always going to be like turning a large cargo ship in the harbour, a measured diversification in tandem with the broader economy, but with the right tools and people around you, as we have, the end goals can be achieved.
Craig Carmody CEO Port
5
Welcome Address from Port of Newcastle
of Newcastle
Port of Newcastle is Australia’s Deepwater Global Gateway, the largest on the nation’s East Coast. It is more than a port; existing to build Australia’s prosperity with responsible, integrated and innovative supply chain solutions. As well as positioning Newcastle as a leading hub for all traditional and future clean energy products and technologies, Port of Newcastle is diversifying its trade as it strives to create a safe, sustainable and environmentally and socially responsible future.
With trade worth about to the national economy each year, Port of Newcastle enables Australian businesses to successfully compete in international markets. The Port currently handles 4,697 ship movements and 166 million tonnes of cargo annually, including 25 different types such as dry bulk, bulk liquids, ro-ro, general and project cargoes and containers. With a deepwater shipping channel operating at 50% of its capacity, significant Port land available and enviable access to national rail and road infrastructure, Port of Newcastle is positioned to further underpin the future prosperity of the Hunter, NSW and Australia.

Contents Day 1 7
Day 1 10 Opening & Keynote Addresses Session 1 .............................................................................................................................................................. 20 Renewable Energy - Journey to Net Zero Session 2 42 Net Zero Carbon Cruising Session 3 ............................................................................................................................................................... 73 Collaborative Communities
Contents Day 1
Contents Day 2 8
Day 2 99 Opening Session Session 4 ............................................................................................................................................................ 101 Green Financing for Sustainable Port Development Session 5 - Stream 1 113 Green logistics: multimodal supply chains Session 5 - Stream 2 .................................................................................................................................. 139 Maritime Projects for Decarbonisation by 2050 Session 6 ............................................................................................................................................................ 159 Pathways to Sustainable Ports - What Does the Future Hold? Session 7 181 Green Ports - What components are needed?
Contents Day 2
SAILING TO A BETTER FUTURE
CLIA ocean-going cruise lines are charting the course to net zero carbon cruising by 2050


Reducing the carbon footprint of ships while at berth and at sea
75%

of the current global cruise fleet is capable of using sustainable marine fuel once available at scale
Investing in advanced environmental technologies onboard Partnering with cities and ports on sustainable destination management
61% of new build capacity will utilise LNG as a transitional fuel
Visit www.cruising.org for more information
PROFESSOR PAUL DASTOOR

Director of the Centre for Organic Electronics, University of Newcastle

BIOGRAPHY
Paul Dastoor is a Professor in Physics in the School of Mathematical and Physical Sciences and the director of the Centre for Organic Electronics at the University of Newcastle in Australia. He received his B.A. degree in Natural Sciences from the University of Cambridge in 1990 and his PhD in Surface Physics, also from the University of Cambridge, in 1995. After completing his doctorate he joined the Surface Chemistry Department at British Steel in 1994 before taking up his present appointment at the University of Newcastle in 1995. He was an EPSRC Visiting Research Fellow at Fitzwilliam College, Cambridge, UK in 2002 and a CCLRC Visiting Research Fellow at the Daresbury Laboratory, Cheshire, UK in 2004-05.
Welcome by Chairman / Moderator
10
CRAIG CARMODY CEO, Port of Newcastle
BIOGRAPHY
Craig joined Port of Newcastle as Chief Executive Officer in August 2018, building on extensive experience spanning the transport, maritime and infrastructure sectors.
From 2014 Craig was Head of Strategy and Corporate Affairs at Svitzer, the towage services division of Maersk Group, where he was responsible for strategy, innovation and corporate affairs. While at Svitzer, Craig also led the regulatory affairs engagement with governments, port owners and port authorities.
Craig has held senior roles in the Australian Federal Government, serving as the Director of Policy in the Prime Minister’s Office, Deputy Chief of Staff to the Deputy Prime Minister and Senior Policy Advisor to Ministers for Infrastructure and Transport, and Workplace Relations and Employment.
He served 10 years in the Australian Army, including the Special Forces, reaching the rank of Lieutenant Colonel and holds post-graduate qualifications in public policy, business management and industrial and employee relations.
Welcome Address
11
BIOGRAPHY
Fiona Robinson is Managing Principal for Ramboll’s Environment and Health group in Asia Pacific. Fiona has 25 years’ experience in contaminated site assessment and land remediation across Australia and internationally. Fiona provides third party advisory services across many sectors and is a contaminated land auditor in NSW and a Certified (Contaminated Sites) Practitioner.

Gold Sponsor Address
12
FIONA ROBINSON Country Market Director, Ramboll
CRAIG CARMODY CEO, Port of Newcastle
BIOGRAPHY
Craig joined Port of Newcastle as Chief Executive Officer in August 2018, building on extensive experience spanning the transport, maritime and infrastructure sectors.
From 2014 Craig was Head of Strategy and Corporate Affairs at Svitzer, the towage services division of Maersk Group, where he was responsible for strategy, innovation and corporate affairs. While at Svitzer, Craig also led the regulatory affairs engagement with governments, port owners and port authorities.
Craig has held senior roles in the Australian Federal Government, serving as the Director of Policy in the Prime Minister’s Office, Deputy Chief of Staff to the Deputy Prime Minister and Senior Policy Advisor to Ministers for Infrastructure and Transport, and Workplace Relations and Employment.
He served 10 years in the Australian Army, including the Special Forces, reaching the rank of Lieutenant Colonel and holds post-graduate qualifications in public policy, business management and industrial and employee relations.
Keynote Panel
13
MY THERESE BLANK Head of Oceania Export Market, Regional Ocean Management, A.P. Moller, Maersk

BIOGRAPHY
My Therese Blank is the Head of Oceania Market with responsibility for the Maersk Groups Ocean business within the region. She has more than 15 years’ experience from the shipping and logistics industry across Europe, Asia and Oceania. My has held several senior leadership positions within Maersk, including Australia Sales and Country Director and Oceania Area Customer Service Director. In 2022 she was elected board member of Shipping Australia, as the organisations first female director. Her key passions are business innovation and leading the transformation of the shipping and logistics industry. My holds a master’s degree in business and economics from Uppsala University Sweden.
Keynote Panel
14
RODNEY
BEGLEY
 Acting CEO, PNG Ports (Papua New Guinea)

BIOGRAPHY
Rodney Begley, joined PNG Ports Corporation Ltd as Chief Operations Officer (COO) in May 2020 and following the sudden and tragic loss of the late CEO – Fego Kiniafa in September 2022, Rodney was appointed Acting Chief Executive Officer (interim) to ensure business continuity and stability was maintained.
Rodney was born in Jamaica, grew up in the Caribbean and has developed a passion and love for the South Pacific. Having worked in Europe (Germany), Oceania and parts of the South Pacific including the Solomon Islands and PNG, Rodney has developed a professional international executive career in Shipping, Logistics, Tourism and Port Operations.
With PNG Ports undergoing a major transformation of infrastructure development USD$ 435M / AUD$ 640M, the PNG Ports Board and Executive management are focused on delivering fitfor-purpose facilities that support a dynamic economy, the needs of a growing community and to future proof PNG Ports as an accredited International Port operator.
Keynote Panel
15
ERANDA KOTELAWALA Chief Executive Officer, Solomon Islands Ports Authority
BIOGRAPHY
Eranda Kotelawala was appointed Chief Executive Officer of Solomon Islands Ports Authority in February 2017. Prior to that, he was the COO of Fiji Ports Corporation Limited managing five major ports of entry into Fiji. Eranda brings 23 years of management experience predominantly in shipping and several other industries in in Sri Lanka, United Kingdom, South Africa, Sultanate of Oman, and Singapore.

He has consulted on Business Process Re-engineering Projects in major Port projects in the South Pacific, the Gulf region and South Africa. Eranda holds a Master’s Degree in Management from Aberdeen Business School, and further specialized in Business Process Re-Engineering. He is a Chartered Fellow of Chartered Institute of Logistics and Transport UK, Fellow of Chartered Management Institute UK, Associate Fellow of The Nautical Institute UK, He is also a full member of Institute of Management Consultants Australia.

Keynote Panel
16
MICHAEL BLAKE Founder & Chief Executive Officer, Zilch Forwarding


BIOGRAPHY
Michael Blake is the CEO of Zilch Forwarding. A passionate advocate for the sustainable transport movement in Australia and abroad, Michael brings a diverse background in global trade to the table. With experience in exports, port operations, consulting, IT (GTM), and freight forwarding, Michael has a firm grasp of the logistics industry. In 2015, he began a deep dive into sustainable logistics, recognising the need for a freight forwarding solution that prioritises sustainability at its core. In 2021, Michael launched Zilch Forwarding to provide shippers with a comprehensive, sustainable logistics solution that is not an afterthought, but at the heart of the company’s operations. Michael is committed to reducing carbon emissions and promoting sustainable transportation practices in the logistics industry. Today, his brand is leading the charge toward a more sustainable future.
Keynote Panel
17
SENGO
BIOGRAPHY
Paula Sengo has a background on Environmental Engineering and has been working in the Port of Lisbon Authority since 1991.

Until 2020 she was responsible for the management and advise on environmental issues and on spatial planning, as well as port development projects.
Nowadays she is head of Planning and Studies Office, where she deals with Sustainability and Strategic Planning, Port development, Energy Transition and Geographical Information Systems.
Keynote Panel
18
PAULA CRISTINA
Head of Studies and Planning Team, Port of Lisbon
Building
In ports around the world, pressure is rising to ‘go green’, whether that is transitioning to Net Zero, operating more efficiently, increasing social and environmental safeguards, or facilitating growth in green industry.

port resilience towards a sustainable future
Green Ports
Our Green Port solutions include: Green port health check and strategy Decarbonisation / Net Zero Energy transition / Energy efficiency Climate resilience and nature-driven design Green finance and investment
www.royalhaskoningdhv.com/green-ports
Renewable EnergyJourney to Net Zero
SESSION
20
1
CHRISTA SAMS Senior Manager, Environment, Port Authority of New South Wales
BIOGRAPHY
As Senior Manager, Environment, Christa leads Port Authority in managing environmental matters for commercial trade and cruise shipping in Sydney Harbour, Port Botany, Newcastle Harbour, Port Kembla, Eden and Yamba. This covers high level advice and guidance on environmental impact assessment, environmental legislation, sustainability and stakeholder and community engagement.

Christa joined Sydney Ports Corporation in 2001 as Environmental Officer, then Environment Operations Manager covering the ports of Sydney and Port Botany. Following the amalgamation of the Sydney, Newcastle and Port Kembla port corporations, this role expanded to the statewide environment management role for Port Authority of NSW. She is a co-chair of the Ports Australia Environment Planning and Sustainability Working Group, and chairs the Noise subcommittee.
Christa spent her early career in the consulting industry primarily in contaminated land assessment and remediation, following her degree in BEng (Environmental).

Moderator
21
BIOGRAPHY

Matthew is an experienced sustainability professional with over 10 years working in the mining, metals, energy and utilities industry specialising in sustainability strategy, climate change and renewable energy including hydrogen. He recently developed the sustainability strategy for Pilbara Ports Authority and is responsible for their approach to climate change including investigating renewable energy opportunities such as hydrogen and clean ammonia.

Speaker
22
MATTHEW BOWDLER Principal Sustainability Advisor, Pilbara Ports Authority
Pilbara Ports Authority: Our Approach to Climate Change
1. INTRODUCTION
Pilbara Ports Authority (PPA) is the world’s largest bulk export port authority, achieving a recordbreaking 733.1 million tonnes of throughput in the 2021-22 financial year through the ports of Ashburton, Dampier, Port Hedland and Varanus Island.
PPA is committed to supporting the operations of port users, creating opportunities for growth and building sustainable communities. Climate change is a key business risk, identified as one of 10 material issues within PPA’s sustainability strategy. To combat the effects of climate change on ouClimater business and operations, a three pillar approach has been developed to categorise opportunities to manage climate change risks and opportunities to its operations. These pillars are climate change opportunity, climate change resilience and emissions reduction.
2. ABOUT PPA
PPA’s ports are located in the Pilbara region, northwest of Western Australia. To provide perspective of distances:
5 The Port of Ashburton is 1,378km north of Perth
5 The Port of Dampier is 318km northeast of Port of Ashburton
5 Port of Varanus Island is 132km west of Port of Dampier
5 Port of Port Hedland is 266km northwest of Port of Dampier
In comparison, Perth is 3,290km from Sydney and 3,917km from Singapore.
Conference Paper
Figure 1 – PPA’s approach to climate change
23
Resilience
Opportunity Emmisions Reduction
Climate Change
Climate Change
The Pilbara has a population of over 55,000 people and is exposed to some of the severest climate conditions in Australia. The Pilbara coastline is the most cyclone-prone region in Australia, with an average of five cyclones each tropical cyclone season. Cyclones can cause significant rainfall events in the Pilbara and generate 25–34% of the total annual rainfall near the Pilbara coast which can cause flooding. The Pilbara is also subject to extreme heat. In 2022 alone, Port Hedland recorded 140 days over 35 degrees and 25 days over 40.
The Pilbara has a population of over 55,000 people and is exposed to some of the severest climate conditions in Australia. The Pilbara coastline is the most cyclone-prone region in Australia, with an average of five cyclones each tropical cyclone season. Cyclones can cause significant rainfall events in the Pilbara and generate 25–34% of the total annual rainfall near the Pilbara coast which can cause flooding. The Pilbara is also subject to extreme heat. In 2022 alone, Port Hedland recorded 140 days over 35 degrees and 25 days over 40.

3. OUR APPROACH TO CLIMATE CHANGE
3. OUR APPROACH TO CLIMATE CHANGE
The impacts of climate change are increasingly being felt around the world through changing weather patterns, shifts in technology and energy and increased regulation. Now more than ever, stakeholders and communities expect us to actively manage the risks we face from climate change and to pursue opportunities that are presented from climate change
The impacts of climate change are increasingly being felt around the world through changing weather patterns, shifts in technology and energy and increased regulation. Now more than ever, stakeholders and communities expect us to actively manage the risks we face from climate change and to pursue opportunities that are presented from climate change.
Our aim is to build a better future for our business, our workforce, society, and future generations, by ensuring continued resilient operations of our ports.
Our aim is to build a better future for our business, our workforce, society, and future generations, by ensuring continued resilient operations of our ports.
2.1 Climate Change Opportunity
2.1 Climate Change Opportunity
There are several opportunities that are emerging as businesses aim to decarbonise their operations and build resilience to climate change. Opportunities include new technologies, renewable energy projects and change in product demand. PPA is currently exploring the following opportunities:
There are several opportunities that are emerging as businesses aim to decarbonise their operations and build resilience to climate change Opportunities include new technologies, renewable energy projects and change in product demand. PPA is currently exploring the following opportunities:
5 Developing infrastructure at its ports that can cater for the expected increase in commodities that will be required to support the transition to a decarbonised economy. An example of this is facilitating hydrogen export infrastructure from PPA ports.
• Developing infrastructure at its ports that can cater for the expected increase in commodities that will be required to support the transition to a decarbonised economy. An example of this is facilitating hydrogen export infrastructure from PPA ports.
5 Renewable energy and efficiency opportunities at all ports.
5 Incentivising tenants to incorporate sustainability requirements.
• Renewable energy and efficiency opportunities at all ports
• Incentivising tenants to incorporate sustainability requirements
2.2 Climate Change Resilience
2.2 Climate Change Resilience
Improving our resilience to the physical and transitional impacts of climate change is an equally important part of our approach. Examples of the physical impacts are the possibility of increased severity of cyclones and increased days over 40 degrees. These impacts are
Improving our resilience to the physical and transitional impacts of climate change is an equally important part of our approach. Examples of the physical impacts are the possibility of
Conference Paper 24
GreenPort Congress Oceania Paper Wednesday, 15 February 2023 Newcastle Exhibition & Convention Centre Page 2 of 5
likely to challenge the way we currently operate. In terms of transitional impacts, product demand continues to change, with businesses seeking low carbon alternatives within their supply chains, understanding these impacts on our business, our proponent’s businesses, and the communities in which we operate, allows us to develop transition plans to improve our resilience.
PPA is planning to enhance its resilience against climate change impacts by identifying risks, vulnerabilities and risk treatments to address future climate change impacts on our ports.
These initiatives include:
5 Coastal Hazard Risk Management and Adaption Plan (CHRMAP) for all PPA ports – to understand the likely impacts to physical assets caused by changes to sea levels and storm surges.
5 Develop a more localised understanding of climate change impacts based on Intergovernmental Panel on Climate Change (IPCC) data.
5 Perform scenario analysis using IPCC data to enhance critical strategic thinking necessary to prevent or mitigate potential climate events.
5 Climate change risk workshops with subject matter experts.
2.3 Emissions reduction and decarbonisation
PPA is developing a Net Zero Transition Plan that is based on two key commitments:
5 achieving net zero emissions (scope 1 and 2) by 2050;
5 achieving an 80% reduction below our 2020 emissions baseline by 2030.
This Plan will identify a pathway to achieving these commitments through a combination of initiatives that are focused on:
5 energy efficiency
5 adoption of renewable energy
5 energy demand reduction
5 carbon offsetting
PPA has already identified more than 50 initiatives and is now in the process of detailed screening of each initiative.
4. FACILITATING EMISSION REDUCTION ACROSS ALL PORT ACTIVITIES
Ports present a unique opportunity to work with proponents and stakeholders to reduce emissions. By working in partnership with proponents and stakeholders, we can work to reduce all scope 1, 2 and 3 emissions.
RightShip Emissions Portal
In partnership with RightShip, PPA has developed a shipping emissions inventory for the Port of Ashburton and Port of Dampier. This portal allows shipping emissions to be monitored within the ports to understand where emissions are being generated at different locations within the port.
Conference Paper 25
the ports to understand where emissions are being generated at different locations within the port.

Joint Study - Green Ammonia Bunkering
Joint Study - Green Ammonia Bunkering
Yara Clean Ammonia and PPA have signed a Collaboration Agreement to jointly facilitate the uptake of clean ammonia as a marine fuel in the Pilbara region in Western Australia. The purpose of the agreement is to jointly assess the potential ammonia demand and required bunker infrastructure, leveraging off the existing world-scale ammonia production facility of Yara Pilbara and its clean ammonia potential in the region.
Sustainability Framework
Yara Clean Ammonia and PPA have signed a Collaboration Agreement to jointly facilitate the uptake of clean ammonia as a marine fuel in the Pilbara region in Western Australia. The purpose of the agreement is to jointly assess the potential ammonia demand and required bunker infrastructure, leveraging off the existing world-scale ammonia production facility of Yara Pilbara and its clean ammonia potential in the region.
PPA has developed a Sustainability Framework which outlines the process it follows to develop and maintain a sustainability strategy. The Framework comprises four stages and is centred around PPA’s four sustainability themes - people, planet, prosperity and partnerships.
Sustainability Framework
PPA has developed a Sustainability Framework which outlines the process it follows to develop and maintain a sustainability strategy. The Framework comprises four stages and is centred around PPA’s four sustainability themes - people, planet, prosperity and partnerships.
Conference Paper 26
Figure 2 – Heatmap of emissions from vessel operations within the Port of Dampier
Newcastle Exhibition & Convention Centre
5
Page 4 of
Figure 2 – Heatmap of emissions from vessel operations within the Port of Dampier

27
Conference Paper
Page 5 of 5
GreenPort Congress Oceania Paper Wednesday, 15 February 2023 Newcastle Exhibition & Convention Centre
Figure 3 – PPA’s Sustainability Framework Figure 3 – PPA’s Sustainability Framework
SIMON BYRNES Chief Commercial Officer, Port of Newcastle
BIOGRAPHY
Simon Byrnes leads the strategy, commercial, innovation, and business intelligence functions at the Port of Newcastle. The Port is embarking on an ambitious transformation to diversify its business which involves continuing to be the world’s most efficient energy export supply chain whilst creating, and then scaling, new markets in clean energy and the container trade.
Simon has in-depth experience in establishing new, trans-disciplinary teams that leverage diversity and drive a values’ lead approach to navigate complexity and develop resilience.
Prior to the Port of Newcastle, Simon led the aeronautical business function at Hobart Airport, doubling the number of destinations served by the airport in 18 months. Prior to that, Simon designed and delivered innovative infrastructure strategy, and the business architecture solutions, for a number of Australia’s leading infrastructure organisations, including MTR Australia, Transport for NSW, Sydney Trains, RMS, NBN Co and City of Sydney.
Simon has graduated from Harvard Business School’s flagship Advanced Management Program, is completing a master’s degree in Creative Intelligence and Strategic Innovation at UTS and has undergraduate degrees in Finance and Law from UNSW.
Simon is passionate about working with multi-disciplinary teams, transforming businesses and working with diverse stakeholders to leverage diversity and achieve amazing results. His intrinsic drivers are creativity and curiosity.

Speaker
28
Sustainability in Focus: Energising
Australia’s Deepwater Global Gateway
The Port of Newcastle is on an exciting and ambitious diversification journey with the goal of generating more than 50% of its revenue from sources outside coal by 2030.
We view diversification as adding new and additional trades and services for the benefit of the region. At GreenPort Congress Oceania we will talk about our approach to energising Australia’s Deepwater Global Gateway – Port of Newcastle - by activating our best asset, the Hunter Community.
We will explore this through the themes of:
1. Identity: What can the Port be? What is our role? How can we be more than a Port?
2. Connections: Between people and customers within the Hunter and around the World.
Then we will provide some concrete examples through our flagship projects:
1. Clean Energy; and
2. Container Trade.
Port of Newcastle is the world’s largest, and most efficient, coal export port. The Port comprises 777 hectares of which 388 are vacant. Despite being the busiest port on the east coast of Australia, we only utilise 50% of our channel capacity.
We are well serviced by Australia’s best rail network and will be the only port in Australia connected to the Inland Rail network once completed.
We are 220 years old and situated in a community that has grown up with the port as its soul. The streets are aligned to see what’s happening on the water. The blast furnace of the BHP steelworks was the metaphorical heart of the city.
Our catchment takes up most of Central and Northern NSW. We see ourselves as a servant to that region, we are a gateway, providing pathways to and from the world.
Our key trades are energy, agriculture, manufacturing and industrial commodities. The Port is surrounded by a world leading manufacturing and services industries.
Our key ESG targets are to reduce emissions by 30% by 2030 and be net zero by 2040. Our ESG strategy is a direct response to the accelerating global shift to a low carbon economy. We align our activities with the UN’s Sustainability Development Goals. Our dual objectives are to:
1. Inspire a thriving Hunter community; and achieve this
2. Whilst creating a socially responsible long-term value for our shareholders.
It’s been a swift journey, demonstrated by our progress in the GRESB assessments moving from 40 in 2019 up to 95 this year.
Our diversification target is ambitious and requires big moves. Trade through the Port relied on a single commodity for 98% and 71% of port revenue in 2018.
We remain committed to increasing the efficiency, and broader value proposition, for our existing customers. Hunter Valley coal is the highest calorific content, lowest cost of production
Conference Paper
29
into Asian markets. These markets have invested heavily into our region and rely on our trade for their energy security. We see the clean energy economy as an opportunity to trade new technology to an existing customer base. We are working closely with Japanese and South Korean companies to export clean energy by 2025. To achieve our 50/50 target by 2030, we need to create new and additional trade by:
1. Redefining what the Port can do – for example:
a. Make strategic investments along the supply chain;
b. Evolve its business model to be facilitate scale through the delivery of precinct wide solutions; and
2. Bottom-up engagement with the community and customers to create the opportunities they want to see.
In summary:
1. Port of Newcastle is the largest Port on the east coast of Australia;
2. We have plenty of room to grow;
3. We are seeking to leverage our opportunities to take a leadership position on driving a low carbon economy and a thriving Hunter community.
But how do you make that real for the community? Please come along to hear how we have applied our theory to our key diversification projects or visit our website for more information www.portofnewcastle.com.au
Conference Paper 30
JONATHAN ABRAHAMS
Head of Maritime Advisory, Advisory Australia Maritime, DNV Australia Pty Limited
BIOGRAPHY
Jonathan is the head of Maritime Advisory in Australia and has spent 15 years with DNV working in Europe, Middle East, Asia and ANZ. Jonathan is a very experienced Project Management including leading multi discipline scopes of work covering technical, operational and marketbased outcomes.

This has included several projects in Australia, Asia and Europe analysing vessel traffic in/around ports to quantify emissions and isolate opportunities to streamline the port-call process, cargo handling, berthing duration and energy demands.
He is also DNV’s Regional ESG/Sustainability Practice Lead and apart from delivering at a client level ESG-related services (including reporting), has regularly presented at conferences in Asia concentrating on the implementation of holistic sustainability strategies at a company level integrating the needs of regulators, cargo owners, employees and the general community.
Speaker
31
Incentivising cleaner shipping in Ports through the Environmental Port Index and other levers
INTRODUCTION:
Amongst the general public, a prevailing opinion is that the maritime sector has been historically slow in devising and then adopting measures that reduce the environmental impact of its’ operations – for example, in relation to reducing emissions by type intensity or total, or biofouling and ballast water. But this popular perception fails to recognise the sheer scale of the sector by design, requires an almost endless number of stakeholders, supply chains, regulators, jurisdictions and locations and financial actors to all work in sync just so a good/ product/service can be delivered on time and at low cost.
When you consider that the lead time for ordering and launching a new vessel is at best 3-years1, and once in operation will have a working life of approximately 20 years, the economic feasibility of changing anything such as the main engines to accommodate different fuels, is rather limited. This is due to the fact that when the owner needs to factor in upgrade costs, shipyard space and availability to do the work, off-hire loss of revenue, new training for crew, new suppliers, etc., the question of how much of these costs can be passed onto customers who are demanding ever-faster delivery times at lower cost and higher quality?
So, what is preventing a more complete and rapid uptake of alternative fuels and technologies amongst the world fleet in efforts to net off the impact of shipping on emissions inventories? Suffice to say that there is not one single reason, instead they can be grouped under three headings, ‘cost’ (including the above), ‘supply’ (of technology, yard capacity to install/build, fuel supplies in locations on the ship’s routes), and ‘regulations’ (related to safety, operations and compliance).
Ports can be the hub of the change as they can vastly influence solutions to the many of the key barriers Key drivers are regulations, investment and demand.
CONTEXT:
Despite the public voice for the maritime sector to reduce emissions, ship owners – typically driving the pace of change for the uptake of new technology / processes – generally do not buy-in to the need to find a solution for the greening of the sector. Why? Fundamentally because fuel costs are usually paid for by those chartering the ship … and thus there is relatively little incentive (and at worst case, need for urgency) for change.
More simply, the drive to be a first mover is a risky one given the time required to order a new ship, build the vessel, ensure that the ports can supply an alternative fuel and integrate the costs (premium) into the supply chain are neither quick nor easy to realise.
So, who should lead the charge?
One scenario could see Ports playing a pivotal role in establishing compatible infrastructure for fuel suppliers, implementing prudent safety/risk solutions, providing incentives for greener
Conference Paper
32
(1)
(2)
(3)
(4)
(5)
(6)
1 Stages generally are
development of requirements,
preliminary design/concept,
Contract design,
bidding/ contracting of shipyard,
detailed design and planning and
construction
ships to use their facilities. And even though in-port emissions are only a small portion of overall shipping emissions2 it could be argued that a green-er ship will have lower emissions not only whilst berthed but also on the transit to/from their load/unload locations.
This paper explores two such programs developed and underway in Scandinavia that are working towards establishing all the necessary building blocks for greener shipping.
ENVIRONMENTAL PORT INDEX
Background
It is widely accepted that shipping accounts for roughly 2-3% of global GHG emissions not to mention to the significant quantities of sulphur oxide (SOx), nitrous oxide (NOx) and particulate matter (PM). Thus, with the IMO imposing strict(er) limits on the maximum sulphur content in marine diesel fuel since 20203 – and earlier through designated sulphur emission control areas4 - not to mention the more generic aim of reducing shipping GHG emissions globally by 50% by 20505 compared to 2008 levels, it could be argued that the global regulations are moving in the right direction.
What is not as well reported is the estimate of ship emissions attributable to port areas. When the fact that cargo handling (loading and unloading) and anchorage account for a significant amount of time for the world fleet, recent estimates suggest up to 15% of all shipping generated CO2 occurs whilst in or around port6. This is significant in that local air pollution (as one of the main causes of premature deaths7) in ports (generally located in densely populated areas) combine to present a significant actual and perceived challenge to local and regional authorities.
On the back of these concerns, a group of Norwegian cruise shipping destinations joined forces in 2017 to identify how it could reduce the environmental impact of these types of ships when in port. The goal was to encourage cruise ship operators to implement environmentally friendly solutions by rewarding the best performers with reduced harbour fees. This became known as the ‘Environmental Port Index’ or EPI and has grown in coverage to today being implemented to 24 ports around the North Atlantic.
Objective and Goals
At the outset there was a single, clearly defined objective, ‘to establish a methodology to assess and score the environmental performance of a specific cruise ship’. This would then enable ports to incentivise ship operators to implement environmentally friendly technologies and operational practices by rewarding performance with reduced harbor fees for reduced emissions during the ship’s stay in participating ports.
Methodology
The program was designed on the back of a number of assumptions and ‘realities’ chief of which was a desire to keeping it simple to opt-in (for ship operators), administer (for ports) and sustain (based on results). Note also that the EPI only addresses emissions whilst in port, that is, no attention is placed on ship operations/performance before / after port arrival.
2 EPI – Marine Pollution Bulletin, Volume 149, December 2019, ‘Differentiating on port fees to accelerate the green maritime transition’
3 MARPOL Annex 6
4 SECA/ECAs currently in force include The Baltic Sea, The North Sea, the Caribbean, Pacific coasts of Canada and the USA, Hawaiian Islands (see Emission Control Areas (ECAs) designated under MARPOL Annex VI (imo.org))
5 See Initial IMO GHG Strategy
6 ‘Differentiating on port fees to accelerate the green maritime transition’, Mjelde et al, 2019
7 WHO, 2018
Conference Paper 33
5 At the heart of this was that the EPI program is a voluntary scheme which will only impact on port fees charged for each port stay.
5 It also needed to be sufficiently ‘real-time’ so that the benefits can be realised by participating ship owners as soon as possible after each port visit.
5 To avoid each port developing individual methods for evaluating environmental efficiency of a given ship, a cooperative effort between ten Norwegian ports was initiated in 2017 in which DNV provided support in the form of technical expertise.
5 Each participating ship is assigned an EPI Profile/score based on 4 key factors, each of which is weighted differently according to their impact on air quality.
5 Fuel quality:
9 Use of compliant fuels: consumption and fuel quality
9 Use of alternative fuels: consumption and fuel quality
5 Combustion performance:
9 NOx rating
9 Direct water injection
9 Exhaust gas recirculation
9 Engine load
5 Electrical power demand:
9 Shore power capability
9 Battery power capability
9 Energy efficiency measures
5 Exhaust cleaning capabilities/exhaust gas treatment:
9 SOx scrubbing
9 NOx scrubbing
9 Diesel particulate filters
The EPI score is calculated based on reported data emission and fuel consumption data compared with a defined baseline
5 Prior to first port of call in Norwegian waters, the ship’s “EPI profile” must be registered online in the “EPI portal” (this information is only entered once)
5 During departure from port, the ship must complete an “EPI departure report” (this information is entered after each port of call) which may include average load per running engine, fuel consumption, type of fuel and its sulphur content and use of exhaust cleaning technologies. This is completed via an online EPI Portal.
The ship’s EPI score for the specific port stay is then calculated when the departure report is received and used to calculate the applicable port fee.
The ‘score’ is on a scale of 0 – 100 with the higher the score, the bigger the achieved emission reduction (based on base line / profile) and subsequently, the larger the port fee reduction.
Conference Paper 34
Results
Results
Since inception, more and more ports in the North Atlantic are joining the program8. With this, the number of eligible port visits is similarly increasing.
Since inception, more and more ports in the North Atlantic are joining the program8. With this, the number of eligible port visits is similarly increasing.
2019 2022
2019 2022
5 4 ports
§ 4 ports
§ 567 port calls
5 567 port calls
§ 111 registered ships
5 111 registered ships
5 24 ports
§ 24 ports
§ Ca. 2200 port calls
5 Ca. 2200 port calls
§ 159 registered ships
5 159 registered ships
Based on the above activity, a number of key results have been achieved:
Based on the above activity, a number of key results have been achieved:
5 Average age of ships has decreased from ca. 23 years (2019) to 12 years (2022)
5 Younger ships are generally more efficient
§ Average age of ships has decreased from ca. 23 years (2019) to 12 years (2022)
o Younger ships are generally more efficient
§ Average sulphur content of fuel since 2019 is 0.35%
5 Average sulphur content of fuel since 2019 is 0.35%
5 Global average in 2019 was 2.75% and 2022 was 0.5%
o Global average in 2019 was 2.75% and 2022 was 0.5%
§ NOx emissions down 12% since 2019
§ SOx emissions down 39% since 2019
5 NOx emissions down 12% since 2019
5 SOx emissions down 39% since 2019
§ Participating ships improve their EPI score (that is, reduced emissions) by ca. 20% from their 1st to their 15th port call
o Continual improvement
5 Participating ships improve their EPI score (that is, reduced emissions) by ca. 20% from their 1st to their 15th port call
5 Continual improvement
From a ship owner’s perspective, the monetary reward varies between the ports, but in the extreme cases a ship that gets an EPI score of ‘0’ (based on the departure report submitted) can get up to a 150% increase in port fees (e.g. in Bergen if you get average score approx. approx. ‘40’, you pay 100k NOK for a medium sized cruise ship, if you get ‘0’ in score you pay 250k NOK
From a ship owner’s perspective, the monetary reward varies between the ports, but in the extreme cases a ship that gets an EPI score of ‘0’ (based on the departure report submitted) can get up to a 150% increase in port fees (e.g. in Bergen if you get average score approx. approx. ‘40’, you pay 100k NOK for a medium sized cruise ship, if you get ‘0’ in score you pay 250k NOK

Further, the EPI Program has been seen to influence how companies operate and profile of deployed fleet, with Cruise liners consistently using their newest ships in Norway, with these ships actively focused on minimizing emission when in port.
Further, the EPI Program has been seen to influence how companies operate and profile of deployed fleet, with Cruise liners consistently using their newest ships in Norway, with these ships actively focused on minimizing emission when in port.
Conference Paper 35
PAPER
Figure 1: Overview of EPI process
8 EPI AS is owned by the member ports, DNV is an advisor and provider of the IT platform i.e. EPI Portal
Figure 1: Overview of EPI process
8 EPI AS is owned by the member ports, DNV is an advisor and provider of the IT platform i.e. EPI Portal
From an administrative point of view, there has been a consistently high reporting rate within the 72h time window after port departure (indicating (a) motivated participants and (b) the incentive is sufficiently high to warrant focus), an ongoing QA process monitors for reporting errors and corrects them in a timely manner and that anecdotally, most support requests are related to user access (and not program function/tools).
The Future
Throughout, feedback is received from all parties involved so that any challenges, suggestions, ideas and feedback are captured and where appropriate acted upon.
This has included recognition that some external pressure (from the general community) is needed on the port for them to have interest in the environmental impact of the cruise industry as most cruise destinations (i.e., ports) are not very mature on this topic which makes it harder to sell the concept and benefits of the EPI program.
In terms of what the EPI may evolve into in the short term, there are already ongoing discussions about how to expand its applicability to include new emissions sources (e.g., emissions to sea, noise etc.) as well new fuel types (and their respective technologies), whilst in the longer term the possibility of including other other ship segments is being considered.
NORDIC ROADMAP – FUTURE FUELS FOR SHIPPING
Background
The Green Shipping Programme9 in Norway commenced in 2015 with the aim to develop and strengthen Norway’s goal to establish the world’s most efficient and environmentally friendly shipping. It was established by the Norwegian Government and aimed to establish publicprivate partnerships (operating in/around Norwegian waters) and at all levels of government in developing solutions to reduce emissions generated by the maritime sector.
When paired with the various maritime decarbonisation targets (by 2050) set by international, regional and national bodies the pace of change is way too slow – that is, based on current transition, the maritime sector will not achieve any of the targets set.
This is borne out by DNV’s most recent Energy Transition Outlook (2022) that estimates that at the current rate, ‘we are heading towards a 2.2oC global warming by the end of the 21st Century and that a war-footing policy on implementation is need to secure net-zero by 2050’. And that the responsibility of the OECD and other leading regions is greater than ever meaning that these countries must be net zero by 2043 and net negative thereafter with China needs to reduce emissions to net zero by 2050. Further that whilst renewable electricity, hydrogen and bioenergy are essential, they alone are insufficient: almost a quarter of net decarbonization relies on carbon capture and removal combined with land-use changes (reduced deforestation).
5 5% carbon neutral fuels (in shipping) needed in 2030 even with current ambitions
5 Decarbonisation by 2050 requires significant acceleration from 2030
5 No solution that fits all segments - preparation across many solutions needed
5 Short sea shipping will lead the transition but deep sea needs to prepare as well
9 See The world’s most efficient and environmentally friendly shipping - Green Shipping Programme
Conference Paper 36
Short version – those that can, must take more action now and instead focus on what can be done today within each stakeholder’s locus of control and not of wait for everyone to do their equal part.
“Don’t let the perfect be the enemy of the good.” Voltaire
It could therefore be argued that the countries comprising the ‘Nordic’ region, Denmark, Finland, Iceland, the Faroe Islands, Norway, Sweden, Greenland and Aland10, have decided to work together, cross borders, to do what they can to enable the maritime sector to invest, adopt and sustain greener operations. This has resulted in the establishment of the project ‘Future Fuels for Shipping’11. A four-year Nordic collaboration (2022 to 2025), with a budget of 2.4 MEUR commenced in 2022.
Objective and Goals
The overall aim of the Future Fuels for Shipping (FFS) project is to reduce key barriers to implementation and establish a common roadmap for the whole Nordic region and logistics ecosystem towards zero emission shipping. The objectives can be summarised as follows:
5 Gain technical knowledge and regulatory development
5 Develop a Nordic Roadmap for future fuels
5 Establish a Nordic cooperation platform and piloting
Methodology
As mentioned, the ‘Nordic Roadmap / Future Fuels for Shipping’ Project leveraged off previous studies and knowledge derived from the Green Shipping Programme. It is true to say that there was no single activity that was the catalyst for the establishment of the FFS Project instead, staying true to the saying ‘don’t re-invent the wheel’ the approach adopted – in order to achieve both rapid progress and ongoing development – was one of knowledge sharing and leveraging as much as possible from work undertaken by the countless other stakeholders in the battle to decarbonize.
Chief amongst these, and consistent with the acknowledgement that the ‘Nordic region is only one part of the global puzzle, was the agreement to focus on the application of a ‘green corridor’ model in the development of activities under the FFS Project.
5 Green shipping corridors: “zero-emission maritime routes between two (or more) ports”12
As such a 1-year pre-pilot study ‘to promote intra-Nordic Green Shipping Corridors13 that can be realised by 2025’ was completed that sought to identify specific shipping routes for decarbonisation, simultaneously to identify relevant and interested actors and to establish partnerships for specific projects.
10 See Front page | Nordic cooperation (norden.org)
11 See About the project – Future Fuels Nordic
12 Policy Paper COP 26: Clydebank Declaration for green shipping corridors, signed by 22 countries. COP 26: Clydebank Declaration for green shipping corridors - GOV.UK (www.gov.uk)
13 See Green-Corridor-Paper_Nordic-Roadmap.pdf
Conference Paper 37
These stakeholders cover the full logistics chain and to be truly effective need to establish a viable business case to participate in anything that is beyond business-as-usual. Naturally, these reasons will vary greatly so a great deal of understanding, anchored by a common goal, is needed to build sufficient trust to progress.
As a part of the pre-pilot study, the following parties were engaged:
5 Port perspective addressing: infrastructure needs, market needs (for new fuels), safety needs, policy and regulations
5 Fuel supplier perspective addressing: feedstock availability, market outlook, ROI
5 Regulator perspective addressing: predictable outcomes and future needs, safety onshore and onboard
5 Cargo owner perspective addressing: unit cost to transport, risks, ROI of green versus not
5 Finance perspective addressing: ROI n green fuels and green ships and infrastructure
5 Shipowner perspective addressing: technical and economic feasibility
A series of high-level screening activities were carried out for potential ‘corridors, the first focusing on the key areas as follows:
5 GHG potential
5 Regularity (of trade)
5 Stakeholder motivation
5 Ship (type)
5 Fuel flexibility at start/end ports
5 Potential for electrification
And the second (screening activity) focusing on:
5 Technical maturity of vessels and ports
5 GHG abatement potential
5 Financial barriers
5 Fuel/Port readiness
5 Safety and regulations (in place)
5 Stakeholder motivation
5 Organisational barriers
From this initial flurry, focus was then placed on developing a roadmap for the introduction of sustainable zero-carbon fuels in the selected green corridors. This was to be achieved in the main through the conduct of pilot studies, the results of which are then made available for the wider public for adoption (or adaptation).
Conference Paper 38
A comprehensive project plan – which drives the selection of relevant pilot studies - was devised covering the following:
5 Fuel scorecard that identified relevant fuels
5 Lifecycle assessment (well-to-wake) of chose fuels
5 Regulatory framework incorporating international, regional ad local needs
5 Traffic and infrastructure needs
Results to date
As above, the identification of relevant and invested stakeholders is the key to success and that has resulted in a wide range of organisations from academia, research, OEMs, ports, fuel suppliers, ship owners, cargo owners and government agencies.
As per the Green Shipping Program model, the key deliverables centre around the conduct of multiple pilot studies that feed into the overall roadmap. These combine to bolster the knowledge base for future fuels that can support the development of business cases at scale in the future.
Results to date
As per the Green Shipping Program model, the key deliverables centre around the conduct of multiple pilot studies that feed into the overall roadmap. These combine to bolster the knowledge base for future fuels that can support the development of business cases at scale in the future.

Pilot studies completed to date:
Pilot studies completed to date:
• Life cycle assessment of Marine Fuels in the Nordic Region
5 Life cycle assessment of Marine Fuels in the Nordic Region
• AIS Analysis of Nordic Ship Traffic
5 AIS Analysis of Nordic Ship Traffic
• Screening of sustainable zero carbon fuels
5 Screening of sustainable zero carbon fuels
• Infrastructure and bunkering challenges for selected fuels
5 Infrastructure and bunkering challenges for selected fuels
• State of play – status on regulatory development of zero-carbon fuels
• Fuel properties and their consequences for safety and operability
5 State of play – status on regulatory development of zero-carbon fuels
• Insight on Green Shipping Corridors
5 Fuel properties and their consequences for safety and operability
5 Insight on Green Shipping Corridors
Apart from those studies listed above, there are many allied activities in progress including the collaboration with other similarly focussed programs worldwide. This aspect – collaboration –is germane to the Nordic Roadmap / Future Fuels for Shipping and a vital component in the path to carbon neutrality on a global scale, particularly in the differing demands faced by onshore, shipping and general communities
Apart from those studies listed above, there are many allied activities in progress including the collaboration with other similarly focussed programs worldwide. This aspect – collaboration –is germane to the Nordic Roadmap / Future Fuels for Shipping and a vital component in the path to carbon neutrality on a global scale, particularly in the differing demands faced by onshore, shipping and general communities.
How this plays out in the future will differ from location to location but regardless, a lifecycle approach is required to unlock the potential business opportunities for those willing to be proactive (as opposed to being the first of the last to move).
Ports uniquely placed in effecting change across the entire value chain as they are more of a known quantity based on static location, demand and trade patterns and simpler/singular set of rules than a ship typically moving through and between multiple jurisdictions and governance frameworks.
Similarly, in many cases where a single port services a large population of consumers, they can move from being a price taker (“this is what the market expects us to do”) to a price maker
Conference Paper 39
Paper Nordic Roadmap PAPER
Figure 2: Simplified illustration of interconnections between selected stakeholders in a green shipping corridor ecosystem 14
14 P13, Green Corridor
Figure 2:Simplified illustration of interconnections between selected stakeholders in a green shipping corridor ecosystem. 14
How this plays out in the future will differ from location to location but regardless, a lifecycle approach is required to unlock the potential business opportunities for those willing to be proactive (as opposed to being the first of the last to move).
Ports uniquely placed in effecting change across the entire value chain as they are more of a known quantity based on static location, demand and trade patterns and simpler/singular set of rules than a ship typically moving through and between multiple jurisdictions and governance frameworks.
Similarly, in many cases where a single port services a large population of consumers, they can move from being a price taker (“this is what the market expects us to do”) to a price maker through facilitating the establishment of necessary supply chains, safety regimes and market based measures that will shift the needle from a situation whereby ‘being green is too expensive’ to one where ‘not being green is too expensive’.
Conference Paper 40

MAKING MARINE OPERATIONS SAFER AND MORE EFFICIENT, EVERY TIME, EVERYWHERE svitzer.com.au Svitzer Australia @svitzerau Partnering for a greener, more sustainable future
Net Zero Carbon Cruising SESSION 2 42
JOEL KATZ Managing Director, CLIA Australasia

BIOGRAPHY
Joel Katz has led Cruise Lines International Association (CLIA) Australasia as its Managing Director since 2016 after an extensive career in cruising and hospitality, including roles at sea, in the UK, Europe, Central Asia and Australia.
In this role, Joel heads an Australasia based team that is responsible for the promotion and development of the cruise industry across the region through trade relations, industry training, and advocacy activities on behalf of CLIA’s Cruise Line Members.
He has led the regional organisation through significant growth in membership, and prepandemic helped cement the region’s place as one of the fastest growing cruise markets in the world in terms of population penetration.
Through the pandemic, Joel worked closely with cruise line leadership, industry partners, and governments across the region to advocate for a responsible cruise resumption
Moderator
43
JOEL KATZ Managing Director, CLIA Australasia
BIOGRAPHY
Joel Katz has led Cruise Lines International Association (CLIA) Australasia as its Managing Director since 2016 after an extensive career in cruising and hospitality, including roles at sea, in the UK, Europe, Central Asia and Australia.
In this role, Joel heads an Australasia based team that is responsible for the promotion and development of the cruise industry across the region through trade relations, industry training, and advocacy activities on behalf of CLIA’s Cruise Line Members.
He has led the regional organisation through significant growth in membership, and prepandemic helped cement the region’s place as one of the fastest growing cruise markets in the world in terms of population penetration.
Through the pandemic, Joel worked closely with cruise line leadership, industry partners, and governments across the region to advocate for a responsible cruise resumption
Speaker
44
Cruise is sailing to a better future
Cruise lines are leading the way toward a more sustainable future, investing in innovative technologies aboard our global fleet of cruise ships.

5 Reducing the carbon footprint of ships while at berth and at sea
5 Investing in advanced environmental technologies onboard
5 Partnering with cities and ports on sustainable destination management
Fueling the Future
5 LNG
Cruise lines are realising the benefits of LNG now as a transitional fuel— which has virtually zero sulfur emissions, a 95% to 100% reduction in particulate emissions, an 85% reduction in NOx emissions, and up to a 20% reduction in greenhouse gas emissions—and increasing the number of ships that are able to utilise LNG for primary propulsion.
5 SUSTAINABLE MARINE FUELS AND PROPULSION The cruise industry is at the forefront of exploring sustainable marine fuels, including biofuels and other advanced approaches such as biodiesel, methanol, ammonia, hydrogen, and electric batteries.
5 HYBRID SOLUTIONS More than 15% of the new vessels to be launched in the next five years will be equipped to incorporate fuel cells or batteries, as part of a hybrid approach towards lowering the carbon footprint of the voyage.
More information available at www.cruising.org
Conference Paper
45
Shoreside Electricity
Cruise lines continue to make significant investments for cruise ships to connect to shoreside electricity—with the vast majority of new ships coming online between now and 2028 able to plug in to shoreside electricity.
98% of global capacity currently on order book through 2028 of the new build capacity is either committed to be fitted with shore-side electricity systems or will be configured to add shoreside power in the future.
Where can cruise ships connect? Currently, 29 ports worldwide have at least one cruise berth equipped with onshore power—representing less than 2% of the world’s ports where that capability is provided in at least one cruise berth in the port.
Advanced Wastewater Treatment Systems
Advanced wastewater treatment systems are often equivalent to the best shoreside treatment plants and go well beyond international requirements.
100% of new ships on order are specified to have advanced wastewater treatment systems 78% of the CLIA ocean going cruise line fleet capacity is served by advanced wastewater treatment systems (an increase of 4 percentage points over 2021).
A Sea of Supporting Innovations
Supporting these environmental technologies are a sea of supporting innovations and practices that are helping the cruise industry sail to a greener future.
Our Journey By The Numbers
We’re measuring our journey toward a more sustainable future using aggregated data across CLIA’s global oceangoing cruise line membership. This data reflects the number of ships equipped with certain technologies, corresponding passenger capacities (lower berth at double occupancy) and the percentage of the entire fleet represented.
Conference Paper 46
Sailing towards zero carbon
Cruise lines are charting the course to net zero carbon cruising by 2050 – reducing the carbon footprint of ships while at berth and at sea; investing in advanced environmental technologies onboard; and partnering with cities and ports on sustainable destination management. Cruise Lines International Association (CLIA) Managing Director Australia & Asia Joel Katz explains more ahead of February’s Greenport Congress Oceania in Newcastle, Australia.
What are the biggest changes cruise lines have made on board their ships in recent years to lower their environmental footprint?


With every new ship come new technologies and greater efficiencies that make them more sustainable than those they replace. Undoubtedly one of the biggest areas of advance in recent years has been the growth in new ships powered by liquid natural gas, which produces zero sulphur emissions, 85% lower nitrogen oxide emissions and almost 100% fewer particulate emissions.
The world’s first LNG-powered ship was introduced at the end of 2018 and numbers are increasing – currently 61% of new-build capacity will rely on LNG fuel for primary propulsion. LNG is also a transitional fuel. This means it provides real benefits now, but also allows LNGready ships to adapt to a future generation of fuels that will bring even further benefits in coming years.
What part are new fuels playing in reducing emissions in cruising? What are some of the most promising possibilities?

CLIA ocean-going cruise lines have committed to pursue net-zero carbon cruising by 2050 and an enormous amount of work is going on to achieve this. Cruise lines are investing in pilot projects and joint ventures aimed at developing alternatives like biofuels and synthetic fuels which will be more sustainable than current options.
There is also a lot of research and development focussed on other alternative fuels like methanol, ammonia, and hydrogen, often in collaboration with ship builders, fuels suppliers and other partners.
There are still hurdles to overcome before Cruise lines are working with developers Ship design has changed considerably options like these can be put into practice
Conference Paper
47
– and there will be other challenges around scaling the technology and building reliable supply infrastructure – but cruise lines are among the leaders in the maritime sector when it comes to investing an developing new low-emission technologies like this.


We’ve seen hybrid ships sailing in the Arctic - can you see a time when ships might be sustainably powered by electricity?
Electricity is another big area of research and we’re already seeing the results of investment and experimentation in this area. Hybrid propulsion systems are already in use by several cruise lines and can store power in electrical form and utilise it for propulsion when conventional engines are powered down. This not only reduces fuel use, it also allows ships to sail quietly. This is possible today for smaller sized vessels and research is underway to see how the technology can be scaled up. We need to bear in mind that different solutions might need to apply to different vessels, depending on their size and types of operations.
Another key area when it comes to electricity is in the use of shoreside power supply, which allows ships to plug in to sustainable electricity while in port and shut down their main engines. All CLIA member ships are going to be equipped to connect to shoreside electricity facilities as soon as possible, and no later than 2035.
Right now, 40% of global capacity is fitted to operate on shore-side electricity in the 29 ports worldwide where that capability is provided, and 98% of new build capacity is either committed to be fitted with shore-side electricity systems or will be configured to add shore-side power in the future.
A lot of the innovation we’re seeing in sustainability stems from clever design and new technologies. Quite significant power savings are being made through things like the design of the propulsion system, or the use of low friction hull coatings to help the ship pass more efficiently through the water, and thereby use less fuel. There are also air lubrication systems in use today that produce millions of tiny air bubbles around a ship’s hull to reduce resistance
Conference Paper 48
and fuel use. Some of the most fascinating advances made on cruise ships recently are through advanced software and digital tools.
Cruise ships are very complex machines, like small cities, so cruise lines have been deploying increasingly sophisticated software systems that can monitor the various functions on board and improve their efficiency.

Computers can now gather extensive amounts of data using onboard automation systems and sensors, and then optimise energy use so that everything runs efficiently and uses less fuel.
What are the biggest strides in waste management you’ve seen over recent years?
Cruise lines have had a focus on reducing waste for quite some time, and this has only increased in importance. Not only is there an environmental imperative, but it simply doesn’t make sense to bring unnecessary materials on board if they need to be taken away again as waste.
Cruise ships have complex systems for reducing waste and sorting materials for recycling. Some cruise operators can repurpose up to 100% of waste generated on board by removing, reusing, recycling, and converting waste to energy. The extent of recycling onboard is often superior to that of many cities that ships visit.

We are also seeing further advances in areas like advanced wastewater treatment systems which are already used on 74% of global cruise capacity and which will be fitted on 100% of future capacity on order. These systems treat wastewater to a higher standard than those used in many coastal cities, to protect the marine environment.
Other new waste technologies include onboard food
Conference Paper 49
Some cruise operators can repurpose up to 100% of waste generated on board by removing, reusing, recycling, and converting waste to energy.
“ ”
Appendix 1. Environmental Technologies and Practices 2022
CLIA Global Oceangoing Cruise Lines -August 2022
This table provides aggregated data across CLIA’s global oceangoing cruise line membership. The table reflects the number of ships equipped with certain technologies, corresponding passenger capacities (lower berth at double occupancy) and the percentage of the entire fleet represented.
Cruise lines continue to transform the modern fleet to protect the oceans, air and destinations enjoyed by millions of passengers each year. CLIA’s Waste Management Policy is available here. Each year, cruise line CEO’s verify implementation as a conditionof membership. The Policy is incorporated into each ship’s Safety Management System (SMS) and is subject to third party and internal auditing.Additional environmental reports, including third party research on air and waste water performance, are available here. Many individual cruise line sustainability reports are publicly available on company websites.
Conference Paper 50
Appendix
INVESTMENTS, COMMITMENTS AND PRACTICES SHIPS REPORTING (279 Total Fleet) CAPACITY LOWER BERTH DOUBLE OCCUPANCY (579,54 5 Est. Total Fleet) AGGREGATE % OF REPORTING CAPACITY NOTES Oceangoing Ships Reporting 241 555,635 95.9%
New Ships On Order 53 141,912 Ships (to be) added to the fleet between 1 January and 31 December of Measure Year 9 26,912 Ships (planned to be) removed from the fleet between 1 January and 31 December of Measure Year 5 6,747 1.2% Average age of fleet as of 1 January of Measure Year 14.1
GAS (LNG)
LNG has virtually zero sulfur emissions, a 95% – 100% reduction in particulate emissions, an 85% reduction in NOx emissions, and up to a 20% reduction in greenhouse gas emissions.
Many cruise ships are equipped to operate on both biodiesel and traditional fossil fuels. Cruise lines are investing in pilot projects aimed at developing sustainable marine fuels including biofuels and synthetic fuels to operate, where possible, with existing ship systems. Several companies are exploring fuel cell and equivalent technologies for future new builds or retrofit projects.Ships use Marine Gas Oil (MGO) in many regions to comply with IMO ECAs (North America & Caribbean Sea, North Sea and Baltic Sea), EU Mediterranean Sea ports, the Arctic, China’s emission control area, Australian ports and to meet other locally imposed requirements. Ships may also use Very Low Sulphur Fuel Oil (VLSFO) or Ultra Low Sulphur Fuel Oil (ULSFO) in these regions to comply with emissions requirements. Ships fitted with EGCS will generally use this equivalent technology unless its use is not permitted and will use MGO where specifically required. CLIA Members have also committed to not burn HFO in the Arctic ahead of the IMO use and carriage ban.
Conference Paper
NATURAL
INVESTMENTS, COMMITMENTS AND PRACTICES SHIPS REPORTING (279 Total Fleet) CAPACITY LOWER BERTH DOUBLE OCCUPANCY (579,54 5 Est. Total Fleet) AGGREGATE % OF REPORTING CAPACITY NOTES Ships able to operate on LNG in port 11 44,431 8.0%
Ships using LNG as primary fuel for propulsion 9 37,859 6.8% New build ships committed to use LNG as primary fuel for propulsion 23 86,832 ALTERNATIVE
INVESTMENTS, COMMITMENTS AND PRACTICES SHIPS REPORTING (279 Total Fleet) CAPACITY LOWER BERTH DOUBLE OCCUPANCY (579,54 5 Est. Total Fleet) AGGREGATE % OF REPORTING CAPACITY NOTES Ships capable of using alternative fuels other than LNG (methanol, biodiesel etc.) 179 415,385 74.8%
LIQUIFIED
FUELS
SHORE SIDE ELECTRICITY
The following 29 ports specific berths visited by CLIA oceangoing ships are fitted with shore side electricity capability for at least one berth: North America: Brooklyn NY, Juneau AK, Long Beach CA, Los Angeles / San Pedro CA, Oakland CA, San Diego CA, San Francisco CA, Seattle WA, Halifax NS, Montreal QC, VancouverBCEurope & UK: HamburgAltona, Kiel, Rostock-Warnermunde, Civitavecchia, Genoa, Bergen, Flam,Karmsund, Kristiansand,Trondheim, Verko, Ystad, Southampton Asia: Qingdao, Shanghai, Shengzen, Xiamen, Incheon
POLLUTION & ENERGY EFFICIENCY TECHNOLOGIES
Some ships equipped with Selective Catalytic Reduction systems (SCR) use them in every port and when transiting inbound and outbound.
Conference Paper 52
INVESTMENTS, COMMITMENTS AND PRACTICES SHIPS REPORTING (279 Total Fleet) CAPACITY LOWER BERTH DOUBLE OCCUPANCY (579,54 5 Est. Total Fleet) AGGREGATE % OF REPORTING CAPACITY NOTES Ships fitted with Shore Side Electricity (SSE) systems 81 222,941 40.1%
Ships planned to be retrofitted with SSE systems 83 163,680 29.5% New build ships committed to be fitted with SSE systems 45 139,468
AIR
INVESTMENTS, COMMITMENTS AND PRACTICES SHIPS REPORTING (279 Total Fleet) CAPACITY LOWER BERTH DOUBLE OCCUPANCY (579,54 5 Est. Total Fleet) AGGREGATE % OF REPORTING CAPACITY NOTES Ships fitted with particulate filters 26 69,041 12.4%
ADDITIONAL
Ships fitted with Selective Catalytic Reduction (SCR) Systems 37 60,845 11.0% Ships capable of complying with NOx Tier III limits 41 85,975 15.5% Ships that have air lubrication systems fitted 19 63,314 11.4% Ships withlow friction antifouling hull coatings installed 231 532,843 95.9%
Many ships are equipped with advanced waste water treatment systems (AWTS) that are capable of exceeding MARPOL Annex IV requirements and are operated to meet or exceed the more stringent sewage discharge criteria in Alaskan waters and/or the Baltic Sea Special Area, as well as gray water requirements under the U.S. Vessel General Permit (VGP). CLIA Member Lines recognize the extraordinary eutrophication situation in the Baltic Sea. CLIA supports the special area requirements for MARPOL ANNEX IV waste and works with the local and regional authorities for its success, including the existing commitment to provide adequate Port Reception Facilities. By CLIA policy, bio-residual from advanced waste water treatment systems may be landed ashore, dried and incinerated or discharged at sea in accordance with MARPOL Annex IV when the ship is more than 12 nm from nearest land while moving at a speed greater than 4 knots.
Conference Paper 53 WASTE WATER INVESTMENTS, COMMITMENTS AND PRACTICES SHIPS REPORTING (279 Total Fleet) CAPACITY LOWER BERTH DOUBLE OCCUPANCY (579,54 5 Est. Total Fleet) AGGREGATE % OF REPORTING CAPACITY NOTES Ships that have an advanced waste water treatment system on board, approved, used and capable of meeting or exceeding IMO MARPOL Annex IV discharge norms 182 434,070 78.1%
New build ships that will have an advanced waste water treatment system on board, approved and capable of meeting or exceeding IMO MARPOL Annex IV discharge norms. 53 141,912 Ships that have a waste water treatment system on board, approved and capable of meeting the discharge standards of the IMO MARPOL Annex IV Baltic Sea Special Area 62 129,862 32.4%
Conference Paper 54 OTHER INVESTMENTS, COMMITMENTS AND PRACTICES SHIPS REPORTING (279 Total Fleet) CAPACITY LOWER BERTH DOUBLE OCCUPANCY (579,54 5 Est. Total Fleet) AGGREGATE % OF REPORTING CAPACITY Ships with low friction anti-fouling hull coatings installed 231 532,843 95.9% Ships with a Biofouling Management Plan 5232 552,037 99.4% Ships fitted with Water Fuel Emulsion (WFE) technology/ treatments 52 119,913 21.6%
PHILIP HOLLIDAY CEO and Director,
Port Authority of NSW

BIOGRAPHY
Appointed CEO December 2019.
As CEO and Director, Philip leads Port Authority in managing the navigation, security and operational safety needs of commercial trade and cruise shipping in Sydney Harbour, Port Botany, Newcastle Harbour, Port Kembla, Eden and Yamba.

Philip joined Sydney Ports Corporation in 2011 as Executive General Manager, Operations and Harbour Master. Following the amalgamation of the Sydney, Newcastle and Port Kembla port corporations, he then became Chief Operating Officer and Harbour Master, Sydney.
Philip spent his early career in the shipping industry, gaining his Class 1 (FGN) Masters certificate before joining the UK’s largest port operator, Associated British Ports (ABP) in a port operations role. Following a number of roles within ABP he became the Harbour Master for the ABP Port of Southampton and the Marine Advisor for the group’s 21 UK ports
Speaker
55
Shipping Decarbonisation: Renewable Shore Power
Introduction
Port Authority of New South Wales (Port Authority) manages the navigation, security and operational safety needs of commercial shipping in New South Wales (NSW). This comprises the major ports of Sydney Harbour, Port Botany, Newcastle Harbour, Port Kembla, Eden and Yamba. With over 6,000 visits from trade and cruise vessels each year, the ports of NSW contribute billions of dollars to our economy.
Across six ports, Port Authority delivers safe and efficient marine services, including: harbour master functions; marine pilotage; as well as vessel traffic services; emergency response; and providing cruise terminal operations amongst a range of other functions.
Bays Port in Sydney Harbour comprises seven operational berths at Glebe Island and White Bay, surrounded by commercial and residential developments in heart of the city. The port comprises one of two cruise berths in Sydney and also provides facilities for bulk imports –sugar, cement and gypsum.

Background
Two years ago, Port Authority commenced a journey towards sustainability that would see green shoots appear across the business driving real change. It has been a transformative journey driven by the passion of the small State-Owned Corporation’s staff, Executive and Board, under the leadership of a new CEO.
Conference Paper
56
Figure 1: Bays Port holds significant potential for NSW, as it will develop and grow to meet the needs of the city. This paper describes how shore power and decarbonisation is key to the future of Bays Port
Embedding sustainability at Port Authority is an ongoing transformative project requiring some very large steps in areas that Australian ports had previously been hesitant to undertake. Operating in ports across NSW, Port Authority felt uniquely placed to drive positive change across the maritime and shipping sectors of NSW.
The journey started with creating a Sustainability Plan directly involving around 20% of Port Authority’s staff and using the UN SDGs as a guide. The process dovetailed into the development of a new Vision and Strategic Plan.
The sustainability plan was developed in collaboration with staff and external stakeholders and created a sense of ownership from our people that is already influencing change and delivering sustainability benefits and outcomes well beyond our own organisation. In a very short period, Port Authority has managed to embed sustainability into the very values, vision and strategic plans and priorities of the business.
This plan has led to the implementation of key initiatives as part of our net zero strategy, including our commitment to installation of shore power. This following sections describe our commitment contributing to the decarbonisation of shipping, those of our industry partners and the benefits that we intend to achieve through these initiatives.
2 Sustainability Planning
Port Authority’s Sustainability Plan is the product of a new approach, acknowledging the role staff and stakeholders play in implementing the plan, and utilising co-design activities to engage all parties through the process. It incorporates contemporary thinking in organisational dynamics, design, and sustainable development into a coherent, strategic plan.
The process was recognised by Good Design Australia awarding Port Authority a 2020 Good Design Award (Design Strategy) and again in 2021 by achieving Bronze Partner status in the NSW Government’s Sustainability Advantage Program for commitment, determination and progress in embedding sustainability across our organisation. Port Authority is now on track to achieve Silver Partner status with the ongoing roll out of sustainability initiatives. Following on from this formal recognition, in late 2022 we were awarded a prestigious NSW government Sustainability Award, in the category of Large Business Transformation.
Over 60 of Port Authority’s staff were directly involved in the co-creation of the sustainability plan, along with key external stakeholders.
Over 40 potential social, environmental, economic and organisational initiatives were prioritised to create a sustainability plan with four key focus areas, 13 opportunity areas and a wide variety of potential initiatives – all creating a strategic sustainability framework supporting our goal of embedding sustainability across the organisation.
The sustainability plan ultimately identified 13 opportunity areas and a range of suggested new initiatives. These opportunity areas were organised across four core focus areas:
5 our people
5 operations and ways of working
5 environment and places and
5 communities and partnerships.
Conference Paper 57
Our Sustainability Plan guides Port Authority to become more sustainable and provides a scalable operating model for defining, developing and delivering consistent and structured sustainability initiatives. The plan is supported by a toolkit to help teams develop their sustainability initiatives.
Our Sustainability Plan uses the UN SDGs as a guideline to ensure our initiatives support national and international sustainability goals and contribute to global sustainability efforts. Each of our sustainability opportunity areas has been mapped against one or more of the 17 UN SDGs and all sustainability initiatives are developed with reference to and mapped against the relevant UN SDGs as they are developed. The Sustainability Plan has driven the development and delivery of many sustainability initiatives over the last two years, including priority initiatives contributing to our net zero strategy: shore power and reduction in scope 3 emissions, as described below.
Shore power - in consulting with our stakeholders and local community on the possibility of introducing shore power for ships at berth we realised there are significant barriers to implementing this technology in Australia including cost, resources, electricity supply, culture, and safety. Understanding and seeing alignment in each party’s sustainability goals and realising that there could be both global and local benefits from shore power was key to gaining support and commitment from our partners.
Scope 3 emissions - we are developing partnerships with private sector port managers in NSW, as well as key shipping lines and other key stakeholders. Collaborating and partnering will be essential to understand and quantify vessel emissions in the ports and to identify and progress reduction options for scope 3 emissions.

The sustainability plan is a 5 year plan, aligning with the term of our business strategy.
3 Net Zero Commitments
Port Authority’s net zero commitments were made in March 2022 as a key action arising from our Sustainability Plan.
We have committed to reaching net zero by 2040 and a 75% reduction in scope 1 and 2 emissions by 2030. The NSW Government has committed to becoming net zero by 2050; and to reduce emissions by 70% by 2035.
Port Authority has committed to reaching net zero a decade before the rest of the NSW Government and three quarters of that within the next 8 years which is an ambitious target that contributes to the overall aspirations of the NSW Government to decarbonise its operations. The Australian government has recently committed to becoming net zero by 2050.
By the end of 2023, we will shift to 100% renewable electricity consumption for our own activities (ie scope 2 emissions). We have already made this shift in Bays Port by entering into a Power
Conference Paper 58 GreenPort Congress 2023 Paper Port Authority of New South Wales | Page 3 These opportunity areas were organised across four core focus areas • our people • operations and ways of working • environment and places and • communities and partnerships.
Purchase Agreement for wind and solar for our major sites.
We will be embarking on several major initiatives to meet our net zero targets – some of these initiatives include:
Scope 1 and 2 – covering our fleet and facilities which Port Authority controls
5 Investigating vessel fleet efficiencies
5 Investigating and delivering efficiencies for our buildings, including installation of on site solar for the sites we operate across NSW
Scope 3 – which significantly contribute to Port Authority’s carbon emissions, but are not in our direct control
Scope 3 – which significantly contribute to Port Authority’s carbon emissions, but are not in our direct control
5 Investigation of renewable electricity for Bays Port – precinct wide (ie for tenant facilities)
• Investigation of renewable electricity for Bays Port – precinct wide (ie for tenant facilities)
5 Provision of renewable shore power for Bays Port
• Provision of renewable shore power for Bays Port
Our commitment is based on the below timing to reach net zero by 2040:
Our commitment is based on the below timing to reach net zero by 2040:
4 Shore Power Commitment
4 Shore Power Commitment
Port Authority conducted an assessment of our scope 3 emissions and found that a significant component of our emissions is from ships that operate within our ports (estimated to be roughly 77% of our total scope 3 emissions). Addressing these emissions is a significant task to be addressed industry-wide.
Port Authority conducted an assessment of our scope 3 emissions and found that a significant component of our emissions is from ships that operate within our ports (estimated to be roughly 77% of our total scope 3 emissions). Addressing these emissions is a significant task to be addressed industry-wide.
In terms of degree of control, we have a stronger degree of control over ships when they are at berth at our wharves.
In terms of degree of control, we have a stronger degree of control over ships when they are at berth at our wharves.
We have committed to White Bay Cruise Terminal being the first shore powered cruise berth in the Southern Hemisphere, set to be operational 2024, and additionally one of four of our commercial bulk shipping berths will go live by end of 2024. The remaining berths will be connected by 2030. These will be provided with 100% renewable power.
We have committed to White Bay Cruise Terminal being the first shore powered cruise berth in the Southern Hemisphere, set to be operational 2024, and additionally one of four of our commercial bulk shipping berths will go live by end of 2024. The remaining berths will be connected by 2030. These will be provided with 100% renewable power.
While the potential for shore power for White Bay Cruise Terminal has been discussed for some time, fitting with our sustainability plan and general level of ambition, the scope of electrification of berths was extended to the entire precinct, creating the first fully electrified bulk and cruise precinct in the world – comprising 4 bulk berths at Glebe Island plus the White Bay cruise terminal.
While the potential for shore power for White Bay Cruise Terminal has been discussed for some time, fitting with our sustainability plan and general level of ambition, the scope of electrification of berths was extended to the entire precinct, creating the first fully electrified bulk and cruise precinct in the world – comprising 4 bulk berths at Glebe Island plus the White Bay cruise terminal.
Our commitment is to provide certified renewable shore power to a total of five berths in Bays Port:
• Bulk berths – the existing cement, gypsum and sugar import berths at Glebe Island 7 & 8 and future developments for bulk cement and aggregates at Glebe Island 1 & 2
5)
Conference Paper 59
100%
July
End
100%
electricity Port Authority
2030 75% reduction in scopes 1 & 2 emissions 2040 NET ZERO
• White Bay Cruise Terminal (berth
End 2022
renewable electricity at Bays Port
2023 Define, measure & review reduction in scope 3 emissions
2023
renewable
wide
While the potential for shore power for White Bay Cruise Terminal has been discussed for some time, fitting with our sustainability plan and general level of ambition, the scope of electrification of berths was extended to the entire precinct, creating the first fully electrified bulk and cruise precinct in the world – comprising 4 bulk berths at Glebe Island plus the White Bay cruise terminal.
Our commitment is to provide certified renewable shore power to a total of five berths in Bays Port:
Our commitment is to provide certified renewable shore power to a total of five berths in Bays Port:

5 Bulk berths – the existing cement, gypsum and sugar import berths at Glebe Island 7 & 8 and future developments for bulk cement and aggregates at Glebe Island 1 & 2

• Bulk berths – the existing cement, gypsum and sugar import berths at Glebe Island 7 & 8 and future developments for bulk cement and aggregates at Glebe Island 1 & 2
• White Bay Cruise Terminal (berth 5)
5 White Bay Cruise Terminal (berth 5)
5 Project Status and Next Steps
Current Status
We are working with our customers to deliver the required facilities and ability to connect ships. Our valued partners Cement Australia, CSL, Carnival Cruise Line, Royal Caribbean Cruise Line and MSC Cruises are committed to the future use of shore power in the Bays Port precinct and will be investing significantly to retrofit their vessels or scheduling their existing fleet to be ready to connect to our shore power facilities.
We are investigating supply of adequate power to the port, preparing concept designs for tender,
60
Conference Paper
Figure 2: Shore Power Berth Layout
These will be provided with 100% renewable power.
GreenPort Congress 2023 Paper Port Authority of New South Wales | Page 5
Figure 2: Shore Power Berth Layout
5 Project Status and Next Steps
Current Status
We are working with our customers to deliver the required facilities and ability to connect ships.
Our valued partners Cement Australia, CSL, Carnival Cruise Line, Royal Caribbean Cruise Line and MSC Cruises are committed to the future use of shore power in the Bays Port precinct and will be investing significantly to retrofit their vessels or scheduling their existing fleet to be ready to connect to our shore power facilities.
We are investigating supply of adequate power to the port, preparing concept designs for tender, and then work will be commencing on fabrication and delivery and installation, development of procedures, and pricing.
Conceptual design work has commenced for high voltage supply to precinct, to support the shore power system installation at the White Bay Cruise Terminal and retrofit work at Glebe Island 8 – doubling what was originally planned for delivery by the end of 2024.
Part of the conduits to deliver mains power supply to the precinct area have also been secured, ready for the works to commence once the design stage is complete and approved by the electrical provider.
The current status of the project delivery summarised below:
5 Commenced 33kV power supply to Bays Port precinct for shore power connection points
5 Completed concept design for shore power system and equipment
5 Released Expression of Interest for shore power equipment design, fabrication and installation, closing in February 2023
Next Steps
5 Tendering stage for shore power system detailed design, fabrication and installation
Estimated Costs
Estimated costs for both supply and installation of landside infrastructure is $60 million and the estimated retrofit costs for the two vessel types is:
5 Cruise ships estimated at up to $2.5m per ship
5 Bulk ships estimated at $1.3m per ship
Timing
Our commitment is to be ready to go live with the first ship by end of 2024 (comprising both our cruise berth and one bulk berth) and all berths by 2030.
6 Benefits
Carbon Emissions
In terms of carbon emissions benefits, based on our commitment to renewable electricity - the results indicate providing renewable shore power at Bays Port achieves nearly triple the CO2-e reduction we can achieve by reaching net zero with our own emissions.
Renewable shore power at Bays Port reduces ~14,500t CO2 pa compared to Port Authority’s scope 1 & 2 of 5,500t CO2 pa. This would be the equivalent to removing 4000 passenger vehicles off the road or planting over 70,000 trees every year.
Conference Paper 61
Renewable shore power at Bays Port reduces ~14,500t CO2 pa compared to Port Authority’s scope 1 & 2 of 5,500t CO2 pa. This would be the equivalent to removing 4000 passenger vehicles off the road or planting over 70,000 trees every year.
the most significant contribution we can make to net zero cope 3 emissions arising osen to deliver
Through our role as a Port Authority the most significant contribution we can make to net zero future for our port and decarbonisation more generally is helping reduce scope 3 emissions arising from shipping – shore power is a major part of this solution that we have chosen

Further Benefits
In addition to global carbon emission reduction benefits, shore power has the potential to

In addition to global carbon emission reduction benefits, shore power has the potential to deliver multiple additional benefits:
5 Local reduction in air pollution and odour
5 Local reduction in noise emissions, estimated at up to 10 dB for cruise ships
• Local reduction in air pollution and odour
5 Supports our social licence to operate
• Local reduction in noise emissions, estimated at up to 10 dB for cruise ships
• Supports our social licence to operate
5 Supports integration and co-existance of port with future development of the local area
• Supports integration and co-existance of port with future development of the local area
• Future proofing
5 Future proofing
We recognise the future for shipping will bring larger and even more significant changes in fuel types used whilst vessels are operating at sea, however we consider that landside electricity will always be an efficient source of power so providing it directly to ships at berth can be part of a long-term solution. Shore power can supplement other low carbon fuel solutions in the future
Thus our commitment to install shore power facilities at five of our commercial berths at Bays Port will provide immediate reduction in shipping related carbon emissions, and assist in the long term
62
Conference Paper
Port Authority of New South Wales | Page 7
Figure 3: Multiple benefits of shore power
Figure 3: Multiple benefits of shore power
We recognise the future for shipping will bring larger and even more significant changes in fuel types used whilst vessels are operating at sea, however we consider that landside electricity will always be an efficient source of power so providing it directly to ships at berth can be part of a long-term solution. Shore power can supplement other low carbon fuel solutions in the future.
Thus our commitment to install shore power facilities at five of our commercial berths at Bays Port will provide immediate reduction in shipping related carbon emissions, and assist in the long term adoption of low carbon marine fuels and technologies for industry well into the future.
7 Conclusion
Port Authority’s greatest legacy will be utilising our influence, leveraging our leadership, and partnering and collaborating with key stakeholders to drive sustainability initiatives and outcomes beyond the boundaries of our own activities and responsibilities and thereby create greater positive change across the maritime sector.
Being the first southern hemisphere port to announce and provide renewable shore power for ships at berth (and world’s first for a bulk shipping precinct) is already driving conversations within the Australian port sector to expand this initiative to other ports. The commitment is a key element to commence the overall shift to acknowledge, address and take practical steps to reduce scope 3 emissions from the shipping and ports sector in Australia. As it will require shipping lines at Bays Port to be capable of utilising the renewable shore power once installed, it will drive vessel retrofits and changes to vessel deployment. Expansion of shore power capability to other ports over time will improve cost effectiveness for industry whilst achieving greater sustainability outcomes.
Conference Paper 63
OLIVIA LASKOWSKI eMobility Business Segment Manager, Siemens

BIOGRAPHY
Olivia leads the Siemens eMobility business in Australia and New Zealand. An electrical engineer with over 16 years experience across diverse industries including electric vehicle charging and smart grid solutions, energy efficient building technologies and rail automation, signalling and communication. The Siemens eMobility portfolio includes electric vehicle charging hardware and software for residential through to high power heavy vehicle applications, as well as shoreto-ship technology. Olivia is a lover of the great outdoors and can’t wait for her young children to have the legs for some overnight hiking trips in Australia’s remote wilderness.
Speaker
64
TERESA LLOYD Chief Strategy and External Affairs Officer, Carnival Australia


Speaker
65
BIOGRAPHY
Manfred Lebmeier joined the Hamburg Port Authority (HPA) in 2013. He is an environmental engineer and works for the environmental and sustainability department as senior environmental advisor. Onshore power and the Green Deal with the Fit for 55 package is a main task of his work. He is an active member of several national and international committees and working groups like in ESPO or IAPH. Additionally, he worked for more than 2 years for the IAPH as ESI (Environmental Ship Index) administrator.

Speaker
66
MANFRED LEBMEIER Senior Environmental Advisor, Hamburg Port Authority
Hamburg Port Authority – Experience with onshore power


The Port of Hamburg
A port in the middle of the city

Conference Paper
67
73 nm away from the North Sea
Major North-West European Port
The Port of Hamburg
s
Conference Paper 68
App ro x 50 s hip s A pprox 43k m of quay walls 280 b ert h s for s eagoing vess els About Roughly 120 b ridg es Mor e than 200 f r eight tr ains m ov e ov er 5,500 wagons ev ery day E urope 's thi rd larges t s eaport Total car go thr oughput fr om o ve r 126 m illi on tonne s about 300k m of rail t rack s Europe‘s lar gest por t r ail hub Som e 1,80 0 employees More than 140 km of public roads 3 c r uis e ter minals About 7, 000ha of port area Ap p r ox. 800 c alls by ves sels f r om a lengt h of 33 0 m and / o r a b ea m of 4 5 m thi r d lar gest inla nd por t
Over 170 r ail way underta k i ngs In l a nd Ves sel movement s about 11,000
Germ a ny‘
OnshorePower in the Port of Hamburg
5 Cruise Center Altona

5 In operation since2017
5 12 MVA 60 HZ / 50 HZ
5 11/6.6 kV 10/5 kV
5 IEC/ISO/IEEE 80005-1 standard
5 First and main user AIDAsol
5 Motivation: Clean Air Action Plan of the Free and Hanseatic City of Hamburg
Next Steps
Roll-out of onshore power for cruise and container vessels:

5 3 additional berth for cruise
5 8 new berth for container
5 Build until 2023-25
Motivation:
5 Clean Air Action Plan of the Free and Hanseatic City of Hamburg

5 Upcoming EU Regulation Alternative Fuel Infrastructure Regulation
5 Request from cruise ship-owner
Conference Paper
69 CT Altona GRASBRO W Container-Terminal Tollerort 1CP (slide) with 7,5 MVA completed 2023, app. 10 Mio. € Container-Terminal Altenwerder 3CP (cable chain), 7,5 MVA each completed 2024, app. 19 Mio. € Container-Terminal Eurogate 3CP (cable chain), 7,5 MVA each completed 2023, app. 14 Mio.€ Container-Terminal Burchardkai 3CP (cable chain), 7,5 MVA each completed 2023, app. 14 Mio.€ Cruise-Terminal Altona 12 MVA, 1CP (1 vehicle) completed 2016, app.10 Mio. € ✓ Cruise-Terminal Steinwerder 16 MVA, 1CP (1 vehicle) completed 2023, app. 16 Mio. € Cruise-Terminal HafenCity 14 MVA, 2CP (1 vehicle + pit box) completed 2025, app. 20 Mio. € Major OPS projects, current program 15th February 2023 8
OnshorePower
What we learned
Assumptions 1
5 Make reasonable and realistic assumptions
5 Know the ships calling your port.
5 Influence on technic
5 Influence on business case
5 Ferries are different in terms of technic
5 Cruise is different in terms of business behaviourg

Assumptions 2
5 You will not start with 100 % connection of ships.
5 Not all ships are equipped with OPS
5 Not all ships are willing to take OPS
5 Ramp-up phase when introducing OPS – learning curves at both sides
5 Noise will be notreduced to Zero
5 3 main noise sources: .
5 Engines –Reduced by OPS
5 Ventilation –Can be reduced by OPS if ships have an interest

5 Ground working –Can‘t be reduced by OPS
The technical challenges
5 Green electricity expected
5 Availability of enough electricity
5 Connection to the grid
5 What size of the transformer
5 THE technical challenge: the connection point.
5 Make it flexible (Lesson learned from port of LA)

5 There is no space at container terminals
5 All Terminals are different (at least in Hamburg)
Conference Paper 70
Business Case
5 OPS is (usually) more expansive than onboard electricity production
5 => Someone has to pay!.
5 Ship-owner –but how to motivate?
5 Port –but why offering a loosing business?
5 State –is it a market failure?
5 Does regulation helps?
5 Keep a level-playing field
Legal framework
5 Is your legal framework fit for OPS?
5 Are you allowed to sell electricity?
5 Which taxes are on electricity?
5 Can OPS be treated as deferable grid load?


5 Importance of early and frequent interaction and planning between the port, regulatory agencies, and utilities
Additional lessons learned
5 Don‘t underestimate the human factor
5 Maintenance is important
5 Cooperate with your competitors
Conference Paper 71
Economical power supply for berthed ships
With the SIHARBOR shore connection, berthed ships can draw the needed energy from onshore and shut down their generators, thus meeting the strong environmental regulations that are being taken for ports worldwide in the most efficient way. SIHARBOR provides a fast, simple and flexible connection to the ship via a cable management system. siemens.com/siharbor

THE FUTURE OF SUSTAINABLE PORTS
Collaborative Communities
SESSION
73
3
ADRIAN SAMMONS Founder and Managing Director, AMSTEC
BIOGRAPHY
Adrian has over 30 years’ increasing knowledge and experience in shipping, ports, and transport industries and in 2005 established a transport economics consultancy; AMSTEC Pty Ltd, which has completed many transport related projects worldwide.

Adrian holds a Master of Business Administration (MBA) 1st Class distinction; Majoring in Shipping and logistics from Middlesex University London. Adrian was awarded the UK Chartered Institute of Management Prize for Best performance in the MBA program.
In 2021, Adrian accepted a PhD candidature at Macquarie University in Sydney commencing doctoral research on a thesis focussing upon ‘Port privatisation in Australia, its motivations and benefits and/or disbenefits. (Commitments have placed this on hold).
Maritime development in ports and shipping have been a significant speciality of Adrian’s career and has successfully completed over 50 projects, many in the Asia-Pacific region.
These have included Port Master-planning, demand forecasting, mapping supply/value chains and port-hinterland connectivity, institutional management reform, port productivity, stevedore concessions, port infrastructure design, international and coastal shipping development and river/inland waterway ferry service start-ups and yacht marina design.
In the last ten years Adrian has participated in delivering several projects for ports and shipping lines researching benchmarks for Greenport standards and investment developments. Decarbonisation of shipping and port operational sustainability have been included in environmentally friendly and sustainable operations and technologies.
Adrian’s working career involved postings in London, Singapore, Melbourne, Auckland, Adelaide, Darwin, and Sydney where he was CEO of regional shipping lines. In the early 2000’s, Adrian was chairman of international shipping consortiums where he was instrumental in leading global shipping policy reform and commercial strategies.
From 2006-2009 Adrian was Director of Trade Development (Austral-Asia Trade Route) at Northern Territory Government of Australia in Darwin. This role included promoting the $1.2 billion Adelaide to Darwin rail connection with overseas trade routes.
Moderator
74
Publishing academic journals, Adrian jointly won the International Assn. of Maritime Economists (IAME) award best original maritime paper – 1st in 2007 and again in 2012.
Korea Association of Maritime Industry awarded Adrian an outstanding achievement award for published work and the Australian Naval Institute awarded Adrian a certificate of merit for research & development of ports and shipping industry.
In 2022, Adrian presented at various conferences including UNESCAP Expert Group Meeting on Sustainable Maritime Connectivity in the Pacific, Association of Pacific Ports, with The World Banks Engagement with Pacific Ports and at the Asian Development Bank’s Innovation Seminar on Green Ports, Shipping, & Maritime Decarbonization, with the paper ‘Green Port developments in S.E Asia. And as guest speaker at the Greenport’s Congress inaugural webinar for Oceania.
A sample of past guest speaker presentations delivered by Adrian include ‘The Principles of Good Governance in Port Authorities’ at the World Conference on Transport in Antwerp Belgium, Pacific Ports & Maritime Transport Conference in Tahiti and Auckland with ‘KPI performance measures for small ports’ and ‘Methodology of establishing port pricing formulae’ and ‘Principles of demand forecasting for small ports (<100,000 TEU).
Adrian is based in Sydney Australia and keeps busy with a family of teenage children and can be found skippering his boat on Sydney harbour some weekends.
Conference Paper 75
AUSTRALIA
KATE NOBLE
No Plastics in Nature Policy Manager, WWF-Australia

BIOGRAPHY
Kate is the No Plastics in Nature Policy Manager at WWF. The No Plastics in Nature initiative works to eliminate unnecessary plastics, build a regenerative circular economy for plastics in Australia, and help to drive regional and international action to reduce plastic production, consumption and pollution globally. Kate has worked on a range of policy issues with charities, in politics and academia in Australia and abroad. Prior to joining WWF she led governance and human rights strategy at the BBC’s international development charity, and worked on plastic pollution policy in the Victorian Parliament.
Speaker
76
Clean Ports, Clean Oceans: Improving Port Waste Management in the Philippines
Tackling plastic pollution in ports in collaboration with port authorities and communities
1. Introduction
Plastic pollution is a growing international problem that harms biodiversity, human health and disproportionately affects marginalized communities.1 It is generally assumed that 80% of marine plastic litter comes from land-based activities and 20% comes from sea-based activities, such as fishing, aquaculture and shipping.
The maritime and port sectors include activities at sea but also at the interface between sea and land, which represent some of the sources of plastic pollution. In the Philippines, a study shows that, in 2019, around 114,927 kilogrammes of plastic waste was generated from ports and 128,970 kilogrammes of plastic waste from vessels.2
To address the issue of plastic pollution in Philippine ports, the World Wide Fund for Nature (WWF) started the project ‘Clean Ports, Clean Oceans: Improving Port Waste Management in the Philippines’, funded by the Grieg Foundation. The three-year project is implemented in partnership with a maritime company, the Grieg Group, in three ports: the Port of Batangas, the Port of Cagayan de Oro and Manila North Harbour. The specific objectives of the project are to:
5 achieve 50 per cent reduction of plastic waste leakage in nature in the three aforementioned Philippine ports,
5 provide input to the Philippine National Plan of Action on Marine Litter to highlight the importance of the port industry in addressing plastic pollution, and
5 document port waste management models to enable scaling up to other ports in the Philippines and globally.
To implement this project, WWF-Philippines has initiated partnerships with the Philippine Ports Authority (PPA) and the Maritime Industry Authority (MARINA) through two memoranda of understanding.
2. Background
The plastic pollution crisis
Plastic pollution is one of the fastest growing environmental problems. It poses significant harm to marine ecosystems, habitats and species.3 Plastic litter can also impact negatively human
1 United Nations Environment Programme (UNEP), 2021, From Pollution to Solution: A global assessment of marine litter and plastic pollution. Nairobi; UNEP, 2021, NEGLECTED : Environmental Justice Impacts of Marine Litter and Plastic Pollution.
2 WWF, Clean Ports, Clean Oceans: Improving Port Waste Management in the Philippines, Solid Waste Management Baseline Study Philippine Ports https://wwf.org.ph/wp-content/uploads/2022/01/Solid-Waste-Management-StudyPhilippine-Ports.pdf
3 Convention on Biological Diversity, 2016, “Marine debris: understanding, preventing and mitigating the significant adverse impact on marine and coastal biodiversity,” Technical Series No.83; Kuhn and van Franeker, 2020, “Quantitative overview of marine debris ingested by marine megafauna,” Marine pollution bulletin, vol. 151.
Conference Paper 77
health through various ways, such as the ingestion of seafood contaminated with plastics or the release of toxic emissions from the open burning of plastic waste.4
The Asia-Pacific region is a significant contributor to this crisis. The World Bank estimates that 4.8 to 12.7 million tons of plastic enter the oceans annually, with 80 per cent of this total coming from Asia.5 In the Philippines, around 2.15 million tons of plastics are consumed in a year, from which 9% are recycled and 35% leaks into the environment.
It is estimated that under a business-as-usual scenario and in the absence of necessary interventions, the amount of plastic entering aquatic ecosystems could nearly triple from 9-14 million tonnes per year in 2016 to 23-37 million tonnes per year by 2040.6
The heavy use of single-use plastic products, and especially sachets, has increased plastic pollution in recent years. It is estimated that almost 60 billion sachets are used per year in the Philippines.7 Sachets, which are small and sealed packaging, are often used for various daily products, such as shampoo, toothpaste, food and condiments, and are often perceived as convenient and affordable. However, their composition made of layers of plastic and aluminium makes them difficult to be recycled.
The informal waste sector plays a critical role in the management of plastic waste and in mitigating plastic pollution in the Philippines. The informal waste sector includes different actors, such as the primary waste pickers that collect waste in the streets, and the itinerant buyers that go from house to house buying recycled materials.8
The maritime sector is an essential element of the economy in the Philippines and employs around 700,000 people.9 Even though the maritime sector brings substantial economic and social benefits, it also exerts pressures on the environment through various ways, including marine litter.
Policies and legislation targeting plastic pollution in the Philippines
In 2021, the Philippines adopted the National Plan of Action on Marine Litter.10 The vision of the plan, developed by the Department of Environment and Natural Resources (DENR), is a country free of marine litter through shared responsibility, accountability and participatory governance. It aims to provide a blueprint to enhance the current efforts of the country in resource and waste management and the control of waste leakage into water. The plan includes several strategies, including a Strategy 5 “Reduce maritime sources of marine litter.”
The National Economic and Development Authority (NEDA) also published The Philippine Development Plan (PDP) 2017-2022, which aims to diverse waste by 80% by 2022, in other words, to redirect solid waste that might otherwise be placed in the waste stream to be reused, recycled, composted or recovered.11 In addition, in 2019, NEDA issued the Philippine Action Plan for Sustainable Consumption and Production (PAP4SCP) to improve circularity.
4 Center for International Environmental Law (CIEL), 2019, Plastic & Health: The Hidden Costs of a Plastic Planet; United Nations Environment Programme, 2021, From Pollution to Solution: A global assessment of marine litter and plastic pollution. Nairobi.
5 World Bank, 2021, Market Study for the Philippines: Plastics Circularity Opportunities and Barriers, https://openknowledge. worldbank.org/handle/10986/35295
6 The Pew Charitable Trusts, SYSTEMIQ, 2020, Breaking the Plastic Wave: A Comprehensive Assessment of Pathways Towards Stopping Ocean Plastic Pollution.
7 SEA Circular, 2020, Country Profile: the Philippines
https://www.sea-circular.org/country/philippines/
8 International Alliance of Waste Pickers, Law Report: Philippines, https://globalrec.org/law-report/philippines/
9 SEA Circular, 2020, Country Profile: the Philippines
https://www.sea-circular.org/country/philippines/
10 https://nswmc.emb.gov.ph/wp-content/uploads/2021/10/2021-NSWMC-Resolution-No.-1441-Series-of-2021-NPOAML1.pdf
11 National Economic and Development Authority, The Philippine Development Plan (PDP) 2017-2022, https://pdp.neda.gov. ph/wp-content/uploads/2021/02/20210218-Pre-publication-copy-Updated-Philippine-Development-Plan-2017-2022.pdf
Conference Paper 78
The Philippine Ports Authority (PPA) has adopted several memoranda related to waste management, including the memoranda circular No. 11-2021 that bans the use of unnecessary single-use plastic products in all PPA ports, facilities and offices.
Various legislation that targets waste and plastic waste are also present in the Philippines, including the Ecological Solid Waste Management Act of 2000, and the Extended Producer Responsibility Act of 2022.
The country is also part in several international and regional plans of action such as the International Maritime Organization Action Plan to address marine plastic litter from ships, the Regional Action Plan on Marine Litter of the Coordinating Bodies on the Seas of East Asia (COBSEA), and the Regional Action Plan for Combating Marine Debris in the Association of Southeast Asian Nations (ASEAN) Member States.
3. Development of baseline studies to collect data on plastic waste management in ports
To determine the relevant actions to reduce plastic waste leakage in the three ports and provide baseline data against which to monitor progress, WWF conducted local baseline studies in each port and a national baseline study. This step was a crucial step for the project as the country lacked data on the specific situation related to plastic waste management and leakage in the three ports.
The baseline studies aimed to produce data on the amount of waste generated, the volume of wastes coming from ports, vessels and communities, and the volume of waste recovered and disposed at endpoints and possible leakage points.
The methodologies used for the baseline studies were the Waste Flow Diagram, which is a tool that maps municipal solid waste flows and estimates plastic waste leakage into terrestrial and aquatic environment, and the Waste Analysis and Characterization Study, a methodology that has been developed as a diagnostic tool to implement the Sustainable Development Goal 11 and especially its indicator 11.6.1.
The national baseline study showed that around 114,927 kg of plastic waste was generated from ports and 128,970 kg of plastic waste from vessels in 2019.12 Out of the total port–generated wastes in 2019, 61 per cent are recyclables, which 26 per cent is categorized as paper, 20 per cent is categorized as plastic, and 15 per cent as other recyclables. This is the same scenario with vessel-generated waste in 2019 wherein 67 per cent of the total vessel-generated wastes are recyclables, which 30 per cent are categorized as paper, 23 per cent are categorized as plastic, 14 per cent as other recyclables. Apart from port- and vessel-generated waste, the study included community-generated waste from adjacent communities and those within the port premises as with the case of Manila North Port – 90 per cent of plastic waste leakage potentially comes from informal communities.
Findings also show the misalignment of local government units (LGUs), from which some ports are located, and port management offices (PMOs) in the implementation of the regulations of unnecessary plastics. This means that single-use plastics may be banned inside the port area but are allowed for usage once outside the port premises.
12 WWF, Clean Ports, Clean Oceans: Improving Port Waste Management in the Philippines, Solid Waste Management Baseline Study Philippine Ports https://wwf.org.ph/wp-content/uploads/2022/01/Solid-Waste-Management-StudyPhilippine-Ports.pdf
Conference Paper 79
The national baseline study includes several recommendations, including stricter implementation of international and national policies on solid waste management, better coordination with concerned stakeholders, better data management, at source segregation and material recovery, and increased compliance from domestic vessels on proper solid waste management.
4. Development of strategic action plans for each port with stakeholders
Following the results of the national and local baseline studies, stakeholder consultations and port industry roundtables were conducted for the three ports. The objective of these consultations was to bring together stakeholders and discuss key issues and solutions related to the management of plastic waste in the ports. Participants in the roundtables included national and local government agencies and representatives, port operators, waste management operators, service providers, ship owners and operators, and civil society organizations.
From the inputs gathered during these roundtables and the data gathered with the baselining, strategic action plans were drafted for each port. The strategic action plans aim to present the interventions agreed upon with the relevant stakeholders to reduce plastic waste leakage.
5. Collaboration with the communities
Every port site is surrounded by communities who most often work at the port. These communities live in barangays, which are administrative units in the Philippines. These barangays have nearby water bodies making them passageways for plastic waste leakage. Barangay Calicanto in Batangas City has open canals and is a catch basin, making them prone to floods. The barangay is also connected to the port’s main canal that leads directly into the Batangas bay. This is also the case for Lapasan in Cagayan de Oro City wherein there are two big creeks namely Bitan-ag and Kolambog that lead straight to the coastline. For Manila North Port, there are communities within the port premises and baseline study results showed how the drainage system from the entire Manila City leads into Manila bay.
Plastic waste represents about 15 per cent of the waste in these communities. All partner communities across the three project sites are located in urban city centres. Space, the lack of infrastructure and awareness are some of the challenges that make the sorting, collection and recycling of plastic waste often difficult.
WWF decided to work with these communities to address these challenges. WWF has decided to pilot various interventions in the three ports to improve the sorting, collection and recycling and reduce plastic waste leakage in nature. Interventions range from establishing materials recovery facilities to supporting waste workers and helping the community to partner with entities that ensure that recyclable plastic waste is recycled.
For more information: https://wwf.org.ph/what-we-do/plastics/cleanportscleanoceans/
Conference Paper 80
CRAIG NILES Principle, Urban Planning, Ramboll

BIOGRAPHY
Craig Niles is an urban planner with 25 years’ experience leading teams on urban development and infrastructure projects, specialising in strategic planning, master planning, policy development and smart cities. Craig has considerable maritime and ports experience, having undertaken a various marina feasibility studies, new wharf feasibility studies, port master plans and maritime/waterfront land use assessments. Craig recently completed the Carrington Precinct Plan for the Port of Newcastle which focussed on a long term strategic road map for a sustainable mixed cargo precinct. Recently, Craig has led the review of planning policies for Special Activation Precincts and Regional Job Precincts in Wagga Wagga, Moree, Narrabri, Namoi Region and Albury, giving Craig a deep insight into the complex nature of regional economies as well as the reliance of regional communities on investment in infrastructure, liveability and resilience. Craig is also currently the team leader of the Ramboll team delivering the ASEAN Australian Smart Cities Trust Fund delivering smart city programs and strategies across 24 South East Asian cities.
Speaker
81
Resilient communities: Maximising support resilient and liveable regions through green port strategies
NSW is investing in regional economies to drive economic growth, resilience and prosperity. A range of programs exist to attract investment, including infrastructure delivery, improving planning policies for economic clusters and providing business concierge services. Programs such as Inland Rail, Special Activation Precincts, Regional Job Precincts, Fixing Country Roads and Renewable Energy Zones all contributing to the economic and social resilience of the regional economy.
The ‘community’ of ports includes not just the adjoining areas or even the cities in which they are based, they are connected to the entire supply chain. Ports provide the gateway to the market for regional suppliers and, in return, supply equipment, product and materials into the regions
Ports need to be resilient to the impacts of climate change (storm events, sea level rise) and need to maintain a degree of flexibility over time in capacity and types of cargo to respond to new technologies, new industries and changes in the supply chain. Future proofing infrastructure and port capacity to support inland communities is a key driver for the NSW State economy over the coming 20-40 years.
Regional communities rely on the reliable transport of goods to market and supply of equipment. Equally, ports are in a unique position to benefit from (and deliver benefit to) the resilience of communities in regional NSW.
We will explore these regional trends and discuss planning implications and opportunities for ports, utilising cases studies from our work in Regional NSW as well as European case studies.
Conference Paper
82
ED ROWE Senior Engineer - Resilience (Coastal), ARUP

BIOGRAPHY
Edward is a chartered engineer with approximately ten years of consulting experience. Ed has specialist technical and project management experience in the maritime sector, with specific focus on resilience and the impact of natural hazards and climate. Ed is passionate about coastal adaptation and resilience and particularly in the role nature can play strengthening coastal resilience while delivering environmental and social co-benefits. Ed has been recognized for his ability to draws together skills across environmental, sustainability and technical design elements to deliver projects that are aligned with the systems within which they operate.
Speaker
83
A partnership approach to environmental sustainability challenges in pacific island ports
Summary
Given the critical role ports play in economic growth and development in Pacific Island Countries (PICs) it is essential that sustainable development principles drive future growth. The environmental sustainability of PIC ports was assessed against a framework of indicators demonstrating that PIC ports generally performed well below global best practice, even in ports of similar scale. Beyond specific actions identified in a Green Ports Roadmap for the Pacific, this paper explores opportunities to take a regional approach through partnership and collaboration to address challenges in achieving environmental sustainability in PIC ports.
Introduction
Ports in Pacific Island Countries (PICs) are facing a suite of environmental, economic, and social stressors [1]. PICs are demanding global action on decarbonisation and climate change [2] and despite their small contribution to global greenhouse gas emissions, are leading by example. The PICs of Kiribati, the Marshall Islands and the Solomon Islands for example have submitted a request to the International Maritime Organisation to commit to net zero shipping emissions by 2050 [3]. PIC ports play a critical role in economic growth and development. It is essential that sustainable development principles are embedded in future growth, enabling adaptability of port infrastructure and operations to accommodate changes associated with the requirements and expectations of both shipping services and the communities’ each port supports.
A Roadmap for Green Ports (the Roadmap) in the Pacific was developed, which outlined short-, medium-, and long-term actions for individual ports, operators within ports, governments, donor agencies and other stakeholders to enhance port environmental sustainability. The Roadmap was compiled after an initial assessment of environmental sustainability across 15 PIC ports and benchmarking of these ports against global peer ports and a review of international best practice.
Beyond the specific outcomes and actions of the Roadmap for each of the 12 indicators, a number of key themes for a holistic approach to sustainability were identified and are captured in this paper.
Environmental Sustainability Framework
Assessment and benchmarking of the environmental sustainability of the PIC ports was undertaken based on a tool adapted to reflect the context in PICs. A comprehensive desktop review that included specific consideration of the World Ports Sustainability Program (WPSP) [4] informed the tool adaptation and culminated in criteria across 12 indicators calibrated to account for the size, scale and function of the PIC ports.
[1] Hay, J.E., Mimura, N. (2013). Vulnerability, Risk and Adaptation Assessment Methods in the Pacific Islands Region: past approaches, and considerations for the future. Sustainability Science, 8, pp. 391-405.
[2] Pacific Islands Forum Secretariat. (2019). 50th Pacific Islands Forum Communique. Funafuti, Tuvalu.
[3] The Embassy of the Republic of Marshall Islands. (2021). Invitation to Support MEPC77/7/3: Resolution on zero emissions no later than 2050.
[4] World Ports Sustainability Program. (2020). World Ports Sustainability Report 2020. Retrieved from https:// sustainableworldports.org/A
Conference Paper
84
Indicators (outlined in Table 1) were developed to include measurement statements (and associated point values), questions for stakeholders and suggested evidence to inform and standardise assessment.
Table 1: Environmental sustainability indicators included in the assessment tool Indicator
Indicator
Greenhouse gas (GHG) emissions
Energy use/ efficiency
Climate change resilience
Air pollutants
Noise pollution
Light pollution
Liquid waste
Solid waste
Biodiversity
Intent
Define GHG emission sources and contribute toward related targets through reduction in carbon footprint.
Define and improve energy efficiency and conservation.
Anticipate, prepare for, and respond to hazardous events, trends, or disturbances.
Limit the harmful effects of air pollutants, including ships at berth.
Limit the harmful effects of noise pollution on land and water environments.
Minimise glare, light trespass, sky glow and impacts on nocturnal environments.
Limit water quality impacts of oil pollution, ballast water and wastewater.
Manage solid waste streams, to prioritise diversion from landfill by recycling or reuse.
Conserve and restore habitats to promote biodiversity in port and adjacent environments.
Environmental sustainability assessment
The outcome of the assessment and benchmarking was not unexpected, given the known socio-economic and funding constraints across the Pacific, with PIC ports generally performing below global best practice across all indicators. This was also observed when the ports were benchmarked against international ports of similar size and scale.
Conference Paper 85
The outcome of the assessment and benchmarking was not unexpected, given the known socioeconomic and funding constraints across the Pacific, with PIC ports generally performing below global best practice across all indicators. This was also observed when the ports were benchmarked against international ports of similar size and scale.
Figure 1 – a comparison of PIC port environmental sustainability performance with global peer ports. The benchmark scores are the highest scores obtained for each indicator for any of the PIC or Peer Ports assessed. Comparison of these scores demonstrates that while the best performing PIC ports scored well in comparison to their international peer ports, the average score of PIC ports was considerably lower. Note that access to data limited scores for innovation and light pollution for the peer ports.
Figure 1 – a comparison of PIC port environmental sustainability performance with global peer ports. The benchmark scores are the highest scores obtained for each indicator for any of the PIC or Peer Ports assessed. Comparison of these scores demonstrates that while the best performing PIC ports scored well in comparison to their international peer ports, the average score of PIC ports was considerably lower. Note that access to data limited scores for innovation and light pollution for the peer ports.
It was also observed that the environmental sustainability performance improved with increased port size. This was however not the case for performance against climate risk and adaptation, where success against this criteria did not trend with port size, but instead was influenced by the extent of vulnerability that each port demonstrated to climate hazards. Access to donor funding due to such vulnerabilities enabled ports to act and mitigate these vulnerabilities regardless of their size.
It was also observed that the environmental sustainability performance improved with increased port size. This was however not the case for performance against climate risk and adaptation, where success against this criteria did not trend with port size, but instead was influenced by the extent of vulnerability that each port demonstrated to climate hazards. Access to donor funding due to such vulnerabilities enabled ports to act and mitigate these vulnerabilities regardless of their size.
Performance against noise, light, waste, and biodiversity indicators scored poorly across all PIC ports, which was anticipated due to the relative size of operations, isolated location, age of infrastructure and limited available funding streams. Figure 2 below presents a summary of scores achieved for all of the PIC ports assessed for each indicator. It should be noted that access to data limited the ability to adequately score some port and indicator combinations. Ports that were not scores for this reason are also captured in the Figure 2.
Performance against noise, light, waste, and biodiversity indicators scored poorly across all PIC ports, which was anticipated due to the relative size of operations, isolated location, age of infrastructure and limited available funding streams. Figure 2 below presents a summary of scores
86 ustainability
Conference Paper
-1 0 1 2 3 4 5 Greenhouse Gas Emissions Energy Use and Efficiency Climate Change and Risk Adaptation Air Pollutants Noise Pollution Light Pollution Liquid Waste Solid Waste Biodiversity Biosecurity Environmental Governance Innovation PIC Port Average PIC Port Benchmark (Max) Peer Port Benchmark (Max)
Edward Rowe, Jamsheed Bhanja and Emily Gentilini
achieved for all of the PIC ports assessed for each indicator. It should be noted that access to data limited the ability to adequately score some port and indicator combinations. Ports that were not scores for this reason are also captured in the Figure 2.
Roadmap actions by indicator
Specific actions were identified against each indicator including core practices and stretch practices for improved performance in accordance with the environmental sustainability framework. Core and stretch practices provided actions to enable ports to meet target performance in alignment with international peers (core), while stretch practices provided actions to enable ports with greater capacity to move toward best practice in ports globally.
Monitoring and reassessment are expected to be key steps in achieving improved environmental
87
Conference Paper
0% 10% 20% 30% 40% 50% 60% 70% 80% 90% 100% Greenhouse Gas Emissions Energy Use and Efficiency Climate Change and Risk Adaptation Air Pollutants Noise Pollution Light Pollution Liquid Waste Solid Waste Biodiversity Biosecurity Environmental Governance Innovation Number of Ports Not Scored 0 Points 1 Point 2 Points 3 Points 4 Points 5 Points
Figure 2 – percentage of scores achieved through assessment of each PIC port against each indicator.
Figure 2 – percentage of scores achieved through assessment of each PIC port against each indicator.
sustainability across PIC ports and the indicators, metrics and associated collateral developed in the assessment framework provide a replicable pathway requiring limited capacity to monitor environmental sustainability performance. In addition to indicator specific actions, trends for priority action emerged from the assessment and Roadmap.
Priorities for action
Energy use and efficiency, and climate change risk and adaptation were the two indicators that ports were most engaged with through the assessment. This active engagement was due to motivation to reduce operational costs, awareness of the benefits of renewable energy technologies and experience with damage recovery due to climate related natural hazard events. These two indicators carry direct financial risk for the ports given the threat of climate change and dependency on fossil fuels. Renewable energy infrastructure was identified as a priority investment area for local and national governments to decrease reliance on fossil fuels and increase resilience across the energy sector.
Similarly, waste infrastructure was also identified as a priority investment area for governments, however ports were less engaged in assessment against the solid waste indicator as they generally relied on waste management services beyond the port boundary and expressed limited influence on improvement.
While quantification and/ or monitoring was generally being undertaken for some indicators, baselines for air pollution, noise pollution, light pollution, biodiversity and liquid waste had for the most part not been undertaken. Therefore, establishing these with future monitoring and evaluation plans was identified as a priority for ports.
Key Challenges
Many of the challenges faced by PIC ports were common and often were unique to the region due to location and scale. A range of key challenges were identified in the Roadmap and these were, for the most part, related to limited capacity across technical skills, availability of resources and roles within port authorities, and governance structures to support port operations at each port. This challenge of capacity was then ultimately linked to the scale of ports and the PICs themselves. In addition to the overarching challenge of capacity, both the availability of resources and equipment to undertake assessment, monitoring or act to improve environmental sustainability performance, as well as supporting legislation and the ability to comply with existing legislation, were noted challenges across most ports.
Approaching solutions together
Partnerships and other forms of collaboration were identified as an effective way to pool resources and enable outcomes that may not otherwise be achieved due to scale. Partnerships could be with other ports, research institutions, or organisations focused on port sustainability. Opportunities to collaborate and shift away from individual, bespoke investments and designs and move towards multi-port implementation would enable efficiencies, particularly in green technology uptake and associated training, but also in utilising centralised resources. These approaches should leverage existing centralised functions where these already exist such as the Pacific Maritime Transport Alliance, SPC (The Pacific Community) and the Maritime Technology Corporation Centre.
Conference Paper 88
Through collaborations and partnerships and centralising resources, the challenges associated with access to equipment, resources and specialist skills could be minimised. Central coordination of vehicles, equipment and technology could allow:
5 Coordinated planning / shared timelines to leverage collective buying power for upgrades to low emissions technologies.
5 Centralised procurement and management of equipment, vehicles, spare parts and equipment, and vessels for emergencies.
5 Standardised training and support for PICs to increase capacity and also mitigate transition risks associated with new technology and infrastructure arising from the move toward a net zero carbon future.
5 Replicability/ lesson sharing across ports.
In addition to centralised coordination of physical resources, templates for environmental monitoring, management plans, role descriptions, emission calculators or similar documents and tools for ports to readily adopt would reduce collective effort towards achieving positive outcomes. These could be captured in a centralised database with associated dashboards providing updates on progress and uptake from different ports to promote sharing and collaboration, but also develop a positive competitive environment.
Conference Paper 89
TRUDIE LARNACH Manager Sustainability & Corporate Affairs, Port Waratah Coal Services


BIOGRAPHY
Trudie Larnach is the Sustainability & Corporate Affairs Manager and part of the Senior Leadership team at Port Waratah Coal Services. Port Waratah plays a vital role in the Hunter Valley Coal Chain, with an export capacity of 145 million tonnes per annum (mtpa) making Port Waratah the world’s largest coal export terminal. Trudie leads Port Waratah’s Sustainability Strategy, including community, government and stakeholder communication and engagement, the Community Investment and Partnership Programme, and all aspects of environmental management. Trudie is also accountable for the long-term strategy development for Port Waratah. Trudie is a volunteer Board Member of the local not-for-profit domestic violence service, Jenny’s Place. She holds a Bachelor of Laws, a Bachelor of Science and is a Graduate of the Australian Institute of Company Directors. She is a proven leader with a unique blend of legal, scientific, communication and engagement skills honed through a variety of experiences in the resources and ports sector, including working with Rio Tinto as an environmental and planning approvals specialist in the Hunter Valley. Trudie is passionate about sustainability and building authentic, constructive relationships. This passion and experience shapes her holistic approach to social licence to operate.
Speaker
90
Local voices
a unique community engagement programme based on research conducted by Australia’s national science agency, CSIRO, that aims to increase understanding, build trust, and strengthen relationships.
1 Abou t Port Warata h
1 About Port Waratah
Port Waratah has been part o f Newcastle and the Hunter region for over 45 years , connecting the Hunter Valle y Coal Chain to the world, playing an active part in our local community and advocating for the region
Port Waratah has been part of Newcastle and the Hunter region for over 45 years, connecting the Hunter Valley Coal Chain to the world, playing an active part in our local community and advocating for the region.

Our purpose is to delive r a high-quality, cost-effective service to our customers, which meets their nee d for reliable access to contracted terminal capacity We receive coal through rai l receiva l stations, stockpile the coal, blend the coal usin g unique blending methods and load the coal onto cargo vessels. Our combine d licence d coal loading capacit y is 145 million tonnes across both Carrington and Kooragan g Coal Terminals, making Port Waratah the largest coal export terminal in th e world We have approximately 330 employees working across our business, operatin g our Carrington an d Kooragang terminals 24 hour s a day, 7 days a week
Our purpose is to deliver a high-quality, cost-effective service to our customers, which meets their need for reliable access to contracted terminal capacity. We receive coal through rail receival stations, stockpile the coal, blend the coal using unique blending methods and load the coal onto cargo vessels. Our combined licenced coal loading capacity is 145 million tonnes across both Carrington and Kooragang Coal Terminals, making Port Waratah the largest coal export terminal in the world. We have approximately 330 employees working across our business, operating our Carrington and Kooragang terminals 24 hours a day, 7 days a week.
We responsibl y manage environmental, social and governance (ESG) aspects of our business, creatin g value for our community and stakeholders Bein g a sustainable business enables us to live our values and deliver on our purpose, while meetin g the changing expectations and demands of our employees, customers and communities. Our focus is working collaboratively with our stakeholders to continuously improve our operational , environmental an d social performance
We responsibly manage environmental, social and governance (ESG) aspects of our business, creating value for our community and stakeholders. Being a sustainable business enables us to live our values and deliver on our purpose, while meeting the changing expectations and demands of our employees, customers and communities. Our focus is working collaboratively with our stakeholders to continuously improve our operational, environmental and social performance.
2 Wha t is Loca l Voices ?
Port Waratah’s Stakeholde r Engagement Strategy provide s the framework for managing the material issues and concerns, interests an d expectations of each stakeholder group through identified, preferred an d
Conference Paper
91
Figure 1 Aerial view of the Port of Newcastle looking east with Kooragang Coal Terminal bottom left, Carrington Coal Terminal and the city of Newcastle top right.
Figure 1 Aerial view o f the Por t o f Newcastle looking east with Kooragang Coal Terminal botto m left, Carrington Coal Terminal and the city of Newcastle top right
2 What is Local Voices?
Port Waratah’s Stakeholder Engagement Strategy provides the framework for managing the material issues and concerns, interests and expectations of each stakeholder group through identified, preferred and considered methods of engagement. In 2018, Port Waratah enhanced the approach to community engagement by partnering with CSIRO to independently facilitate our Community Attitude Survey using the ‘Local Voices’ platform over a two-year cycle. In what has now become a cornerstone engagement tool, Local Voices has opened connection and two-way dialogue with all stakeholder groups broadening Port Waratah’s engagement opportunities.
Read more at https://pwcs.com.au/community/relationships
Local Voices surveys are open to existing and new participants to provide a transparent and highly-considered platform for the community to offer valued and confidential feedback. Local Voices provides the communities neighbouring Port Waratah’s operations a way to express their views and experiences directly to the company, and help the company engage with the issues that matter most to these communities. While the company may not be able to solve every issue raised, the business will be better informed on the things that matter most to local community. Participation is 100% confidential with no personal data shared with Port Waratah.
3 How does Local Voices work?
The Local Voices approach consists of an Anchor survey, followed by three Pulse surveys, conducted over a two-year period, which provides regular engagement and community insight every six months. Port Waratah are currently in their third cycle or 5th year of implementation.
Read more at https://pwcs.com.au/news/local.voices-making-difference-portwaratah?page=1
The surveys are delivered by Voconiq, an independent data science, research and community engagement company who use licenced CSIRO technology. Spun out of CSIRO in 2019, Voconiq is a data science and community engagement company built on more than a decade of research and industry practice. It helps organisations harness the relational mechanisms that underpin social licence to operate and to build trust within the communities with which they work.
To learn more: https://voconiq.com/wp.content/uploads/2022/06/Australian-FinancialReview-Feature.pdf
Conference Paper 92
4 What do we learn?
4 Wha t do we learn ?
The Local Voices results provide an opportunity for sophisticated data analysis that is translated into comprehensible language to describe and track key measures of the health of our relationship overtime and secondly, explore specific issues in a particular survey (see Appendix 1: Local Voices results summary). Port Waratah has the capability to assess longer term trends as well as point-in-time perspectives to address targeted focus areas. Port Waratah is committed to engaging with community members and stakeholders about survey results and opportunities for further improvement and positive community outcomes, publishing results and engaging with community members about what we learn after every survey.

The Local Voices results provide an opportunity for sophisticated data analysis that is translate d into comprehensible language to describe and track key measures of the health of our relationship overtim e and secondly , explore specific issues in a particular surve y (see Appendix 1: Local Voices results summary). Port Waratah has the capabilit y t o assess longer term trends as well as point-in-time perspectives to address targete d focus areas. Port Waratah is committe d to engaging with community member s and stakeholders about survey results and opportunitie s for further improvement and positive community outcomes, publishin g results and engaging with community members about what we learn afte r every survey.
Local Voices robustly measures trust and acceptance of Port Waratah by the community. The ‘Anchor’ survey is used to determine the drivers of community trust in Port Waratah and acceptance of its operations using data modelling path analysis and provides benchmarking
Conference Paper 93
Figure 2 How Local Voices works
Figure 2 How Local Voices works
Page: 5 of 7
against other known institutions and industries by the participants. The ‘Anchor’ survey is followed by half yearly ‘Pulse’ surveys to track Port Waratah’s progress in meeting community expectations.
Port Waratah has maintained positive, steady and strong levels of trust and acceptance from the Community since beginning Local Voices in 2018, a result we take great pride in. Of equal importance, it brings the voice of the community into the company, measuring our social performance. In our industry we live and breathe data. Local Voices provides a vehicle for the largely qualitative work of community relations to measure a quantifiable contribution to the success of the business strategy. Understanding what drives trust and acceptance from the Anchor survey analysis and measuring performance in the pulse surveys supports Port Waratah to evaluate our social performance and how we invest resources in meeting the expectations of the community. For example, important drivers of trust include:
5 Port Waratah’s environmental performance,
5 feeling heard and respected by Port Waratah,
5 feeling that the community receives a fair share of benefits created by Port Waratah.
Understanding these drivers of trust supports continuous improvement, engagement strategies and sharing information that is of material interest to community, such as our social investment and environmental improvement projects.
Local Voices insight also tells us that Port Waratah is seen to take sustainability seriously, with positive perceptions of our work in support of larger global initiatives like the UN SDGs.. However, we also learn that local community attitudes towards coal, sustainability and climate change, change over time and the local community seem to be holding these two global-scale thoughts – sustainability performance of a coal terminal and climate change -in their minds independently and have a nuanced and complex understanding of the energy transition. Local Voices delivers Port Waratah analysis that speaks to the interconnectedness of our strengths in the context of key drivers of trust and the community’s assessment of the “value proposition” for Port Waratah’s continued operation.
5 Relationships built on trust
Local Voices provides the mechanism to regularly examine the fundamentals of the relationship between Port Waratah and the community we operate alongside, enabling Port Waratah to refocus engagement efforts on drivers that are material to social risk and monitor these key outcome measures over time. Between ‘Anchor’ surveys there is strong evidence that actions taken by Port Waratah in response to the Local Voices feedback have proved effective in responding to community expectations.
Tangible examples of responding to Local Voices community feedback have included:
5 Reshaping the community investment and partnership programme to focus on the priority areas that matter most to the community including health and youth sports.
5 Providing improved access to independent air quality information and resources to increase community understanding of air quality across communication channels, including the introduction of a one-page quarterly community dashboard.
5 Meeting the communication method preferences of stakeholders to share more information and encourage two-way communication both through traditional and digital channels.
Port Waratah sees our assets as being “hosted” in the community. Our social licence to operate within our host city is predicated on maintaining our reputation and delivering on our stakeholder’s expectations with a high level of transparency. Local Voices has demonstrated having relationships based on trust is crucial to maintaining social licence.
Conference Paper 94
Dr Moffat, CEO of Voconiq suggests that, “Port Waratah stands out for its well planned, structured, and executed engagement strategy with portside and broader Newcastle communities. The data bears this out clearly and trust in and acceptance of the company remain strong and stable relative to industry peers.”
October 2022
LOCAL VOICES: Anchor Survey Results
October 2022
Thank you for your contribution to the Voconiq Local Voices 2022 ‘Anchor’ survey for Port Waratah. This is the third ‘Anchor’ survey for Port Waratah and marks the start of the fifth year of the Local Voices survey series. The ‘Anchor’ survey allows the team at Voconiq to determine the current community views towards Port Waratah on a wide range of issues and understand how they all fit together. We use the ‘Anchor’ survey to figure out the drivers of community trust in Port Waratah and acceptance of its operations. This ‘Anchor’ survey will be followed up by half yearly ‘Pulse’ surveys to track Port Waratah’s progress to meet community expectations.
LOCAL VOICES: Anchor Survey Results
Thank you for your contribution to the Voconiq Local Voices 2022 ‘Anchor’ survey for Port Waratah. This is the third ‘Anchor’ survey for Port Waratah and marks the start of the ffth year of the Local Voices survey series. The ‘Anchor’ survey allows the team at Voconiq to determine the current community views towards Port Waratah on a wide range of issues and understand how they all ft together. We use the ‘Anchor’ survey to fgure out the drivers of community trust in Port Waratah and acceptance of its operations. This ‘Anchor’ survey will be followed up by half yearly ‘Pulse’ surveys to track Port Waratah’s progress to meet community expectations.
Responses were collected in September and October 2022 in the Newcastle area. The results from the ‘Anchor’ survey showed that the top factors that impacted trust and acceptance were: Procedural fairness, awareness of social investment and training and job opportunities.
Responses were collected in September and October 2022 in the Newcastle area. The results from the ‘Anchor’ survey showed that the top factors that impacted trust and acceptance were: Procedural fairness, awareness of social investment and training and job opportunities.
Key talking points:
Contact Costs and benefts


Opportunities for women
79% of participants that had contact with Port Waratah reported having a positive or very positive experience.
55% of respondents believed that the company provides employment opportunities for women.
When asked about the costs and benefts of Port Waratah’s operations in the region, 35% indicated that the benefts outweighed the costs. 38% felt that costs and benefts are about equal, and 27% thought that costs outweighed the benefts.
Life and community
In general, people living in the Newcastle area have a high level of life satisfaction and feel that they belong to the area. Although overall satisfaction regarding the community belonging and resilience was positive, there is scope to improve child care services, schools and cultural facilities.
Trust and acceptance:
Trust and acceptance of PWCS remained steady from the previous ‘Pulse’ survey, with 3 out of 5 for trust and 3.2 out of 5 for acceptance. Since the start of the Local Voices program in 2018, trust and acceptance scores moved slightly up and down but remain in a strong, positive position.
Conference Paper 95
Trust and acceptance of PWCS remained steady from the previous ‘Pulse’ survey, with 3 out of 5 for trust and 3.2 out of 5 for acceptance. Since the start of the Local Voices program in 2018, trust and acceptance scores moved slightly up and down but remain in a strong, positive position.
Environment: Who participated?
Environment: Who participated?
Perceived environmental impacts in the community have remained steady from the previous ‘pulse’ survey. Community perceptions of noise impacts have increased slightly since the last survey.
Perceived environmental impacts in the community have remained steady from the previous ‘pulse’ survey. Community perceptions of noise impacts have increased slightly since the last survey.
Perceived environmental impacts in the community have remained steady from the previous ‘pulse’ survey. Community perceptions of noise impacts have increased slightly since the last survey.
Economic benefts:
Economic benefts:
Rewards:
Rewards:
Core indicators of economic confdence in the 2022 ‘Anchor’ survey have remained steady from the previous ‘Pulse’ survey. Consistent strong economic confdence suggests that the community has faith in the current economic circumstances of the region.
Core indicators of economic confdence in the 2022 ‘Anchor’ survey have remained steady from the previous ‘Pulse’ survey. Consistent strong economic confdence suggests that the community has faith in the current economic circumstances of the region.
Core indicators of economic confidence in the 2022 ‘Anchor’ survey have remained steady from the previous ‘Pulse’ survey. Consistent strong economic confidence suggests that the community has faith in the current economic circumstances of the region.
Community comments:
Community comments:


I would like to see the port transition away from coal. We are in a climate emergency” In this ‘Anchor’ survey, a total of 116 comments were made. There is a variety of topics participants raised in the open text boxes in the survey. Nearly 1 in 4 comments Grant opportunities for local community mentioned “dust” or “coal dust”, which makes it the most projects are particularly benefcial” frequently raised topic. This is followed by comments on the “environment” and/or Maybe at coal loading facilities when operating “climate change” (1 in 6 comments), and loaders maybe spray water so less dust into environment comments about the “community” (1 in 8 would be greatly appreciated to the community” comments) with many comments focusing If you would like to fnd out more about our climate action, community on the company’s community investment and dust management, plus much more, visit pwcs.com.au investment programs.
I would like to see the port transition away from coal. We are in a climate emergency” In this ‘Anchor’ survey, a total of 116 comments were made. There is a variety of topics participants raised in the open text boxes in the survey. Nearly 1 in 4 comments Grant opportunities for local community mentioned “dust” or “coal dust”, which makes it the most projects are particularly benefcial” frequently raised topic. This is followed by comments on the “environment” and/or Maybe at coal loading facilities when operating “climate change” (1 in 6 comments), and loaders maybe spray water so less dust into environment comments about the “community” (1 in 8 would be greatly appreciated to the community” comments) with many comments focusing
If you would like to fnd out more about our climate action, community on the company’s community investment and dust management, plus much more, visit pwcs.com.au investment programs.
Conference Paper 96
Community comments:
In this ‘Anchor’ survey, a total of 116 comments were made. There is a variety of topics participants raised in the open text boxes in the survey. Nearly 1 in 4 comments mentioned “dust” or “coal dust”, which makes it the most frequently raised topic. This is followed by comments on the “environment” and/or “climate change” (1 in 6 comments), and comments about the “community” (1 in 8 comments) with many comments focusing on the company’s community investment programs.
If you would like to find out more about our climate action, community investment and dust management, visit pwcs.com.au.
Conference Paper 97
“
I would like to see the port transition away from coal. We are in a climate emergency”
“ Grant opportunities for local community projects are particularly beneficial”
“ Maybe at coal loading facilities when operating loaders maybe spray water so less dust into environment would be greatly appreciated to the community”
Hosted by:
Book your place now
A pan European conference focussed on Growing Sustainable Supply Chains between Short Sea Shipping & Intermodal Transport Networks
Delegate place includes:

• Conference attendance including lunch & refreshments
• Technical Visit
• Electronic documentation
• Conference Dinner (Premium Package)
• Presentation download (Premium Package)
This year’s topics include:
• Market Sector Overview - the new normal in an adapting market
• How to promote growth and deliver resilient end to end supply chains
• Freeports: Driving change for coastal shipping and the supply chain


• Sustainability & the Energy transition –a route to shipping freight sustainably

Meet and network with international attendees representing shipping lines, ports, logistics companies, terminal operators and freight organisations.


For more information on attending, sponsoring or speaking contact the events team: visit: coastlink.co.uk contact: +44 1329 825335 or email: info@coastlink.co.uk

Media partners:
Supporters:
#Coastlink
GREENPORT INSIGHT FOR PORT EXECUTIVES
SHIP MARINE TECHNOLOGY THE
MOTOR
99
Opening Session DAY 2
PROFESSOR PAUL DASTOOR
Director of the Centre for Organic Electronics, University of Newcastle
BIOGRAPHY
Paul Dastoor is a Professor in Physics in the School of Mathematical and Physical Sciences and the director of the Centre for Organic Electronics at the University of Newcastle in Australia. He received his B.A. degree in Natural Sciences from the University of Cambridge in 1990 and his PhD in Surface Physics, also from the University of Cambridge, in 1995. After completing his doctorate he joined the Surface Chemistry Department at British Steel in 1994 before taking up his present appointment at the University of Newcastle in 1995. He was an EPSRC Visiting Research Fellow at Fitzwilliam College, Cambridge, UK in 2002 and a CCLRC Visiting Research Fellow at the Daresbury Laboratory, Cheshire, UK in 2004-05.
100
Opening by Chairman / Moderator
Green Financing for Sustainable Port Development
SESSION
101
4
MARIANNE KIM Associate Director, Macquarie Asset Management


Moderator
102
JACKIE SPITERI Director, Sustainable ESG
BIOGRAPHY
Jackie is an experienced Environmental, Social, Governance (ESG) professional with a history of working in the maritime and infrastructure sector bringing a wealth of knowledge on sustainable development and operations.
With over 15 years’ experience in environment, planning and sustainability management, Jackie is now focused on strategy development and business transformation. With a gift for creating collaborative partnerships, alongside a strong ability to recognise and cultivate the potential in others, Jackie has a proven track record of accelerating organisational sustainability through strategy implementation , communication, and education. During her career Jackie has been responsible for the development of a number of Sustainability Financing Frameworks enabling over $750million of sustainability linked debt to be realised through a series of innovative sustainability financing transactions.
In 2022, Jackie became the founder and Managing Director of boutique ESG advisory company Sustainable ESG (SESG). SESG are focused on supporting organisations navigate the evolving ESG imperative. Helping organisations to understand their current state and develop relevant and tailored strategies that build upon existing foundations.

Jackie sits on the Board for PIANC ANZ, a global not-for-profit body that brings together experts on technical, economic, environmental and planning issues pertaining to waterborne transport and infrastructure and is a former Chair of the Ports Australia Environment Planning and Sustainability Working Group. Jackie also sits on the Mayor of Newcastle’s Sustainable Development Collaborative, an active group focused on localising the United Nations SDGs to the region.
Jackie was responsible for introducing EcoPort to the Oceania region and since 2018 Jackie has advocated for ports to participate in the program with nine ports now part of the network. In her capacity as Managing Director of SESG, Jackie has recently signed an MOU and Statement of Intent with EcoPorts EcoSLC to formally collaborate and further extend the network of participating Ports and Terminals in Oceania.
Speaker
103
ESG, an evolution of sustainability

Evolution

ENVIRONMENTAL
ENVIRONMENTAL SOCIAL SOCIAL ECONOMIC GOVERNANCE
Sustainable Financing

Through directly connecting sustainability commitments and performance to financing, an organisation can benefit from:


5 reduced cost of debt
5 more easily attract new lenders and retain existing ones

5 generate a pool of green assets

5 Ways ESG Creates Value

Conference Paper
104 104 104 104
# 1 # 1 # 1 # 1 # 1 Facilitating top-line growth Reducing costs Minimizing regulatory and legal interventions Increasing employee productivity Optimizing investment and capital expenditures
Materiality
Understanding�� those�� aspects��that��are�� material��to��your�� organisation��is�� essential to�� developing a�� strateg that��is��focused�� and��relevant
Understanding those aspects that are material to your organisation is essential to developing a strategy that is focused and relevant
Sustainability Context
Control and influence
Materiality
Stakeholders
Define the sustainability context of the organisation to define ESG aspects that are relevant to the organisation and its stakeholders
Sustainability Context

Define the sustainability context of the organisation to define ESG aspects that are relevant to the organisation and its stakeholders

What is the organisations ability to control and influence the sustainability topics identified?
Control and Influence
What is the organisations ability to control and influence the sustainability topics identified?


Understand what material issues influence stakeholder decisions when engaging with your organisation.
Stakeholders
Understand what material issues influence stakeholder decisions when engaging with your organisation
Conference Paper 105
��Material Topics ��for ��the Maritime ��Sector Climate Change
reduction
risk Supply chain impacts Workforce Diversity and inclusion
community Woman in maritime Equal and inclusive environment
species
Example
Emmisions
Physical
Global
Biodiversity Threatened
Pollution Biosecurity
13.1
UN SDGs
“The Sustainable Development Goals are more important now than ever. Now is the time to secure the well-being of people, economies, societies, and our planet.”
António Guterres
Secretary-General, United Nations
UN SDGs Related ��to��the ��Material Topics
Take urgent action to combat climate change and its impacts

Strengthen resilience and adaptive capacity to climate-related hazards and natural disasters in all countries
Reduce inequality within and among countries

10.2
By 2030, empower and promote the social, economic and political inclusion of all, irrespective of age, sex, disability, race, ethnicity, origin, religion or economic or other status
Conserve and sustainably use the oceans, seas and marine resources for sustainable development


14.1
By 2025, prevent and significantly reduce marine pollution of all kinds, in particular from landbased activities, including marine debris and nutrient pollution
Conference Paper 106
Measurement
You cannot manage what you do not measure.
Reporting and Disclosure
Accountability
Committing to reporting and disclosing information relating to material ESG topics provides transparency, drives accountability and stregthens credibility


Frameworks
With multiple reporting frameworks available, choosing the relevant frameworks early will assist in shaping an ESG Strategy.
Verification
When disclosing performance information and data it is essential to ensure that this can be verified. Providing evidence of independent verification enables external stakeholders to immediately assess the legitimacy of the claim.
Conference Paper 107
NICK LIVESEY Chief Financial Officer, Port of Newcastle
BIOGRAPHY
Nick joined Port of Newcastle as CFO in May 2019 as Chief Financial Officer, overseeing Finance, Treasury, ESG, Investor Relations, Procurement and Risk. Between Port of Newcastle and his twelve years at Sydney Airport, Nick has extensive experience in the infrastructure and property sectors.
Nick has a track record of identifying trends and business levers to maximise asset utilisation and returns. He was previously a Senior Manager at global consultancy firm Ernst & Young and has a reputation as a strategic business partner adept at navigating a complex business environment where there are competing priorities.

Speaker
108
Sustainability Linked Financing 101
Overview:
Considering what lenders are looking at when considering debt transactions with customers and what green financing options are available within the maritime sector.
1. INTRODUCTION
Sustainability linked financing is a key focus at the moment, but what is it, how do you get it, what does it cost and most importantly, why is it happening?
At Port of Newcastle (PON), we have done three sustainability linked transactions between April 2021 and October 2022. Here we look at our experience and what options are available.
2. WHAT IS IT?
As will most things finance, there is a lexicon that makes things sound much more complicated than it actually is. All sustainability linked financing is your normal financing transactions such as borrowing and hedging and adding contractual terms that relate to KPIs that you need to achieve as a business that then impacts the cost of the financing.
3. HOW DO YOU GET IT?
All the large banks around the world now generally have the capacity and the desire to put sustainability terms in their financial transactions. We simply asked our lead bank (National Australia Bank - NAB) about sustainable terms when we were undertaking a refinance that completed in April 2021.
NAB already had the capacity and experience to arrange this and we put forward the proposed terms to the rest of the banking syndicate (which included 13 banks originating out of Australia, Japan, China and the US) for them to also negotiate and accept. While not obligatory to take part, nearly all the banks did.
Deutsche Bank along with NAB took on a similar role when we were taking out substantial long term cross currency swaps relating to our bond issue in November 2021 and NAB undertook the role again when we refinanced more bank debt in October 2021.
4. WHAT DOES IT COST?
Generally there is a “carrot and stick” approach, where your debt costs slightly less if you achieve the KPIs, but is also more expensive if do not achieve the goals. The fees associated with putting the actual arrangement in place are generally pretty small compared to the overall cost of undertaking a financing transaction anyway.
5. WHY IS IT HAPPENING?
Banks and financial institutions are increasingly required to justify their investment choices based on sustainability and environmental risk, and public opinion is demanding ever more urgent action on environmental sustainability.
Conference Paper
109
Some banks have also had significant blow back from national governments when they have tried to walk away from industries that they had traditionally supported and made money from, when the publicity got too much. They may be private companies, but they play an important role in underpinning the economy.
Banks are in a very influential position – we need their capital – they can use that for social good by influencing behaviours – that is what sustainability linked financing is aiming to do –expect it to stay around and get more sophisticated in coming years.
6. WHAT SORT OF KPIs GET SET
The terms that get set will vary from business to business. The maritime sector and port (infrastructure) sectors will get goals that are specific to the sector and that individual business. However, you can expect some key themes in the market at the moment:
5 Reduction in your scope 1 and 2 emissions
5 Move to source renewable electricity (impacting scope 2)
5 Increasingly, we are seeing terms that look to try and address scope 3 emissions
5 Social factors such as:
o Modern slavery
o Diversity and inclusion
o Employee health and wellbeing
o Safety
o Biodiversity
7. PORT OF NEWCASTLE – CASE STUDY
As mentioned earlier, PON has now done three sustainability linked transactions:
1. First sustainability linked loan in April 2021 with bank debt – led by NAB
2. Second sustainability linked hedging in November 2021 – led by Deutsche Bank
3. Third sustainability linked loan in October 2022 – ked by NAB
In all cases, PON worked with the lead arranger to define the proposed KPIs. These were based on the normal environmental and social concerns but tailored to fit the specific measures and circumstances of the company.
In all these transactions, we also had a number of other external counterparties that we were looking to bring into the transaction – for example, for our bank loans, we have a syndicate of 13 banks headquartered across Australia, China, the US and Japan. Each of these banks has their own ESG priorities that they want to influence – so there is a fair amount of negotiation involved – but for the most part, the proposed KPIs are presented to the other counterparties by PON and NAB to see if they want to take part in the sustainability part of loan – they almost universally do.
The tailoring to the underlying business is important. While there will be common themes that investors are looking for, the KPIs set need to be stretch targets, but achievable within the timeframe, or the influence and motivation is lost. It is also important that the KPIs cover a spread of areas to impact and avoid the tendency to focus on just environment, or just various ways of impacting scope one emissions.
Conference Paper 110
And then we have business specific, which for PON means ensuring that we diversify our business and reduce our exposure to and dependency on coal for our revenues – essentially in our case, this holding us to account to do what we say we are going to do – agreeing to the sustainability terms is not just the financial penalty or benefit we obtain for achieving the goals, but also credibility and ultimately continued investment from our partners.
While the terms are specific to our business and intended to drive behaviour, they also have to be linked to the timeframe of the underlying instrument.
For example, in the first loan that we did in April 2021, there was no KPI relating to our exposure to coal revenue. When the terms were made public, there was a lot of criticism that the world’s largest coal port had not made commitments on diversifying away from coal revenue dependency.
This was discussed at the time that we put the KPIs in place. The reality is that we were at the start of the diversification journey at that time. Our diversification will come from investment in new infrastructure and building up new and existing non-coal businesses. The loans that we were attaching the SLL terms to were only three-year term and therefore, reasonable change in coal revenues was not possible in that timeframe. However, the hedges that we did six months later were for a 10-year term – that is a timeframe in which meaningful change can be achieved and so the percentage of revenue derived from being part of the coal supply chain was a part of those KPIs.
There were many other possibilities that we could have included within our financing, such as biodiversity targets and we are seeing those appear in SLL terms for other companies in Australia. We expect that our next loans will have terms that encompass new targets like these as we achieve the targets that the existing loans set.
So, what can you expect when arranging sustainability linked financing:
For anyone, the first items will be targets to improve your own scope 1 and 2 emissions, diversity and inclusion and modern slavery. Next of the rank will be influencing others to address scope 3 emissions.
For an infrastructure business like a port, that will mean port operations emissions – but then the harder task will be influencing the users of the ports – predominantly the shipping lines, tenants and stevedores.
Conference Paper 111
DAVID JENKINS
Global Head of Sustainable Finance
Corporate & Institutional Banking, National Australia Bank
BIOGRAPHY
David leads NAB’s Sustainable Finance team and has been active in sustainable debt financing for over 10 years, having joined NAB in 2010. He is a member of NAB’s Corporate & Institutional Banking Sustainability Steer Co and works closely with treasury, risk, coverage, product and markets teams developing and originating sustainable financing and investment solutions for NAB clients across Australia, New Zealand, Asia, UK, Europe and the USA. He has over 20 years of financial markets experience across a range of product solutions, origination and structuring roles for banks in Sydney, Hong Kong, London and New York.
David has worked with a broad range of clients including sovereigns, semi-governments, funds, financial institutions, corporates and securitisation issuers to establish their sustainable debt programmes. The NAB Sustainable Finance team have arranged a broad range of innovative sustainable financing and investment solutions across a range of global markets including green, social, sustainability and sustainability linked bonds and loans, sustainability-linked derivatives, green deposits, green funds, green and social securitisations and green leasing solutions.

David chairs the AFMA Sustainable Finance Committee and is an active member of numerous industry bodies including the Australian Sustainable Finance Institute (ASFI), ICMA’s Green, Social and Sustainability-Linked Bond Principles, APLMA’s Green and Sustainability-linked Loans Committee, Climate Bonds Standards Industry working groups, Institute of International Finance (IIF) Sustainable Finance WG and the Australian Securitisation Forum ESG WG.
Prior to transitioning into banking David held senior project management and real estate development roles across Australia and the USA. He holds an MBA (Finance) from London Business School, a Graduate Diploma in Applied Finance & Investment from FINSIA and a Bachelor of Engineering (Civil) from the University of Queensland.
Speaker
112
multimodal
SESSION 5 STREAM 1 113
Green logistics
supply chains


Moderator
SAL MILICI
114
General Manager Trade Policy and Operations –FTA APSA
Speaker
SAL MILICI
115
General Manager Trade Policy and Operations –FTA APSA
Implanting sustainability within the logistics chain
Decarbonisation of global shipping is a critical issue as the shipping industry is responsible for a significant portion of the world’s carbon emissions. The International Maritime Organization (IMO) estimates that shipping emissions account for approximately 3% of global greenhouse gas emissions, and this figure is projected to grow unless action is taken.
To address this problem, the IMO has set a goal of reducing the total annual greenhouse gas emissions from international shipping by at least 50% by 2050, compared to 2008 levels.
This target is part of the organization’s efforts to address the impact of shipping on climate change and to align with the goals of the Paris Agreement.
The reduction in GHG emissions will be tackled through a combination of measures, such as increasing energy efficiency, using alternative fuels, and promoting sustainable shipping practices.
The IMO is also working on developing a comprehensive greenhouse gas reduction strategy to guide the shipping industry’s efforts in achieving the 2050 target.
This will require the development and implementation of new technologies and practices that can significantly reduce the carbon footprint of ships.
One promising solution is the use of alternative fuels, such as biofuels, hydrogen, and electricity. Biofuels, which are made from renewable plant materials, can significantly reduce the carbon emissions of ships. Hydrogen fuel cells, which produce electricity through a chemical reaction between hydrogen and oxygen, are also a potential solution. Electric propulsion systems, which use batteries or fuel cells to power ships, are also being developed.
Another solution is energy-efficient ship design. Shipbuilders can design ships that are more aerodynamic, which can reduce fuel consumption and emissions. New technologies such as wind-assisted propulsion systems, which use sails or kites to harness wind power, can also help reduce emissions.
Another important strategy for decarbonising global shipping is to improve the efficiency of ships. This can be achieved through better navigation, optimized speed management, and improved cargo loading and unloading procedures.
Additionally, the implementation of digital technologies such as the Internet of Things (IoT) and big data analytics can help improve the efficiency of shipping operations.
Decarbonisation of global shipping is a complex and challenging task, but it is essential to address the significant contribution of the shipping industry to global greenhouse gas emissions. A combination of alternative fuels, energy-efficient ship design, and improved efficiency can help significantly reduce the carbon footprint of ships, and help the industry meet the ambitious targets set by the IMO.
Conference Paper
116
The transition to sustainability in the global logistics supply chain is a complex and challenging task, and there are several challenges that must be addressed. Some of the key challenges include:
Lack of standardisation: There is currently a lack of standardisation in terms of sustainability metrics and reporting, which makes it difficult for companies to compare their performance and set meaningful targets.
Limited availability of sustainable technologies and infrastructure: The availability of sustainable technologies and infrastructure is limited in many regions, which can make it difficult for companies to transition to more sustainable practices.
High costs: Transitioning to sustainable logistics can be expensive, particularly for small and medium-sized enterprises. The costs of sustainable technologies and infrastructure, as well as the costs of compliance with regulations and certifications, can be a significant barrier for companies.
Lack of visibility and transparency: Supply chains are becoming increasingly complex and globalized, making it difficult for companies to have visibility into the entire supply chain. This can make it difficult to identify and address sustainability issues, and can also make it difficult for companies to communicate their sustainability efforts to customers and stakeholders.
Resistance to change: Change can be difficult, and there may be resistance from employees, suppliers, and customers to the transition to sustainable logistics. This can include resistance to new technologies, new processes, and new ways of working.
Limited government support and regulations: Government support and regulations play an important role in driving the transition to sustainable logistics. The lack of government support and regulations in certain regions can make it more difficult for companies to transition to sustainable practices.
Transition to sustainability in the global logistics supply chain requires a multifaceted approach that addresses each of these challenges and more. It requires collaboration among different stakeholders and a strong commitment to sustainability from all parties involved.
Conference Paper 117
KENNY WALKER Principal Environmental Scientist, RHDHV


BIOGRAPHY
Kenny Walker is a highly experienced environmental consultant with over 20 years’ experience in the engineering and environmental sector where his focus has been on energy and infrastructure sector with a strong focus on renewables. He has worked around the world including Australia, the UK, Ireland, the Netherlands, Norway, the Middle East, West Africa, and the USA working across a number of industry sectors including energy (renewables, oil and gas and mining), water and infrastructure. His roles include acting as project manager as well as providing technical lead in specialised areas of earth science, environment management, sustainability and compliance.
Kenny has developed expertise in renewables projects focused on initial feasibility assessment through to full environmental impact assessment, development and operation. His experience includes delivery of the impact assessment and approval for the world’s first offshore tidal power array in Scotland and initially project managing the Cantick Head offshore tidal array in the Pentland Firth as well as undertaking initial grid feasibility assessments for a number of Round 3 and Scottish territorial offshore wind farms. He has also been technical lead for land feasibility assessments for a range of developments in Africa and the Middle East alongside developments in Australia. Most recently he presented at “All Energy” renewables conference in Melbourne on the transition and development of fossil fuel-based economy to renewables.
Speaker
118
Renewable energy as part of a mixed energy future is critical to reduce impacts from rapid man-made climate change. Technologies, such as solar cells and wind power, are some of the main options globally to replace today’s fossil-dominated energy supply. Solar and wind energy are growing rapidly, but while the energy is renewable every solar panel and wind turbine is constructed from a range of non-renewable resources including minerals (such as silica sand in the case of solar panels and rare earth metals in turbine and voltaic parts). Building wind turbines is also a very energy-intensive process, especially the production of the steel towers and the concrete foundations. These energy technologies also have a limited lifespan and the power plants we build today will need replacing in the future alongside the bulk of Australia’s electricity network which is old and carbon intensive.
For solar, most countries and supplies chains don’t have sufficient recycling and supply chain regulations in place to recycle discarded modules aside from Europe. The standards are intended to prevent solar panels from rotting in the natural environment and eventually leaching pollutants. In addition, solar panels contain valuable raw materials that can be recycled.
Similarly looking at wind power an average wind turbine operates for about 25 years. Beneficially during this time, they generate 40 times more energy compared to the energy required for the production, operation and the disposal of a wind power plant. But by 2050, up to 50,000 wind farms will need to be shut down and replaced by newer and much more efficient wind power technology. This will require the disposal of much of the concrete found in the foundation, steel in the tower and the gear box and a compound of plastic with glass or carbon fibre used in the rotor blades.
Supply chains in some countries have considered future recycling and sustainability e.g. concrete can be crushed and used in roadworks, and the precious steel can be recycled into new steel. Other valuable metals such as copper and aluminum can be reused. Recycling the rotor blades made from plastic and carbon composites is more problematic. In the United States, old rotor blades have so far ended up in disposal sites. In Europe, they have mostly been used as alternative fuel in cement kilns and waste incinerators. This presentation considers the sustainability of renewable infrastructure and looks at the supply chain of certain renewables (solar and wind) alongside batteries and undertakes a review of current reuse options and provides a context of where industry, government and the future supply chain may develop in the context of Australian Ports.
Conference Paper
119
Green logistics: Discussing the challenges and options of implanting sustainability within the logistic chain. The sustainability of renewables infrastructure – A review.
IVAN SPANJIC Chief Commercial Officer – Svitzer Australia


BIOGRAPHY
Ivan leads the commercial aspects of terminal and harbour towage business units with a focus on growing Svitzer’s relationships with customers and stakeholders. He also leads the business development team focusing on retaining existing and expanding Svitzer’s footprint in the region. He was appointed as Chief Commercial Officer in June 2017 and has recently been appointed with GreenPorts portfolio responsibility across Svitzer globally. The Green Ports role sees Ivan responsible for partnering with our customers and stakeholders to achieve carbonfree port operations.
Ivan has a portfolio of international experience in the maritime sector, working in container shipping and logistics before joining the Maersk Group of companies. He has held various operational and general management roles including Regional Chief Operating Officer of our Middle East and Africa region. Ivan holds a degree in commerce from Murdoch University and a Postgraduate Certificate in finance from Cornell University.
Speaker
120
PAPER GREENPORT OCEANIA
GREENPORT OCEANIA: PAPER
NEUTRAL TOWAGE & SUSTAINABLE MARINE SERVICES AS A MEANS OF MEETING GREENPORT GOALS
Carbon neutral towage & sustainable marine services as a means of meeting greenport goals
1. Introduction
Introduction
change is a monumental challenge. It is clear that without action in the near term, the impact of on our planet will lead to irreversible shifts to ecosystems, cities, and our way of life.
Climate change is a monumental challenge. It is clear that without action in the near term, the impact of humans on our planet will lead to irreversible shifts to ecosystems, cities, and our way of life.
world’s largest towage provider, Svitzer recognises that it has an important role to play in the wider system to respond to these demands, as well as an important position to influence industry behaviours, technology and assets.
As the world’s largest towage provider, Svitzer recognises that it has an important role to play in the wider port eco-system to respond to these demands, as well as an important position to influence industry standards, behaviours, technology and assets.
plays a small yet significant role in the global supply chain. We link the first and last mile of the remainder of the chain but, paradoxically, are not always bound by shipping regulations.
Towage plays a small yet significant role in the global supply chain. We link the first and last mile of shipping to the remainder of the chain but, paradoxically, are not always bound by shipping regulations.
the tug industry being outside IMO environmental regulations, Svitzer has announced targets to carbon intensity of its entire fleet by 50% by 2030 and achieving full carbon neutrality by 2040.
Despite the tug industry being outside IMO environmental regulations, Svitzer has announced targets to reduce the carbon intensity of its entire fleet by 50% by 2030 and achieving full carbon neutrality by 2040.

ambitious goals, and with 2030 just over seven years away, achieving a 50% reduction in will require the optimization of existing assets, a switch to biofuels a nd the rapid introduction of zero emissions power sources.
These are ambitious goals, and with 2030 just over seven years away, achieving a 50% reduction in intensity will require the optimization of existing assets, a switch to biofuels and the rapid introduction of new low or zero emissions power sources.
Complementary to these internal targets has seen the development of a range of internal assets, systems that not only reduce the carbon intensity of Svitzer’s own towage services but offer substantial opportunity to the development of green shipping corridors and broader green port initiatives.
Complementary to these internal targets has seen the development of a range of internal assets, systems and tools that not only reduce the carbon intensity of Svitzer’s own towage services but offer substantial opportunity to the development of green shipping corridors and broader green port initiatives.
the green port agenda cannot be achieved by individual ports, shipping companies, marine suppliers, and others in the supply chain, acting in isolation – it requires the entire port eco-system together to affect real change.
However, the green port agenda cannot be achieved by individual ports, shipping companies, marine service suppliers, and others in the supply chain, acting in isolation – it requires the entire port eco-system to work together to affect real change.
Conference Paper
Fig 1. Svitzer’s decarbonisation goals
121
PAPER GREENPORT
OCEANIA
Fig 1. Svitzer’s decarbonisation goals
TECHNICAL
This includes joint participation and efforts in developing, advocating and implementing:
1. Alternative and new fuel sources including fuel selection, development, testing, storage, bunkering and use;
2. Shared investment in both sea-based and shore-side assets to ensure scale, implementation and technology selection;
3. Better capture, integration and sharing of key data sources;
4. Working together on behaviour change around shipping operations and processes (e.g. shipping speed, optimisation of shore-side and sea-based assets and services);
5. Advocating for the right policy and investment support from governments and other parties to accelerate change.
This paper explores Svitzer’s own strategy for decarbonisation, and through our experience the partnership opportunities and settings needed today to help accelerate Australia’s green port agenda nationally.
2. Background
There is a growing social, regulatory, investor and customer demand for change as it relates to the environmental, social and governance performance of all organisations.
In Australia the recently elected Federal Labor Government has enshrined net zero by 2050 targets into legislation, unveiled its new carbon trading scheme and has an increased focus for industry to deliver ‘real’ emission reductions.
Internationally, Shipping contributes to approximately three per cent of all global human-related greenhouse gas emissions or 1056 million tonnes of CO2 in 2018. In 2018, the International Maritime Organisation (IMO) adopted its initial strategy on greenhouse gas reduction with a goal of reducing total emissions by 50 per cent by 2050i.
In terms of Svitzer’s own emissions, our global fleet of 400 tugs emits the same every year as 100,000 diesel-powered cars, or around 280,000 tonnes of CO2. The wider, global tugboat fleet (all operators combined) emitted around 41 million tonnes of CO2 in 2018.
However, of significance is that the environmental impact of the towage sector is out of scope of the IMO’s environmental regulations, placing the responsibility on operators within the sector to seek out solutions to reduce these emissions.
Svitzer’s Strategy to decarbonise towage focuses on three areas: behaviour, fuel and equipment. Many of the elements being delivered in Svitzer own decarbonisation strategy provide significant opportunity for parties across the port ecosystem to deliver on their own green port and green shipping objectives.
3. Svitzer’s Decarbonisation Strategy: Behaviour, Fuel, Equipment
3.1 Behaviour
One of the key tools Svitzer has used to help drive changes in behaviour is via Port Monitor, an online application that uses AIS data to monitor vessels’ location, speed and heading, and applies AI techniques to identify tug jobs and key events during operations.
Using a standardized fuel curve we can estimate fuel and emissions incurred during mobilization and demobilization, the two phases of the job when the tug is operated at the master’s discretion and is not under the pilot’s orders.
Conference Paper 122
provides an excellent window into towage operations and has been instrumental in helping Australian emissions. Svitzer Australia has reduced overall fuel consumption from around engine hour in 2019 to 52 litres per hour in 2022 – nearly 10 per cent.
Port Monitor provides an excellent window into towage operations and has been instrumental in helping reduce Svitzer’s Australian emissions. Svitzer Australia has reduced overall fuel consumption from around 57 litres per engine hour in 2019 to 52 litres per hour in 2022 – nearly 10 per cent.
Port Monitor provides an excellent window into towage operations and has been instrumental in helping reduce Svitzer’s Australian emissions. Svitzer Australia has reduced overall fuel consumption from around 57 litres per engine hour in 2019 to 52 litres per hour in 2022 – nearly 10 per cent.
originally a tool focused solely on fuel and emissions reduction has become a platform for information and services, including job replay, incident investigation, checking timestamps and staff and crew with operations in different ports.


What was originally a tool focused solely on fuel and emissions reduction has become a platform for additional information and services, including job replay, incident investigation, checking timestamps and familiarizing shore staff and crew with operations in different ports.
What was originally a tool focused solely on fuel and emissions reduction has become a platform for additional information and services, including job replay, incident investigation, checking timestamps and familiarizing shore staff and crew with operations in different ports.
currently covers eleven major ports in Australia and thirty-five worldwide and will be extended operations with the introduction of a new version during 2023.
Port Monitor currently covers eleven major ports in Australia and thirty-five worldwide and will be extended to cover all Svitzer operations with the introduction of a new version during 2023.
Commented [IS1]: Can 10% over the last 2 years Commented [DB2R1]: overall fuel consumption hour in 2019 to 52 litres per 8.8%.
Port Monitor currently covers eleven major ports in Australia and thirty-five worldwide and will be extended to cover all Svitzer operations with the introduction of a new version during 2023.
Svitzer can now estimate all marine side emissions
estimate all marine side emissions
Commented 10% over the Commented overall fuel hour in 2019 8.8%.
Svitzer can now estimate all marine side emissions
the network of AIS receivers and extending the methodology used in Port Monitor, Svitzer provide an estimate of all marine side greenhouse gas emissions in a por t. Over the past
By capitalising on the network of AIS receivers and extending the methodology used in Port Monitor, Svitzer is now able to provide an estimate of all marine side greenhouse gas emissions in a por t. Over the past few years, the IMO has published a Port Emissions Toolkit, which outlines the methodology pioneered in US ports to estimate greenhouse gases emitted by all land and marine side activities in the port. Applying this in combination with up-to-date vessel characteristics, technical data and local knowledge, Svitzer has created an automated process to calculate CO2, nitrous oxide, methane and other emissions that can be segmented by time period, location, type of vessel, carrier and any number of other parameters.
IMO has published a Port Emissions Toolkit, which outlines the methodology pioneered in estimate greenhouse gases emitted by all land and marine side activities in the port. Applying with up-to-date vessel characteristics, technical data and local knowledge, Svitzer has automated process to calculate CO2, nitrous oxide, methane and other emissions that can be time period, location, type of vessel, carrier and any number of other parameters.
By capitalising on the network of AIS receivers and extending the methodology used in Port Monitor, Svitzer is now able to provide an estimate of all marine side greenhouse gas emissions in a port. Over the past few years, the IMO has published a Port Emissions Toolkit, which outlines the methodology pioneered in US ports to estimate greenhouse gases emitted by all land and marine side activities in the port[IS3][DB4]. Applying this in combination with up-to-date vessel characteristics, technical data and local knowledge, Svitzer has created an automated process to calculate CO2, nitrous oxide, methane and other emissions that can be segmented by time period, location, type of vessel, carrier and any number of other parameters.
Commented ideally a busy
Commented the heatmap
Commented [IS3]: Possible ideally a busy port anchorage Commented [DB4R3]: the heatmap of Newcastle
land marine side emissions – Port of Newcastle
Not only does this provide valuable insights into the major sources of greenhouse gas emissions in a port, but it also allows the modelling of the impact of potential upgrades like shore power, more stringent emissions standards, changes in operational practice and the introduction of new equipment.
Heat map showing estimates of land marine side emissions – Port of Newcastle
provide valuable insights into the major sources of greenhouse gas emissions in a port, the modelling of the impact of potential upgrades like shore power, more stringent standards, changes in operational practice and the introduction of new equipment.

Conference Paper 123
Fig 2. Examples of Port Monitor dashboard
Fig 3. Heat map showing estimates of land marine side emissions – Port of Newcastle TECHNICAL PAPER GREENPORT OCEANIA PAGE NO. 03
Fig 2. Examples of Port Monitor dashboard
GREENPORT OCEANIA PAGE NO. 03
Fig 2. Examples of Port Monitor dashboard
Not only does this provide valuable insights into the major sources of greenhouse gas emissions in a port, but it also allows the modelling of the impact of potential upgrades like shore power, more stringent emissions standards, changes in operational practice and the introduction of new equipment.


Operational data is driving further efficiencies
Operational data is driving further efficiencies
In 2018 Svitzer introduced new standards for the data capabilities of newbuild tugs, requiring that all parameters available in the wheelhouse displays can be monitored, recorded and exported to the cloud in real time. There are now an increasing number of tugs with this capability in the fleet, allowing us to analyse operations to identify potential improvements and emissions reduction opportunities.
In 2018 Svitzer introduced new standards for the data capabilities of newbuild tugs, requiring that all parameters available in the wheelhouse displays can be monitored, recorded and exported to the cloud in real time. There are now an increasing number of tugs with this capability in the fleet, allowing us to analyse operations to identify potential improvements and emissions reduction opportunities.
For instance, in 2022, we conducted a series of tests in conjunction with pilots in the Port of Geraldton, to determine the impact of subtle changes in operational procedures. Two effectively identical sister vessels berthed at the port within a few days of each other, and we compared the fuel used by the three attending tugs throughout the course of these operations. Not only were we able to accurately measure the total fuel used by the tugs, but using the IMO methodology outlined previously we could also estimate the change in fuel used by the attended vessel due to the altered operating procedure.
For instance, in 2022, we conducted a series of tests in conjunction with pilots in the Port of Geraldton, to determine the impact of subtle changes in operational procedures. Two effectively identical sister vessels berthed at the port within a few days of each other, and we compared the fuel used by the three attending tugs throughout the course of these operations. Not only were we able to accurately measure the total fuel used by the tugs, but using the IMO methodology outlined previously we could also estimate the change in fuel used by the attended vessel due to the altered operating procedure.
3.2 Fuel & Energy
3.2 Fuel & Energy
Svitzer’s second area of focus is on fuel and energy, both finding sustainably produced substitutes for fuel in existing assets and applying new technologies to power vessels with renewable energy sources.
Svitzer’s second area of focus is on fuel and energy, both finding sustainably produced substitutes for fuel in existing assets and applying new technologies to power vessels with renewable energy sources.
3.2.1 Fuel Transition Pathway
3.2.1 Fuel Transition Pathway
As with most organisations across the marine sector, and indeed medium and heavy industry generally; there is a global race in identifying and selecting the right future fuel and energy mix for operations.
As with most organisations across the marine sector, and indeed medium and heavy industry generally; there is a global race in identifying and selecting the right future fuel and energy mix for operations.
From a Svitzer perspective, there is no single, true replacement for Marine Gas Oil (MGO) available now that can match its energy density (how much ‘bang for your buck’), ease of use, availability or low cost.
From a Svitzer perspective, there is no single, true replacement for Marine Gas Oil (MGO) available now that can match its energy density (how much ‘bang for your buck’), ease of use, availability or low cost.
So, we need to explore our options and prepare for a future where we will be faced with short term compromise solutions whilst new fuels are developed and scaled up globally. Assessing these choices and figuring out the ‘best’ fuel to use as they mature will be a key task for us. Alternative fuel technologies like methanol, ammonia, and hydrogen are leading options and are developing rapidly as other industries also seek viable fuel solutions.
So, we need to explore our options and prepare for a future where we will be faced with short term compromise solutions whilst new fuels are developed and scaled up globally. Assessing
In the near-term, drop-in fuels like hydrogenated vegetable oil (HVO – used in our EcoTow offer) provide a critical route to decarbonize as they offer carbon neutral tank-to-wake emissions, but demand, cost and well-to-wake impacts remain a concern. Mitigating the risk regarding availability and cost issues around fuel is critical for our future fleet operation. Whilst newer fuels like met hanol and ammonia are in the early
Conference Paper 124
Fig 4. Changes in fuel use as a result of operational changes in the Port of Geraldton
Fig 4. Changes in fuel use as a result of operational changes in the Port of Geraldton
Commented overview diving Future Electric.
these choices and figuring out the ‘best’ fuel to use as they mature will be a key task for us. Alternative fuel technologies like methanol, ammonia, and hydrogen are leading options and are developing rapidly as other industries also seek viable fuel solutions.
stages of development, we risk not being able to benefit from them in the future when they are available at scale if we don’t prepare now for their arrival.
stages of development, we risk not being able to benefit from them in the future when they are available at scale if we don’t prepare now for their arrival.
In the near-term, drop-in fuels like hydrogenated vegetable oil (HVO – used in our EcoTow offer) provide a critical route to decarbonize as they offer carbon neutral tank-to-wake emissions, but demand, cost and well-to-wake impacts remain a concern. Mitigating the risk regarding availability and cost issues around fuel is critical for our future fleet operation. Whilst newer fuels like methanol and ammonia are in the early stages of development, we risk not being able to benefit from them in the future when they are available at scale if we don’t prepare now for their arrival.
Designing and building ‘future fuel’ ready vessels and understanding how to retrofit our existing vessels will help to do this. Dual fuel engines and early adoption of new technology will be critical to help us de-risk the fleet to avoid being ‘stuck with’ expensive fuels in limited supply and avoid stranded assets – vessels we have built but can no longer operate.
Designing and building ‘future fuel’ ready vessels and understanding how to retrofit our existing vessels will help to do this. Dual fuel engines and early adoption of new technology will be critical to help us de-risk the fleet to avoid being ‘stuck with’ expensive fuels in limited supply and avoid stranded assets – vessels we have built but can no longer operate.
Designing and building ‘future fuel’ ready vessels and understanding how to retrofit our existing vessels will help to do this. Dual fuel engines and early adoption of new technology will be critical to help us de-risk the fleet to avoid being ‘stuck with’ expensive fuels in limited supply and avoid stranded assets – vessels we have built but can no longer operate.
Methanol and ammonia show promise as future marine fuels, with methanol being easiest to work with, and ammonia challenging from a safety and supply perspective. Additionally, we cannot exclude solutions that support electrification. Green electric is the most efficient ‘carbon neutral’ fuel, but also the hardest to use in terms of operation as it relies on battery technology to improve to really help, right now the energy density for marine batteries is too low, and rapid charging to support our operations hard to install.
Methanol and ammonia show promise as future marine fuels, with methanol being easiest to work with, and ammonia challenging from a safety and supply perspective. Additionally, we cannot exclude solutions that support electrification. Green electric is the most efficient ‘carbon neutral’ fuel, but also the hardest to use in terms of operation as it relies on battery technology to improve to really help, right now the energy density for marine batteries is too low, and rapid charging to support our operations hard to install.
Methanol and ammonia show promise as future marine fuels, with methanol being easiest to work with, and ammonia challenging from a safety and supply perspective. Additionally, we cannot exclude solutions that support electrification. Green electric is the most efficient ‘carbon neutral’ fuel, but also the hardest to use in terms of operation as it relies on battery technology to improve to really help, right now the energy density for marine batteries is too
3.2.2 Green Power, Solar Power and Shore Power initiatives
Fig 5. Future marine fuel pathways over the short, medium and long-term
3.2.2 Green Power, Solar Power and Shore Power initiatives
3.2.2 Green Power, Solar Power and Shore Power initiatives

Over the last four years Svitzer has developed several solar PV installations at offices and workshops around Australia. Beginning with a small 8kW project at a new base in Port Melbourne, we’ve now completed two further projects totalling over 100kW in Brisbane and again in Melbourne, with three additional installations planned over the next twelve months. Shore-side infrastructure represents a significant partnership opportunity across the port eco-system.
Over the last four years Svitzer has developed several solar PV installations at offices and workshops around Australia. Beginning with a small 8kW project at a new base in Port Melbourne, we’ve now completed two further projects totalling over 100kW in Brisbane and again in Melbourne, with three additional installations planned over the next twelve months. Shore-side infrastructure represents a significant partnership opportunity across the port eco-system.
Over the last four years Svitzer has developed several solar PV installations at offices and workshops around Australia. Beginning with a small 8kW project at a new base in Port Melbourne, we’ve now completed two further projects totalling over 100kW in Brisbane and again in Melbourne, with three additional installations planned over the next twelve months. Shore-side infrastructure represents a significant partnership opportunity across the port eco-system.
Conference Paper 125
Fig 5. Future marine fuel pathways over the short, medium and long-term
During 2022 Svitzer generated 141 MWh of renewable electricity, avoiding 112 tonnes of CO2 emissions.
Svitzer is also actively seeking to convert all our existing electricity sources to Green Power. Sixty per cent of our total electricity consumption in Australia is now powered by Green Power today, with a goal of achieving 100 per cent renewable electricity by 2025.
3.3 Equipment
New technologies and equipment will typically have the longest lead time of any fuel saving initiative, and also involve the greatest amount of risk.
As part of our decarbonisation pathway, one question we immediately examined was the ability to ‘build our way to zero’, if such a thing as a zero-emissions tug existed on the market today.
Svitzer currently builds around ten tugs per year as part of continual fleet renewal. That means 180 vessels by 2040 – but that’s less than half our global total, and a long way from having a carbon free fleet.
Besides that, there’s an inherent carbon cost in the vessels we have on the water now. From a total cost of ownership perspective, scrapping or selling a ‘young’ vessel for a ‘zero-emission’ emissions replacement isn’t necessarily the right thing to do.

That means there are no shortcuts we can take. The onus instead lies on us being able to use what we have today and bring zero emissions vessels online when they are available as well as about being innovative with our existing tugs today. Knowledge and being able to identify the right path are essential here, which is why data has become such an important part of our strategy.
Recent innovations promise significant fuel savings
Two recent Svitzer innovations that promise significant fuel savings in the medium term are the SY-Drive and the TRAnsverse tug.
3.3.1 SY-Drive
The SY-Drive Gearbox is an innovation Svitzer has developed in conjunction with Schottel. This provides a linkage between two previously independent drive trains and allows both thrusters to be driven by one engine. This arrangement would typically be used during mobilization and demobilization, allowing a single engine to operate at its most efficient power setting.
Conference Paper 126
Fig 6. Green power via Port of Newcastle 33kW project at Denison St site
The SY-Drive can be incorporated into certain existing tug designs, and relies on readily available, off the shelf components. In addition to a reduction in fuel consumption and emissions the SY-Drive significantly reduces engine hours and associated maintenance costs.
The SY-Drive can be incorporated into certain existing tug designs, and relies on readily available, off the shelf components. In addition to a reduction in fuel consumption and emissions the SY-Drive significantly reduces engine hours and associated maintenance costs.
The SY-Drive can be incorporated into certain existing tug designs, and relies on readily available, off the shelf components. In addition to a reduction in fuel consumption and emissions the SY-Drive significantly reduces engine hours and associated maintenance costs.

3.3.2 TRAnsverse tug
3.3.2 TRAnsverse tug


The TRAnsverse tug features dual thrusters at either end of an omni-directional hull and can generate higher steering forces than most designs of similar dimensions and power. It has the unique ability to push, pull and manoeuvre in all directions, and is scalable and suitable for all types of harbour and terminal towage operations. The Transverse tug was developed by Svitzer in collaboration with Robert Allan Marine Architects, and the first example is expected to be delivered to a harbour towage port in Europe in Q3 2023.
The TRAnsverse tug features dual thrusters at either end of an omni-directional hull and can generate higher steering forces than most designs of similar dimensions and power. It has the unique ability to push, pull and manoeuvre in all directions, and is scalable and suitable for all types of harbour and terminal towage operations. The Transverse tug was developed by Svitzer in collaboration with Robert Allan Marine Architects, and the first example is expected to be delivered to a harbour towage port in Europe in Q3 2023.
The TRAnsverse tug features dual thrusters at either end of an omni-directional hull and can generate higher steering forces than most designs of similar dimensions and power. It has the unique ability to push, pull and manoeuvre in all directions, and is scalable and suitable for all types of harbour and terminal towage operations. The Transverse tug was developed by Svitzer in collaboration with Robert Allan Marine Architects, and the first example is expected to be delivered to a harbour towage port in Europe in Q3 2023.

Simulator testing of the Transverse tug has shown that existing tug masters can quickly adapt to the new configuration, and savings in time and fuel of up to 40 per cent on a typical job may be achievable.
The tug will be built to comply with Tier III emissions regulations and will be the basis for a recently announced carbon neutral methanol fuel cell tug that Svitzer and Maersk are developing together with Robert Allan.
Simulator testing of the Transverse tug has shown that existing tug masters can quickly adapt to the new configuration, and savings in time and fuel of up to 40 per cent on a typical job may be achievable.
Simulator testing of the Transverse tug has shown that existing tug masters can quickly adapt to the new configuration, and savings in time and fuel of up to 40 per cent on a typical job may be achievable.
The tug will be built to comply with Tier III emissions regulations and will be the basis for a recently announced carbon neutral methanol fuel cell tug that Svitzer and Maersk are developing together with Robert Allan.
The tug will be built to comply with Tier III emissions regulations and will be the basis for a recently announced carbon neutral methanol fuel cell tug that Svitzer and Maersk are developing together with Robert Allan.
Conference Paper 127
Fig 7. Sy-Drive gearbox
TECHNICAL PAPER GREENPORT OCEANIA PAGE NO. 07
Fig 8. Renderings of Svitzer’s new TRAnsverse tug design
Fig 7. Sy-Drive gearbox
Commented TECHNICAL PAPER GREENPORT OCEANIA PAGE NO. 07
r’s new TRAnsverse tug design
Fig 7. Sy-Drive gearbox
3.3.2 TRAnsverse tug
Fig 8. Renderings of Svitzer’s new TRAnsverse tug design
Commented
Practically Applying these Lessons in Australia
4. Practically Applying these Lessons in Australia
EcoTow – The Biofuel Opportunity
4.1 EcoTow[IS7] – The Biofuel Opportunity
late 2021 Svitzer trialled the use of 100% Hydrotreated Vegetable Oil (HVO) in five tugs operating in the Medway, just outside of London. Following the success of this trial a further five tugs in London have been converted to HVO, and the Ecotow initiative has now been operating successfully for almost a year.
In late 2021 Svitzer trialled the use of 100% Hydrotreated Vegetable Oil (HVO) in five tugs operating in the Medway, just outside of London. Following the success of this trial a further five tugs in London have been converted to HVO, and the Ecotow initiative has now been operating successfully for almost a year.
The HVO is produced from waste material such as used cooking oil, and in replacing diesel provides a 100% reduction in CO2 emissions on a tank-to-wake basis, or about 90% reduction in total Scope 3 towage emissions. Ecotow enables Svitzer to offer customers an opportunity to reduce their Scope 3 emissions and environmental footprint, either by procuring towage services delivered by tugs fuelled with biofuel, or by ‘insetting’ carbon emissions from tug jobs elsewhere against savings generated in London and Medway.
The HVO is produced from waste material such as used cooking oil, and in replacing diesel provides a 100% reduction in CO2 emissions on a tank-to-wake basis, or about 90% reduction in total Scope 3 towage emissions. Ecotow enables Svitzer to offer customers an opportunity to reduce their Scope 3 emissions and environmental footprint, either by procuring towage services delivered by tugs fuelled with biofuel, or by ‘insetting’ carbon emissions from tug jobs elsewhere against savings generated in London and Medway.
9. EcoTow in operation in the UK
Underpinning Ecotow is the availability of high-quality biofuel at a reasonable cost, which is enabled by the UK’s Renewable Transport Fuel Obligation. Similar schemes operate in the US, Canada and parts of Europe, providing access to biofuels at prices significantly below those prevailing in Australia.
Underpinning Ecotow is the availability of high-quality biofuel at a reasonable cost, which is enabled by the UK’s Renewable Transport Fuel Obligation. Similar schemes operate in the US, Canada and parts of Europe, providing access to biofuels at prices significantly below those prevailing in Australia.
Svitzer is also investigating the use of more conventional biodiesel or FAME which has the potential to deliver similar emissions reductions as HVO. Furthermore, we are working actively with selected partners to develop burgeoning sources of biodiesel from approved feedstocks in doing so creating new supply chains and opportunities ‘closer to home’ in the areas where we work.
Svitzer is also investigating the use of more conventional biodiesel or FAME which has the potential to deliver similar emissions reductions as HVO. Furthermore, we are working actively with selected partners develop burgeoning sources of biodiesel from approved feedstocks in doing so creating new supply chains and opportunities ‘closer to home’ in the areas where we work.
Biofuels hold great promise for towage, and they underpin our already successful EcoTow programme, where we can support the decarbonisation of our customers’ operations by driving change within our own fleet. It also represents the ‘readiest’ of the transitional fuels on the market.
Biofuels hold great promise for towage, and they underpin our already successful EcoTow programme, where we can support the decarbonisation of our customers’ operations by driving change within our own fleet. It also represents the ‘readiest’ of the transitional fuels on the market.
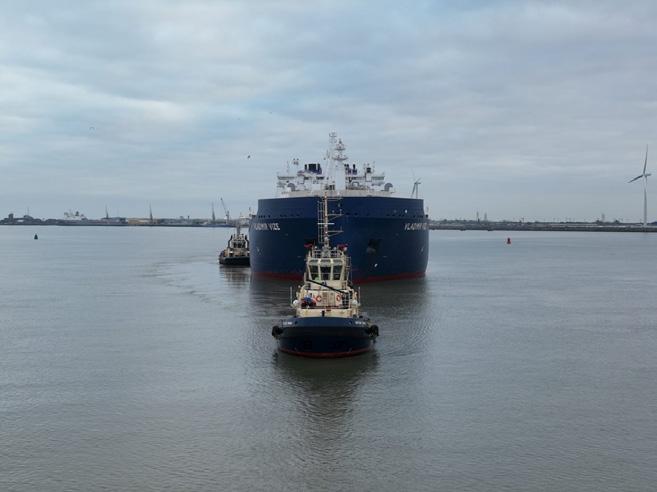
However, the ‘readiness’ of the Australian market to support this initiative is challenged and costs and supply of biodiesel is prohibitive. Competitor countries (such as the US, Canada, European nations, Singapore and New Zealand) have generous biodiesel incentives to encourage fuel transition. Work across industry partners and with government is therefore essential to making biofuel operations feasible in Australia.
However, the ‘readiness’ of the Australian market to support this initiative is challenged and costs and supply of biodiesel is prohibitive. Competitor countries (such as the US, Canada, European nations, Singapore and New Zealand) have generous biodiesel incentives to encourage fuel transition. Work across industry partners and with government is therefore essential to making biofuel operations feasible in Australia
Methanol fuelled hybrid tug will be basis for new tugs
Over the last five years there has been considerable research into alternative fuels in the marine sector, and methanol is emerging as the preferred solution for towage. In late 2021 Svitzer announced a project in collaboration with Maersk and Robert Allan to design the world’s first fuel cell tug for harbour operations.

Conference Paper 128
Fig
Fig 9. EcoTow in operation in the UK.
4.2 Methanol fuelled hybrid tug will be basis for new tugs
Over the last five years there has been considerable research into alternative fuels in the marine sector, and methanol is emerging as the preferred solution for towage. In late 2021 Svitzer announced a project in collaboration with Maersk and Robert Allan to design the world’s first fuel cell tug for harbour operations.
The tug will have a hybrid electrical propulsion system with the capacity to deliver a specific amount of sustained power pull using fuel cells alone, and additional power available from batteries during the short but frequent peaks that characterise towage. The fuel cells may be used to charge the batteries when the tug is mobilising or at berth, minimising the need for expensive shore side charging facilities. The combination of fuels cells and batteries will deliver a self-sustained tug with longer endurance and with less operational constraints than a pure battery powered vessel.
The tug will have a hybrid electrical propulsion system with the capacity to deliver a specific amount of sustained power pull using fuel cells alone, and additional power available from batteries during the short but frequent peaks that characterise towage. The fuel cells may be used to charge the batteries when the tug is mobilising or at berth, minimising the need for expensive shore side charging facilities. The combination of fuels cells and batteries will deliver a self-sustained tug with longer endurance and with less operational constraints than a pure battery powered vessel.
Fig 10. Methanol fuel cell


The fact that Svitzer has chosen methanol as the preferred solution in this instance does not mean that other fuels may not be suitable for other marine applications, nor that methanol will always be the preferred solution for towage. As renewable fuel technologies develop and reliable supply, distribution and storage infrastructure is established, ammonia, hydrogen or another alternative energy source may prove more viable.
The fact that Svitzer has chosen methanol as the preferred solution in this instance does not mean that other fuels may not be suitable for other marine applications, nor that methanol will always be the preferred solution for towage. As renewable fuel technologies develop and reliable supply, distribution and storage infrastructure is established, ammonia, hydrogen or another alternative energy source may prove more viable.
This approach allows us to explore new technology whilst establishing ‘design rules’ to ensure that as we renew our fleet, the vessels we put on the water tomorrow are as efficient as possible and ready for the future.
This approach allows us to explore new technology whilst establishing ‘design rules’ to ensure that as we renew our fleet, the vessels we put on the water tomorrow are as efficient as possible and ready for the future.
5. Accelerating Decarbonisation – A Partnership Approach
5. Accelerating Decarbonisation – A Partnership Approach
Decarbonising towage – let alone all of shipping – will require new partnerships both within the sector as well as drawing on lessons from other industries that are experiencing the same transition.
Decarbonising towage – let alone all of shipping – will require new partnerships both within the sector as well as drawing on lessons from other industries that are experiencing the same transition.
In general, the equipment front is where collaboration between parties will be most impactful. Partnerships will be important to pioneering and scaling the towage technologies of tomorrow, investing in the right fuel and energy mix (and supporting infrastructure), including both bridging and transition fuels and the fuels of the future.
In general, the equipment front is where collaboration between parties will be most impactful. Partnerships will be important to pioneering and scaling the towage technologies of tomorrow, investing in the right fuel and energy mix (and supporting infrastructure), including both bridging and transition fuels and the fuels of the future.
Methanol, hydrogen, and ammonia all hold great promise as future marine fuels. But all of these solutions require developments in infrastructure, production and, importantly, the standards governing their safe supply before they will be suited to towage.
Methanol, hydrogen, and ammonia all hold great promise as future marine fuels. But all of these solutions require developments in infrastructure, production and, importantly, the standards governing their safe supply before they will be suited to towage.
The benefit of working across the port eco-system in delivering these new technologies is the replicability of this technology for other purposes; and the sharing of investment and risk in both
The benefit of working across the port eco-system in delivering these new technologies is the replicability of this technology for other purposes; and the sharing of investment and risk in both selecting new technologies and the associated infrastructure costs, landside development and approvals Shared advocacy is also essential to ensure supporting regulatory support and potential co-investment or decarbonisation incentives (e.g. carbon credits) from governments.
Other partners such as those in the technology and oil and gas sectors also represent partners with potential significant mutual benefits.
Conference Paper 129
Fig 10. Methanol fuel cell
selecting new technologies and the associated infrastructure costs, landside development and approvals. Shared advocacy is also essential to ensure supporting regulatory support and potential co-investment or decarbonisation incentives (e.g. carbon credits) from governments.
Other partners such as those in the technology and oil and gas sectors also represent partners with potential significant mutual benefits.
6. Conclusion
In summary:
5 Efforts to deliver decarbonisation are well-advanced and there are clear regulatory, commercial and social drivers of change. Svitzer’s own efforts are illustrative of the potential but also real change in place today that can be replicated across the port eco-system.
5 These drivers are only becoming more significant as magnified by current examples of the challenges around the cost and reliability of traditional (fossil fuel) energy supply today, investor and capital market sentiment, future regulatory hurdles, the growing price of carbon and emission charges and exposure to over-reliance on carbon offsetting.
5 The shipping industry and port eco-systems are advanced in its targets and exploration on ways to decarbonise, but greater partnership is needed to accelerate this change.
5 Australian ports have already demonstrated ability to collaborate and deliver on environmental initiatives, such as:
5 Renewable energy supply, electrification and reduction in power consumption
5 Improving water quality and reducing water consumption
5 Improvements to air quality and reductions of noise emissions
5 Enhanced waste management, re-use and recycling.
5 We are entering a phase of significant technology change, particularly as it relates to future fuel selection and utilisation – this will require multiple parties to collaborate and implement but also to share the risk and investment across potentially multiple new future fuel choices.
5 Governments are essential to supporting this work and ensuring the right investment, policy and regulatory settings are in place to deliver on these opportunities.
5 This must include common state and federal policy, regulation and targets; investment support (for technology development, fuel supply and capital infrastructure); incentives to support transition away from conventional fuels and to new fuel sources such as biofuel and methanol.
5 Shared advocacy and agreed fuel transition pathways by the maritime sector are also essential achieving this support, investment and policy environment.
Conference Paper 130
Regional Maritime Commercial Markets Manager, Lloyd’s Register
BIOGRAPHY
Taylor has worked with Lloyd’s Register for 10 years. Holding both technical and commercial roles across Europe, the Middle East and most recently Singapore. In his time in LR Taylor has developed an in depth understanding of Maritime regulation and gained experience working with large organisations though multifunctional advisory projects. In his current role as Regional Manager for Maritime Commercial Markets, Taylor is responsible for increasing the support Lloyd’s Register provides to Charterers, Financiers and Insurers, as part of the Maritime Performance Services business in South Asia Middle East and Africa.

Speaker
TAYLOR WAMBERG
131
Identifying and Implementing Green Corridors in Shipping and Logistics
INTRODUCTION
In shipping’s quest to attain net-zero carbon emissions by 2050, the uptake of zero-carbon fuels is essential. However, zero-carbon fuels are currently not cost-competitive with conventional fossil-based fuels. Production and supply of low-carbon fuels for shipping requires substantial capital investment and relatively high operational costs, with the end costs per unit of fuel being significantly greater than the fossil fuel equivalents. The scale of the global decarbonisation of shipping is daunting from all aspects but in particular, the investment and commitment required from ports and infrastructure.
Therefore, to drive the transition from fossil fuels to zero-carbon fuels, investment readiness levels (IRL) need to be increased. The first movers’ framework will kickstart a multi-stakeholder collaboration across the supply chain to build a robust business case for the use of zero-carbon fuels in shipping. The framework will be implemented via green corridors, as smaller-scale commercial trials that will eventually scale up into an industry-wide transition toward a net-zero future. This paper outlines the application of such an approach to one green corridor. Aspects of this approach can also be repeated for port authorities as they aim to not only facilitate but contribute to accelerated greener shipping. The demonstrable overspill effect of green corridors further highlights the necessity of localised but entire supply chain collaboration in establishing pilot projects.
DECARBONISING SHIPPING
The International Maritime Organisation (IMO) currently aims to cut greenhouse gas (GHG) emissions from international shipping by at least 50%, as compared to 2008 levels, by 2050. A more ambitious goal of attaining net-zero by 2050 is being considered by individual members states and subject to MEPC discussions, which is more closely aligned with the objectives of the Paris agreement and the commitments of many governments. To achieve this, zeroemissions vessels (ZEVs) should contribute 5% of fuel demand globally by 2030.
The responsibility of decarbonising shipping does not just lie with ship owners. The future owners of ZEVs need: Charterers, willing to employ their ships; financiers willing to finance new and novel designs; Insurers, willing to provide coverage to new technologies; a bunker infrastructure for their chosen fuel; and ports willing to accept vessels running on future fuels and provide the facilities to necessitate new ZEVs. This leads to a diverse group of stakeholders, required to take and share the risk to a common decarbonisation goal.
Zero-Carbon Fuel Costs
There are already engines, tanks and other machinery found in a vessel designed for zerocarbon fuels. However, capital expenditure is not the only concern for shipowners. Rather, the increase in voyage cost due to costly zero-carbon fuels is a crucial point of concern. Further the capital investment required for land infrastructure and production facilities is estimated to be in the trillions globally.
Conference Paper
132
Cross-Supply-Chain Collaboration
The supply chain for zero-carbon fuels is rife with uncertainty due to the lack of clear sources of supply and demand, holding back development. Therefore, collaboration between stakeholders across the supply chain to stimulate constructive commercial deals is necessary to accelerate the uptake of zero-carbon fuels.
attract investment to construct the required infrastructure and systems that will eventually be scaled up to meet growing demand This is a crucial step towards attaining a cost competitive solution to decarbonise
From production, bunkering to usage of zero-carbon fuels, joint commitment from stakeholders throughout the supply chain is needed to ascertain demand for the fuels and attract investment to construct the required infrastructure and systems that will eventually be scaled up to meet growing demand. This is a crucial step towards attaining a cost competitive solution to decarbonise.
process, such as the scale of investment required, the likely location of fuel production and the outlook for the existing fleet.
THE FIRST MOVERS FRAMEWORK The Need for First Movers
Incentivising First Movers
THE FIRST MOVERS FRAMEWORK
Based on previous work from the Lloyd’s Register Maritime Decarbonisation Hub’s Zero-Carbon Fuel Monitor, most zero-carbon fuels face the problem of low investment readiness levels (IRL) One of the main causes for this is the uncertainty present in the nascent fuels, resulting in a huge price disparity between conventional marine fossilbased fuels Moreover, there is no strong business case for wide-scale usage of zero-carbon fuels due to an underdeveloped supply chain, as well as concerns about technology and safety Without urgent push factors like government regulations, stakeholders are unable to invest deeply into a zero-carbon future Thus, we need first movers to overcome this inertia and kickstart a multistakeholder collaborative strategy, to raise the IRL of zerocarbon fuels.
The Need for First Movers
Based on previous work from the Lloyd’s Register Maritime Decarbonisation Hub’s Zero-Carbon Fuel Monitor, most zero-carbon fuels face the problem of low investment readiness levels (IRL). One of the main causes for this is the uncertainty present in the nascent fuels, resulting in a huge price disparity between conventional marine fossil-based fuels. Moreover, there is no strong business case for wide-scale usage of zero-carbon fuels due to an underdeveloped supply chain, as well as concerns about technology and safety. Without urgent push factors like government regulations, stakeholders are unable to invest deeply into a zero-carbon future. Thus, we need first movers to overcome this inertia and kickstart a multi-stakeholder collaborative strategy, to raise the IRL of zero-carbon fuels.
First-mover companies will pioneer the production and usage of zero-carbon fuels. They may be exposed to more risks and costs initially, but equally, they can gain a competitive advantage as early birds in the decarbonisation movement, allowing them to capitalise on new market demand, and gain insight in terms of technical development and financial incentives
The First Movers Framework involves such companies across the supply chain, who will work together as members of a green corridor to trial the use of zero-carbon fuels. Subsequently, evaluation of the green corridor will allow stakeholders to glean valuable insights and understand the risks and complexities of the supply chain structure. This will invite investment that paves way for expansion of the zero-carbon fuel supply chain and other stakeholders can ease into the fuel transition.
So far, generic techno-economic analysis for zero-carbon vessels and fuel supply infrastructure produce high level findings that do not immediately lend themselves to concrete action plans. Instead, a detailed analysis for a specific and scalable application may provide a stronger business case for investors in the shorter term. Having a specific case study with a targeted market segment will expound on the short-term and long-term, internal and external risks that will paint a clearer picture for investors and incentivise them to invest.
So far, generic techno-economic analysis for zero-carbon vessels and fuel supply infrastructure produce high level findings that do not immediately lend themselves to concrete action plans. Instead, a detailed analysis for a specific and scalable application may provide a stronger business case for investors in the shorter term. Having a specific case study with a targeted market segment will expound on the short-term and long-term, internal and external risks that will paint a clearer picture for investors and incentivise them to invest.
Therefore the Lloyd’s Register First Movers framework has been designed as a platform for the development of a green corridor This model allows for deeper understanding of how decarbonisation can be achieved for the fleet and what are the challenges and risks involved in the decarbonisation
THE SILK ALLIANCE
In line with IMO’s decarbonisation goals, Lloyd’s Register’s Maritime Decarbonisation Hub (MDH) has launched the Silk Alliance to establish an inter-Asia green corridor cluster The Silk Alliance aims to develop a long-term, fleetspecific fuel transition strategy that will be applied to the green corridor. It consists of a growing team of 11 prominent cross-supply chain stakeholders in the shipping industry, including shipowners, shipyards and banks The alliance will develop a decarbonisation roadmap and strategy based upon the First Movers Framework, culminating in a green corridor, to accelerate decarbonisation in shipping.
Therefore the Lloyd’s Register First Movers framework has been designed as a platform for the development of a green corridor. This model allows for deeper understanding of how decarbonisation can be achieved for the fleet and what are the challenges and risks involved in the decarbonisation process, such as the scale of investment required, the likely location of fuel production and the outlook for the existing fleet.

Conference Paper 133
INMARCO 2022 Balani Page 2
Figure 1: First Movers Framework process First Movers Framework process
Incentivising First Movers
First-mover companies will pioneer the production and usage of zero-carbon fuels. They may be exposed to more risks and costs initially, but equally, they can gain a competitive advantage as early birds in the decarbonisation movement, allowing them to capitalise on new market demand, and gain insight in terms of technical development and financial incentives.
The First Movers Framework involves such companies across the supply chain, who will work together as members of a green corridor to trial the use of zero-carbon fuels. Subsequently, evaluation of the green corridor will allow stakeholders to glean valuable insights and understand the risks and complexities of the supply chain structure. This will invite investment that paves way for expansion of the zero-carbon fuel supply chain and other stakeholders can ease into the fuel transition.
THE SILK ALLIANCE
In line with IMO’s decarbonisation goals, Lloyd’s Register’s Maritime Decarbonisation Hub (MDH) has launched the Silk Alliance to establish an inter-Asia green corridor cluster. The Silk Alliance aims to develop a long-term, fleet-specific fuel transition strategy that will be applied to the green corridor. It consists of a growing team of 11 prominent cross-supply chain stakeholders in the shipping industry, including shipowners, shipyards and banks. The alliance will develop a decarbonisation roadmap and strategy based upon the First Movers Framework, culminating in a green corridor, to accelerate decarbonisation in shipping.
Through setting up a regional green corridor cluster, the Silk Alliance would gain knowledge and insights useful for the shipping industry. From there, it would be able to accelerate actions that will build industry-wide confidence in investing in and utilising zero-carbon fuels.
Fleet Selection
Containerships were decided as the candidate fleet for the Silk Alliance green corridor as they are typically used in the transportation of manufactured goods and are more strongly affected by downstream influences and consumer pressure to decarbonise. Therefore, container shipowners are more incentivised to prepare their fleet for decarbonisation. Moreover, end consumers purchasing manufactured goods are likely more willing to absorb the additional costs arising from the use of zero-carbon fuels. Regular trade routes and patterns also lend themselves to predictable bunkering trends, further lowering the investment risk in infrastructure.
Route Selection
The Silk Alliance has selected Singapore as a main port in the green corridor cluster, alongside other ports in the region, forming an inter-Asia route. Singapore, home to a key container trans-shipment hub, is an important port of call for many trade routes in the region. To develop a robust green corridor cluster, selecting a key port like Singapore is a strategic choice that can leverage on Singapore’s position to develop extensive bunkering and feedering infrastructure for zero-carbon fuels.
The Silk Alliance is now in the progress of charting potential trade routes for the green corridor cluster by working with other nearby ports, such as the port of Hong Kong.
THE PROCESS
The Silk Alliance adopts a systematic approach to developing a decarbonisation plan. There are three main steps in the Silk Alliance process – system thinking, foresight and finally, cocreation (see Fig. 1).
Conference Paper 134
Fleet Selection
THE PROCESS
The Silk Alliance adopts a systematic approach to developing a decarbonisation plan. There are three main steps in the Silk Alliance process – system thinking, foresight and finally, co-creation (see Fig. 1).

Identifying Opportunities and Threats
Identifying Opportunities and Threats
Understanding the challenges faced by the shipping industry (see Fig. 2) is the basis of the decarbonisation plan. For most stakeholders across the shipping supply chain, the key issues lie in the uncertainty and risk of using zero-carbon fuels, such as an uncertain future regulatory landscape, high costs involved in switching over and investing in zero-carbon fuel technology, and unguaranteed availability of the fuel.
Containerships were decided as the candidate fleet for the Silk Alliance green corridor as they are typically used in the transportation of manufactured goods and are more strongly affected by downstream influences and consumer pressure to decarbonise Therefore, container shipowners are more incentivised to prepare their fleet for decarbonisation. Moreover, end consumers purchasing manufactured goods are likely more willing to absorb the additional costs arising from the use of zero-carbon fuels. Regular trade routes and patterns also lend themselves to predictable bunkering trends, further lowering the investment risk in infrastructure.
Understanding the challenges faced by the shipping industry (see Fig. 2) is the basis of the decarbonisation plan. For most stakeholders across the shipping supply chain, the key issues lie in the uncertainty and risk of using zero-carbon fuels, such as an uncertain future regulatory landscape, high costs involved in switching over and investing in zero-carbon fuel technology, and unguaranteed availability of the fuel.
Route Selection
Alignment and Commitment
Alignment and Commitment
Silk Alliance members need to be aligned and committed to the alliance, addressing the need for co-sharing of the risks involved in transitioning to zero-carbon fuels as first movers.
The Silk Alliance has selected Singapore as a main port in the green corridor cluster, alongside other ports in the region, forming an inter-Asia route.
Singapore, home to a key container trans-shipment hub, is an important port of call for many trade routes in the region. To develop a robust green corridor cluster, selecting a key port like Singapore is a strategic choice that can leverage on Singapore’s position to develop extensive bunkering and feedering infrastructure for zero-carbon fuels.
Silk Alliance members need to be aligned and committed to the alliance, addressing the need for co-sharing of the risks involved in transitioning to zero-carbon fuels as first movers.
Individual members need to be unified and work towards the same goals. In addition, the successful inception of the green corridor hinges on members delivering actions that mediate risks across the wider supply chain.
Individual members need to be unified and work towards the same goals. In addition, the successful inception of the green corridor hinges on members delivering actions that mediate risks across the wider supply chain.
Through a bespoke process, Silk Alliance members are aligned to form a consistent strategy. By creating a shared understanding of the problem, the Alliance enables commitment in the form of tangible investments and actions from each member that can pilot a green corridor.
Scenario-based Approach
The Silk Alliance applies a “scenario driven road-mapping” approach to direct the alliance towards common goals and a collaboratively derived decarbonisation plan. Using the results of workshop discussions and information provided by members, the MDH has built a data-driven model. By feeding the model various scenarios of future fuel transitions of the fleet, it creates visibility on key metrics across the different transition strategies and allows a comparison to be drawn across multiple criteria. These outputs will guide the Silk Alliance on how to modify the existing fleet and infrastructure to transition into zero-carbon fuels from now to 2050.
Action Plan
An action plan will be developed that involves long-term and short-term strategies. At this stage, it is especially important that the risks are well-managed for the members involved in execution.
Conference Paper 135
INMARCO 2022
Page 3 in investing in and utilising zero-carbon fuels.
Balani
Figure 2: Shipping supply chain challenges Shipping supply chain challenges
FURTHER WORK
As with all green corridor projects globally, the Silk Alliance still has gaps to fill. From existing discussion, zero-carbon fuel supply is a critical point of concern for the industry, which in turn is a complex output of economic, technical and safety considerations. Amongst this, questions regarding the definitions and thresholds
used to define what a green or zero-carbon fuel is have emerged. As its critically important for the entire industry to have a shared understanding of what these fuels may be, this work continues to be undertaken not only by regulatory bodies such as the IMO, but also with a steer from private industry.
SCALABILITY
Although the development of a decarbonisation plan will be based on a specific fleet, for a more versatile business case, it must also be designed to be highly scalable, across different segments of shipping, routes and timeframes.
As the demand for zero-carbon fuels will grow, renewable energy sources will become increasingly in demand. This may improve the cost-competitiveness and availability of zerocarbon fuels, ultimately increasing their uptake on a global scale, although it also may work in the opposite way in the face of increased competition for finite fuels across other transport sectors. It is therefore necessary to pre-empt the growth of the shipping fleet and to adequately plan for the ramp up in demand.
TRANSFERABILITY
The approach applied to a green corridor can be scaled down to address individual ports or clusters of ports when looking at providing green port solutions. Specific port projects may already have a lesser number of variables for example a fuel may have been selected or constraints on land or through national regulation may settle certain decisions. However, the need to understand the shipping demand today and for the future along with the need to work in a more collaborative way with a variety of stakeholders
Decarbonising Port infrastructure while being one of the most costly aspects of the Maritime energy transition, creates opportunities to for local economies in addition to accelerating shipping decarbonisation journey.
CONCLUSION
To achieve net-zero by 2050, shipping needs to address the key remaining challenges and overcome the inertia to decarbonise. The scale of the Global challenge is significant challenge. The Silk Alliance is spearheading decarbonisation efforts in the shipping industry by applying the First Movers Framework to an inter-Asia green corridor. The green corridor is implemented in hopes of building wider industry confidence and increase investment readiness for the transition to zero-carbon fuels, such that the collaboratively derived fuel transition strategy can be scaled up, expanding to beyond the specific fleet, and adopted by the global fleet by 2050. Adopting a similar approach to the Silk alliance to other projects will allow groups of stake holders including ports to address the challenges associated with moving to less carbon intensive shipping. Spill over from such projects has the potential to benefit a wider number of beneficiaries.
Conference Paper 136
REFERENCES
“Initial IMO GHG Strategy”. International Maritime Organisation, n.d., imo.org/en/ MediaCentre/HotTopics/Pages/Reducing-greenhouse-gas-emissions-from-ships.aspx.
First movers in shipping’s decarbonisation. The Lloyd’s Register Maritime Decarbonisation Hub, 2021.
“Port energy supply for green shipping corridors” Arup, The resilience shift & Lloyd’s Register Decarbonisation Hub
Conference Paper 137


to free digital editions of our suite of publications for the passenger shipping industry www.cruiseandferry.net/magazines/subscriptions Subscribe
Maritime Projects by 2050
SESSION 5 STREAM 2 139

Moderator
140
MATT JOHNSTON Manager Environment and Strategy, Australian Maritime Safety Authority
Speaker
141
MATT JOHNSTON Manager Environment and Strategy, Australian Maritime Safety Authority
Maritime decarbonisation –a regulator’s perspective
Why decarbonise shipping?
To contribute to global efforts to combat climate change and its impacts
UN Sustainable Development Goal 13
5 80 -90% of global trade enabled by international shipping
5 Shipping responsible for ~3% of global anthropogenic GHG emissions and ~9% of global emissions associated with the transport sector
5 99% of energy demands currently met by fossils fuels
5 Without action, emissions wouldgrow by 50%-250% by 2050
Paris Climate Change Agreement
5 Aims to keep global temperature rise this century well below 2 degrees Celsius above pre-industrial levels
5 And pursue efforts to limit the temperature increase even further to 1.5 degrees Celsius
Initial IMO Strategy on Reduction of GHG Emissions
“IMO remains committed to reducing GHG emissions from international shipping and, as a matter of urgency, aims to phase them out as soon as possible in this century.”
5 Adopted in 2018
5 Aims to reduce international shipping emissions:
5 Total of emissions by at least 50% by 2050
5 Carbon intensity reduced by an average of at least 40% by 2030*
5 Carbon intensity reduced by an average of at least by 70% by 2050*
5 Refers to “a pathway of CO2emissions reduction consistent with the Paris Agreement temperature goals”
5 Revised Strategy expected to be adopted in July 2023
*compared to 2008.
Conference Paper
142
Previous requirements
5 Energy Efficiency Design Index (EEDI)
5 Ship Energy Efficiency Management Plan (SEEMP)
Additional requirements - short-term GHG reduction measure
5 Energy Efficiency Existing Ship Index (EEXI)
5 Carbon Intensity Indicator (CII) and rating system
5 Enhanced SEEMP
5 Goal-based measure
5 Entered into force on 1 January 2023
5 For existing in-service ships on international voyages
5 To be reviewed by 1 January 2026

5 Implemented in Australia through Marine Order 97
Short-term GHG measure - EEXI
Energy Efficiency Existing Ship Index (EEXI)
5 Technical design measure –changes to improve energy efficiency of existing ships
5 One-time certification for existing ships ≥400 GT
How to meet required EEXI?
5 The MARPOL regulations do not prescribe the improvement methods to be used.

5 Improvements to the attained EEXI can be achieved by:
5 Engine/shaft power limitation
5 Propulsion optimisation
5 Bow and/or propeller modifications
5 Antifouling coatings
5 Use of alternative fuels
5 Engine de-rating
5 Installation of energy saving devices and technologies (egsolar panels, rotor sails)
Short-term GHG measure - CII
Carbon Intensity Indicator (CII)
5 CII addresses actual emissions in operation.
5 The CII provides ship* operators with the factor by which they must reduce carbon emissions annually to comply with regulations and ensure continuous improvement.
5 A CII rating (from A to E) will be given to the vessel based on the annual carbon intensity result.
* 5 000 GT and above
Conference Paper 143
How to meet the required CII?
5 Based directly on the fuel consumption, which is influenced by how a specific ship is operated.


5 Improvements to the CII can be achieved by:
5 Improved voyage planning / weather routeing
5 Speed optimisation / port call optimisation
5 Alternative fuel use
5 Onshore power supply
5 Hull maintenance -cleaning of biofouling/marine growth

Mid- and long-term GHG reduction measures
To be finalised and agreed by the IMO between 2023–30 and beyond 2030
Measures may include:
5 alternative low-and zero-carbon fuels
5 fuel standards
5 alternative propulsion systems and aids
5 market-based measures that incentivise GHG emission reduction (ielevies, carbon pricing)
5 further technical and operational energy efficiency measures for both new and existing ships

Conference Paper 144
Role of ports in decarbonisation of shipping

Can you have green ports without green ships?
5 Onshore power supply
5 Port call optimisation / vessel arrival systems
5 Infrastructure for safe handing and bunkering of low-and zero-carbon fuels
5 Incentive schemes that address GHG emissions and sustainability of shipping


5 Resolution MEPC.323(74) revised at MEPC 79 in December 2022 to include routebased actions (green shipping corridors)
Vessel Arrival Systems (VAS)
5 Reduces number of ships waiting at anchor by assigning a ‘place in the queue’ to ships en route and updating them on optimum arrival times
5 Promotes navigation at reduced speeds
5 reduces risk of collision and grounding
5 Less vessels at anchorage and reduced waiting times can reduce:
5 risk of groundings
5 vcollision risk for marine species
5 anchor damage
5 discharges –sewage, greywater, air emissions
Conference Paper 145
DNV-GL study of Newcastle VAS
Hypothesis –A VAS that enables arriving vessels to manage their voyage speed to minimise time at anchorage/berth results in less GHG emissions from ships
Pre-vs post-VAS implementation
5 time at berth was 53% less post-VAS;
5 average voyage speed was 23% lower;
5 Fuel consumption/GHG emissions were 18% lower (entire voyage)
Newcastle vs Port Kembla
5 29% emission saving per vessel at anchorage at Newcastle
5 52% emission saving at berth per vessel at Newcastle 13% GHG emission reduction for Newcastle (entire voyage)

Conference Paper 146
MARGARET BARBOUTTIS Policy and Operations Director, Ports Australia


BIOGRAPHY
Holds an ever keen interest in sustainability, supply chains and insurance; and welcomes any opportunity to discuss these subjects. In her current role, Margaret manages policy and industry guidelines development at Ports Australia, with present organisational foci being climate change, critical infrastructure, and digital twins. She also manages Ports Australia’s port communities of practice which examine aspects from logistics, to operations, to engineering and asset management to sustainability, environment and planning. Her background is in policy and project development for government health agencies, and she holds a Master of Strategic Supply Chain Management.
Speaker
147
Supporting Ports into the Future


Planning for the Future
WHERE HAVE WE COME FROM?
WHERE ARE WE NOW? WHERE DO WE WANT TO GO? •
WHERE ARE WE NOW? g
Where are we now?
Conference Paper
148
g
Where do we want to go?
Support Australian ports to be sustainable and efficient gateways to international and national trade.
Resilience and sustainability
5 Operations
5 Technology
5 Environment
5 Planning
5 Asset management
5 People and skills
How are we going to get there?
Governement and regulatory
Resilience and sustainability
Engagement and reputation
Supply chain efficiency
Resilience and sustainability: recent project
Resources

5 Environment focused status reports (Jan 2023)

5 Australian Port Marine Safety Management Guidelines (Dec 2022)

5 Wharf Structures Condition Assessment Manual (Nov 2022)
5 Digital Twin Discussion Paper (Nov 2022)
5 Port Sustainability Strategy Development Guide (Jun 2020)
5 Ports and a Sustainable Australia
Networks and shared learnings
5 Improving port sector networks across the Pacific region
5 Sustainability as an aspect all working groups consider
5 Ports Australia Sustainability Hub

Conference Paper 149
Aus port Marine Safety Management Guidelines


Conference Paper 150
Wharf structures condition assessment manual
Digital twin discussion paper
Environment focused status reports
Offshore power supply
Environmental shipping incentive schemes
Noise from vessels
Exhaust gas cleaning systems
Resilience and sustainability: looking forward
Climate change and decarbonisation
5 Greenhouse gas emission scope boundaries
5 Decarbonisation
5 Climate change risks
Noise
5 Landside and vessel noise guidelines

Cybersecurity
5 Maturity and preparedness including to align with critical infrastructure reforms
Existing working groups remain critically important
Conference Paper 151
ERANDA KOTELAWALA Chief Executive Officer, Solomon Islands Ports Authority
BIOGRAPHY
Eranda Kotelawala was appointed Chief Executive Officer of Solomon Islands Ports Authority in February 2017. Prior to that, he was the COO of Fiji Ports Corporation Limited managing five major ports of entry into Fiji. Eranda brings 23 years of management experience predominantly in shipping and several other industries in in Sri Lanka, United Kingdom, South Africa, Sultanate of Oman, and Singapore.
He has consulted on Business Process Re-engineering Projects in major Port projects in the South Pacific, the Gulf region and South Africa. Eranda holds a Master’s Degree in Management from Aberdeen Business School, and further specialized in Business Process Re-Engineering. He is a Chartered Fellow of Chartered Institute of Logistics and Transport UK, Fellow of Chartered Management Institute UK, Associate Fellow of The Nautical Institute UK, He is also a full member of Institute of Management Consultants Australia.
Speaker 152
Pathway to Sustainable Ports –A Global Approach
In recent years, our world has experienced an unprecedented environmental and economic challenges due to climate change. This in no difference to the multifaceted challenges faced by ports globally in its long-term sustainability. The impact of climate change is inevitable in ports and its merely a question of how fast we should respond to be able to be sustainable in future.
A pathway to sustainable ports can only be paved with a much deeper respect to the environment we live in and operate. The intrinsic connection to our environment and nature should be one of the priorities in our port operations and future sustainability without any further negligence or compromise. It is important to be more pro-active than reactive to circumstances of climate change and it has now become a race against time. Better and faster we respond, greater the benefits the future would hold for our ports.
We should endeavour for a global unified approach to implement better environmentally friendly practices in ports and the wider community irrespective of the volume, size of port and geography as sustainability is a widespread global challenge.
A global focus on emission reduction from port operations, improving air quality, investing in zero-emission technologies, using cleaner fuels, better waste management and reduction practices are crucial elements in reducing the impact on our environment.
Sustainability of ports would never be complete and fitting in the absence of our connection to the community, our values and diversity of human resources. Inclusion and diversity are compelling and inextricable pieces of the algorithm for creating the sustainability we envision for the future.
Let’s make our ports sustainable through a collaborative approach!
Conference Paper
153
HARIS ZOGRAFAKIS Partner, Stephenson Harwood LLP Co-ordinator of the Blue Visby Consortium

BIOGRAPHY
Haris heads the firm’s commodities practice and for over 25 years has dealt with all aspects of shipping and international maritime trade. He has acted for clients ranging from mining companies and oil majors to shipowners and their insurers, state-owned oil companies, independent trading houses, chemical companies, banks and refineries from Europe, North and South America, Australia, the Middle East, Africa and Asia.
Speaker
154
The Blue Visby Solution – A multilateral platform for reducing shipping GHG emissions through eradicating “Sail Fast Then Wait”
The carbon inefficiency of Sail Fast, Then Wait
1. The common thread running through the fragmented world of international maritime trade and supply chains is that the ocean journeys of cargo ships are not systemically optimized. While there has been great progress in the last 30 years in satellite coverage, communications, weather forecasting, and data processing, all of which have enabled the development of sophisticated and effective weather routing and voyage planning systems, this has only led to the optimization of the voyages of individual ships. Optimization of cargo transport as a system remains elusive and those outside the industry are often surprised to hear that there is no equivalent to “airspace management systems” for cargo ships in the world’s oceans.
2. This absence of systemic optimization means that cargo vessels follow the same operational model since the age of sail: each vessel departs towards its destination at its own optimal speed (often, the service speed, which is very similar to that of every other vessel in the same ship type), and without regard for other vessels or for the conditions at the destination. This operational model, known as “Sail Fast, Then Wait” (“SFTW”) or “Rush-to-Wait”, has recently attracted the public’s attention: the congestion outside Suez increased day-by-day as a result of the grounding in Suez of the vessel Ever Given; another example is the congestion outside various ports in China and the USA as a result of supply chain bottlenecks ashore. In both cases, congestion seemed to increase without any apparent co-ordination attempt amongst those ships to adjust their speed and adapt to the changing circumstances.
3. This inefficiency has been tolerated for various reasons: the cost of wasted fuel is a fraction of the value of the cargo on board; the uncertainties at sea discouraged long-term voyage planning; emissions has not been a concern until recently; and, perhaps above all, the contractual architecture of maritime trade gave rise to “split incentives” or a type of “agency problem” amongst the various industry participants.
The contractual foundations of SFTW
4. The operational practice of SFTW is underpinned by the contractual architecture of international maritime trade in various ways:-
a. Bulk cargo vessels perform voyages at the instruction of their charterers, who have the right to give orders as to the commercial employment of the vessels. The relevant contracts (voyage and time charterparties) contain speed warranties and the obligation for the vessel to sail with utmost dispatch, or similar.
b. Many of those charterparties contain requirements for the vessel’s arrival at a loading port by a particular date (“laycan”), or else the charterer has the option to cancel the charterparty.
c. In some types of charterparties (voyage charterparties), the vessel’s prompt arrival at the port of destination triggers financial obligations in the form of “demurrage”, which
Conference Paper
155
is legally defined as ”liquidated damages for delay” but, from a financial perspective, is an income stream for the shipowners.
d. In other types of charterparties (time charterparties), the fuel cost falls on the charterer, meaning that shipowners have no incentive to optimise operations and, indeed, are contractually obliged to follow the charterers’ operational instructions.
5. The above features give rise to what is sometimes referred to as an “agency problem” or “split incentives” in charterparties.
6. However, the charterparty perspective is too narrow, and the obstacle to eradicating SFTW is in fact greater. Ocean cargo transport is a link in the supply chain. Viewed from the perspective of supply chains, a further obstacle appears: the contracts for sale and purchase of commodities on board the vessels also contain provisions that require prompt arrival of the vessel. For example, sale and purchase contracts contain provisions for laycans and demurrage (similar to provisions in charterparties) and for delivery periods for the goods on board.
7. Finally, contracts of carriage evidenced by bills of lading incorporate terms from charterparties, creating a further layer of complexity, in that a vessel carrying cargo that operates in any way other than due dispatch is committing the cardinal sin in maritime law of an unlawful deviation.
8. It is clear from the above that the present contractual architecture of international maritime trade stands in the way of a GHG reduction of an order of magnitude equivalent to the entire emissions of a country.
The limitations of past and present efforts
9. There have been great strides in the last fifteen years in the area of weather routing and voyage planning. This has resulted in increased efficiency of individual vessels (unilateral optimisation), but that does not assist with the systemic problem of SFTW.
10. In addition to the unilateral voyage optimization progress since, there have further attempts in two other areas of vessel efficiency: virtual arrival (“VA”) and just-in-time arrival (“JiT”).
a. VA attempted to deal with some of the obstacles described above in relation to the split incentives of charterparties. VA is, by its nature, a bilateral contractual mechanism and does not address the wider supply chain. Similarly, it does not address the systemic optimization problem, i.e. the fact that other vessels are proceeding to the same port and would steam at a higher speed to gain an advantage.
b. JiT, on the other hand, targets optimization beyond the one ship or the bilateral relationship between shipowners and charterers of one ship. However, JiT seeks to optimise port operations at a given port (terminals, tugs, port pilots, customs authorities etc.), rather than optimise the system of ships. Indeed, as every port is different, JiT solutions are difficult to deploy at scale.
Decarbonisation and SFTW
11. Operational optimization is no longer merely desirable, but has become an imperative in ocean maritime trade and supply chains: decarbonisation requires existing vessels to become more efficient, while all new fuels under consideration (methanol, ammonia, hydrogen) are both far more expensive and also have a much lower fuel density than present marine fuels. Therefore, future vessels powered by such new fuels will need to
Conference Paper 156
operated at maximum fuel efficiency. It is in this context that eradicating SFTW is now an imperative.
12. A illustration of that imperative is the Clydebank Declaration, which has been signed by several governments, including Australia, the UK and the USA, and envisages decarbonized routes between certain ports. It is inconceivable that such green corridors can operate alongside the archaic and inefficient operational model of SFTW.
The Blue Visby Solution
13. The Blue Visby Solution is a multilateral optimisation platform (the Blue Visby Solution“BVS”), consisting of various elements: technological, as well as contractual. It differs from VA and JiT because it approaches SFTW from a systems optimization perspective, rather than a unilateral (voyage planning), bilateral (VA) or port/berth management (JiT) perspective. In addition, the Blue Visby Solution includes a contractual mechanism for the sharing of costs and benefits amongst the platform participants, so as to remove the obstacle of “split incentives”. That sharing mechanism is inspired by general average, a ancient practice by which the parties to the “common maritime adventure” share the costs necessitated by a maritime emergency.
14. The Blue Visby Solution is currently being tested and refined with the help of a Consortium of entities comprising shipowning, commodities trading, maritime economics, carbon consulting, as well as academics, and other non-commercial entities.
15. The aim of the Blue Visby Solution is to eradicate SFTW, deliver very substantial GHG savings from the existing fleet, and create the operational efficiencies necessary for the era of new fuels, all of which will be more expensive and have a lower energy density than marine fuel oil. The Blue Visby Solution is compatible with every other decarbonisation initiative and is new-fuel-agnostic. The Blue Visby Solution is a neutral, transparent, independent and collaborative platform that leverages the maritime industry’s best traditions: freedom of contract under English law, and concerted action to deal with a danger that is threatening the “common maritime adventure”. This time, the danger is new: the climate emergency.
Conference Paper 157


Pathways to Sustainable PortsWhat Does the Future Hold?
SESSION
159
6
Bunkerspot provides a comprehensive, accurate – and always independent – view of the multi-faceted global marine fuels industry


Bunkerspot magazine focuses on the technical, operational, commercial, environmental and legal aspects of bunkering, and also keeps its readers up to speed on innovations and trends in vessel and fuel ef ciency technologies.


The Bunkerspot website includes a subscription-based real-time news and pricing service, as well as information channels, industry announcements and updates on conferences, exhibitions and other key events.


Bunkerspot Price Index
If you need accurate, up-to-date bunker price indications in an easy to use and highly cost-effective format, BPi ticks all the boxes.
Delivered via the Bunkerspot website or through the BPi app, the Bunkerspot Price Index offers spot bunker prices in over 350 global ports, updated daily and with easy to see tracked price changes.


www.bunkerspot.com/bpi

Bunkerspot industry roundtables


Bunkerspot regularly partners with key industry stakeholders to host roundtable discussions where shipping, marine fuels and legal experts offer insights on the main issues and developments impacting the bunker sector.
Subscribe to Bunkerspot www.bunkerspot.com/subscribe
To discuss how your organisation can bene t from the market intelligence and solutions provided by Bunkerspot, contact: Lesley Bankes-Hughes, Director of Publishing. Tel: +44 1295 814455. Email: lesley@petrospot.com


The essential and authoritative source of information for marine fuels professionals.
CATHERINE BLAINE
General Manager Projects - Port Authority of NSW
NSW Chapter Chair PIANC ANZ

BIOGRAPHY
Catherine is the Chair of the NSW Chapter of PIANC ANZ, and the General Manager of Projects at Port Authority of NSW.
Catherine has worked in the private and government sectors of the port and maritime industry for over 20 years, specialising in port and maritime infrastructure development. Catherine has completed large scale projects in most major ports on the east coast of Australia.
Catherine is a qualified civil and environmental engineer, with a passion for sustainable development, and enjoys finding ways to implement sustainable design and initiatives into port infrastructure and its operation.

Moderator
161
SHAUN TAYLOR Senior Managing Consultant, Impact Assessment, Ramboll
BIOGRAPHY
Shaun has more than 25 years of environmental consulting experience in Australia and the Middle East, primarily in the field of environmental impact assessments, management and approvals. Shaun has extensive experience in the management of multi-disciplinary teams, having managed various environmental assessment and management projects primarily in the Hunter Region but throughout NSW, Victoria and Queensland.
This has included a wide range of infrastructure developments, including water and sewer infrastructure, waste management, roads and bridges, rail and associated infrastructure, electricity generation, power transmission, and port infrastructure and operations. This has also required interaction with, and providing important support to, the associated engineering design teams, stakeholder consultation teams and the infrastructure owners and managers.
More recently Shaun has responsible for the environmental impact assessment and approvals for several renewable energy projects, and has been supporting Ramboll’s international offshore wind team as it introduces it services and experience to the growing Australian offshore wind industry.

Speaker
162
Planning for the Green Port: the integrated infrastructure and land use planning to support transition and diversification
The international energy supply market is in a period of significant change, transitioning from traditional energy sources to a number renewable and green energy sources. Ports are at the forefront of facilitating this change, but with this comes the need for significant new land and infrastructure in the port. This ranges from facilities for the receival and fabrication of renewable energy generation infrastructure, construction and maintenance facilities for offshore wind developments, power transmission infrastructure to connect these offshore wind developments to the grid, and through to the production and export of green hydrogen and ammonia.
While this presents an exciting opportunity for ports to be primary driver in the greening of our energy supplies, it presents a major challenge for the managers of ports in the master planning of what the ‘port of the future’ will look like: what land and infrastructure is required for this new technology, how to manage potentially conflicting activities and land uses, facilitating the development of green manufacturing on port lands, all while recognising that this will need to happen while traditional materials will continue to be transported through the port, including those that may be phased out or significantly reduced through the transition.
The paper will discuss the planning and logistics requirements for ports to transition to green energy hubs, with a focus on international case studies where this has included transitioning from the transport of fossil fuels and other products.
Conference Paper
163
TAM PHAM Sustainability Manager, RightShip


BIOGRAPHY
Tam holds more than eight years of experience in corporate environment and sustainability management, decarbonisation strategies and net zero transition for governments and large corporation across different industries. Her current role is based in Melbourne and is responsible for developing and implementing RightShip’s sustainability digital tools that enable maritime stakeholders to make informed decisions in sustainability, air quality, decarbonisation and ESG management. Her work involves helping ports, terminals and charterers improve visibility and transparency of the maritime air emissions inventories and emission reduction strategies. Tam holds a master’s degree in Environmental and Sustainability Management.
Speaker
164
Harnessing the power of data and digital revolution to tackle air quality and greenhouse gas reduction challenges at ports
Introduction
The shipping sector is the backbone of global commerce, accounting for approximately 80% of all trade. Moving goods by sea is responsible for about 3% of total CO2 emissions, an amount projected to double by 2050, according to the International Maritime Organization (IMO) 4th GHG1 .
Recognising the need for climate action, the IMO has mandated targets of carbon intensity reduction of 40% by 2030 and 70% by 2050, complemented by a minimum absolute reduction of 50% by 2050.
At COP26, 22 countries signed the Clydebank Declaration for green shipping corridors2specific trade routes between major port hubs where alternative, low and zero-emission fuels will be progressed. Since the launch at COP26, countries, ports and companies have made more than 40 announcements under the Green Shipping Challenge at COP273 on issues such as innovation for- ships, expansion in low- or zero-emission fuels, and policies to help promote digital tools to support the uptake of next generation of vessels for maritime operational excellence.
Green shipping corridors will serve as pilots to demonstrate how key ecosystems, including regulatory sandboxes for new fuels, green financing, information sharing, and carbon accounting mechanisms can be brought together to provide practical ways to decarbonise the maritime industry. Achieving a stage of maturity where future fuels can be deployed across green shipping corridors will assist in accelerating decarbonisation for the wider maritime industry.
Within these pilots, there is opportunity for ports to harness the power of big data and digital solutions to tackle air quality and greenhouse gas reduction challenges. With the advent of the Internet of Things (IoT), smart digital systems, digital twins, predictive analytics and blockchain there is the potential for increased data flows, information sharing and collaboration amongst stakeholders. Implementation of the green and digital shipping corridors between ports around the world not only has the potential to catalyse and drive investment in new green infrastructure, delivering economic benefits and complementing efforts at the IMO to support the decarbonisation and digitalisation transition for international shipping, but will also contribute towards the urgent climate goals by improving air quality and public health of local port communities.
The COVID-19 pandemic has changed industry’s appetite and acceptance of digital solutions. Exploiting insights from big data and digitalisation can further enhance intermodal connectivity in the supply chain across different transport modes at national and supra-national level. These data insights can drive vessel operational efficiency improvements in line with IMO regulations, advances in vessel management and support air quality improvements in ports.
1 https://www.imo.org/en/OurWork/Environment/Pages/Fourth-IMO-Greenhouse-Gas-Study-2020.aspx
2 COP 26: Clydebank Declaration for green shipping corridors - GOV.UK (www.gov.uk)
3 Green Shipping Challenge at COP27
Conference Paper
165
This paper outlines the important role of utilising data and the insights they provide to tackle air quality and greenhouse gas reduction challenges at ports. And, through a set of case studies, demonstrate how innovative digital revolution can help identify opportunities to remove hotspots in supply chains and improve operation efficiency to support future-ready sustainable ports and bring economic, social and environmental benefits to local port communities.
Utilising data and insight to support and optimise greener and cleaner port
There are over 50,000 vessels in the global fleet transiting the oceans, or operating near or in a port, at any one time. The myriad environmental impacts from vessels include, but are not limited to:
5 CO2 emissions,
5 liquid waste discharge during transit,
5 harmful air pollutants when operating around the port,
5 use of port waste reception facilities, and
5 potential transfer of non-native species through ballast and biofouling.
Harnessing the increasing volumes of data available through digital solutions such as IoT and digital twins, predictive analysis, blockchain, and in-port operations can provide accurate and timely data flows for insight and analysis of these environmental impacts for more effective target interventions. Ports can identify particular hotspots and sources that were previously hidden and gain a better understanding of the impact of particular interventions.
Additionally, information sharing in real time on an open platform can facilitate better integration of the shipping and co-modal supply chains, allowing insight for more efficient operations and more agile responses to disruptions.
With regards to in-port emissions, big data can be collected from vessel movements in port areas which can be processed into geo-fence maps provided on a digital platform. Visual representations of data can be interrogated on the platform to analyse GHG and air pollutants volumes, including particular hotspots and bottlenecks.

Conference Paper 166
Figure 1. Example of emissions hotspots within a port boundary. Source: Maritime Emissions Portal, RightShip 2023
In turn, harbourmasters can utilise these insights to further progress action on existing emissions targets within the Ports Environmental Management System, and where they are not in existence to help identify and establish targets.
The impact of targeted interventions or emission reduction actions can be also measured and presented on the digital platform. This is crucial to designing effective and timely strategies for managing air pollution in local areas.
Big data from across the global fleet and port operations is also supported by the evolving IoT. Utilisation of low-cost ship sensors, along with the development of a new generation of advanced sensors provide remote environmental and conditional monitoring and data collection. This information can be transmitted to stakeholders and used in real time to facilitate monitoring of asset status, identification of inefficiencies, optimisation of pre-planned maintenance and to highlight potential faults to reduce reactive maintenance and avoid potential MARPOL violations.
Digital twins can aid vessels operational and strategic decision making, for example weather routing, and/or foresight on maintenance issues, using digital scale models of vessels.
Ports supporting passenger and commercial vessels can interrogate and test scenarios with visual representation based upon historical and real-time data provided by IoT. Using data effectively means getting the right information, to the right people, at the right time. It requires data to be robust and readily accessible, but also presented in the right way. Sharing the right data amongst stakeholders within the port community can influence decision making such as infrastructure planning with improved berthing plans, which reduce waiting times and fuel consumption and thus lower GHG emissions and local air quality impacts.
Identifying hotspots in supply chains and providing insight to tackle air quality and emissions reduction
The maritime industry is facing a dual challenge of decarbonisation and digitalisation to optimise supply chain efficiency and resilience to disruptions. New technologies and alternative fuels are yet to mature and are at various stages of readiness across the value chain.
In the immediate term, it is critical that short-term actions are taken to reduce emissions intensity as a minimum, in line with IMO targets. As an old management adage that ‘you can’t manage what you can’t measure’, and often the more you can measure, the more power you have to affect an issue. Therefore, identifying where, when, and how to improve is key.
Innovative digital solutions can help identify hotspots and bottlenecks in supply chains and provide actionable insights to help ports manage and track progress towards tackling air quality and greenhouse gas reduction challenges.
Digitalisation and big data also enable many opportunities for companies by reducing waiting time, improving connectivity and productivity, optimising operation efficiency, reducing fuel consumption and therefore operational costs. Processing and presenting the data in a userfriendly format can help ports, cargo owners, ship owners, ship operators and other stakeholders assess, monitor and track real-time progress.
From there, opportunities include real-time routing and ramp allocation at warehouses, justin-time arrival scheduling in line with customer demand patterns and port facilities, dynamic routing, and clean sheet coast modelling (Figure 2).
Conference Paper 167
Smart port and digital twin technologies enabling just-in-time arrivals of vessels to increase efficiency and productivity
The digital twin has become the means to capture data across assets and real time operations of logistic industry. Research shows more than 20% of emissions can be reduced through supply chain optimisation and digitalisation5 .

5 DNV, 2022. Maritime Forecast to 2050 Report
6 DNV, 2022. Maritime Forecast to 2050 Report
 Figure 2. The landscape of supply chain analytics opportunities4
Figure 3. Maritime Forecast to 20506. Source: DNV
4 Big data and the supply chain: The big-supply-chain analytics landscape (Part 1) | McKinsey
Figure 2. The landscape of supply chain analytics opportunities4
Figure 3. Maritime Forecast to 20506. Source: DNV
4 Big data and the supply chain: The big-supply-chain analytics landscape (Part 1) | McKinsey
ports can drive the shipping decarbonisation and catalyse the implementation of green and digital shipping corridors
How ports can drive the shipping decarbonisation and catalyse the implementation of green and digital shipping corridors
Ports and terminals are well placed to be the catalyst for decarbonisation and improved air quality from shipping through to port incentive schemes, as well as provision of alternative and/or low carbon fuel infrastructure and supply across green shipping corridors
Various examples of ports and countries stipulating individual stringent environmental protection criteria can be seen across the world, ranging from restricted incinerator use in Italian waters, biofouling requirements in New Zealand and Australia, NOx taxes in Norway, or pre-arrival reporting requirements in the Port of Los Angeles.
Ports and terminals are well placed to be the catalyst for decarbonisation and improved air quality from shipping through to port incentive schemes, as well as provision of alternative and/or low carbon fuel infrastructure and supply across green shipping corridors. Various examples of ports and countries stipulating individual stringent environmental protection criteria can be seen across the world, ranging from restricted incinerator use in Italian waters, biofouling requirements in New Zealand and Australia, NOx taxes in Norway, or pre-arrival reporting requirements in the Port of Los Angeles.
Since the establishment of the Clydebank Declaration in 2021, many partnerships are starting to form to develop green shipping corridor development with the aim of supporting a just and inclusive transition into low, ultra-low and zero-emission fuels. 21 green shipping corridor routes have emerged around the world and more than 110 stakeholders from across the value chain are engaged in these initiatives, and a significant level of public-private collaboration can be seen.
Since the establishment of the Clydebank Declaration in 2021, many partnerships are starting to form to develop green shipping corridor development with the aim of supporting a just and inclusive transition into low, ultra-low and zero-emission fuels. 21 green shipping corridor routes have emerged around the world and more than 110 stakeholders from across the value chain are engaged in these initiatives, and a significant level of public-private collaboration can be seen.

Examples include the announcement from the Maritime and Port Authority of Singapore (MPA), Port of Long Beach, Port of Los Angeles, C40 Cities, and Port of Rotterdam on their partnership on establishment of digital green shipping corridors. Green shipping corridors will allow ambitious
7 Annual Progress Report on Green Shipping Corridors 2022
Examples include the announcement from the Maritime and Port Authority of Singapore (MPA), Port of Long Beach, Port of Los Angeles, C40 Cities, and Port of Rotterdam on their partnership on establishment of digital green shipping corridors. Green shipping corridors will allow ambitious governments to act together to demonstrate maritime decarbonisation and air quality improvements are possible, whilst also unlocking new business opportunities and socio-economic benefits for communities, such as increased jobs, improved health and wellbeing, and reduced supply chain disruptions across the globe. Page 6 of 10
7 Annual Progress Report on Green Shipping Corridors 2022
Conference Paper 169
Figure 4. 21 Green Shipping Corridors initiatives by end of 20227. Source: Global Maritime Forum
How
Figure 4 21 Green Shipping Corridors initiatives by end of 20227. Source: Global Maritime Forum
These partnerships may prove valuable as the current approach to port incentives is somewhat disjointed, with over 60 incentive schemes in existence promoting better ship management in return for reduced fees. Such varied schemes can result in vessels realising benefits in some ports only to incur costs in others.
Additionally, varying incentives creates an administrative burden on vessels and ports8. The schemes include, but are not limited to, RightShip’s GHG Rating, the Environmental Ship Index, Clean Shipping Index, and Green Award.
Introducing harmonised port incentives for ships transiting green corridors and facilitating a ‘single window’ point of information for port access would reduce administrative burdens and improve efficiency.
Through identifying alternative, low and zero carbon fuels across a green shipping corridor, ports can also provide the signal for developing infrastructure and supply of alternative fuels and thus become an energy hub for zero-carbon fuel, which can then expand out to localised shipping.
Finally, ports can apply digital solutions to minimise vessel traffic congestion around port areas and improve operational efficiency, thus reducing CO2 and improving air quality.
Data driving decarbonisation – port case studies
Prince Rupert Port, Canada – Open collaboration in data sharing to drive transparency and decarbonisation efforts
Digitisation for maritime decarbonisation
5 Port Rupert’s GreenWave incentive scheme offers efficient vessels port fee discounts.
5 The Port provided open collaboration data and feedback to help develop, test and pilot RightShip’s Maritime Emissions Portal (MEP).
5 Using innovative heatmap and zoning technology, the MEP provides a clear visual analysis of the port environmental profile over any time period. This assists the port to identify problem areas and opportunities for improvement and make timely and practical decisions when managing air emissions.
5 An interactive emissions heatmap and dashboard supports the port to forward plan their emission reduction strategy, such as offering incentives for green vessels, planning new shore-power facilities, and optimising operations. The impact of their reduction strategy on vessel emissions can be quantified and visualised.
5 The GreenWave program facilitated avoidance of ~3,190t/GHG of GHG, equivalent to removing 677 passenger vehicles from the road for a year.
Conference Paper 170
(nrdc.org)
8 incentive-schemes-promoting-green-shipping-ip.pdf
Port of Vancouver, Canada – Increased EcoAction incentives for ships with lower environmental impacts calling the Port of Vancouver

Launched in 2007, the EcoAction Program supports the port authority’s mandate to enable Canada’s trade while protecting the environment and considering local communities. Almost onethird of eligible calls to the Port of Vancouver qualify for EcoAction incentives each year, helping reduce greenhouse gas and air contaminant emissions, as well as underwater noise. Shipping lines calling the Port of Vancouver typically qualify for approximately $2 million worth of incentives annually.
Effective from January 1, 2023, the port authority’s EcoAction Program – which offers shipping lines discounts on their fees for taking voluntary steps to reduce their environmental footprint –includes a new platinum level. A platinum level discount of up to 75% off harbour dues is available for ships that:
• use low-emission, alternative fuels such as methanol, hydrogen or LNG,
• use technologies to reduce emissions such as connecting to shore power, or wind or battery assist,
• are certified as quiet vessels by a ship classification society, reducing underwater noise for the benefit of at-risk whale species
EcoAction is one of the many ways that the port authority is working to improve local air quality and reduce emissions that contribute to climate change, in support of the goal to phase out all port-related emissions by 2050. The port authority is leading on a suite of climate action programs to help reduce emissions and accelerate the transition to lower-emission fuels and technologies, such as the Low-Emission Technology and Clean Trucking initiatives.
Geelong Port, Australia – Carbon neutral port
In 2020, Geelong Port began preparing a carbon emissions inventory of all port emission sources, of which berthed vessels contributed a significant volume The Port was seeking carbon neutral certification by the Australian Government, which meant issuing a public disclosure statement. To go public in this way meant they needed to be confident in the accuracy of their calculations.
Data collection and calculation was processed through an emissions estimation calculation in a spreadsheet, which did not always inspire confidence in the accuracy and suitability of the calculation methodology.
 Figure 5. Emissions by operation mode. Source: Maritime Emissions Portal, RightShip 2023
Through the Ports Australia's Environment and Planning Working Group, it was identified that the Pilbara Port Authority had undertaken similar work using RightShip’s MEP This is when Geelong Port started a dialogue with RightShip.
Through the Ports Australia’s Environment and Planning Working Group, it was identified that the Pilbara Port Authority had undertaken similar work using RightShip’s MEP. This is when Geelong Port started a dialogue with RightShip.
Geelong Port’s operational control, and therefore emissions inventory, only extends to vessels berthed within the wharf infrastructure. They are not responsible for any of the ‘water side’ operations, such as tugs, pilot boats, anchorage, and an extensive shipping channel from the ocean to the port. Using the MEP provided a calculation and visual representation of this pattern of activity, which the Port utilised to benchmark their carbon inventory against port and water side emissions profile.
Geelong Port’s operational control, and therefore emissions inventory, only extends to vessels berthed within the wharf infrastructure. They are not responsible for any of the ‘water side’ operations, such as tugs, pilot boats, anchorage, and an extensive shipping channel from the ocean to the port. Using the MEP provided a calculation and visual representation of this pattern of activity, which the Port utilised to benchmark their carbon inventory against port and water side emissions profile.
Benefits
Certification
Benefits Certification
Through improved quality of data collection, the Port was successful in becoming the first carbon neutral port in Australia, achieving certification by the government body Climate Active This achievement surpassed the initial aspiration of carbon neutrality well ahead of schedule and was in part due to the data insights that MEP provided.
Through improved quality of data collection, the Port was successful in becoming the first carbon neutral port in Australia, achieving certification by the government body Climate Active. This achievement surpassed the initial aspiration of carbon neutrality well ahead of schedule and was in part due to the data insights that MEP provided.
Emissions monitoring
Emissions monitoring
The Port was able to visualise and confirm the direct impact on regulatory requirements around emissions. On 1 January 2020, the IMO sulphur cap was introduced, requiring all vessels to burn >0.5% Sulphur. The platform allowed a direct comparison of before and after regulation demonstrating a dramatic drop in SOx, NOx and PM emissions, which have remained low ever since. This gives confidence in the portal, as it is clearly monitoring and reflecting changes happening in the maritime industry.
The Port was able to visualise and confirm the direct impact on regulatory requirements around emissions. On 1 January 2020, the IMO sulphur cap was introduced, requiring all vessels to burn >0.5% Sulphur. The platform allowed a direct comparison of before and after regulation demonstrating a dramatic drop in SOx, NOx and PM emissions, which have remained low ever since. This gives confidence in the portal, as it is clearly monitoring and reflecting changes happening in the maritime industry.

Community liaison
Community liaison
The local community around the Port are key stakeholders in environmental initiatives and being transparent with them in order to build trust, as well as demonstrating leadership in this space has been invaluable. Information on their initiatives, including providing carbon neutral certification and demonstrating the innovative and robust vessel-based emissions calculation and interrogation system, has been freely shared with these local stakeholders.
The local community around the Port are key stakeholders in environmental initiatives and being transparent with them in order to build trust, as well as demonstrating leadership in this space has been invaluable Information on their initiatives, including providing carbon neutral certification and demonstrating the innovative and robust vessel-based emissions calculation and interrogation system, has been freely shared with these local stakeholders.
Conference Paper 172
Figure 6. Year-over-year comparison. Source: Maritime Emissions Portal, RightShip 2023
Page 9 of 10
Figure 6. Year-over-year comparison. Source: Maritime Emissions Portal, RightShip 2023
Concluding remarks
Innovative digitalisation and data analytics can support green & digital shipping corridors’ development in the transition to more efficient, reduced impact, and ultimately zero-harm vessels. In particular, they can aid improved efficiency in-line with CII requirements, whilst progressing towards full decarbonisation as future fuels become available.
Short to medium term the focus should be on improving supply chain efficiency and reducing emissions (CO2 and air pollution):
5 Digital twins can increase visibility, transparency and promote action on emission hotspots and supply chain bottlenecks to reduce operating time within the trading routes, reduce energy consumption and emissions whilst improving operation efficiency.
5 Smarter route planning including weather routing, application of IoT and machine learning can improve upkeep of vessels and transit efficiency.
5 Real-time data of vessel movements and visualisation of emissions hotspots can aid stakeholders to identify, react to and improve local port air quality.
5 Data and analytics help ship owners, ports and terminals understand their risk exposure and identify opportunities to be futureproof against stricter regulations on carbon emissions, including regional carbon tax, EEXI, CII, etc.
5 Big data is enabling smarter supply chains through mechanisms such as RightShip’s GHG Rating, providing data for charterers to exclude inefficient ships from supply chains.
Medium to long term, as alternative fuels are developed and realised, including infrastructure and supply, focus of digitalisation and data analytics should switch to full decarbonisation:
5 Single access database outlining location and availability of alternative future fuels within green corridors for bunkering planning.
5 Digitalisation can play a key role in preparing the maritime workforce to be adaptive and resilient to the radical changes in fuelling systems. Enormous opportunities exist to utilise digital solutions for training, upskilling crew on board and onshore staff to ensure safety, efficiency, and resilience.
5 Accurate provision of fuel consumption and predictive data for transit and port operations can help green corridor stakeholders better project demands, avoid congestion and improve efficiency. These insights can be integrated into smart port and digital twin system allowing port operators and involved stakeholders stay on top of operational management.
5 Information on availability, location and well-to-wake impact of alternative fuels should be made available with open access via digital platforms to allow transparency across whole supply chains.
Digital solutions using real-time data and analytics to provide smart and user-friendly insights can help ports and other green shipping corridor stakeholders better understand and manage emission hotspots, supply chain disruptions and demonstrate progress in decarbonisation and improving local air quality. Combining these insights with organisational and investment capacity, as well as employee skills and strategy will help support the development and success of greener and cleaner sustainable ports. This will protect our coastlines and local communities, working towards a maritime industry which causes zero harm.
Conference Paper 173
LISA MCKINNON Principle Scientist, BMT & Susan McLeod, Manager Environment and Sustainability, TasPorts


BIOGRAPHY
Lisa McKinnon is an experienced Environmental Scientist with over 24 years experience in the sustainability, climate change and environmental management areas. She has led approvals and environmental assessments for major pieces of marine development, including dredging, port infrastructure, aquaculture and offshore wind projects. Lisa has an interest in helping businesses transition to a low carbon future through practical solutions, whilst also delivering positive environmental and social outcomes. Particularly within the marine environment, she is working on a number of blue carbon and habitat restoration projects with Councils, local government and ports.
Speaker
174
Identifying Pathways to Reduce TasPorts
Greenhouse Gas Emissions
Authors: Lisa McKinnon, Adam Jones and Susan McLeod
Introduction
TasPorts is a state-owned company who operate 11 ports within Tasmania, as well as the Devonport Airport and the Bass Line ferry servicing King Island. They have office facilities at a number of ports around the state and currently own 14 vessels including tugs, pilot launches and landing barges.
In 2020, TasPorts prepared their Sustainability Roadmap, with an action being to ‘ define how much TasPorts needs to reduce Greenhouse Gas (GHG) emissions (and in what timeframe) to do our part to restrict the increase in global average temperature to less than 1.5oC above preindustrial levels and identify efforts to reduce or prevent emissions of GHG’. This paper sets out pathways by which TasPorts can meet this action.
Understanding TasPort’s Existing GHG Emissions Profile
The National Greenhouse and Energy Reporting Framework as well as the World Resources Institute Greenhouse Gas Protocol (2004) were used to calculate TasPorts’ current emissions profile. All Scope 1 and 2 emissions within the operational control of TasPorts were included, with some Scope 3 emissions, where relevant. TasPorts have a large number of tenants within their port facilities; at this time tenant emissions have not been including in their emissions profile, however actions that TasPorts can take to assist their tenants in reducing their own GHG profile will form part of their ongoing climate change strategy (for example, through providing shorepower or access to alternative fuels).
Over the past several years, TasPorts have put in place a number of initiatives to reduce their GHG emission footprint. These have included:
5 Alterations to the Bass Island Line route, with lower overall travel distance and shore power at its new berth in Devonport. Diesel consumption has subsequently reduced since April 2022.
5 Two new diesel bulldozers brought in to replace older units at the Burnie woodchip facility in March 2021 and May 2022.
5 Various solar lighting upgrades at Hobart, Bell Bay, Flinders Island and Garden Island locations.
5 Changes to the tug portfolio, with some older vessels decommissioned and replaced currently with chartered vessels.
5 Scope 1 and 2 emissions from energy and fuel use are now tracked and reported annually, enabling trends and anomalies to be spotted.
In total, TasPorts produces approximately 7, 234 tonnes of CO2e annually (Scope 1, 2 and some Scope 3 emissions).
Conference Paper
175
Activities or emission sources that have been included in the footprint are summarised in Table 1 below.
The largest emission source by far is fuel use, comprising 77% of emissions, followed by electricity use (16%) and waste disposal (3%) (refer to Figure 1). The vast majority of this fuel use is generated by a small handful of assets; the Bass Island Ferry Line, marine (tugs and support vessels) and the Burnie Woodchip Loader Facility.
As well as day-to-day activity, TasPorts have plans for several large expansion projects over the upcoming few years, with upgrades planned for the Macquarie Wharf, Bell Bay, Devonport East Port and Burnie Port. Each of these projects will generate both significant construction and operational emissions. For future years, a growth factor needs to be accounted for when projecting emissions and setting emission reduction targets.

Conference Paper 176
Table 1: Greenhouse Gas Emissions produced by TasPorts 2019/20
Emission Type Major Uses Tonnes (CO2e) Scope 1 Fuel Use Vessels, Devonport Airport, Staff vehicles 6, 047 Scope 2 Electricity Use Staff Offices, Devonport Airport, port facilities 1, 187 Scope 3 Waste Disposal Staff Offices 230 Downstream Electricity and Fuel Generation Staff offices 166 Corporate Flights Staff 191 Employee Commuting to/ from work Staff 59 Other Corporate Travel (taxis/rental cars) Staff 8.9
Figure 1: GHG Emissions 2019/20 (Tonnes CO2e) by activity
Figure 1: GHG Emissions 2019/20 (Tonnes CO2e) by activity
As well as day-to-day activity, TasPorts have plans for several large expansion projects over the upcoming few years, with upgrades planned for the Macquarie Wharf, Bell Bay, Devonport East Port and Burnie Port. Each of these projects will generate both significant construction and operational emissions. For future years, a growth factor needs to be accounted for when projecting emissions and setting emission reduction targets.
Potential Emission Reduction Strategies for TasPorts
When identifying GHG reduction options, a hierarchy of approaches was taken with preference given firstly to eliminating GHG’s completely, followed by reduction, substitution and lastly offsetting. Since the majority of TasPorts emissions are associated with fuel use, decarbonisation measures focused on ways to reduce or eliminate heavy diesel oil within its vehicle and vessel fleet. Ways to electrify energy sources was also a focus, with Tasmania’s energy supply being largely sourced from hydropower, giving it a much lower carbon footprint than most Australian states. Options considered include:
5 Energy audits and upgrades of office facilities
5 Replacement of heavy machinery (e.g. bulldozers) and light fleet vehicles with electric versions
5 Improving the fuel efficiency of the existing vessel fleet, in particular the Bass Line vessel
5 Replacement of existing vessel fleet with newer, more fuel efficient vessels (but still using conventional diesel fuel)
5 Replacement of tugs with diesel-electric tugs (using approximately 50% less diesel) or alternative fuels (e.g. methanol/hydrogen/biodiesel)
5 Provision of renewable energy for powering offices (i.e. solar panels)
5 Offset remaining emissions either on-site (i.e. blue carbon options) or through purchase agreements
Our naval architects undertook an assessment of each vessel within TasPorts portfolio, looking at their design, age and cost of upgrade or replacement as well as the availability of alternative vessels and/or fuels and the need for infrastructure upgrades.
Evaluating Emission Reduction Strategies
The relative net present value cost and extent of abatement for each potential reduction option is shown as a Marginal Average Cost (MAC) curve in Figure 3.
This is intended to show the relative impact of an action on emissions on the horizontal axis (with larger being better), and the cost effectiveness of an option on the vertical axis (with lower being better).
Conference Paper 177
This is intended to show the relative impact of an action on emissions on the horizontal axis (with larger being better), and the cost effectiveness of an option on the vertical axis (with lower being better).
Stronger financial feasibility due to return on investment in addition to emissions mitigation for options ‘below zero’ (i.e. lower is better)
Cost of offsets (currently ~$40/tonne)
Higher cost of abatement indicates less financially feasible options
Figure 3 Marginal Average Cost (MAC) Curve of Emission Reduction Options
Figure 3 Marginal Average Cost (MAC) Curve of Emission Reduction Options

The findings from the options evaluation show that at present, few options show a return on investment. The option that is most likely to have the biggest impact on TasPorts GHG footprint is replacement of the Bass Line vessel with a new vessel that uses an alternative fuel source. The next largest reduction option is to use biodiesel in in all TasPorts vehicles and vessels. The cost of replacing TasPorts vessel fleet with electric versions is considered to have the highest cost per tonne CO2e.
The findings from the options evaluation show that at present, few options show a return on investment. The option that is most likely to have the biggest impact on TasPorts GHG footprint is replacement of the Bass Line vessel with a new vessel that uses an alternative fuel sou rce. The next largest reduction option is to use biodiesel in in all TasPorts vehicles and vessels. The cost of replacing TasPorts vessel fleet with electric versions is considered to have the highest cost per tonne CO2e.
With the implementation of maximum investment scenario, TasPorts is capable of reducing its emissions by between 40 to 50% from 2019/20 levels as shown in Figure 4. Achieving net zero is unlikely to be possible without offsetting some emissions. The cost of investment is highly sensitive to the cost of new vessels or alternative fuels. It is acknowledged that prices for these are likely to reduce as alternative technologies become more widely available. TasPorts also have to factor in the cost of building new infrastructure to supply and store alternative fuels.
With the implementation of maximum investment scenario, TasPorts is capable of reducing its emissions by between 40 to 50% from 2019/20 levels as shown in Figure 4 Achieving net zero is unlikely to be possible without offsetting some emissions. The cost of investment is highly sensitive to the cost of new vessels or alternative fuels. It is acknowledged that prices for these are likely to
Conference Paper 178
4
Bass Island Line Options have the largest emissions impact (shown as width)
reduce as alternative technologies become more widely available. TasPorts also have to factor in the cost of building new infrastructure to supply and store alternative fuels.
Conclusion
Conclusion
The analysis performed has identified that with newer technologies and fuels that are currently available on the market, TasPorts would be able to reduce its current GHG emissions footprint by between 40-50% through eliminating or reducing its current energy use. At present, these options are do not offer a return on investment, and have a high cost of abatement per tonne of CO2e; these may become more viable if a vessel is due for replacement in the shorter term.
References
The analysis performed has identified that with newer technologies and fuels that are currently available on the market, TasPorts would be able to reduce its current GHG emissions footprint by between 40-50% through eliminating or reducing its current energy use. At present, these options are do not offer a return on investment, and have a high cost of abatement per tonne of CO2e; these may become more viable if a vessel is due for replacement in the shorter term.

Wallace, P. 2020. Putting Australia First – Svitzer Australia’s emission reduction strategy
References
Wallace, P. 2020. Putting Australia First – Svitzer Australia’s emission reduction strategy
“Feasibility of installing shore-power at Macquarie Wharf, Hobart” 2019, Payne, Undergraduate Thesis 5
Conference Paper 179
Figure 4 Estimated annual emissions reductions from maximum investment scenario
Figure 4 Estimated annual emissions reductions from maximum investment scenario


www.ufofreight.com ONE OF THE ONLY EXCLUSIVE FREIGHT FORWARDER NETWORKS IN THE WORLD ESTABLISHED IN 2000 ISO 9001 & ISO 14001 CERTIFIED UNIVERSAL FREIGHT ORGANISATION Cargo Connections provides independent forwarders access to a global network of agents who can handle their shipments, whilst working professionally under strict Membership Rules. The ISO 9001 and ISO 14001 certified organisation offers a Restricted Representation policy, which means membership will only be offered to a limited number of agents per country. www.cargoconnections.net NEED RELIABLE PARTNERS TO HANDLE YOUR FREIGHT FORWARDING NEEDS? Then join the international network with 100+ of the world’s top independent freight forwarders, located in 100+ countries, to increase your business. www.digifreight.live DigiFreight YouTube Our unique platform with built in time zones enables forwarders to connect with one another directly through their mobile device across several communication platforms (Skype, Zoom, Google Meet and WhatsApp). A project has come up and you don’t have time for a long back and forth email trail. Our powerful interface enables you to quickly schedule a meeting with your DigiFreight partner at a mutually convenient time with time zones automatically considered. Plus Face-to-Face Meeting in Croatia from 2 Oct 2023 - 04 Oct 2023 THE NEW ERA IN NETWORKING FOR THE FREIGHT FORWARDING INDUSTRY 12-14 November 2023 We are delighted to announce that our 12th Annual Summit will be held from 12-14 November 2023 at The Royal Cliff Hotel in Pattaya, Thailand. THAILAND 12th Annual Summit VIRTUAL MEETING HUB projectcargonetwork.com UK Based Head Office Established 12 Years Professional Online Training ISO 9001 & ISO 14001 330+ Specialist Members 120+ Countries New Virtual Meeting Hub Smartphone Service A project has come up and you don’t have time for a long back and forth email trail? Our powerful interface enables you to quickly schedule a virtual meeting with your PCN partners at a mutually convenient time (with time-zones automatically considered) via WhatsApp, Zoom, Google Meet or Skype. NETWORKING PLATFORM FOR THE WORLD’S TOP PROJECT CARGO SPECIALISTS MORE BUSINESS MORE CONNECTIONS MORE EVENTS pcntraining.com
SESSION 7
Green PortsWhat components are needed 181
CATHERINE BLAINE
General Manager Projects - Port Authority of NSW
NSW Chapter Chair PIANC ANZ
BIOGRAPHY
Catherine is the Chair of the NSW Chapter of PIANC ANZ, and the General Manager of Projects at Port Authority of NSW.
Catherine has worked in the private and government sectors of the port and maritime industry for over 20 years, specialising in port and maritime infrastructure development. Catherine has completed large scale projects in most major ports on the east coast of Australia.
Catherine is a qualified civil and environmental engineer, with a passion for sustainable development, and enjoys finding ways to implement sustainable design and initiatives into port infrastructure and its operation.
Moderator 182
Environment Director, Coastal and Marine Development, RHDHV, and Silalomanu Isaia, Samoa Ports Authority
BIOGRAPHY
Sian is the Coastal Adaptation Lead for the Pacific and Environment Director for Coastal and Marine Development. With a background in coastal geomorphology she specialises in coastal adaptation and considering the environmental implications of major infrastructure projects at the water’s edge.
Sian has led Royal HaskoningDHV’s Environmental Impact Assessment (EIA) and Habitats Regulations Assessment (HRA) work over the last 22 years, including translating predicted geomorphological effects into ecological impacts and, in turn, developing appropriate mitigation, monitoring and compensation strategies. She has led EIA teams for several major infrastructure development projects (across the full suite of topics) - from inception, through Environmental Statement (ES) submission, Public Inquiry and consent. Sian is an acknowledged expert in coastal management, EIA and HRA, particularly with respect to coastal development, having written guidance documents and provided training and key note presentations. She has dealt extensively with multi-disciplinary projects in the coastal zone, managing collaborative research programmes and acting as a specialist advisor to the UK’s Marine Management Organisation (MMO), amongst others.

Speaker
SIAN JOHN
183
Vision for
Apia
Green Port
Vision for Apia Green Port
To be a “green” port
Apia Green Port - Small steps, huge potential


To be a “green” port
! Optimising energy efficiency, adopting environmentally sustainable practices and developing in a sustainable manner; and
Vision for Apia Green Port
! Optimising energy efficiency, adopting environmentally sustainable practices and developing in a sustainable manner; and

5 To be a “green” port
5 Optimising energy efficiency, adopting environmentally sustainable practices and developing in a sustainable manner; and
! Operationally efficient, safe, and resilient to climate change and future commercial challenges
! Operationally efficient, safe, and resilient to climate change and future commercial challenges
To be a safe port
To be a safe port
5 Operationally efficient, safe, and resilient to climate change and future commercial challenges
5 To be a safe port
! Enhancing preventative and preparatory measures to ensure timely and effective response to disasters in a coordinated manner
! Enhancing preventative and preparatory measures to ensure timely and effective response to disasters in a coordinated manner
To be a gender equal port
5 Enhancing preventative and preparatory measures to ensure timely and effective response to disasters in a coordinated manner
To be a gender equal port
! Institutionalising gender equality in its green port operations and management
February 2023
5 To be a gender equal port
! Institutionalising gender equality in its green port operations and management
February 2023
Project
5 Institutionalising gender equality in its green port operations and management
Project Outputs > Project Inputs
Outputs ► Project Inputs
5 Green Port Policy – including commitments to environmental management, operational efficiency, climate reliance, disaster preparedness and gender equality
Project Outputs ► Project Inputs
" Green Port Policy – including commitments to environmental management, operational efficiency, climate reliance, disaster preparedness and gender equality
" Green Port Practice Manual – a practical handbook to guide improvement of performance and daily operations
" Green Port Policy – including commitments to environmental management, operational efficiency, climate reliance, disaster preparedness and gender equality
5 Green Port Practice Manual – a practical handbook to guide improvement of performance and daily operations
" Multi-Hazard Disaster Preparedness Plan
" Green Port Practice Manual – a practical handbook to guide improvement of performance and daily operations

5 Multi-Hazard Disaster Preparedness Plan
5 Green Port Initiatives – to optimise
" Multi-Hazard Disaster Preparedness Plan
operational and energy efficiency and promote environmentally sustainable practices
" Green Port Initiatives – to optimise operational and energy efficiency and promote environmentally sustainable practices
" Green Port Initiatives – to optimise operational and energy efficiency and promote environmentally sustainable practices
February 2023
February 2023
Conference Paper 184
3
“Health Check”
3
“Health Check”
“Health Check” topics
“Health Check” topics
5 Environmental management
# Environmental management
5 Energy efficiency & transition

5 Pollution control
# Energy efficiency & transition
# Pollution control
5 Environmental sustainability
5 Operational efficiency
# Environmental sustainability
# Operational efficiency
5 Regulatory control
5 Marine & cargo operations
# Regulatory control
5 Digital maturity
# Marine & cargo operations
5 Quality of infrastructure
# Digital maturity
# Quality of infrastructure
# Climate resilience
4
5 Climate resilience February 2023
# Disaster preparedness
5 Disaster preparedness
5 Pre-event planning
# Pre-event planning
5 Resources
# Resources
# Surveillance & monitoring
5 Surveillance & monitoring
5 Post-event recovery
# Post-event recovery
Health Check Scoring
Not considered at all yet
shown and options considered by port
Feasibility study conducted for renewable energy generation potential
infrastructure
infrastructure - fencing, lighting, gates, CCTV for secure and safe port facility management
No complete port boundary fencing or gate controls. Insecure.
ISPS grade boundar fencing and gates in good repair
port lighting to support safe 24hr operation and security surveillance by patrols
5 Social sustainability, inc. gender
5 Gender equality
# Social sustainability, inc. gender
5 Engagement
# Gender equality
5 Social issues
# Engagement
# Social issues
Designs underway and funding applied for
Initiatives implemented and infrastructure available; existing installed capacity
Manual procedured to manage access control, inspections and security patrols
Digital access control system in place to manage entry/ exit, with CCTV and inspection facilities at gates for ISPS level 1-3
Conference Paper 185
Theme Topic/ Measure of: Indicator Scoring criteria 0 1 2 3 4 Green Port Environmental Management Emissions Local
renewable energy generation
Interest
Operational
Quality
Efficiency
of
Security
Health Check Scoring
Enhancing the Safety, Security and Sustainability of Apia Port, Samoa
Apia Green Port Health Check - Results
Limited navigation aids. Not aware of a Harbour Master Directions or Port guide book. Written notice of ship arrivals received from stevedores.
No regular surveys (draft & seabed). they were not clear of the last survey date, or outcome. Last dredge was 2003 to 11mCD. SPA consider that there is a need to dredge again.
Was level 0 (not measured), but we are trying to bring this in via PortMeter. Initial view is minimal, level 2 or 3. Not enough data to be clear yet. Little data to support the awareness factor. Did not establish if they measure wait time, through suspect the agents do record such information. Stevedore notify SPA of delays in writing. Some congestion associated with the presense of fishing vessels - cruise and tankers have priority.
Trying to embed measurement through Port meter (although Bentham do this). Training unknown.
Three stevedores manage the yard and CHE separately. They have different contracts with SPA, based on movers, time or other (being determined). Can’t establish if container location is shared among the 3 stevedores - ACTION to determine.
Throughput is recorded via manifests. Plan to introduce a CBS. However, JW advised that there would be little point in SPA investing in this if teh terminal/vessel handling continues to be controlled by the stevedores.
Manifests are provided by the Agents, peper, not email. SPA maintain a tally but cannot track boxes.
Container locations are managed by the individual stevedores. No central databaseor record. No sharing of equipment. This causes delays.
Plans are being considered for a TOS (CBS), though not sure how this will work with current Stevedores practise.
Conference Paper 186
Theme Topic / Measure of: Indicator Score Port target Comment Marine and cargo operations Safe navigation supervision (VTS, Aids to Navigation) 1 3
Monitoring and communicating port weather, physical conditions & bathymetry (surveying sea floor) 1 3
Vessel congestion & marine service resilience at port 2 3
Vessel cargo handling services, reliability & performance 1 3
Terminal yard management, stock control & supervision 1 3
Check Results 2022
Apia Green Port Policy Statement
Apia Green Port Policy Statement

The Samoa Ports Authority will strive to:
The Samoa Ports Authority will strive to:
• Optimise resource use and decarbonise port operations
5 Optimise resource use and decarbonise port operations
5 Adopt environmentally sustainable practices and develop in a sustainable manner


• Adopt environmentally sustainable practices and develop in a sustainable manner
5 Be operationally efficient, safe, and resilient to future climate change and commercial challenges


• Be operationally efficient, safe, and resilient to future climate change and commercial challenges

Conference Paper 187 Health Check Results 2022
Health Check Results 2022 Health Check Results 2022 Health Check Results 2022 Health Check Results 2022
February 2023
8
Apia Green Port Policy Commitments
Environmental Management
1. To ensure the efficient and sustainable use of resources - electric power, diesel and water - within the port
2. To manage port operations to prevent pollution and impact on the environment and local communities; measure and reduce emissions to the air and sea
3. To responsibly manage and reduce waste generated by port and shipping activities - reduce, re-use, recycle
4 To reduce reliance on fossil fuels and support decarbonisation by embracing renewable energy use
5. To comply with all environmental legislation, codes and regulations that the port and Samoa are signatories to
6. To protect and conserve biodiversity within the port’s influence
Operational Efficiency
7. To improve operational and navigational safety
8. To reduce operational costs through greater efficiency in the yard and reduction in delays
Climate Resilience
9. Ensure that port assets and operations are resilient to climate change for continuous service delivery
Green Port KPIs > Green port Initiatives
Environmental Management
# Policy Commitment
E1 To reduce reliance on fossil fuels and support decarbonisation by embracing renewable energy use
E2 To ensure the efficient and sustainable use of resourceselectric power, diesel and water - within the port
E3 To manage port operations to prevent pollution and impact on the environment and local communities; measure and reduce emissions to the air and sea.
E4 To responsibly manage and reduce waste generated by port and shipping activities - reduce, re-use, recycle
E5 To comply with all relevant environmental legislation, codes and regulations that the port and Samoa are signatories to
E6 To protect and conserve biodiversity within the port’s influence
KPI
Percentage renewable electricity consumed (kWh) by SPA (and tenants) as a proportion of overall electricity consumption
Carbon footprint total tCO2e (tonnes of carbon)
Diesel use (litres consumed vs cargo throughput volume; e.g. litres/TEU)
Electricity use (KWh)
Water use (m3)
Number of complaints (Capture incident reports from Apia residents of noise, light pollution)
Air quality pollution event monitoring (Continuous monitoring; number of events above a given threshold of PM2.5/NOx/SOx concentration)
Total waste (Tonnes of waste generated/collected by type)
Recycling (x% of overall waste recycled)
Compliance with all relevant international, national and local legislation.
Biodiversity (Water quality through monitoring of oil pollution or other pollution events affecting seawater)
Conference Paper 188
Green Port Initiatives > Long-list of 42
Operational Efficiency
GPI #22 Strategic Asset Management Plan > Asset Management Plans
What?
5 An ISO55000-compliant SAMP will give structure and process to taking care of critical port assets.
5 For the most important assets, an AMP will be required for inspection intervals and key maintenance tasks.
See also: Benefits?
5 Improved business resilience and continuity.
5 Reduced risk from climate change and typhoons.
5 Directed best-value for assetrelated investment.
How?
5 Produce an SAMP for SPA portfolio of land, infrastructure, equipment assets, including an inventory of assets owned and matrix of criticality for port operations.
5 Develop AMPs to improve resilience and reliability of key assets.
Pre-Requisities?
5 Staff availability and knowledge to support an SAMP.
5 nventory/ownership records for port assets.
5 Maintenance records and history to feed into directing AMPs.
Conference Paper 189
Operational Efficiency 12GPIs Disaster Preparedness 7 GPIs Climate Resilience 1 GPI Social Sustainability 3 GPIs Environmental Management 19 GPIs
Green Port Initiatives > Impact vs Effort

Environment
Social
Commercial
Cost Resources
Timeframe
Green Port Initiatives > Short-list of 13
Green Port Initiatives ► Short-list of 13

Behavioural change and green ambassadors
Green infrastructure
Yard and asset management
Hazard identification and risk management
SPA’s ambitions need to be realistic and achievable
Small steps, huge potential…
14

February 2023
Solar PV


Conference Paper 190
JEANINE DRUMMOND (SHE HER)
MD & Principal Maritime Advisor, Integral Maritime

BIOGRAPHY
As an experienced maritime transportation and supply chain industry leader, Captain Jeanine Drummond has an extensive background across our industry sectors, at sea and ashore, across operations, development, and commercial, in Australia and overseas. Jeanine is currently Managing Director and Principal Maritime Advisor at Integral Maritime and is a Board Member at Australian Maritime College, Australian Maritime Safety Authority and Australian Mariners Welfare Society. She is passionate about providing sustainable and innovative port and maritime solutions that deliver safe, effective, and efficient operations and workplace culture while delivering pathways where 100% of the Australian population can embark on a maritime career journey. Jeanine also strongly advocates diversity, equity, and inclusion in maritime.

Speaker
191
Human Factor in Sustainable Ports
1. INTRODUCTION
In this paper, through a human factor lens, consideration and discussion are given to applying best practice diversity, equity and inclusion (DEI) in relation to the successful integration of sustainability within green port developments.
This includes this application of human factor integration with sustainability at all levels of an evolving or developing green port, from operations to business administration and culture, while considering different DEI initiatives that support improved human performance, operational safety and effectiveness as environmental protection.
2. BACKGROUND
As the science and practice of human factors have evolved and become increasingly more recognised through the maritime industry and ports sector, it has highlighted the significance of psychological safety in the workplace. Psychological safety directly correlates with operational and physical safety, human performance, and productivity.
Creating a culture of psychological safety leads to improved communication, increased trust and collaboration, and a reduced fear of retaliation which can all enhance overall human factors of the workplace. In green ports development, psychological safety can lead to more significant gains in environmental protection through robust discussion, ideas, creativity and innovation in a port.
Many different definitions exist, yet essentially the objective of human factors is to reduce human error, increase productivity (HFES 2023), and improve safety and well-being where there is an interaction between human and workplace factors. The relevance of human factors in the maritime industry had been slow to evolve, with a breakthrough in 2020 when OCIMF published a new mission promising “that human factors will be considered in everything the organisation does.” This reflects OCIMF’s aim “to improve safety and environmental protection in the maritime industry by considering human factors when providing guidance and recommendations.” Further, OCIMF (2020) effectively describes human factors as “the physical, psychological and social characteristics that affect human interaction with equipment, systems, processes, other individuals and work team(s).”
For the purpose of this paper, the focus is on human factors intersecting with diversity, equity and inclusion when determining effective strategies to support sustainable port development. As Ports Australia (2019) explains, “sustainability relies on a safe, educated, diverse and empowered workforce ready to address current operations and future opportunities.” In aligning with many of the United Nations Sustainable Development Goals (2023), the intersection of human factors and DEI results in green ports embracing workplace diversity, ongoing learning, talent attraction and retention, employee well-being, workplace health and safety, positive organisational culture and proactive leadership, and community engagement and access to employment and economic opportunities.
Diversity, equity and inclusion (DEI) are closely related to human factors in several ways. While human factors refer to how people interact with and are affected by their environment and equipment, DEI addresses how individuals with different backgrounds, experiences, and perspectives are treated and included in that environment.
Conference Paper
192
For example, in the workplace, DEI initiatives can create a more inclusive environment for employees of all backgrounds by ensuring that everyone has equal access to opportunities and is treated with respect and fairness. This can improve employee communication and collaboration and enhance creativity and innovation.
3. DIVERSITY, EQUITY AND INCLUSION (DEI) ACCELERATING GREEN PORTS

3.1. Understanding DEI
Understanding the meaning and intent of diversity, equity, and inclusion is essential. Without this knowledge and thorough understanding, generic, well-meaning, ineffective policies and practices are often developed.
To develop this understanding further, Godinho (2022) describes diversity “as the presence of differences within a given setting”. Some examples include race, gender identity, ethnicity, religion, nationality, socioeconomic status, language, disability, age or political perspective. Equity ensures that everyone has access to the same opportunities, recognising that advantages and barriers exist and that; as a result, everyone does not start from the same place, and it is a process that begins by acknowledging that unequal starting place and works to correct and address the imbalance. Inclusion is the workplace culture that is an intentional, ongoing effort to ensure that people with different identities can fully participate in all aspects of the work of an organisation where systemic barriers have been removed. Everyone’s contribution is valued and respected.
The E in DEI had often been referred to as equality and now more appropriately as equity. Simply put, equality can not exist without equity. If all people were given the same resources and opportunities, regardless of their differences, the resulting outcomes would maintain degrees of disadvantage/advantage. However, if people were given resources and opportunities appropriately scaled to the differences at the starting point, the resulting outcome would place them on the same playing field.
An inclusive workplace culture is a key to unlocking diversity of thought and providing for rich, robust, honest and transparent discussions, thoughts, ideas and exchange of information respectfully without risk of ridicule, rejection, or penalty This is often referred to as psychological safety in the workplace. No matter a person’s age, experience, gender, skills, or background, they are supported and encouraged to speak up and be heard. This person may offer the critical piece of information that could prevent an incident or be the creative solution to a complex engineering design issue because they could contribute a different perspective to the team. An unwillingness to speak up can be particularly challenging for industries with a higher operational or personnel safety risk, such as ports, and extensive work is required to improve psychological safety.
An inclusive workplace culture is a key to unlocking diversity of thought and providing for rich, robust, honest and transparent discussions, thoughts, ideas and exchange of information respectfully without risk of ridicule, rejection, or penalty. This is often referred to as psychological safety in the workplace. No matter a person’s age, experience, gender, skills, or background, they are supported and encouraged to speak up and be heard. This person may offer the critical piece of information that could prevent an incident or be the creative solution to a complex engineering design issue because they could contribute a different perspective to
Google’s 2015 study 'Project Aristotle' found that psychological safety was the most significant success factor underpinning high-performance teams across organisations through accessing and integrating enhanced diversity of thought that inspires and
Conference Paper 193
PAPER
Figure 1 Equality, Equity and Inclusion Source: DCN Daily Cargo News June 2022
Figure 1 Equality, Equity and Inclusion Source: DCN Daily Cargo News June 2022
the team. An unwillingness to speak up can be particularly challenging for industries with a higher operational or personnel safety risk, such as ports, and extensive work is required to improve psychological safety.
Google’s 2015 study ‘Project Aristotle’ found that psychological safety was the most significant success factor underpinning high-performance teams across organisations through accessing and integrating enhanced diversity of thought that inspires and creates greater innovation and improves judgement and decision-making.
Actions speak louder than words. Leaders committed to fostering inclusion, innovation and a speak-up culture must model, promote and reward behaviours that promote a safe workplace. The net benefits gained by the positive effects of psychological safety on employee well-being improve productivity, organisational performance, and employee satisfaction.
3.2. DEI in the Maritime Industry & Ports
Every industry, workplace and site is different, with its unique culture and challenges to overcome when applying successful DEI strategies. The maritime and ports sector is no other.
While globally, the maritime industry has long had diversity, with often multinational crews and teams working together, there continues to be significant underrepresentation at sea and in ports, in many other aspects of diversity, none more so evident than the representation of women.
Globally there have been many challenges in increasing women’s participation in the maritime industry and sub-sectors. While women’s representation is better in shore-side non-operational roles, women working at sea on vessels has slowly evolved over the last century. With slow uptake over the previous four decades, there have been recent signs of increasing participation with increased DEI initiatives.
Women comprise 29% of the workforce in the general maritime industry, while in national maritime authorities, only 20%. In comparison, industry data shows women make up just 2% of all seafarers, predominantly in the cruise sector (WISTA 2022). This is a minimal pipeline to draw on for port roles that require mariner knowledge and qualifications. There is currently no quantifiable data publicly available or known research into gender representation within port operational and management roles that could be sourced. However, based on estimation in Australia, less than 5% of port operational roles in pilotage, towage, VTS, lines and wharfage would be female.
This identifies a key challenge in increasing diversity in the maritime industry and port sector. At the same time, only limited numbers of diverse candidates are available to fulfil many roles, combined with a potential over-reliance on traditional pathways and qualifications that have narrowed down applicant pools.
It has been apparent in the maritime industry that where a lack of inclusive workplace culture exists; there is often a lack of diversity, or other significant challenges exist as barriers to increasing the representation of minority groups. This would indicate that workplace culture is a crucial priority for any DEI strategy or underpinning initiatives before campaigning for increased diversity attraction or retention targets.
3.3. DEI value in green ports
When the workforce at the port reflects the diversity of the community it serves, a more inclusive workforce will be better equipped to understand and address the needs of all stakeholders, including those from underrepresented communities, in developing more sustainable practices. This diversity in the port community results in various perspectives and
Conference Paper 194
ideas that can be used to identify and solve environmental problems, leading to more effective and efficient innovative solutions that take into account the needs of all stakeholders and significantly minimise the environmental impacts of ports.
There are many other ways DEI contributes value to green ports, including:
Better compliance and regulations: By ensuring that a diverse group of stakeholders is formed in the decision-making process, a green port will be better equipped to understand and adhere to regulations related to environmental protection, which will lead to better compliance and reputation as a port that is responsive to environmental concerns.
Access to funding: By including diverse perspectives and stakeholders in developing green port projects, including emerging industries such as Australia’s offshore wind, ports can access funding from various sources, including those dedicated to funding projects that benefit underrepresented communities.
Community engagement: DEI initiatives can help build trust and engagement with the local community, leading to a better understanding of community needs and more effective communication. This can be particularly important when addressing environmental concerns and implementing sustainable practices.
Access to jobs and economic opportunities: DEI initiatives can also help ensure that all community members have equal access to employment and economic opportunities associated with the port. This can create a more equitable distribution of the benefits of a green port.
Innovation: DEI initiatives can also foster innovation by encouraging different perspectives and ideas, leading to more sustainable practices and technologies that enhance the port’s safety, efficiency, operations, development opportunities and financial position. The past few years have highlighted volatile and uncertain supply chain and port complexity issues, where existing or traditional methods no longer solve new problems. This creates an opportunity for value in encouraging and integrating the diversity of thought for challenging established patterns and delivering a platform for creativity and innovation in solutions.
It is evident that by fostering collaboration, community engagement, access to employment and economic opportunities, compliance and innovation, DEI can help create a more inclusive, equitable and sustainable green port that meets the needs of all port stakeholders.
3.4. DEI Case Study – Offshore Wind Emerging Australian Industry
Australia’s emerging offshore wind energy sector is fast building interest and capacity as Australia’s government announced its first offshore wind zone off the southern coast of Victoria in December last year. With others, zones are expected to be declared on the East Coast of Australia in 2023. These offshore wi nd projects are significant investments with thirty-year operational lives that will build a new industry for Australia, its maritime industry and the ports sector. Throughout feasibility, construction and operational phases, the scale and size of these projects will require deep water port access and extensive supply chains. This will generate around 6000 direct jobs during construction, and a further 600 jobs during operations of Oceanex Energy’s Novocastrian and Illawarra Offshore Wind Farms alone (Oceanex 2022).
This new and emerging industry presents a unique opportunity as green ports evolve to create an inclusive workplace culture, free of existing cultural and systemic barriers in long and wellestablished sectors today.
Conference Paper 195
Star of the South is Australia’s most advanced offshore wind project, currently in its feasibility phase and is proposed to be located off the coast of Gippsland in Victoria; last November released a guide for offshore wind jobs (Star of the South, 2022), with profiles of more than 50 typical jobs in the industry, what they involve, and the qualifications, skills and training likely needed. It is evident in the guide that there is a desire to attract diverse talent. The guide shares stories of people who’ve transitioned into the offshore wind from other industries, including many profiles of women in traditionally male-represented roles.
Successful gender balance or significantly improved representation of women and other traditional minority-represented community groups (compared to conventional maritime industry sectors) will only be achieved when the offshore wind industry works together with the Governments and other key stakeholders to make this goal a key priority. Such as that, research, initiatives, strategies and funding are considered at every stage, right from the very early stages of project development, to develop further and strengthen the pipeline of diversity to recruit and promote from within. Furthermore, as part of the DEI initiatives, consideration must be given to a holistic review and analysis of traditional pathways for maritime and port careers to ensure qualifications and training frameworks are appropriate for this new and emerging industry in an era of digitisation, technology and remote operations.
Undertaking project workforce studies that are underpinned by a tailored DEI strategy aligned with United Nations 2030 sustainable development goals and reflective of the communities in which the offshore wind farms will be developed will embed modern application of best practice culture of inclusion, diversity and equitability, where everyone’s participation is valued and respected, and reflect the balance seen in our communities.
3.5. Considerations for green ports DEI strategy
5 Includes everyone, all stakeholders, internal and external, and overall workplaces
5 Aligns with business strategy
5 Modern, evolving with changing expectations
5 Exceeds minimum standards and adopts best practices
5 DEI is integrated into everyday operations as any other safety system
5 Data focused on trends and analysis to inform strategy review
5 Maintains viability with bespoke or tailored programs
5 Community-focused with partnerships, advocacy and support
4. CONCLUSION
Through the lens of human factors, this paper has discussed the significant value that a tailored port-specific DEI strategy provides a green port, where best practice DEI is applied and successfully integrated with sustainability initiatives within green port developments, as well as stakeholder and community expectations and the port’s overall vision.
This, in turn, highlighted the significance of a psychologically safe workplace within green ports that reflects an inclusive culture and diverse workgroup where everyone will speak-up and have their contribution valued.
While gender has been discussed and given prominence in this paper, all individual diversity must be considered within the context of the ports employee and stakeholder demographics, ensuring fair and equitable access and opportunities to all community members.
In summary, an effective DEI strategy supports existing and new green port developments to deliver improved human performance, successful operational safety and effectiveness, and environmental protection.
Conference Paper 196
References
Godinho, J. (2022, Feb 1). Why DEI in the Workplace is Essential for Progress in the Long Run, Emeritus. https://emeritus.org/blog/diversity-equity-and-inclusion-in-the-workplace/
Human Factors and Ergonomics Society (2023). What is Human Factors and Ergonomics?.
https://www.hfes.org/About-HFES/What-is-Human-Factors-and-Ergonomics
New York Times. (2016, Feb 25) What google learned from its quest to build the perfect team. https://www.nytimes.com/2016/02/28/magazine/what-google-learned-from-its-quest-tobuild-the-perfect-team.html
Oceanex Energy (2022). Why Offshore Wind?. https://oceanexenergy.com/
OCIMF. (2023, Jan 20) The OCIMF Human Factors Approach, Oil Companies International Marine Forum (OCIMF), https://www.ocimf.org/publications/information-papers/the-ocimf-humanfactors-approach-2
OCIMF. (2020). The OCIMF Human Factors Approach: A framework to materially reduce marine risk, October. https://www.ocimf.org/publications/information-papers/the-ocimf-humanfactors-approach-2
Ports Australia. (2020 June). Leading Practice: Port Sustainability Strategy Development Guide – Approaches and Future Opportunities. https://www.portsaustralia.com.au/value-of-ports/ sustainability
Star of the South, (2022, Nov) Offshore wind jobs guide. https://www.starofthesouth.com.au/ jobs-guide
The DCN. (2022, June). Women in Maritime – Three little words. https://issuu.com/the_dcn/ docs/june_2022_new
United Nations, Department of Economic and Social Affairs. (2023, Jan 20) The 17 goals, United Nations THE 17 GOALS | Sustainable Development (www.un.org)
WISTA (2022). IMO and WISTA International “Women in Maritime” Survey. https://wistainternational.com/our-work/women-in-maritime-imo-wista-internationalsurvey-2021/
Conference Paper 197
MATT STEPHENSON Senior Manager ESG & Investor Relations, Port of Newcastle

BIOGRAPHY
Matthew Stephenson has worked in Sustainability for over 12 years, after completing a Master’s Degree in Sustainability at the University of Leeds. Matthew started his career at an award-winning sustainability charity in London, working with large organisations to help drive sustainable change through their supply chains. Later, working in the built environment specifically focusing on Environmentally Sustainable Design, Matthew has helped design and certify some of Australia’s biggest institutional buildings against ISCA, LEED, Green Star and NABERS ratings.
Matthew has continued his professional development undertaking further studies with the University of Cambridge on transitioning to a net zero economy and now heads up the ESG team at Port of Newcastle where he Is helping the Port to navigate its own diversification journey.
Speaker
198
Port of Newcastle: Diversifying Australia’s Largest East Coast Port for The Future
1. INTRODUCTION
Port of Newcastle, one of the busiest, largest and oldest ports in Australia, plans to develop sustainably into the future. This report will showcase some of its achievements so far and discuss the challenges ahead.
2. PORTS, CENTRAL TO SUSTAINBLE DVELOPMENT
Ports have been and will continue to be more than just the trade that flows through them, enabling critical supply chains, p roviding employment, and supporting the surrounding communities and wider economy. Port of Newcastle is no different. From its inception in 1797, the Port has been through many incarnations, from a major Steel hub to the world’s largest coal port, providing employment to thousands of Novocastrians along the way. Currently Port of Newcastle is in the midst of its next growth story as we ensure we continue to be economic resilient; we are environmentally considerate, sustainability focused, strategically diversifying and we have a social license to operate as the world moves to a more sustainable future.
Newcastle’s port has seen more than 220 years of commercial shipping and a lot has changed in that time. It’s reported that shipping is responsible for approximately 80 per cent of global trade, and this number is expected to continue to grow over the next three decades.
At Port of Newcastle, we are positioning ourselves to capitalise on this growth in a sustainable manner. This is not only important for Newcastle or even NSW but globally as the world transition to a net zero economy.
From being the world’s largest coal energy export port to the largest green energy export port and major container hub for east coast of Australia. That sounds like a simple pivot… right? But this does not come without challenge.
3. CHALLENGES
As an essential component of a sustainable future, Ports play a critical role in the movement of goods and services around the world. However, with the increasing demand for freight transport, ports are facing a number of challenges in terms of their environmental impact and their ability to adapt to the changing climate both physically and transitionally.
Here at Port of Newcastle, like many other Ports, we are managing some fairly generic challenges in both developing sustainably and mitigating future climate risks, such as:
5 Water pollution
5 Bio security
5 Waste
5 Scope 3 Emissions
5 Modern Slavery
5 Net Zero
5 Sea level rise
5 Flooding
Conference Paper
199
But also, some aspects that are quite unique to Port of Newcastle, including:
5 Fresh Water /Sediment inundation from the Hunter
5 Commodities
5 Local Indigenous engagement
4. PON’s RESPONSE
With a such broad rage of areas to address, its easy to get overwhelmed. Our first step was to look at materiality this has allowed us to prioritise SDGs and focus our ESG strategy on what is material to the port.
Driven by an ambitious ESG strategy, Port of Newcastle was the first Australian port certified as an environmentally sustainable port by Lloyds through the International EcoPorts network. Ensuring we provide robust governance around our environmental management.
In line with the old mantra of what gets measured gets managed the Port is now including Climate related disclosures under the TCFD framework. Furthermore, we are currently gearing up for TNFD in early 2024. Both of these frameworks allow us to take a standardised approach to address climate and Biodiversity risk and outline what we are doing to mitigate them.
So what will the future look like, what is a sustainable port and what are the steps that need to be taken to ensure that they are able to meet the demands of the future while minimising their impact on the environment?
As the world’s largest export coal port, we know that diversification is not an option, it’s a must and key to developing sustainably. And I don’t just mean environmentally.
Our business strategy is guided by our ESG strategy, a great example of this is when we procured two new harbour cranes, which culminated in the Port being the first Australian port to take ownership of two Liebherr Hybrid electric/diesel cranes. We are also working with a local consultant / Engineer AMP control to look at electrifying our dredge, to help decarbonise our dredging operations.
Looking further down the economic lens, we have and will continue to diversify our revenue streams through 2 major developments.
1. Clean Energy Precinct
2. Container Terminal
Our diversification strategy will significantly contribute towards ensuring decent work opportunities and economic growth for the Hunter Region (SDG 8), supporting sustainable cities and communities (SDG 11) and contributing towards a global effort to take action on climate change (SDG 13).
Diversity and inclusion is a significant aspect of our commitments in particular, recognising that the maritime industry has traditionally been a male dominated industry, we are invested in shifting the dial and creating a greater workforce gender balance of men and women (SDG 5). Recognising the importance of our indigenous communities, the Port has:
5 Had their First Reflect RAP endorsed By RA and is continuing indigenous engagement through its master planning via the UON.
5 Launched a partnership (SDG 17) with the University of Newcastle to provide a scholarship opportunity that aims to enhance the Hunter Region’s capacity in meeting future technology-led jobs and to support tertiary education pathways for Indigenous students (SDG 4, SDG 10.2)
Conference Paper 200
5 Incorporated KPIs into our recent landmark sustainability linked loan that has seen the development of an indigenous internship program with a minimum of two internships being offered each year to indigenous students.
5 Engaged local artist Sarretta Fielding to create the design for our Welcome Sign. The art is reflective of the local Awabakal and Worimi peoples and acknowledges them at the traditional owners of the land.
As custodians of the Port, we take on a great responsibility, possibly the largest is ensuring we decarbonise our operations. And I am extremely happy that just last month we updated our SBTI trajectory to be in line with a 1.5 degree scenario from a previous well below 2 degree trajectory. Moreover, we have also aligned our scope 3 with the SBTI.
In addition to the transparency and scientific underpinning that the SBTI endorsement provides, we also subscribe to GREBS benchmarking and in 2022, our fourth year participating, we achieved 95/100….. we’re aiming for more this year.
At Port of Newcastle we recognise the importance of partnerships (SDG 17) and have identified key stakeholders where we can develop partnerships that will co-create value for our region and help us mitigate some of the challenges we face as we develop sustainably.
In partnership (SDG 17) with National Australia Bank (NAB) to we developed in 2021 a landmark sustainability-linked loan that aligns financing with long-term environmentally and socially responsible outcomes.
5 This was the first sustainability-linked financing by an Australian seaport
5 It was also the first such loan in Australia to include a modern slavery assessment metric. We have subsequently undertook 2 further sustainable finance loans which have incorporated some very ambition sustainability goals such as Scope 3 measurement and target set.
Port of Newcastle is a member of the NSW Government Sustainability Advantage Program. Having received Silver Partner in recognition of its sustainability commitment and performance in 2021, PON is now actively pursuing Gold recognition. Sustainability Advantage have been a catalyst for many of our sustainability initiatives. Such as measuring our energy usage, setting targets and implemented initiatives to reach those targets through:
5 Introducing 26 smart meters that enable the Port to understand our electricity usage
5 In support of SDG 7.a, promoting investment in clean energy technology and infrastructure PON has transitioned 75% of its corporate vehicle fleet over to electric vehicles to date.
5 To support our EV fleet, we have installed nine charging stations across our operations directly contributing to SDG 9.4 through upgrading infrastructure and adopting clean and environmentally sound technology for our business
5 In addition to this We partnered with the City of Newcastle to install two public electric vehicle charging stations across the city. This partnership is critical to the Port being able to support and encourage other businesses, visitors to the region and the wider community to uptake this clean technology and enabling these groups to significantly reduce their carbon emissions.
5. STAKEHOLDER CAPITALISM
What does the future hold, more of the same I hope – a multi stakeholder approach to strategy and business operations. Where profits, although important, stand side by side with social and environmental factors in all decisions made as we transition to a net zero and sustainable economy.
Conference Paper 201
BIOGRAPHY
Fiona Robinson is Managing Principal for Ramboll’s Environment and Health group in Asia Pacific. Fiona has 25 years’ experience in contaminated site assessment and land remediation across Australia and internationally. Fiona provides third party advisory services across many sectors and is a contaminated land auditor in NSW and a Certified (Contaminated Sites) Practitioner.
Speaker
202
FIONA ROBINSON Country Market Director, Ramboll
Sustainable Remediation of Port Land using Net Environmental Benefit Analysis

Net Environmental Benefits Analysis (NEBA)
Risk-cost-benefit comparative assessment applied to decision making
t Drive down, or optimize costs

t Maximize environmental benefits
t Include social value of the benefits
5 Merge monetary and non-monetary metrics into decision making
5 Science-based
NEBA Approach
1 Set conceptual framework for project goals, options, constraints & requirements
2 Identify data needs for attributes that contribute to decision making
3 Collect data & fill data gaps
4 Perform environment & economic consequence analyses
5 Identify benefit & cost tradeoffs for different options and decision attributes
6 Convey the results with uncertainties
Conference Paper
203
ALUMINIUM SMELTER SITE, AUSTRALIA LEGACY LANDFILL REMEDIATION


Conference Paper 204 Ramboll Ramboll
Seawork is open for business – all year


Reserve now for 2023. Keep your full business profile and capabilities in front of your customers 365 days a year. Create meetings with Seawork visitors and build business all year. Hold product launches and host leadership events.
Europe’s leading commercial marine and workboat exhibition


Make the most of marketing & PR support from Seawork, Maritime Journal and our leading commercial marine magazines, in print, online, eNews and via social media.
Showcase your latest innovations in vessels, equipment and services to an international audience of over 100,000 all year on Seawork.com

Seawork & Marine Civils exhibition encompasses 12,000m2 of halls featuring 600 exhibitors and over 70 vessels and floating plant.

Features include the European Commercial Marine Awards (ECMAs) and Innovations Showcase.

The Seawork Conference programme offers opportunities to explore the challenges, changes and emerging opportunities in today’s and tomorrow’s commercial marine and workboat sector.

For more information visit: seawork.com contact: +44 1329 825 335 or email: info@seawork.com

Speed@Seawork Sea Trials & Conference Also returning in 2023 Co-located with:
#Seawork MARITIMEJOURNAL COMMERCIAL MARINE BUSINESS BOATINGBUSINESS THE UK LEISURE MARINE BUSINESS Media partners: JUNE 20 23 Southampton United Kingdom 13 15 TO
HERMAN JOURNEE Chairman, ECO Sustainable Logistic Chain Foundation

BIOGRAPHY
Herman Journée initiated in 1996 in Europe the development of the Ecoports Port Environmental Management System, a professional quality management system and standard and the EcoPorts Network for cooperation and sharing good environmental practice. More than 130 European Ports contributed to its realisation. In 2010 he started, the independent non-profit ECOSLC Foundation to introduce Ecoports outside Europe and to introduce sustainable port, transport and logistics chain management. The Foundation is internationally recognized.
welcome
A
from Herman Journee
206
What is EcoPorts/


#1 A neutral, independent not for profit organisation
#2 A management system and a global standard tailored for ports and terminals.
#3 Designed to integrate a process that promotes continual improvement to create long term value
A global Network

SDM SECTIONS
SDM Sections
Environmental Policy
Organisation and Personnel
5 Environmental Policy
Awareness and Training
STRATEGIC�ANALYSIS� QUESTIONNAIRE�
5 Organisation and Personnel
5 Awareness and Training
Communication
5 Communication
5 Operational Management
Operational Management
5 Emergency Planning
5 Monitoring
5 Review and Audit
Emergency Planning Monitoring
Review and Audit
www.ecoslc.eu�


SDM�
SELF�DIAGNOSIS�METHOD�
Conference Paper
207
EcoPorts Pers Certification

Port Environmental review System (PERS)
#1 The only port sector specific environmental management standard
#2 In line with the requirements of ISO 14001
#3 Independently reviewed and certified by Lloyds Register
The 10 Priorities for European Ports in 2022 for 2022
The 10 Priorities for Oceania Ports in 2022 for 2022

Conference Paper
208
1� 2� Relationship�with� local�community� Dredging:�disposal� 3� 4� Water�Quality� Air�Quality� 5� 9� Habitat/Ecosystem� loss�(land)� Soil�Contamination� (land)� 6� Hazardous�Cargo� (handling/storage)� 7� Noise� 8� Ships�Waste� 10�
Priorities�of�Ports�in� Oceania�for�2022� Contaminated�Land�
Top�10�Environmental�
PERS Certified
Decarbonising Operations
5 Hybrid Electric Cranes
5 Retail PPA 100% Renewable Energy

5 SBTi Endorsed 1.5° trajectory
PERS Certified
Citizen Science Program
Raise local awareness and collect research data on the value of Corio Bay’s blue carbon ecosystems for climate change mitigation.


150+ GeelongPort employees and community members involved.


Conference Paper 209
Diagnosis Method
Diagnosis
PERS TASMANI A QUEENSLAN QUEENSLAN D QUEENSLAN D QUEENSLAN D NE W SOUT WALE S 2021 2021 2021 2022 2022 2019/202 Por t o f Hobar t Por t o f Townsvill e Por t o f Macka y Por t o f Brisban e Gladston e Por t Por t o f Por t o f Bel l Ba y Corporatio n Por t o f Devonpor t Por t o f Berni e www.ecoslc.e PERS Certified QUEENSLAN D NE W SOUT H VICTORI A WALE S 2019/2021 2021 Gladston e Por t Por t o f Newcastl e Geelon g Por t Corporatio n PERS Certified
Network Members - Oceania Self
Network MembersOceania Self
Method
Who are EcoPorts?
1. Environmental management is a key component of a commercially successful port.
2. EcoPorts is an environmental management system and global standard, especially designed for ports and port terminals while using the basic structure of international standards like ISO 14001.
3. Every port is unique therefore it teaches ports and port terminals to introduce an own environmental management system based on EcoPorts global standards.
4. EcoPorts is designed to start a process of permanent environmental improvement and aims at a long- term effect of its approach. In this way it is possible to add sustainability to this process.
5. Therefore, EcoPorts starts with the setup of an overview of environmental facts (“environmental aspect register”) that shows what environmental impact each of the operations of the port, transport and logistics process has on the environment. These include the operations of the port authority, the port manager and port operator, as well as the companies in the port and port terminal and may include the supply chain.
6. In this way the port gets insight in the effects of its own business model on the environment.
7. In 2022 the top 10 of environmental priorities for port operations in Europe are:
8. This insight in the port process is starting point for the design of an environmental strategy, policy and action plan that can reduce this environmental impact of and therefore may also improve its business model.
9. The strategy and business model of the port and the environmental impact of the business operations of a port are closely related. The EcoPorts system to reduce the environmental impact of port operations can have long term and sustainable effects if the business plan of the port takes permanent improvement of the
Conference Paper
210
for 2022
environmental impact of its operations“onboard”. In this way environmental improvement can become part of the business model.
10. This approach delivers options for initiatives to design environmental and sustainable solutions that can cover their own costs. Experience from all EcoPorts certified ports is that for example the investment in the EcoPorts certification process is earned back by environmental cost improvements in the first year of certification.
11. EcoPorts is also a system to monitor the results of their environmental improvement plan. These results can be positive or negative. EcoPorts requires ports to explain the reasons for these results. In the case of negative results ports need to deliver a new action plan for improve these results. An action plan for environmental risk prevention can be presented.
12. The port can use this information and other information from their strategy, policy, action plan and results to produce an EcoPorts environmental report in a systematic way. The port can inform with this report its stakeholders about its actions to improve the environment and its results in a systematic way. Stakeholders of the port are a wide group of persons and organisations such as: own port personnel, inhabitants of the port city, companies in the port area, governmental authorities, companies that finance or insure the port.
13. New laws and regulations such as Climate Laws, new policies such as from financiers of this process or the circular economy approach require concrete improvement targets, timelines and reporting of results and an independent assessment.
14. The report needs to include successes of environmental management and especially examples of good environmental and sustainable practice. In this way ports can share good practices with others to stimulate environmental improvement of the port sector.
15. The International Quality EMS Standard of EcoPorts PERS is recognized by ESPO, AAPA, IAPH, WPSP, World Bank (European Investment Bank, and European Bank for Reconstruction & Development), the United Nations Environment Programme (UNEP), the African Ports Association, the Arab Sea Ports Federation, the Taiwan Ports International Corporation (TIPC) and the InterAmerican Committee for Ports (Organization of the American States). Representatives from major insurance companies state thata port’s environmental performance and especially its risk prevention policy is “factoredin” to calculations of premiums; and that standards such as PERS are recognized components of a responsible approach.
ECOPORTS PERS certified port: “The ECOPORTS Network is exactly the sparring partner to find the right solutions for environmental and sustainable issues of our daily operations”
ECOPORTS PERS certified Port: “results already seen within 1 year”
Conference Paper 211
Global Introduction of EcoPorts
These Ports and Terminals are greening the global port, transport and logistics process and network
Conference Paper 212
The network is growing Join this port, transport and logistics approach!
Newcastle Oceania

Conference Contacts:
Josie Gilchriest Conference Producer, Conferences
Tel: +44 1329 825335
Email: jgilchriest@mercatormedia.com
Arrate Landera Media Sales Manager
Tel: +44 1329 825335
Email: mcharlesbailey@mercatormedia.com
Ryan Coulling Sales Executive
Tel: +44 1329 825335
Email: rcoulling@mercatormedia.com
Anne-Marie Causer News Editor
Tel +44 1329 825335
Email: ACauser@mercatormedia.com
Marianne Rasmussen-Coulling Events Director
Tel: +44 1329 825335
Email: mrasmussen@mercatormedia.com
Andrew Webster Chief Executive Officer
Mercator Media Limited
Spinnaker House, Waterside Gardens, Fareham, Hampshire, PO16 8SD, UK
t: +44 1329 825335, f: +44 1329 550192 www.mercatormedia.com
The organisers and publishers accept no responsibility for the statements made neither in this publication nor for any errors or omissions which may have occurred.
©Mercator Media Limited 2023
Contact Us 213
2023 Events Schedule
Greenport Congress Oceania

15-17 February 2023, Newcastle, Australia
The Greenport Oceania offers the latest in sustainable development and environmental practices within the ports environment portstrategy com/greenport-congress-oceania

Coastlink Conference
3-4 May 2023, Royal Liver Building, Liverpool, UK
Coastlink is a pan-European network dedicated to the promotion of short sea feeder shipping and the intermodal networks through the ports that support a competitive and sustainable supply chain. coastlink.co.uk

Seawork, incorporating Marine Civils

13-15 June 2023, Mayflower Park, Southampton, UK Europe’s leading annual three day commercial marine exhibition and conference Seawork incorporates Marine Civils - Europe's leading event dedicated to showcasing the latest equipment and solutions for marine, coastal and other challenging civil engineering projects. Attend in person and virtual seawork.com
Commercial Marine Network Conference & Business Briefings

13-15 June 2023, Mayflower Park, Southampton, UK
Get Set for Workboat 2050, with expert panellists navigating the waters of decarbonisation compliance and looking at practical applications across the workboat industry The conference venue also hosts free-to-attend business briefings, including sessions with the MOD & DIT seawork com/our-conferences
Seawork Conferences - Decarbonisation & OPEX Reduction

14 June 2023, Mayflower Park, Southampton, UK
The all-new 2023 Seawork Conferences will help commercial marine and workboat operators face the challenge of reducing operational expenditure at the same time as meeting the mandatory targets to decarbonise operations. Owners and operators will learn how their businesses can create cost savings whilst benefitting from the latest developments in alternative fuels, hybrid propulsion, technology, and design seawork com/ourconferences
18th Greenport Congress & Cruise
18-20 October 2023 - Lisbon
The yearly congress provides environmental departments in Ports and Terminals with methods of greening their operations portstrategy.com/greenport-cruise-and-congress
44th Propulsion & Future Fuels Conference
21-23 November 2023, Hamburg, Germany
The Propulsion & Future Fuels Conference will be returning to Hamburg to explore the latest emissions-cutting technology and shipping propulsion innovation in association with The Motorship propulsionconference.com

conferences@mercatormedia com
Mercator Media Ltd, Spinnaker House, Waterside Gardens, Fareham, Hampshire, PO16 8SD,UK • Tel: +44 1329 825335 Fax: +441329 550192


Host Port:

Join
us in Lisbon
See you in October
Meet and network with over 200 attendees representing port authorities, terminal operators and shipping lines.
For more information on attending, sponsoring or speaking contact the events team visit: greenport.com/congress contact: +44 1329 825335 or email: congress@greenport.com


Media partners:

#GPCongress
