THE ISM MANUFACTURING REPORT
MANUFACTURING TIDBITS: RESHORING AND FDI UP 53%, A NEW RECORD
CORNELL STUDY CONFIRMS: IMPORTING CHINESE SOLAR EXACERBATES

Brought to you by www.jacketmediaco.com The Manufacturing & Business Podcast Network LISTEN TO OUR PODCASTS AT: OUR PODCASTS: MARCH ISM PMI: 46.3% Released April 3rd -The Full Executive Summary Report On Business - Page 16 [ FROM IMPORT DEPENDENCE TO SOLAR POWER DOMINANCE: A LOOK AT THE FUTURE OF U.S. SOLAR PRODUCTION
PAGE 16
PAGE 10
CLIMATE
PAGE 12 PAGE 8
PAGE 38
PAGE 40
CHANGE
MATERIALS OUTLOOK
AUTOMOTIVE OUTLOOK


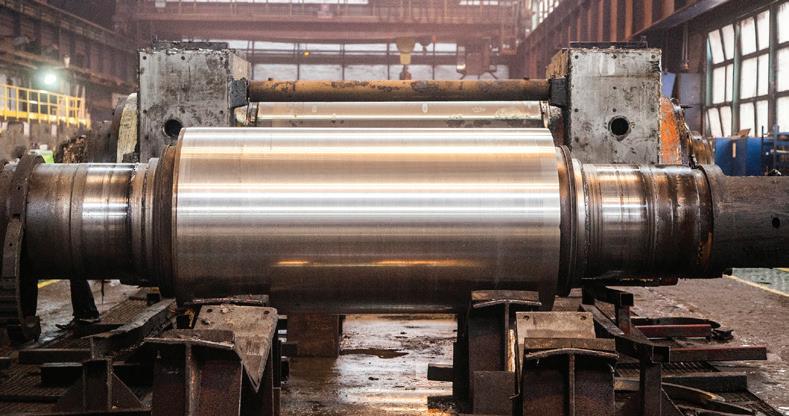
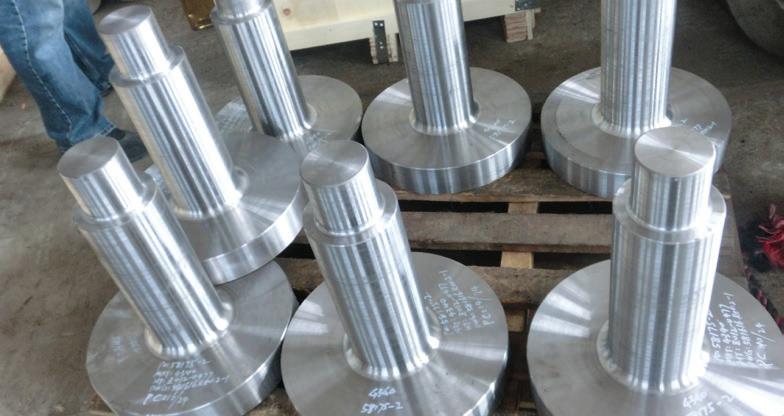
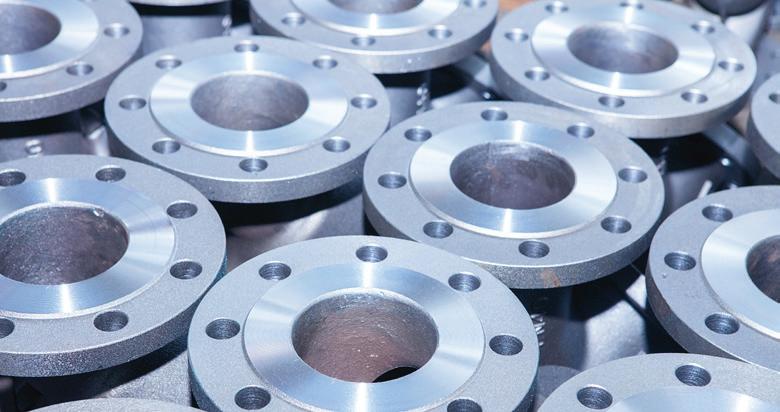

3 Manufacturing Outlook /April 2023 Forging Deliveries Got You Down? How About 8-10 Weeks? U.S. (973) 276-5000 Toll Free (800) 600-9290 Canada (416) 363-2244 STEELFORGE.COM • SALES@STEELFORGE.COM ISO 9001/AS 9100D Registered ALLOY • CARBON • STAINLESS • TOOL STEEL • NICKEL • ALUMINUM • TITANIUM
© 2023 Jacket Media Co. No part of this publication may be reproduced or used in any form without the prior written permission of the publisher. Manufacturing Outlook is a registered trademark of Jacket Media Co.
A Thousand Opinions… but No Answers by Lewis A. Weiss
Manufacturing In The US Takes A Leap In March by Royce Lowe
COVER STORY: FROM IMPORT DEPENDENCE TO SOLAR POWER DOMINANCE: A LOOK AT THE FUTURE OF U.S. SOLAR PRODUCTION by Jessica Baron
OUTLOOK 24
AFRICA
Blackouts; South Africa’s Huge Problem by Royce Lowe
27
EUROZONE OUTLOOK
Strength and Growth Continue by Chris Anderson
ASIA OUTLOOK
U.S. Solar Manufacturing Renaissance Needs China And Southeast Asia by Christine Casati
Boeing and Saudis and 787s by Royce Lowe
Reshoring and Foreign Direct Investment Up 53%, a New Record by The Reshoring Initiative
Cornell Study Confirms: Importing Chinese Solar Exacerbates Climate Change by The Coalition for a Prosperous America
The World and Russian Oil and Gas by Royce Lowe
MATERIALS OUTLOOK 16
MANUFACTURING TIDBITS 10 12 14 40
Grabbing for Africa’s Minerals by Royce Lowe
AUTOMOTIVE OUTLOOK
MANUFACTURING REPORT ON
The Manufacturing PMI is 46.3%
20
by Dr. Chris Kuehl The Elephant in the Room SOUTH AMERICAN OUTLOOK
Andreas and His Chinese EV by Royce Lowe
Learning the Language of Cybersecurity by Ken Fanger
4 Manufacturing Outlook /April 2023
Publisher
TIM
ROYCE
KEN
Advertising
JACKET
75
(973)
OF CONTENTS
PUBLISHER’S
5
LEWIS A WEISS Editor in Chief
GRADY Creative Director CRAIG ROVERE Contributing Writers
LOWE JESSICA BARON CHRIS KUEHL CHRIS ANDERSON CHRISTINE CASATI
FANGER Production Manager LINDA HOPLER
ADVERTISE@MFGTALKRADIO.COM Editorial Office
MEDIA CO.
LANE ROAD FAIRFIELD, NJ 07004
808-8300 TABLE
STATEMENT
28
AEROSPACE OUTLOOK 32
ENERGY
34
MANUFACTURING OUTLOOK 6
CYBER
42 ISSUES
44
OUTLOOK
SECURITY OUTLOOK
OUTLOOK
38
Open call for... Contributing Writers for new and existing content. Let’s start a conversation –Contact us at info@jacketmediaco.com ISM
Future Leaders by Royce Lowe BUSINESS
8
22
U.S. Domestic Market Share Index Slightly Increases by The Coalition for a Prosperous America
NORTH AMERICAN OUTLOOK
by Dr. Royce Lowe Bolivia’s Lithium Dilemma
A Thousand Opinions…but No Answers
Recession - to be or not to be, that is the question. While it is interesting to follow all the tea leaves floating in the tempest, no one has a crystal ball about whether a recession will occur. It seems that the Fed will remain on course to crush inflation, which usually also crushes economic expansion. The banks, at least some, have been caught in a bond yield problem and are having to sell their 2-year bonds at a discount to cover their short-term deposit withdrawals or loan losses.
When one leg of your stool is wobbly, it is annoying; when two are wobbly and the third is questionable, people tend to look for more solid ground without landing on it as the stool collapses. The next person won’t use that stool, and may feel wobbliness in theirs, whether real or imagined. They ask the person next to them seeking reassurance. Suddenly, everybody wants a nice, solid chair.
Recessions are often caused by fear factors, and the pundits are doing their very best to pump those into the conversation on mainstream media. But most of manufacturing isn’t feeling any serious wobble in their sector of the economy. They are becoming cautious, with more emphasis on invoice collection and less on extended payment terms, but their order books are still fairly solid. And they continue to hold onto employees, which flies in the face of the very thing that signals to the Fed that their strategy is becoming effective – rising unemployment. The target – about 5% unemployment.
That doesn’t seem like a far stretch from 3.4%, but it means millions of Americans will lose their jobs. They won’t have the funds to spend. Demand will fall. Order books will suddenly contract. More layoffs will begin, and before the Fed can stop the derailment, the economic train comes off the tracks. Getting it back up and running then becomes the Fed focus, but in the meantime, there is an economic mess that will have unpleasant impacts for everyday Americans for years to come, trying to recover from their personal downturn.
Inflation is cooling, albeit, slowly, and not fast enough for the Fed. The Fed is moderating its interest rate hikes, with the latest being just a quarter of a point, but the problem is knowing when you have gone a few basis points too far. Unfortunately, the Fed often doesn’t know when the train cars will begin jumping the rails. And when it happens, it is rapid-fire and too late to prevent. They don’t slow the train – it is crash or no crash.
Manufacturing Outlook continues to be encouraged by the resilience in the manufacturing sector. Keep in mind that the manufacturing industry has been the canary in the coal mine going into every recession, and the breath of fresh air coming out of every recession. We encourage our readers to observe it carefully and closely. At any moment in 2023, some action by the Federal Reserve Bank or the federal government could create the chain reaction of an economic derailment.
Tune in to the Manufacturing Talk Radio Podcast and listen to the ISM Report on Business® recorded on Monday, April 3rd with Manufacturing Committee Chair, Mr. Tim Fiore, and the episode recorded on Wednesday, April 5th with the Services Committee Chair, Mr. Anthony Nieves. These two discussions are the most in-depth analysis presented by the Institute for Supply Management on any media platform, and contain signals about economic conditions ahead. Keep a close eye on employment in this report, which showed its first reading below 50 in March, 2023, in the manufacturing sector. Will this become a trend, as the Fed wants, or was this an errant blip on the radar?


Be sure to listen to the Manufacturing Talk Radio episode with Dr. Chris Kuehl around the ASIS report, or Armada Strategic Intelligence System for manufacturing. It is showing an almost eerie 95%+ accuracy rate in its economic projections for the next several months. Dr. Kuehl joins hosts Lew Weiss and Tim Grady about mid-month to provide the latest strategic update in a tightly packed 23-minute discussion.
There is always more, including the development of solar power that we highlight in this issue, including the reshoring of this technology and manufacturing to U.S. shores and its heartland. n
Lewis A. Weiss, Publisher
Contact
laweiss@mfgtalkradio.com

for comments, suggestions and ideas and guest requests for MFGTALKRADIO.COM podcast or any of our podcasts.


5 Manufacturing Outlook /April 2023
PUBLISHERS STATEMENT FOLLOW US: SUBSCRIBE
MANUFACTURING OUTLOOK

6 Manufacturing Outlook /April 2023 MANUFACTURING OUTLOOK
continued
MANUFACTURING IN U.S. TAKES A LEAP IN MARCH. EUROPE IMPROVES, BUT ALMOST ALL DUE TO SERVICES
By: Royce Lowe
The U.S. inflation rate is 6.0% for the 12 months ended February 2023. Data from Armada Strategic Intelligence System (ASIS) suggests that manufacturing industrial production will tend to stabilize in Q2, then improve through the year end. As for the primary metal sector, there will be a good improvement in Q2 and Q3, before a downturn in Q4. The fabricated metals sector will “blip” in Q3, before receding in Q4 and through the first half of 2024, when some recovery will be seen in the back end of the year.
People in the manufacture and distribution of goods moved into heavy inventory building in 2022, and 70% of those companies find themselves overstocked. At the same time, global inventories of non-ferrous metals are at multi-decade lows. The aerospace and miscellaneous transportation sector looks healthy through the rest of 2023. Computer and electronic products will pick up steam starting Q3 of this year. The machinery sector will suffer a lack of demand through mid-2024. Motor vehicles and parts will see good demand through 2023, with a downward trend for early 2024, and a correction in Q2 of that year.
In the U.S., the “flash” composite index for March is at 53.3 versus 50.2 in February; flash services at 53.8 versus 50.6; the manufacturing production index was at 51.0 versus 47.4 and the manufacturing PMI reading was at 49.3 versus 47.3.
Demand was up and new order growth returned. U.S. companies saw a renewed expansion in business activity in March. Production grew at a solid pace that was the fastest since May 2022, as demand conditions improved and new order growth returned. Both manufacturers and service providers registered upturns in output, with service sector firms driving the increase.
Total U.S. new vehicle sales for March 2023, including retail and non-retail transactions, are projected to reach 1,330,700 units, a 6.2% increase from March 2022, according to a joint forecast from J.D. Power and LMC Automotive. March 2023 has the same number of selling days as March 2022. New-vehicle total sales for Q1 2023 are projected to reach 3,526,700 units, a 7.3% increase from Q1 2022 when adjusted for selling days.
The UK slipped again, with the composite index back at 52.2 versus 53.1 in February; services at 52.8 versus 53.5, manufacturing production at 49.0 versus 50.9 and manufacturing at 48.0 versus 49.3.
Japan’s services PMI is still on the rise, with a flash composite index of 51.9 versus February’s 51.1; services at 54.2 versus 54.0, and manufacturing production at 47.4 versus 45.3.
According to the China Association of Automobile Manufacturers, auto sales in China surged by 13.5% from
a year earlier, to nearly 1.98 million units in February 2023, rebounding sharply from a 35% plunge in the previous month. Data from the China Association of Automobile Manufacturers (CAAM) showed it was the first increase in car sales in four months. Meanwhile, sales of NEVs jumped 55.9 percent year-on-year to 525,000 units in February. For the first two months of the year, car sales fell by 15.2 percent from a year earlier to 3.625 million units, reversing from a 7.5 percent growth in the same period of 2022.
Global inventories of non-ferrous metals are reported at multi-decade lows. The prices of non-ferrous metals through most of March were on the decline, but not to the same extent as during February. Aluminum went from $1.18 to $1.15 per lb during March, but 60 days ago was at $1.70; copper from $4.11 to $4.08, 60 days ago at 4.20; nickel from $11.70 to $10.10, 60 days ago at $12.8 and zinc from $1.40. to $1.32, 60 days ago at $1.32. LME stocks are trending up a little.
The global manufacturing situation is on a slow improvement path. Demand is not the best, but there are several bright patches, such as aerospace, motor vehicles, and computer and electronic products. Car sales are up. The words inflation and recession are still on front pages, and naturally impact manufacturing industries. The latest results from U.S. manufacturers are encouraging. With spring and lower energy consumption, the world is a little more optimistic.
Author profile: Royce Lowe, Manufacturing Talk Radio, UK and EU International Correspondent, Contributing Writer, Manufacturing Outlook. n

7 Manufacturing Outlook /April 2023 MANUFACTURING OUTLOOK
From Import Dependence to Solar Power Dominance: A Look at the Future of U.S. Solar Production
 by Jessica Baron
U.S. solar panel production has grown rapidly in recent years, with significant expansion expected in the near future. This is partly due to the $1.2 trillion U.S. Bipartisan Infrastructure Law (BIL) which has earmarked funds for raw materials mining, factory production, and utility-level adoption, as well as tax credits to encourage consumer adoption of photovoltaic (PV) solar systems.
However, the U.S. still faces challenges before it can become a dominant player in the solar energy market.
Trends in U.S. Consumer Adoption of Solar Panels
Solar panel adoption is growing steadily in the U.S. for small and residential installations, and there is currently enough solar equipment to power 25 million American homes.
Increasing U.S. consumer adoption of solar panels has been driven by the availability of government incentives and a growing awareness of solar’s environmental benefits. Although the price of residential photovoltaics (PV) and their installation has significantly decreased for residential consumers, uptake is still the highest among high-income Americans with high-value homes. However, the
8 Manufacturing Outlook /April 2023 continued
COVER STORY
incomes of solar adopters have been slowly moving toward the median in recent years.
Between 2020 and 2021, small-scale solar capacity for residential homes rose 35% from 2.9 to 3.9 gigawatts (GWdc). But 2022 set a record of 40% growth for residential homes, which added 6 GWdc of solar installations.
Yet, while the U.S. installed 20.2 GWdc of solar PV capacity in 2022 for a total of 142.3 GWdc and solar made up 50% of the new domestic electricity-generating capacity, that was actually a growth reduction of 16% compared to 2021. At the root of the problem were supply chain issues, which led to a 31% reduction in solar adoption at the utility level.
The History and Future of U.S. Solar Panel Production
In 1978, U.S. companies produced 95% of the global market share of solar panels. By 1984, that number was 55%; by 1990, it was 32%; by 2005, it was a mere 9%. The reasons behind the decline are complex but are partly due to the growth of Japanese consumer electronic companies and their investment in solar cell production to
complement new semiconductor investments. This foresight made them dominant in solar panel production at the turn of the century, even though much of the production has since shifted to China and Taiwan.
According to the Solar Energy Industries Association (SEIA), dozens of companies have made announcements about opening factories addressing all parts of the supply chain in the U.S., which could add 47 gigawatts (GW) of module manufacturing capacity, and well over 100 gigawatt-hours of battery manufacturing. But for the U.S. to develop capacity in all parts of the supply chain—silicon ingots, wafers, solar cells, and solar panels—it must first grapple with China’s dominance in polysilicon production, a critical component of solar panels.
Boosting U.S. Solar Production Along the Supply Chain

The U.S. currently has eight active polysilicon or silicon metal facilities, with the largest in Michigan and West Virginia. However, the Department of Energy reports no active domestic polysilicon ingot manufacturing. Furthermore, just one U.S. facility (run by CubicPV in Massachusetts) refines ingots into polysilicon wafers. There
is zero domestic solar cell manufacturing capacity. However, there are sixteen domestic polysilicon module manufacturers, and promise to add more from companies, including Qcells, Enel North America and 3Sun USA, Mission Solar, and Philadelphia Solar.
Crucial parts of the supply chain remain overseas, but this is set to change. In January 2023, Hanwha Qcells pledged $2.5 billion to manufacture solar ingots, wafers, cells, and finished modules in Cartersville and Dalton, Georgia. The South Korean solar manufacturer Hanwha Solutions plans to build a massive solar manufacturing facility in the United States to produce ingots, wafers, and solar panels by 2025.
Last year, SPI Energy signed a letter of intent to set up wafer production in the U.S., and Convalt Energy pledged to produce ingots, wafers, and cells in upstate New York by 2024. First Solar has not only invested over $1 billion in expanding its footprint in Ohio and plans to open new facilities in the Southeast, but they’ve found a workaround for mining and importing silicon by replacing it with thinfilm cadmium telluride (CdTe).
A Bright Future for U.S. Solar Power
In 2021, the U.S. imported 80% of its solar panel modules. But new production facilities have sparked predictions that the U.S. solar fleet will reach 700 GWdc by 2033 and 1,600 GWdc by 2050, in which case solar would account for half of U.S. electricity. Currently, only 3.4% of domestic electricity is generated from solar power.
If all goes well, the supply chain issues that interrupted the growth of U.S. solar energy in 2022 will become a thing of the past.
Author profile: Jessica Baron is a freelance writer covering the fields of science and technology. n

9 Manufacturing Outlook /April 2023 COVER STORY
Reshoring and FDI Up 53%, a New Record
by The Reshoring Initiative
Sarasota, FL, March 24th, 2023 — reshoring + Foreign Direct Investment (FDI) job announcements in 2022 were at the highest rate ever recorded. 4Q announcements accelerated even more than anticipated due to the Chips and Infrastructure Acts and deglobalization trends. Top takeaways:
• 364,000 reshoring + FDI jobs announced for 2022, up 53% from 2021’s record.
• 2022 brought the total number of job announcements since 2010 to nearly 1.6 million.
• EV batteries make Electrical Equipment the top industry.
With the IRA, Chips Act, and Infrastructure Bill, the U.S. Government is finally warming up to an industrial policy, though a more comprehensive plan could be achieved at a lower cost.
Supply chain gaps and the need for greater self-sufficiency set the stage for the current upward trend in reshoring. The risks of a Taiwan-China conflict or China voluntarily decoupling are focusing those concerns. Destabilizing geo-political and climate forces have brought to light our vulnerabilities and the need to address them. The White House responded with the Inflation Reduction Act, Chips Act and Infrastructure Bill, offering some direction and financial security to the companies and industries intent on filling the gaps. These government actions are necessary in the short run but are not sufficient since they do not improve the U.S.’ uncompetitive cost structure. A true industrial policy would level the cost playing field via comprehensive actions such as massive skilled workforce investments, a 25% lower USD and retention of immediate expensing of capital investments.
“The current actions and momentum are a great start. A true industrial policy would accelerate the trend and increase U.S. manufacturing by 40%, 5 million jobs. Reshoring will reduce the trade and budget deficits and make the U.S. safer, more self-reliant and resilient,” said Harry Moser, Founder and President of the Reshoring Initiative.

About the Report
The Reshoring Initiative’s 2022 Data Report contains data on U.S. reshoring and FDI by companies that have shifted production or sourcing from offshore to the United States.
“We publish this data quarterly to show companies that their peers are successfully reshoring and that they should reevaluate their sourcing and siting decisions,” said Harry Moser, Founder and President of the Re-
10 Manufacturing Outlook /April 2023
MANUFACTURING TIDBITS
shoring Initiative. “With 5 million manufacturing jobs still offshore, as measured by our $1.2 trillion/year goods trade deficit, there is potential for much more growth. We also call on the administration and Congress to enact policy changes to make the United States competitive again.”
About the Reshoring Initiative

A 55-year manufacturing industry veteran and retired President of GF Machining Solutions, Harry Moser founded the Reshoring Initiative to move lost jobs back to the U.S. He was named to the Industry Week and Association for Manufacturing Excellence (AME) Halls of Fame for his efforts with the Reshoring Initiative. Additional information on the Reshoring Initiative and its many sponsoring associations and companies is available at reshorenow.org.


The Reshoring Initiative provides the media with custom analyses of specific regions or industries. Contact Harry Moser to inquire.
MEDIA CONTACTS: Harry Moser, President
Reshoring Initiative 847.867.1144 Harry.Moser@reshorenow.org or dgs Marketing Engineers® Chuck Bates, Public Relations Director 317.813.2230
bates@dgsmarketing.com n
11 Manufacturing Outlook /April 2023
MANUFACTURING TIDBITS
Source: Reshoring Initiative Library data
Manufacturing Job Announcements per Year, Reshoring + FDI, 2010 thru 2022
Cornell Study Confirms: Importing Chinese Solar Exacerbates Climate Change
WASHINGTON — A recent study by Cornell University researchers confirms that reshoring the solar supply chain and boosting domestic solar manufacturing would significantly cut greenhouse gas emissions by 30%. “If reshored PV manufacturing is achieved by 2035, the estimated GHG emissions and energy consumption from panel production would
be 30% and 13% lower, respectively, than having relied on trading partners as in 2020,” the report states. “If the reshored manufacturing target is met by 2050, the climate impacts and energy use would then be reduced by 33% and 17%.”

As NBC recently reported, “research from the Center for Research on
Energy and Clean Air and GEM published late last month showed China approved the highest number of new coal-fired plants since 2015 last year.
“Incredibly, Beijing authorized 106 gigawatts of new coal power capacity in 2022, four times higher than a year earlier and the equivalent of 100 large-fired power plants, the research said.”
12 Manufacturing Outlook /April 2023
MANUFACTURING TIDBITS
Boosting Domestic Solar Manufacturing Would Gut Greenhouse Gas Emissions by 30%
“This study is yet another data point proving that importing Chinese solar—which is made from coalfired power plants and Uyghur forced labor—is bad for the environment, unethical, and harms American manufacturers that are forced to compete against China’s illegal trade violations,” said CPA Chair Zach Mottl. “If the Biden administration, and its Chinese apologists in the Climate Policy Office, are serious about addressing climate change, it would immediately revoke the Solar Emergency Declaration and take additional steps to support American solar manufacturers.”
The Coalition for a Prosperous America (CPA) has consistently called for reshoring the solar supply chain and boosting domestic solar manufacturing, and pointed out the dangers of continued reliance on Chinese solar imports.
Last year the Biden administration took unprecedented steps to protect Chinese solar manufacturers that are illegally violating U.S. trade law. Biden’s Solar Emergency Declaration effectively neutralizes the Department of Commerce’s investigation into whether Chinese solar manufacturers are illegally circumventing antidumping and countervailing duty (AD/CVD) orders. In December, Commerce issued a preliminary determination that found that Chinese companies operating in Malaysia, Thailand, Vietnam, and Cambodia are illegally circumventing existing antidumping and countervailing (AD/ CVD) duty orders on solar cells and modules from China.
Instead of supporting robust enforcement of U.S. trade laws, the emergency declaration gives Chinese manufacturers a free pass to illegally circumvent AD/CVD orders for
24 months and protects them from retroactive duties — regardless of what Commerce finds in its final investigation. This is not merely a 2-year tariff suspension, however. In fact, it is a complete “get out of jail free card” for China forever. It allows Chinese solar manufacturers to avoid tariffs forever by merely certifying that they produce wafers outside of China — something the Chinese will easily be able to do prior to the end of the two-year suspension.
Biden’s emergency declaration came after intense lobbying by the Solar Energy Industries Association (SEIA), a trade association that was exposed as a front for Chinese solar manufacturers and whose members have been implicated in the use of forced labor in Xinjiang. Last year, the Commerce Department announced it was investigating three of SEIA’s Chinese members for illegal trade activity.
In a scathing report released last year, The American Prospect exposed SEIA as failing to “disclose that among its leading members are the same Chinese-owned companies that are implicated not only in the investi-

gation of illegal tariff evasion, but in the use of slave labor to produce solar components and coal-fired energy to power the factories.” Additionally, The American Prospect unmasked that SEIA’s “main strategy for the past ten years has been to lament restrictions on Chinese solar production.”
The American Prospect reports, “SEIA’s membership includes U.S. subsidiaries of Chinese producers JinkoSolar, JA Solar, Trina Solar, BYD, and LONGi Solar, which are the dominant solar component manufacturers in the world.”
About CPA
CPA is the only national organization representing exclusively domestic producers across many sectors. We are a bipartisan coalition of manufacturers, farmers, ranchers, and labor organizations that make and grow things in the United States.
American jobs, strength, and well-being are built and sustained by growing America’s productive capacity. We value quality employment, national security, and domestic self- sufficiency over cheap consumption. n
13 Manufacturing Outlook /April 2023 MANUFACTURING TIDBITS
U.S. Domestic Market Share Index Slightly Increases
by The Coalition for a Prosperous America
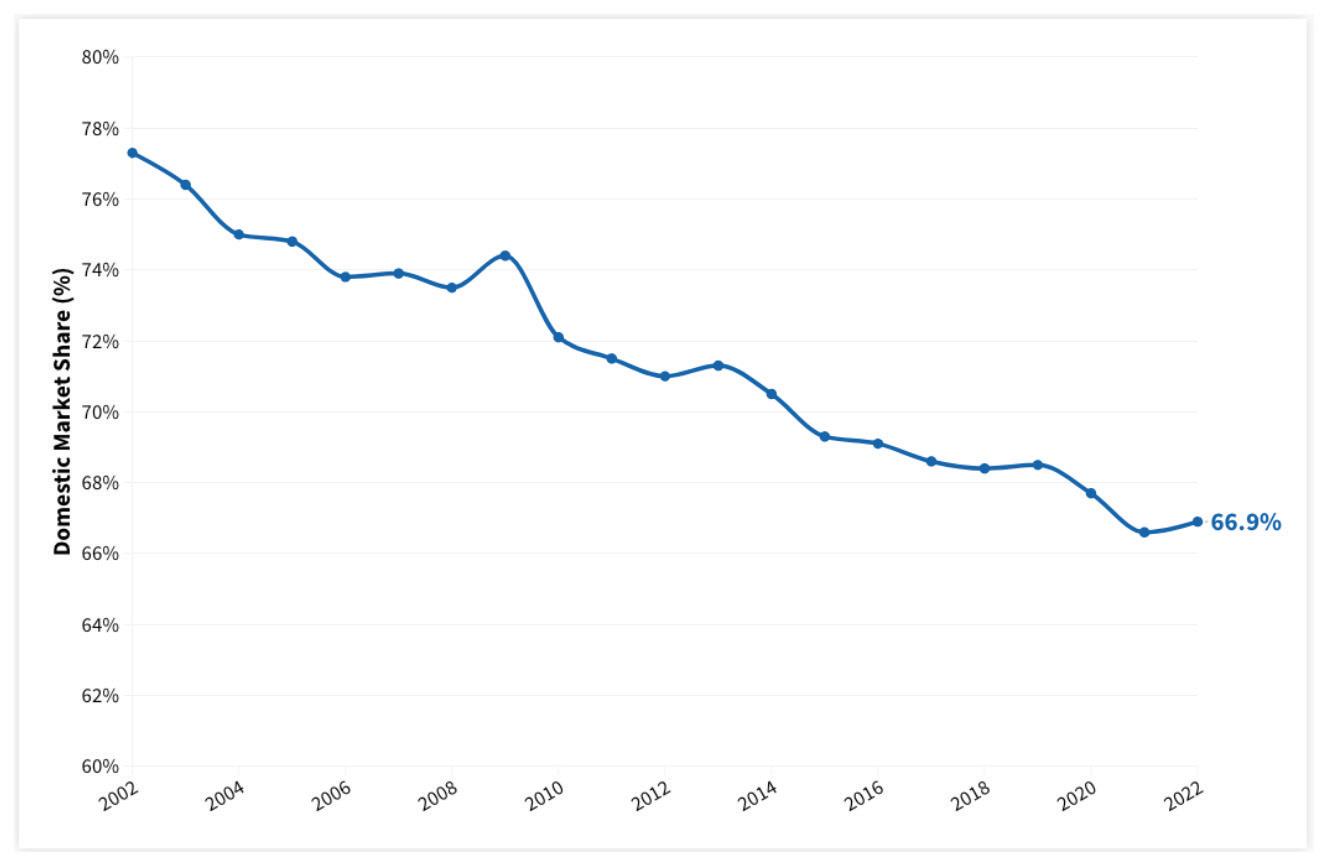
The Coalition for a Prosperous America (CPA) today released a quarterly update to the Domestic Market Share Index (DMSI) which measures the market share of U.S. manufacturing producers in the U.S. home market. The DMSI increased slightly to 67.8 in the fourth quarter 2022, up 1.3 percentage points from the third quarter, reflecting a slowdown in imports at the end of the year. For the entire year, the index was 66.9 in 2022, an increase of 0.3 percentage points from the previous year. After imports surged in 2021 and the first three quarters of 2022, imports stabilized in the fourth quarter.
While policy makers often talk of access to foreign markets, the biggest market in the world is the U.S. consumer market where producers have lost market share in the last decades. The U.S. trade deficit in manufactured goods rose 13% to $1.199 trillion last year, an all-time record. The manufacturing trade deficit grew at a faster rate than the overall goods trade deficit in 2022, which increased by 9%.
“U.S. manufacturers continue to lose share in the U.S. market, and our trade deficit in manufactured goods set a new record in 2022,” said CPA
chief economist Jeff Ferry. “Rebuilding domestic production is the only way to create good jobs, boost economic growth, and address growing inequality in America.”
The DMSI measures the share that U.S. domestic producers hold of the U.S. market for manufactured goods. A DMSI of 66.9 means that foreign producers hold about one third of the U.S. market for manufactured goods in the form of imports. The U.S. market for manufactured goods, worth about $7.2 trillion, is the world’s largest market. Since 2002, U.S. manufacturers have lost more than
14 Manufacturing Outlook /April 2023
MANUFACTURING TIDBITS
ten percentage points of home market share, falling from 77.3% in 2002 to 66.9% for 2022. This represents a huge setback for U.S. producers, who have traditionally been strongest in the home market.
In Q4, gains were strongest among producers of primary metals and textiles, each gaining 4.4 percentage points of the domestic market. Producers of apparel also regained market share, increasing from 7.7% to 11.6%. Yet, all three of these industries remain below the average DMSI for the overall manufacturing industry. The apparel sector remains the sector in which domestic manufacturers hold the smallest percentage of the domestic market. Among sectors that lost the most market share over the quarter, U.S. motor vehicles manufacturers lost 1.1 percentage points of the domestic market falling to a 67.1% share of the domestic market.
By import source, the European Union gained 0.8 percentage points of the U.S. domestic market in
2022, increasing from 6.7% to 7.5%. Overtaking China, the 27-nation EU became the largest source of manufactured goods to the U.S. in the fourth quarter. Gains of market share by EU countries were most pronounced in Ireland and Germany. The two nations gained market share in chemical products by 2.1 percentage points combined. Motor vehicle imports from Germany also gained 0.6 percentage points.
China’s share of the market for manufactured goods in the U.S. fell by half a percentage point in 2022 to its lowest level since 2012. Since the implementation of Section 301 tariffs in 2018, China’s share of the U.S. domestic manufactured goods market has fallen from a record high of 8.1% to 6.8% in 2022. Textiles and computer & electronic products were the largest drivers of the decline, losing 2.4 and 2.1 percentage points of market share, respectively. For the year, China lost market share in 12 of the 19 subsectors. While China continues to hold the largest share of the U.S. market by a single foreign
country, policies aimed at decoupling the two economies have had an impact to decrease China’s share of the U.S. market.
Canada and Mexico’s combined share of the U.S. domestic market rose only 0.1 percentage point in 2022 despite the buzz about friendshoring. In 2022, the USMCA partners had a combined share of 9.1%. Mexico is the second largest source of manufactured goods in the U.S. with a 5.5% share and Canada is third with 3.6%.
About CPA
CPA is the only national organization representing exclusively domestic producers across many sectors. We are a bipartisan coalition of manufacturers, farmers, ranchers, and labor organizations that make and grow things in the United States. n
15 Manufacturing Outlook /April 2023 MANUFACTURING TIDBITS
Figure 1: Domestic Market Share Index (DMSI) (2002-2022)
THE INSTITUTE FOR SUPPLY MANAGEMENT’S MANUFACTURING REPORT ON BUSINESS®

16 Manufacturing Outlook /April 2023
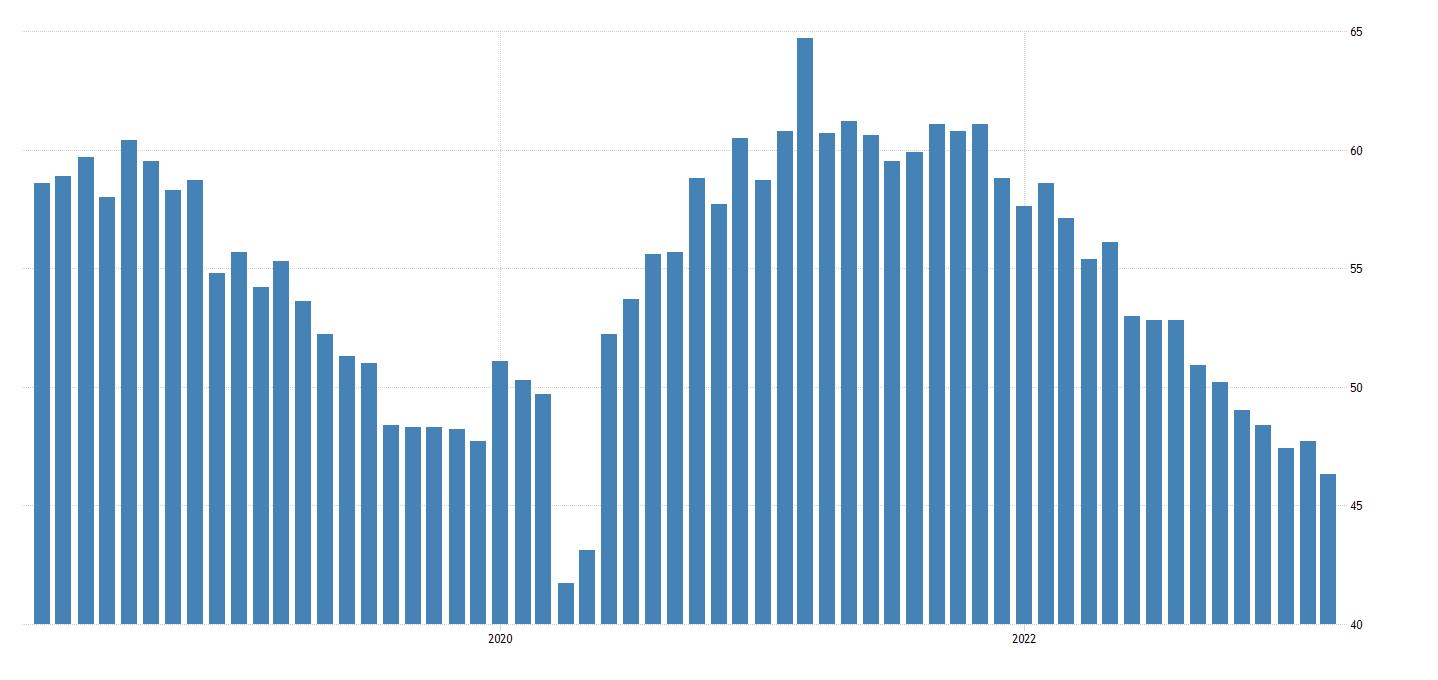
BREAKING NEWS ISM PMI at 46.3% for March 2023 ISM REPORT OUTLOOK MARCH 2023 46.3% Released April 3rd ISM PMI for the past 5 years Expanding Contracting continued
INSTITUTE FOR SUPPLY MANAGEMENT®
Economic activity in the manufacturing sector contracted in March for the fifth consecutive month following a 28-month period of growth, say the nation’s supply executives in the latest Manufacturing ISM® Report On Business®
The March Manufacturing PMI® registered 46.3 percent. The New Orders Index remained in contraction territory at 44.3 percent, 2.7 percentage points lower than the figure of 47 percent recorded in February. The Production Index reading of 47.8 percent is a 0.5-percentage point increase compared to February’s figure of 47.3 percent. The Prices Index registered 49.2 percent, down 2.1 percentage points compared to the February figure of 51.3 percent.
The Backlog of Orders Index registered 43.9 percent, 1.2 percentage points lower than the February reading of 45.1 percent. The Employment Index continued in contraction territory, registering 46.9 percent, down 2.2 percentage points from February’s reading of 49.1 percent.
The Supplier Deliveries Index figure of 44.8 percent is 0.4 percentage point lower than the 45.2 percent recorded in February; this is the index’s lowest reading since March 2009 (43.2 percent). The Inventories Index dropped into contraction at 47.5 percent, 2.6 percentage points lower than the February reading of 50.1 percent.
The six manufacturing industries that reported growth in March — in the following order — are: Printing & Related Support Activities; Miscellaneous Manufacturing‡; Fabricated Metal Products; Petroleum & Coal Products; Primary Metals; and Machinery. ISM
Analysis by Timothy R. Fiore, CPSM, C.P.M. Chair of the Institute for Supply Management® Manufacturing Business Survey Committee
PMI® at 46.3% MANUFACTURING
The U.S. manufacturing sector contracted in March, as the Manufacturing PMI® registered 46.3 percent, 1.4 percentage points lower than the reading of 47.7 percent recorded in February. This is the fifth month of contraction and continuation of a downward trend that began in June 2022. Of the five subindexes that directly factor into the Manufacturing PMI®, none were in growth territory. This month, the PMI® registered its lowest reading since May 2020 (43.5 percent).
Manufacturing at a Glance
Commodities Reported
Commodities Up in Price: Copper (4); Electrical Components (5); Electronic Components (2); Plastic Resins*; Polypropylene (2); Propylenes; Steel (2); Steel — Cold Rolled; Steel — Fabrications; Steel — Hot Rolled; Steel — Scrap; Steel — Stainless (2); and Steel Products (3).
Commodities Down in Price: Caustic Soda; Corn; Corrugate (4); Corrugated Boxes (3); Crude Oil; Freight (5); Natural Gas (4); Ocean Freight (7); Plastic Resins* (10); Polyethylene; and Solvents. Commodities in Short Supply: Electrical Components (30); Electronic Components (28); Hydraulic Components (11); Integrated Circuits; and Semiconductors (28).
17 Manufacturing Outlook /April 2023 ISM REPORT OUTLOOK continued 12 ISM WORLD.ORG
PMI 48.7% = Overall Economy Breakeven Line 50% = Manufacturing Economy Breakeven Line 2023 2022 2021 46.3%
INDEX Mar Index Feb Index % Point Change Direction Rate of Change Trend* (months) Manufacturing PMI® 46.3 47.7 -1.4 Contracting Faster 5 New Orders 44.3 47.0 -2.7 Contracting Faster 7 Production 47.8 47.3 +0.5 Contracting Slower 4 Employment 46.9 49.1 -2.2 Contracting Faster 2 Supplier Deliveries 44.8 45.2 -0.4 Faster Faster 6 Inventories 47.5 50.1 -2.6 Contracting From Growing 1 Customers’ Inventories 48.9 46.9 +2.0 Too Low Slower 78 Prices 49.2 51.3 -2.1 Decreasing From Increasing 1 Backlog of Orders 43.9 45.1 -1.2 Contracting Faster 6 New Export Orders 47.6 49.9 -2.3 Contracting Faster 8 Imports 47.9 49.9 -2.0 Contracting Faster 5 Overall Economy Contracting Faster 4 Manufacturing Sector Contracting Faster 5
‡Miscellaneous Manufacturing (products such as medical equipment and supplies, jewelry, sporting goods, toys and office supplies). *Number of months moving in current direction. Manufacturing ISM® Report On Business® data has been seasonally adjusted for the New Orders, Production, Employment and Inventories indexes.
Note: To view the full report, visit the ISM ® Report On Business® website at ismrob.org The number of consecutive months the commodity has been listed is indicated after each item. *Reported as both up and down in price.
reportonbusiness
ISM® Report On Business®
New Orders
March 2023
Analysis by Timothy R. Fiore, CPSM, C.P.M. , Chair of the Institute for Supply Management ® Manufacturing Business Survey Committee
ISM’s New Orders Index contracted for the seventh consecutive month in March, registering 44.3 percent. The five manufacturing industries that reported growth in new orders in March are: Printing & Related Support Activities; Miscellaneous Manufacturing‡; Primary Metals; Petroleum & Coal Products; and Fabricated Metal Products.
The Production Index registered 47.8 percent. The eight industries reporting growth in production during the month of March are, in order: Printing & Related Support Activities; Fabricated Metal Products; Miscellaneous Manufacturing‡; Electrical Equipment, Appliances & Components; Primary Metals; Food, Beverage & Tobacco Products; Transportation Equipment; and Machinery.
Employment
ISM’s Employment Index registered 46.9 percent. Of 18 manufacturing industries, six reported employment growth in March, in the following order: Printing & Related Support Activities; Primary Metals; Machinery; Fabricated Metal Products; Transportation Equipment; and Miscellaneous Manufacturing‡
Supplier Deliveries
The delivery performance of suppliers to manufacturing organizations was faster for a sixth straight month in March, as the Supplier Deliveries Index registered 44.8 percent. Two of 18 manufacturing industries reported slower supplier deliveries in March: Petroleum & Coal Products; and Miscellaneous Manufacturing‡.
Inventories
The Inventories Index registered 47.5 percent. Of 18 manufacturing industries, the seven reporting higher inventories in March — in the following order — are: Printing & Related Support Activities; Textile Mills; Nonmetallic Mineral Products; Paper Products; Electrical Equipment, Appliances & Components; Machinery; and Computer & Electronic Products.
18 Manufacturing Outlook /April 2023 ISM REPORT OUTLOOK continued
Manufacturing PMI®
New Orders (Manufacturing) 52.7% = Census Bureau Mfg. Breakeven Line 2023 20 2022 2021 44.3%
Employment (Manufacturing) 50.4% = B.L.S. Mfg. Employment Breakeven Line 2023 2022 2021 46.9% 20 Supplier Deliveries (Manufacturing) 2023 80 2022 2021 53.1% 44.8% Inventories (Manufacturing) 44.4% = B.E.A. Overall Mfg. Inventories Breakeven Line 2023 2022 2021 47.5% Production (Manufacturing) 52.2% = Federal Reserve Board Industrial Production Breakeven Line 2023 2022 2021 47.8% 70 Production
‡Miscellaneous Manufacturing (products such as medical equipment and supplies, jewelry, sporting goods, toys and office supplies).
ISM® Report On Business®
Customers’ Inventories
March 2023
Analysis by Timothy R. Fiore, CPSM, C.P.M. , Chair of the Institute for Supply Management ® Manufacturing Business Survey Committee
ISM’s Customers’ Inventories Index registered 48.9 percent in March, 2 percentage points higher than the 46.9 percent reported for February. Five industries reported customers’ inventories as too high in March: Paper Products; Electrical Equipment, Appliances & Components; Furniture & Related Products; Plastics & Rubber Products; and Computer & Electronic Products.
Prices (Manufacturing)
Prices
The ISM Prices Index registered 49.2 percent. In March, eight industries — in the following order — reported paying increased prices for raw materials: Machinery; Plastics & Rubber Products; Transportation Equipment; Fabricated Metal Products; Nonmetallic Mineral Products; Primary Metals; Electrical Equipment, Appliances & Components; and Miscellaneous Manufacturing‡
Backlog of Orders
ISM’s Backlog of Orders Index registered 43.9 percent in March, a 1.2-percentage point decrease compared to February’s reading of 45.1 percent, indicating order backlogs contracted for the sixth consecutive month after a 27-month period of expansion. Two industries reported growth in order backlogs in March: Textile Mills; and Food, Beverage & Tobacco Products.
New Export Orders
ISM’s New Export Orders Index registered 47.6 percent. Four industries reported growth in new export orders in March: Printing & Related Support Activities; Textile Mills; Paper Products; and Miscellaneous Manufacturing‡
Imports
ISM’s Imports Index registered 47.9 percent in March, a decrease of 2 percentage points compared to February’s figure of 49.9 percent. The four industries reporting an increase in import volumes in March are: Textile Mills; Petroleum & Coal Products; Miscellaneous Manufacturing‡; and Food, Beverage & Tobacco Products.
19 Manufacturing Outlook /April 2023 ISM REPORT OUTLOOK
Manufacturing PMI®
Customer Inventories (Manufacturing) 2023 2022 2021 48.9% Backlog of Orders (Manufacturing) 2023 2022 2021 43.9% New Export Orders (Manufacturing) 2023 2022 2021 47.6 % Imports (Manufacturing) 2023 2022 2021 47.9%
52.9% = B.L.S. Producer Prices Index for Intermediate Materials Breakeven Line 2023 2022 2021 49.2%
‡Miscellaneous Manufacturing (products such as medical equipment and supplies, jewelry, sporting goods, toys and office supplies).
n
NORTH AMERICA OUTLOOK
 by Dr. Chris Kuehl
A few days ago, I might have written about some geopolitical shift or speculated on the rate of inflation, but then the banking system blew up, and suddenly people are competing to determine how panic-stricken they should be. There are pundits proclaiming the arrival of another “black swan” event and others comparing this to the 2008 meltdown.
What do we really know now?
Recognize that this piece is being written in the midst of all this, and the story will doubtless change.
This essentially started at the point the Federal Reserve began to hike rates. It is clear they had no choice if they wanted to have an impact on inflation numbers that reached twenty-year highs. But there was no doubt this set
of moves would reverberate through the economy. It essentially meant the era of easy money was at an end, and that had major implications for the bond market. Banks (and other institutions) had been using bonds as their anchor. Now they were sitting on bonds that would sell at a discount while they would have to buy bonds that would be more expensive, and that affected their stability. Silicon Valley Bank was particularly vulnerable, but as we have seen, they are certainly not alone.
failure rate and are often shunned by other banks. The tech sector has been getting hit lately, and that added to the problem. SVB loaded up on long term bonds when asset prices were high and interest rates were low. Then the Fed started aggressively hiking rates, and bond prices plunged. Banks were left with huge losses as there is no requirement for banks to cover these unrecognized losses. The fact is there is $620 billion in unrecognized losses in the system, and that is over a third of the total capital cushion of banks. Fortunately, the majority of banks are not as close to the edge as SVB and some others.
We have seen Signature Bank and Republic Bank in deep trouble, and the investment community has slammed most of the major banks out of concern over their bond position. SVB was troubled for years as it specialized in high-risk lending to tech start-ups. These are companies that have a 98% continued
The government has stepped in quickly to shore up these banks and protect depositors, but this carries a risk as well. The moves are designed to
20 Manufacturing Outlook /April 2023 NORTH AMERICA OUTLOOK
APRIL 2023
The Elephant in the Room
protect both the insured and uninsured depositors, and that begs the question –why bother with the distinction at all. There are major companies that are just assuming they will be covered and essentially abuse the system. Remember all that cash that was pumped into the system during the pandemic? There was at one time some 7 billion in excess savings and there is still $3.5 billion out there. Much of that became deposits at banks, and these banks bought a lot of “safe” longterm bonds and government-backed mortgage backed securities.
These unrecognised losses are not a big issue until and unless the banks need to handle depositor demands. This could be depositors deciding to bolt from the bank in a bank run, or it could simply be people seeking higher returns on their deposits. The big banks can offer more, and the smaller banks struggle to maintain the depositor base to cover their bond position.
It cascades fast and that is what prompted the quick series of bailouts. The financial system quickly started to stabilize, but long term risk just increased. The banks have basically become “wards of the state” as they will be rescued regardless of their
mistakes and miscalculations, and that rewards high-risk behavior as there are limited consequences. In the immediate future, there is very likely to be a shift in the position of the Fed and other central banks. The betting now is that interest rates could come down as early as this summer. Good news for some but it also means less pressure on inflation.

Does all of this mean a heightened risk for recession – especially in the manufacturing community? Not necessarily. As serious as this is, the crisis is restricted to the financial sector for the most part, and as the weeks have progressed, the bailout plans have indeed calmed the market to a degree. UBS purchased Credit Suisse with the support of the Swiss government; SVB eventually found a buyer in First Citizen’s Bank, and the other troubled banks are getting support from the heavyweights in the banking community. The impact on the rest of the economy will be felt as loan standards tighten. That process was already underway, and this accelerates it. That could be somewhat good news for manufacturers as banks are more enthusiastic about loans for the purchase of something tangible and expensive (like machinery).
The U.S. is still expected to see growth in the first quarter of around 2.0% to 2.5% - at least according to the GDP
Now projections from the Atlanta Fed. The major concerns as far as the year is concerned include the ongoing issue of labor shortage and the impact that has had on wages, as well as the issue of overstocking. In reaction to the supply chain crisis, there was an intense increase in inventory, and now 75% of companies are reporting they are overstocked. This will upset the usual replenishment cycle until at least the end of the second quarter and perhaps beyond.
Thus far, Canada and Mexico have been unaffected by the bank crisis, although both of the central banks in these nations have started to back down when it comes to advocating higher interest rates. Canada is still expected to see growth between 1.0% and 1.5% for the coming year and slightly higher in 2024. Mexico will likely see growth closer to 3.0% based on expansion of nearshoring. These investments are at the highest level on record, with 45% of them new projects. The FDI pace in Mexico has been driven by companies abandoning China but still in need of lower labor costs.
Author profile: Dr. Christopher Kuehl (Ph.D.) is a Managing Director of Armada Corporate Intelligence and one of the co-founders of the company in 1999. He has been Armada’s economic analyst and has worked with a wide variety of private clients and professional associations in the last ten years. He is the Chief Economist for the National Association for Credit Management and is on the Board of Advisors for their global division – Finance, and Credit.

21 Manufacturing Outlook /April 2023 NORTH AMERICA OUTLOOK
APRIL
SOUTH AMERICA OUTLOOK
 by Royce Lowe
Bolivia’s Lithium Dilemma
Bolivia, a very poor country of some 12 million people in the high Andes, is currently in the midst of financial chaos, with its citizens lining up to try to exchange their currency for U.S. dollars. But maybe help is on the way, through exploitation of the country’s lithium reserves. Which, according to the U.S. Geological Survey, are, at 21 million tons, the world’s largest. In 2021, Yacimientos de Litios Boliviano (YLB), the state mining company, started soliciting proposals to mine Bolivia’s lithium using direct lithium extraction (DLE), a set of technologies that use sorbents, membranes, or other materials to chemically remove lithium from salty brines. It received submissions from companies in Argentina, China, Russia, and the U.S.
The so-called lithium triangle in South America, Argentina, Chile, and Bolivia, represents some two-thirds of global lithium resources as salt flats. To date, there has not been too much extraction from the Bolivian sector, but president Luis Arce is upbeat, and says there is no time to lose. YLB has announced that it will move forward with a Chinese group that includes the battery company Contemporary Amperex Technology Co. Ltd. (CATL), CATL’s recycling subsidiary BRUNP, and the mining company CMOC (CBC), Arce has no choice but to remain upbeat. The aim is to construct two DLE plants, each capable of producing 25,000 tons of lithium carbonate annually, mainly for use in electric vehicle batteries.
Bolivia first declared its intent to industrialize its lithium shortly after former president Evo Morales led the Movimiento al Socialismo (Mas) to power in 2006. The Mas has governed for all but one year since, including the current administration. Throughout, the Mas has insisted on sovereign control of Bolivia’s lithium, with the state trying to develop it alone, or with limited input from foreign companies.
The typical method to extract lithium involves pumping brine into ponds and processing the lithium salts that crystallize once the water has evaporated. The Bolivian state has invested roughly $800m in this method, with a grid of ponds and
22 Manufacturing Outlook /April 2023
SOUTH AMERICA OUTLOOK
2022
continued
an unfinished plant that it says will begin producing 15,000 tons of lithium carbonate per annum starting this year. But this method, which works well enough in the salt flats of neighboring Chile and Argentina, is less well suited to Bolivia, where the brine has high levels of impurities and the salt flats have a rainy season of several months. YLB has admitted to relatively poor results.
Hence the change in YLB’s strategy and their aforementioned call for proposals from foreign companies to develop the new “DLE” technologies that can pull lithium straight from brine, potentially without the need for solar evaporation. The deal further locks in Chinese dominance of the battery industry and its supply chains. Just two Chinese companies, CATL and BYD, produce more than half the world’s batteries. And some 60% of the world’s lithium is processed in China. There may yet be more deals to come. The Bolivian government said it was still negotiating with five other companies from China, Russia and the U.S.

The plan brings up questions about the nature of the investment, how the project will be managed and how the earnings will be divided between the consortium and the various levels of Bolivia’s government. Even those in favor of pressing on to battery production are skeptical about the 2025 deadline. Héctor Córdova, the former president of Bolivia’s state mining company, said that the reality of the country shows that this dream is impossible. He goes on to say that Bolivia lacks the basic industry, has insufficient qualified personnel, and has no plan for industrial development in such a short space of time. Maybe he’s just inviting China to provide the financing and the qualified personnel to make sure the plan succeeds.
What’s On Lula’s Plate?
Brazil’s recently elected president, Luiz Inacio Lula de Silva (known as Lula), is no stranger to the ups and downs of his country’s economy. This is his second shot, after nursing Brazil through good times from 2002 to 2010, when his term saw increases in Brazilian incomes, soaring demand for its commodities, and a hefty drop in unemployment, poverty, and government debt.
The second time around promises to be hard work. He finds the economy, and the country, in somewhat of a mess, sorely needing investment in its infrastructure, and spending on education to train Brazilian workers for better jobs, and to make up for lost learning from the recent pandemic. The pandemic brought almost a million deaths, and an increase in poverty.
Many economists are sending out warnings of a possible global recession. Weak global growth, falling commodity prices, and rising interest rates would not be good for Brazil. But the global economy is looking in better shape than it was just a few months ago, with inflation on the decrease. Commodity prices have fallen from the levels seen following Russia’s invasion of Ukraine, but are still well above pre-pandemic levels.
Brazil’s inflation rate has halved over the past few months, from 12% to 5.8% recently. But Brazil’s economy is forecast to grow by just 1% in 2023. And who knows what might happen to the global economy in the near future? And there are also Bolsonaro’s supporters waiting in the wings.
Lula recently visited President Biden, his first outside visit while in office. They discussed world affairs, jointly condemned Russia’s invasion of Ukraine, and also discussed their interest in intensifying bilateral cooperation in areas such as trade and investment, energy, health, science, technology and innovation, defense, education and culture, and consular affairs, through a results-oriented approach that benefits both societies. Biden was invited to visit Brazil, which he agreed to do.
China is, of course, actively involved in Brazil but as yet trails the U.S. in trade with the country. Brazil’s infrastructure requirements, however, will surely let China in for a big slice of the investment pie. It is most probable that we can look forward to an increased U.S. presence in Brazil, with an accompanying Chinese one.
Author profile: Royce Lowe, Manufacturing Talk Radio, UK and EU International Correspondent, Contributing Writer, Manufacturing Outlook. n

23 Manufacturing Outlook /April 2023
SOUTH AMERICA OUTLOOK
AFRICA OUTLOOK
 by Royce Lowe Blackouts; South Africa’s Huge Problem
South Africa has suffered for many years from what are known as rolling blackouts. This has been going on since 2008. The more prolonged power outages that have dogged South Africa for months on end have been hard to endure. The problem: Eskom Holdings SOC Ltd., the debt-stricken state utility that supplies more than 90% of the nation’s electricity, can’t keep pace with demand from its old and poorly maintained plants.
With the governing party in danger of losing its majority in 2024 elections, President Cyril Ramaphosa has declared a national “state of disaster,” allowing his administration to bypass bureaucratic hurdles so it can accelerate new energy projects. The government intends to give Eskom 254 billion rand ($13.9 billion) in debt relief to free up funds for repairs and improving the transmission and distribution system.
Eskom has a history of deep financial losses and poor planning. Allegations of mismanagement and corruption have plagued the utility. It ran into financial trouble in the early 1980s after committing to build plants that weren’t needed. Then, when White minority rule of South Africa ended in 1994, the company wasn’t prepared for the sharp increase in demand as previously neglected areas were connected to the grid. Over the following two decades, Eskom suffered from erratic government decision-making and political interference. A lack of generating capacity led to regular power supply disruptions.
The company has had 14 leaders since 2007, much of that turnover coming during the nine-year tenure of South African President Jacob Zuma. A judicial commission found the upheaval at Eskom was an
orchestrated attempt by Zuma’s allies to raid its coffers with his tacit consent. Zuma denies the charge. Eskom’s leaders have said the company hasn’t been permitted to charge adequate prices to meet its costs. Imagine the most economically prominent on the continent of Africa suffering frequent, devastating power outages, the result of a process known as loadshedding. In other words, forced power cuts.
Intentional outages imposed by Eskom to reduce demand, often lasting many hours, have affected water services (since pumps can’t run without power), food safety (since refrigerators can’t stay cold), and the ability of hospitals to provide care. The blackouts are sapping business confidence in a country whose biggest industries, such as mining, depend on reliable access to cheap electricity. The central bank estimated that the crisis was costing the economy as much as 899 million
24 Manufacturing Outlook /April 2023 AFRICA OUTLOOK continued
APRIL 2023
THE FLAGSHIP REPORTS


The Flagship Reports with Dr. Chris Kuehl is both an “Officer of the Watch” briefing of economic conditions and an Executive Briefing on specific situations impacting those conditions. Written and presented by the officers of Armada Corporate Intelligence, Dr. Kuehl lightens up the mood of sometimes distressful geoeconomic news with a bit of humor. This monthly podcast includes information from the Flagship Reports issued 3 times and week, and AISI, the Armada Strategic Intelligence System, a tool for durable goods manufacturers that dives deep into the sector each month to provide more than 95% accurate near-term forecasts.
rand, or approximately $48 million, a day. In addition to all this, four-fifths of South Africa’s power is generated by coal.
South Africa has an abundance of coal, and 90,000 people are employed at mines that feed Eskom power stations via conveyor belts. After its founding in 1923, Eskom rapidly built coal-fired plants, spurred by the needs of its gold mining industry, the world’s largest. In the 1970s, it began building a new fleet of power stations that operate to this day, along with the only nuclear plant on the African continent. Plans were announced in 2007 to build two giant new coal-fired plants, Medupi and Kusile, that were scheduled to be completed within eight years at a total cost of 163 billion rand. However,
construction has been plagued by labor unrest, mismanagement, and equipment defects. The likely final price tag is over 460 billion rand.

A plan was unveiled this past February, a relief package, conditional on Eskom bringing in private partners to help operate its plants and transmission network. The government is also making it easier for the utility’s rivals to build their own power stations by scrapping licensing requirements.
They’ll be allowed to sell their surplus output to the grid, while households and businesses that install their own solar panels will get tax breaks. Ramaphosa intends to appoint a new minister in his office who will focus solely on bolstering the electricity supply. One
challenge: The governing party, the African National Congress, is wary of disrupting the coal industry, not least because mineworkers are a key voting constituency.
South Africa’s National Treasury predicted the economy would expand by just 0.9% in 2023, down from 2.5% in 2022, and expects power rationing to persist until at least the end of 2024.
Author profile: Royce Lowe, Manufacturing Talk Radio, UK and EU International Correspondent, Contributing Writer, Manufacturing Outlook. n


25 Manufacturing Outlook /April 2023 AFRICA OUTLOOK


*Toll free within the U.S. * ISO9001:2015 SINCE 1994 AND AS9100D SINCE 1998 NIST SP 800-171 (COMPLIANCE UNDER DEVELOPMENT)
EUROZONE GLOBAL OUTLOOK
 by Chris Anderson
Strength and Growth Continue
Eurozone economic growth rose to a ten-month high in March, adding to signs that the economy is reviving after falling into decline late last year. Inflationary pressures have continued to moderate with input prices falling sharply in manufacturing. Jobs growth has also accelerated, and business confidence in the outlook has remained resilient. However, the overall rate of growth remains modest and is driven solely by the service sector, with manufacturing suffering a further loss of new orders, meaning current output is only being sustained via backlogs of previously placed orders.
Recession fears and energy market fears are fading. There are record improvements to supplier delivery times. Here are the Eurozone figures:
• Composite, 54.1 vs 52.0

February, 10-month high
• Services PMI, 55.6 vs 52.7
February, 10-month high
• Manufacturing output index, 49.9 vs 50.1 February, 2-month low
• Manufacturing PMI, 47.1 vs 48.5
February, 4-month low.
France and Germany both showed good performance on the services side, but Germany’s manufacturing performance was at an almost three-year low. Let it be said that expectations in the manufacturing sector remain low at the present time.
• France, flash composite, 54.0 vs 51.7 February; 10-month high
• France flash services PMI, 55.5 vs 53.1 February; 10-month high
• France, flash manufacturing output index, 46.9 vs 45.0 February; 2-month high
• France, flash manufacturing PMI, 47.9 vs 50.5 January; 4-month low
• Germany, flash composite, 52.6 vs 50.7 February; 10-month high
• Germany, flash services PMI, 53.9 vs 50.9 February; 10-month high
• Germany, flash manufacturing output index; 50.1 vs 50.2 February, 2-month low
• Germany, flash manufacturing PMI, 44.4 vs 46.3 February, 34-month low.
The rest of the major countries in the Eurozone performed better, and were, in large part responsible for the hikes in the indexes. The West European car market reached 797,330 units, while sales in the first two months exceeded 1.6 million units, some 10.5% ahead of last year’s pace.n
27 Manufacturing Outlook /April 2023
EUROZONE OUTLOOK
APRIL 2023
ASIA OUTLOOK
by Christine Casati
U.S. SOLAR MANUFACTURING RENAISSANCE NEEDS CHINA AND SOUTHEAST ASIA
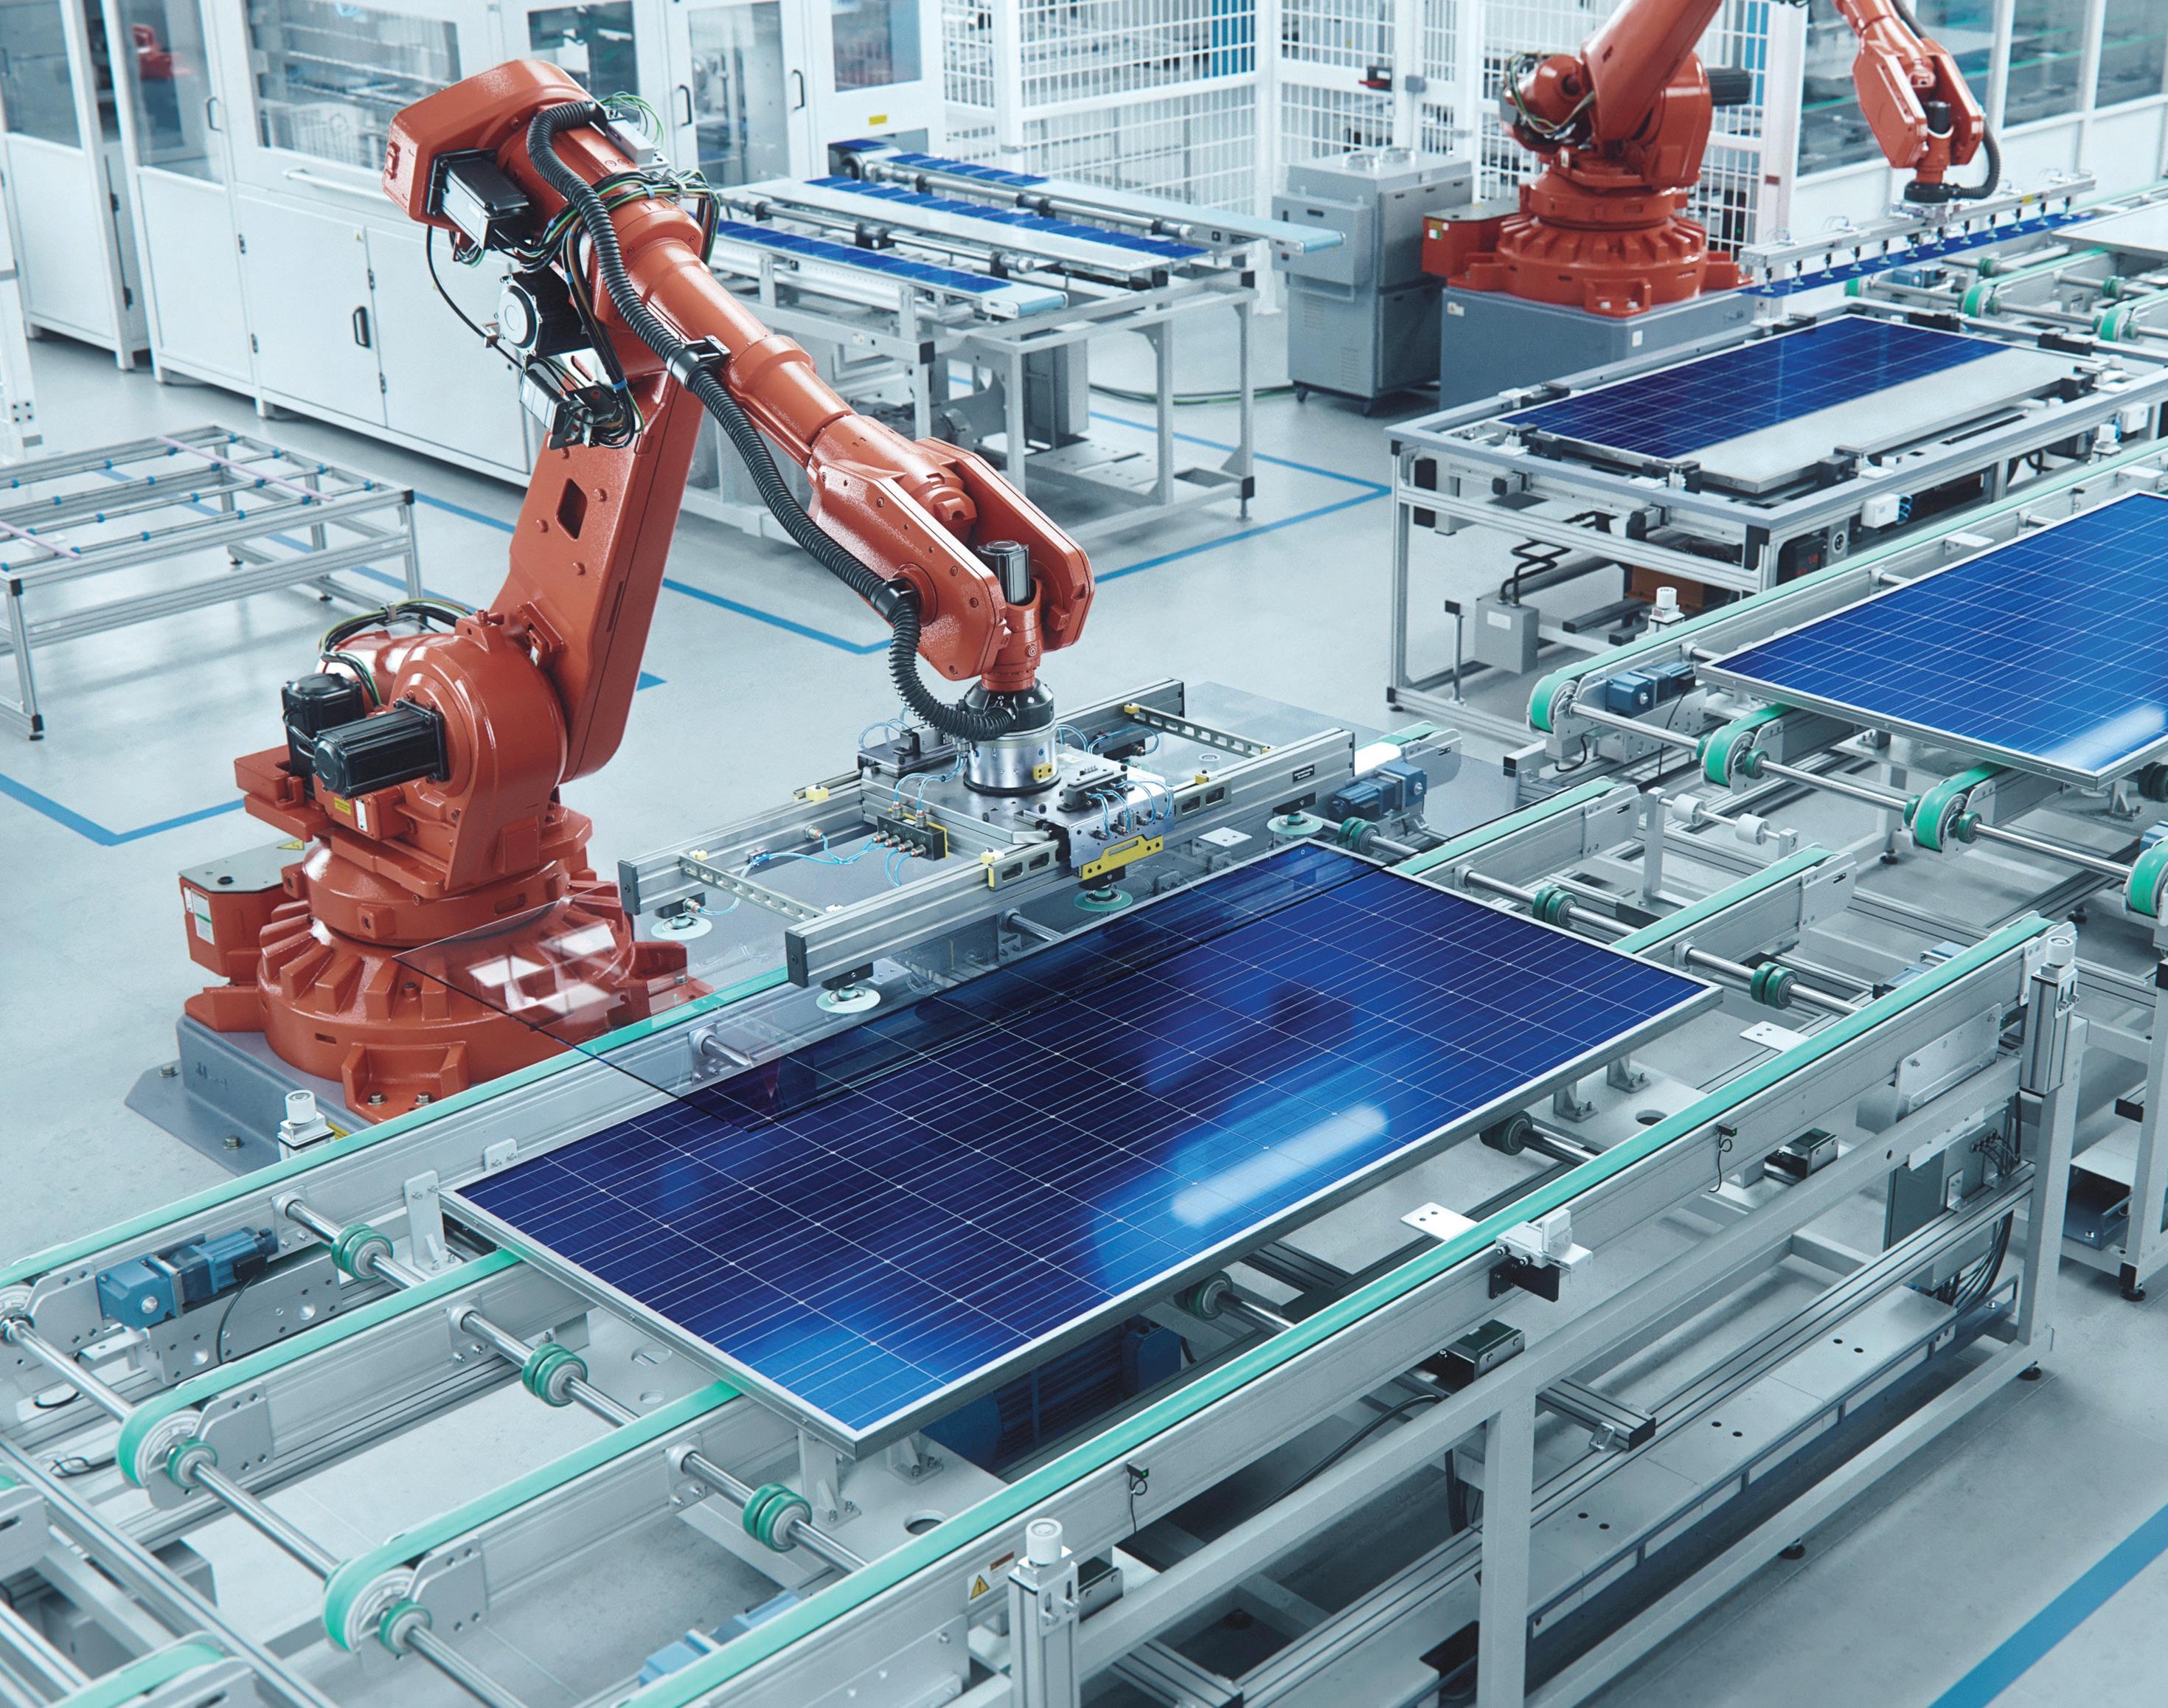
THE GLOBAL BIG PICTURE: Solar power generation is on track to surpass all other energy sources by 2027, according to Myles McCormick of the Financial Times (2/27/23). Photovoltaic (PV) capacity is expected to ‘leapfrog’ hydropower by 2024.
Within three years, it will overtake combined gas-fired generation. And by 2027, solar energy is predicted to “push past coal” to provide the largest share of power generation capacity of any other energy source. (Side Note: In March, Governor Jim Justice of
West Virginia put his family coal mining business up for sale). The main drivers of this seismic shift in electricity generation over the next five years are renewable green energy policymaking and the lower lifetime cost of one megawatt-hour (MWh): continued
28 Manufacturing Outlook /April 2023
ASIA OUTLOOK
Solar: $36; Wind: $38; Combined Gas: $60; Coal: $108. (Source: International Energy Agency).
While government subsidies and long-term tax breaks are speeding up action for solar buildouts in Europe, India, Australia, and the U.S., among others, China is still the world leader in already commissioned solar power generation and in the production of supply line components and storage, not just modules and cells. The construction and installation of an entire solar power project, from ground-breaking to commissioning, is complex, whether for residential or utility power (on-grid, off-grid, hybrid, commercial, and ground-mounted solar plants). It involves a wide-ranging manufacturing supply chain of large volumes of diverse raw materials and components, with delivery required in a relatively short period of time. It will take the U.S. at least five years to build out its solar transformation bases and decrease reliance on imports.
Tackling The Solar Supply Chain Requirements
Buildouts for raw material processing and everything that goes into solar and storage manufacturing equipment are needed. A condensed list includes quarries, quartz crystal plants, silicon metal furnaces, wafers, ingots, polysilicon, modules, cells, glass, manufacturing equipment, inverters and microinverters, batteries, battery cells, battery packs, copper foil, cathode active materials, cathode and anode materials, and packaging materials. The passage of the Biden Administration’s Inflation Reduction Act (IRA) has provided billions in investment incentives and tax credits to support and accelerate the U.S. solar buildout. One example is Enphase, a California-based clean energy hardware pioneer which will produce millions of solar microin-
verters by late this year, thanks to tax credits under the IRA.
In large part, propelled by these incentives, there are currently 6100 projects throughout the supply chain in the works, according to SEIA (Solar Energy Industries Association, White Paper March 8, 2023). That includes those currently in operation and those in planning or already under construction. Generation capacity totals 185 GWdc. SEIA’s stated goal through these and more new projects is to achieve 30% of U.S. electricity generation by 2030 while building a resilient and equitable solar and storage manufacturing platform. They claim this would generate $100 billion in annual economic investment and over 1 million jobs while reducing carbon emissions by a whopping 700 million tons.
U.S. Solar and Storage Manufacturing Buildout Workforce

Manufacturing jobs are known for creating a multiplier effect in the economy. The SEIA has estimated that the ongoing solar transformation buildout will provide 115,000 family-sustaining jobs by 2030, with a multiplier effect throughout the economy of over 500,000 jobs. These jobs include sales and purchasing,
logistics, accounting, human sources, packaging, warehousing, etc., across the entire industry.
Reliance on Imports
While U.S. domestic cell manufacturers are being built and domestic sources of ingot and wafers are being developed, U.S. solar module manufacturers must rely on imported cells and imported ingot and wafers. The highest concentration of polysilicon is produced in China. We have to source there. There is a risk of price spikes due to occasional power shortages. There are many other components in the solar supply chain mentioned above that can be readily sourced in China at a low cost. The bottom line is we need China to fuel our solar renaissance in the near term.
Constraints on Solar Manufacturing Transformation
In spite of current renewable energy support in the IRA, policy-driven supply constraints and disruptions led to major reductions in solar installations in 2022. The U.S. added only 20.2 gigawatts (GW) of new solar capacity in 2022, down 16% from 2021. This was caused mainly by the investigation conducted by the Department of Commerce due to complaints by some U.S. solar panel manufacturers continued
29 Manufacturing Outlook /April 2023
ASIA OUTLOOK
that China was circumventing solar-related tariffs by locating factories in Malaysia, Vietnam, Cambodia, and Thailand, where many U.S. solar investors were sourcing components, as well as by U.S. Customs and Border Protection detaining equipment shipments for U.S. projects under the Uyghur Forced Labor Prevention Act.

The Biden administration stepped in and allowed the solar project materials already planned or ordered from Southeast Asian suppliers to be imported free of tariffs for another two years to allow projects to move forward. Yet many projects have been caught in the crosshairs, and some investors have delayed or withdrawn their investments entirely until the supply chain becomes more transparent. There is the additional concern that Republicans who now control the House of Representatives will try to use the CRA (Congressional Resolution Act) to reverse Biden’s renewable energy climate initiatives
and reinstate tariffs. This could be a further blow to urgently needed solar manufacturing acceleration provided for under the IRA.
There are also recent hiccups in the tech banking sector that may profoundly affect some scheduled solar power projects. The fallout from the receivership of SVB (Silicon Valley Bank) revealed that SVB had carved out a niche for lending to community clean energy projects to the tune of $1.2 billion in 2022. The Wall Street Journal reported on 3/15/23 that the solar clients of SVB included the residential solar company Sunrun, the battery storage buildout company STEM, and the fuel cell manufacturer Bloom Energy. At the time, their stocks plummeted 7-10%. Sunrun stated that their $40 million loan for drawdowns could easily be replaced, as they are well connected to other banking groups.
It is true that for U.S. economic security, we need to pivot away from overreliance on China as well as other less mature offshoot suppliers in Southeast Asia, which may pose a greater risk of supply chain disruptions due to nation-related infrastructure issues, lack of digital transformation, or geopolitics. But it will take years for the U.S. and our allies to develop both the workforce and the component and storage manufacturing capability required to complete our solar buildout transformation to the level we could achieve. We must be realistic about our near-term needs for collaboration with China and Southeast Asia. They are way ahead in the game. They can help us leapfrog.
Author profile: Christine is cofounder and President of China Human Resources Group, Inc, a management consulting firm based in Princeton NJ. She has provided U.S. companies with strategic development and project implementation services for projects in China since 1986. n

30 Manufacturing Outlook /April 2023
ASIA OUTLOOK

31 Manufacturing Outlook /April 2023 ASIA OUTLOOK
AEROSPACE OUTLOOK
by Royce Lowe
Boeing and Saudis and 787s

Boeing said recently that it has reached a deal to sell 78 of its 787 Dreamliner planes to two Saudi airlines, the latest large order for the wide-body jets in the past few months. The jetliners will go to Saudi Arabian Airlines, or Saudia, and a new airline, Riyadh Air, recently announced by Crown Prince Mohammed bin Salman. Saudia ordered 39 of the planes, with options for 10 more, and Riyadh Air will get 39 of the two largest models of the planes, with options for 33 more.
The Saudi purchase caps sales of almost 200 Dreamliners over the past four months, giving Boeing major industrial and political wins in lucrative wide-body sales against European rival Airbus. Boeing did not disclose a delivery schedule for
the planes. The White House said the order is worth almost $37 billion, although that figure does not take into account the discounts that airlines usually receive for such large orders.
Riyadh Air is owned by the country’s sovereign wealth fund and will be led by Tony Douglas as CEO, a longtime industry veteran, and former CEO of Etihad Airways. Douglas spoke of the ambition in the Kingdom and of the certainty of the placing of further orders. He said the order will help Saudi Arabia connect to 100 destinations.
In December, United Airlines agreed to buy at least 100 Dreamliners from Boeing, and Air India recently placed an order for 460 Boeing and Airbus planes.
Boeing was recently set to resume deliveries of the Dreamliner after a weeks-long pause resulting from a data analysis issue it disclosed last month. CEO Dave Calhoun recently said that the delivery resumption was “imminent.” Following resumption of deliveries to fulfill existing orders, Boeing will now face the difficult task of producing and delivering those 787s in a time of unprecedented supply chain pressures, analysts said.
The recent orders fill out Boeing’s backlog at a time when the company aims to boost 787 production to 10 a month by 2026 – a target that would take “supersonic” growth given that Boeing is still working to increase production back to three a month, said highly-rated Vertical Research analyst Robert Stallard. He says it’s fine and
32 Manufacturing Outlook /April 2023 AEROSPACE OUTLOOK continued
2023
APRIL
dandy to have the orders, but it’s not a question of demand, but rather of supply. “They’ve got to go out and actually make the aircraft.”
The 787 faces multiple strains on its supply chain, several shared broadly across the aviation industry, such as forgings and castings for engines. Planemakers are also grappling with the after-effects of the pandemic, which forced waves of layoffs and retirements of skilled workers.

The Dreamliner, however, has faced several unique challenges, some of which slipped by Quality Control. There were also cases where materials supplied by sub-contractors were suspect. There was a year-long delivery pause due to production quality problems that were resolved last August.
In February, Boeing’s chief financial officer, Brian West, said the planemaker had to lower 787 production from three aircraft a month due to slower fuselage production at Spirit Aerosystems. The company also confirmed last month that it would need to replace a non-compliant component before delivering certain 787s.
The Saudi deal, in particular, was seen as a blow for Airbus, which just months ago had been expected to land part of the order. Negotiations ebbed back and forth over the past year, echoing a volatile period in U.S.-Saudi relations. Last October, sources said Airbus may win an order for 40 of its A350
jets after Washington said it was reviewing options for Saudi relations in a dispute over oil output levels. Since then, diplomats and regional experts have said the United States and Saudi Arabia are trying to move beyond last year’s low point in ties, as security concerns align over the threat from Iranian drones.
Both Washington and Paris weighed in with lobbying, with Riyadh’s final decision taken at the highest level, according to “two people familiar with the negotiations.” One European source called the outcome of the plane order “totally political,” but a U.S. official denied there had been any diplomatic trade-offs. “Saudi Airlines is a governmentowned airline, and so there are politics involved with this,” analyst Stallard said. “I wouldn’t rule out buying from Airbus if the Saudi government thinks it’s in their best interest to do some things with the Europeans in the future.”

The quality glitches that Boeing went through with the 787, plus the infamous 737 MAX saga, and Boeing’s relations with the FAA, means that the company will have to maintain a spotless quality standard on orders of this magnitude.

33 Manufacturing Outlook /April 2023 AEROSPACE OUTLOOK
Author profile:Royce Lowe, Manufacturing Talk Radio, UK and EU International Correspondent, Contributing Writer, Manufacturing Outlook. n
APRIL 2023
ENERGY OUTLOOK
The World and Russian Oil and Gas
 by Royce Lowe
relationship evaporated in February 2022 as Russian troops entered eastern Donbas.
monopoly, crippling Gazprom’s ability to develop its fields. And the UK’s BP said it would pull out of a $14bn stake in Rosneft, Russia’s state oil giant.
Germany had nurtured the Nordstream 2 pipelines for 15 years against United States objections but said it was halting the process of certifying them for commercial use. Russia’s full invasion of Ukraine prompted Dutch oil major Shell to withdraw from joint projects worth $3bn with Gazprom, the Russian gas
The energy levers that Russian President Vladimir Putin would use to mute Europe’s response to his invasion were broken. “When Russia attacked Ukraine, one working hypothesis was that Europe would be divided by energy blackmail,” Greek Foreign Minister Nikos Dendias told reporters
Before its invasion of Ukraine, Russia was Europe’s chief energy source. Moscow has waged an energy war against the European Union over the past year, but the bloc appears to be holding firm. It supplied 29 percent of the European Union’s oil imports and 43 percent of its gas imports. Moscow was on the cusp of activating the twin Nordstream 2 pipelines, which would have increased its gas exports to the EU by a third, but this continued
34 Manufacturing Outlook /April 2023 ENERGY OUTLOOK
on the anniversary of the Donbas invasion. “This hypothesis was completely inaccurate. The EU gained a new unifying narrative, and the support to Ukraine is steady, lasting, and increasing,” Dendias said.
According to Sir Michael Leigh - the former director-general for enlargement at the European Commission, - on the European Union side, there is now a “real determination to reduce drastically dependence” on Russian oil and gas. In 2020, during the coronavirus pandemic recession, the EU raised 270 billion euros ($287bn) to fund renewable energy. After Russia’s invasion, it stiffened its ambition, setting a goal to generate 45 percent of total final energy consumption from renewables. Several EU governments set even more ambitious goals. Recent analysis by Ember, an energy think-tank, suggests Europeans have moved even faster than their governments. Ember estimates that electricity from solar photovoltaics and wind reached a record 22 percent of the mix in the EU last year, a one-fifth increase on 2021, with two-thirds of the increase in solar energy coming from rooftop photovoltaics, not power plants.

“The energy transition in Europe is not from the top down – what we’re seeing is it’s bottom up,” Dave Jones, head of electricity insights at Ember, stated. “Individuals are interested in producing their own energy and doing their bit for the energy crisis to defy Russia as an aggressor and a threat to Europe,” he said. “If people want to step up, they can act outside of policy,” said Jones, who believes solar and wind will leap ahead by another fifth this year, and possibly outperform EU 2030 targets. Renewable energy has obvious attractions for Europe, which is poor in hydrocarbons. Apart from being clean, it on-shores energy
production is at near-constant prices. An export tracker by the think tank Bruegel shows that Russian sales of mineral fuels to the 27 EU countries progressively fell last year from $18bn a month to $8bn in December 2022. They are set to fall further.
The EU didn’t ban Russian coal imports until last August. It didn’t embargo Russian crude oil until December. Economists say these sanctions did not have a full-year effect. “In most of 2022, only some 8 percent of the export value of Russian energy was under sanctions,” wrote Maria Demertzis, a senior fellow at Bruegel. In fact, Russia gained from skyrocketing energy prices caused by the war, earning $120bn more from hydrocarbon exports last year than it did in 2021, according to a 2022 report from Bruegel. And this despite a 25 percent decrease in total gas exports. Bruegel further believes that Europe paid a trillion euros ($1.06 trillion) more for its energy last year than in 2021. The International Energy Agency puts that price tag even higher, saying energy-importing
countries paid $2 trillion more, mainly in Europe. Russia revelled in its power to push gas prices up. Former Prime Minister Dmitry Medvedev gleefully predicted prices of $5,000 per cubic metre.
On August 31, when Gazprom suspended the operation of the Nordstream 1 pipelines to northern Europe, it triggered a run on the euro, which fell to 20-year lows and for the first time since 2002 was worth less than a U.S. dollar. But this year will be different, says Bruegel’s Demertzis. The EU banned refined Russian oil products this month. Together with the measures put in place last year, she estimates that 40 percent of Russia’s energy exports will be sanctioned.
Janis Kluge, a senior associate at the German Institute for International and Security Affairs, has estimated that the Kremlin’s tax income from oil and gas in January was $5.8bn – about half its January 2022 level, and far below the $10bn in average monthly revenue Russia has budgeted from oil and gas taxes this year.
35 Manufacturing Outlook /April 2023 continued
ENERGY OUTLOOK
The Russians had forecast a more difficult year in 2023. An internal Russian government report seen by Bloomberg last September drew up three growth scenarios. In two of them, Russia’s recession deepened this year, and pre-war growth did not return until 2030.
Among Russia’s vulnerabilities was its IT sector, deemed uncompetitive without Western components and technology. Another weakness was energy. “These sanctions are working, weakening Russia’s economy and depriving it of critical technologies,” European Council President Charles Michel said. The EU-Russia energy war has provided a windfall for the world.

Last year, Russia put its oil “on the market,” discounting it by a third relative to market prices, to move it, making it an attractive proposition to emerging economies. China, India, and Turkey have all increased their uptake of Russian fossil fuels, replacing much of the income lost from the EU. This year, the Institute of International Finance said it was tracking record shipments of crude leaving Russian ports. Does this mean Russia is beating EU sanctions?
In January, the International Monetary Fund (IMF) said Russia’s economy only contracted by 2.2 percent last year, despite earlier expectations of a 7.6 percent drop, and forecast it would grow by 0.3 percent this year. “Russian crude oil export
volumes are not expected to be significantly affected, with Russian trade continuing to be redirected from sanctioning to non-sanctioning countries,” the IMF said.
Not everyone shares the IMF’s view. The World Bank foresees the Russian economy shrinking 3.3 percent this year, and the Organization for Economic Co-operation and Development predicts it will contract by 5.6 percent. Part of the uncertainty is that no one is sure how effective the West will be in containing Russia’s fossil fuel trade with non-sanctioning countries, which comprise 59 percent of the world’s population.
In an exercise never before attempted, the EU and Group of Seven (G7) are flexing their geopolitical muscle, refusing to insure tankers carrying cargoes of Russian oil to any destination in the world if those cargoes are priced over $60 a barrel. The Helsinki-based Center for Research on Energy and Clean Air estimated that during their first month in force, the EU ban on Russian crude and the global price cap cost Russia just over $5 billion in export revenue.
Following such encouraging early signs, the EU and G7 doubled down on price caps to third parties. An EU summit on February 9 announced new caps of $100 per barrel on premium petroleum products (diesel, kerosene, and petrol or gasoline) and $45 per barrel of discount oil products (fuel oil, naphtha), effective April 5.
Russia responded by threatening to cut oil production by half a million barrels a day in March, which could raise prices globally, but that is a doubleedged sword, also affecting Russia’s main ally, China. “We have to look at the knock-on effects of all this,” said Sir Michael Leigh. “Given discounted prices for Asia, and that prices have

fallen in Europe, Russian revenues are going to fall considerably. Put that with the expenditure on the military and Russia’s debt position. The Kremlin has been paranoid about debt, and hasn’t been willing to draw down on cash reserves, but it may now have to revise that.”
Given that the West’s financial doors are shut to Russia, and $300bn in Russian sovereign assets are frozen in Europe, Russia could find it difficult to finance its war in the long term.
What crazy times. War, oil, gas, sanctions, China and Russia. And the IMF, the OECD, and the World Bank are fields apart on predictions as to what all this will do to Russia’s economy. How much is Russia hurting? Nobody seems to know that either. With Xi and Vladimir cozying up, who knows how long this age of uncertainty will endure?
Author profile: Royce Lowe, Manufacturing Talk Radio, UK and EU International Correspondent, Contributing Writer, Manufacturing Outlook n

36 Manufacturing Outlook /April 2023
ENERGY OUTLOOK


 VIDEO INTERVIEWS AVAILABLE ON YOUTUBE
PLUS 3 MONTHLY SHOWS
APRIL 2023
MATERIALS OUTLOOK
Grabbing for Africa’s Minerals
by Royce Lowe
Every year there is an event in Africa called African Mining Indaba, a conference that those who wish to know and hear what’s going on in the mining business will attend. Africa is home to some 30% of the world’s mineral resources, so those parts of the world that aren’t so lucky, and wish to get their hands on the stuff, come crowding to see what deals they can make. This year’s event was held in Cape Town in February and attracted America’s largest delegation ever, including officials from the White House and departments of State, Commerce, and Energy.
The size of the delegation is a clue to the U.S. hunger for the 50 critical minerals it deems essential to reduce
carbon emissions and create “green jobs” in the process. By pledging to do mining differently, the U.S. says it will help transform African economies. Amos Hochstein, Joe Biden’s envoy for all things concerning energy security says, “The energy transition is an opportunity for an Africa transition.”
U.S. officials see Africa as helping to solve two problems, the first being a global shortfall in the minerals that will be required to meet the world’s climate goals. The International Energy Agency, an official forecaster, reckons that makers of clean-energy technologies will need 40 times more lithium, 25 times more graphite, and about 20 times more nickel and cobalt by 2040 than in 2020. Demand for the rare earth metals, whose applications
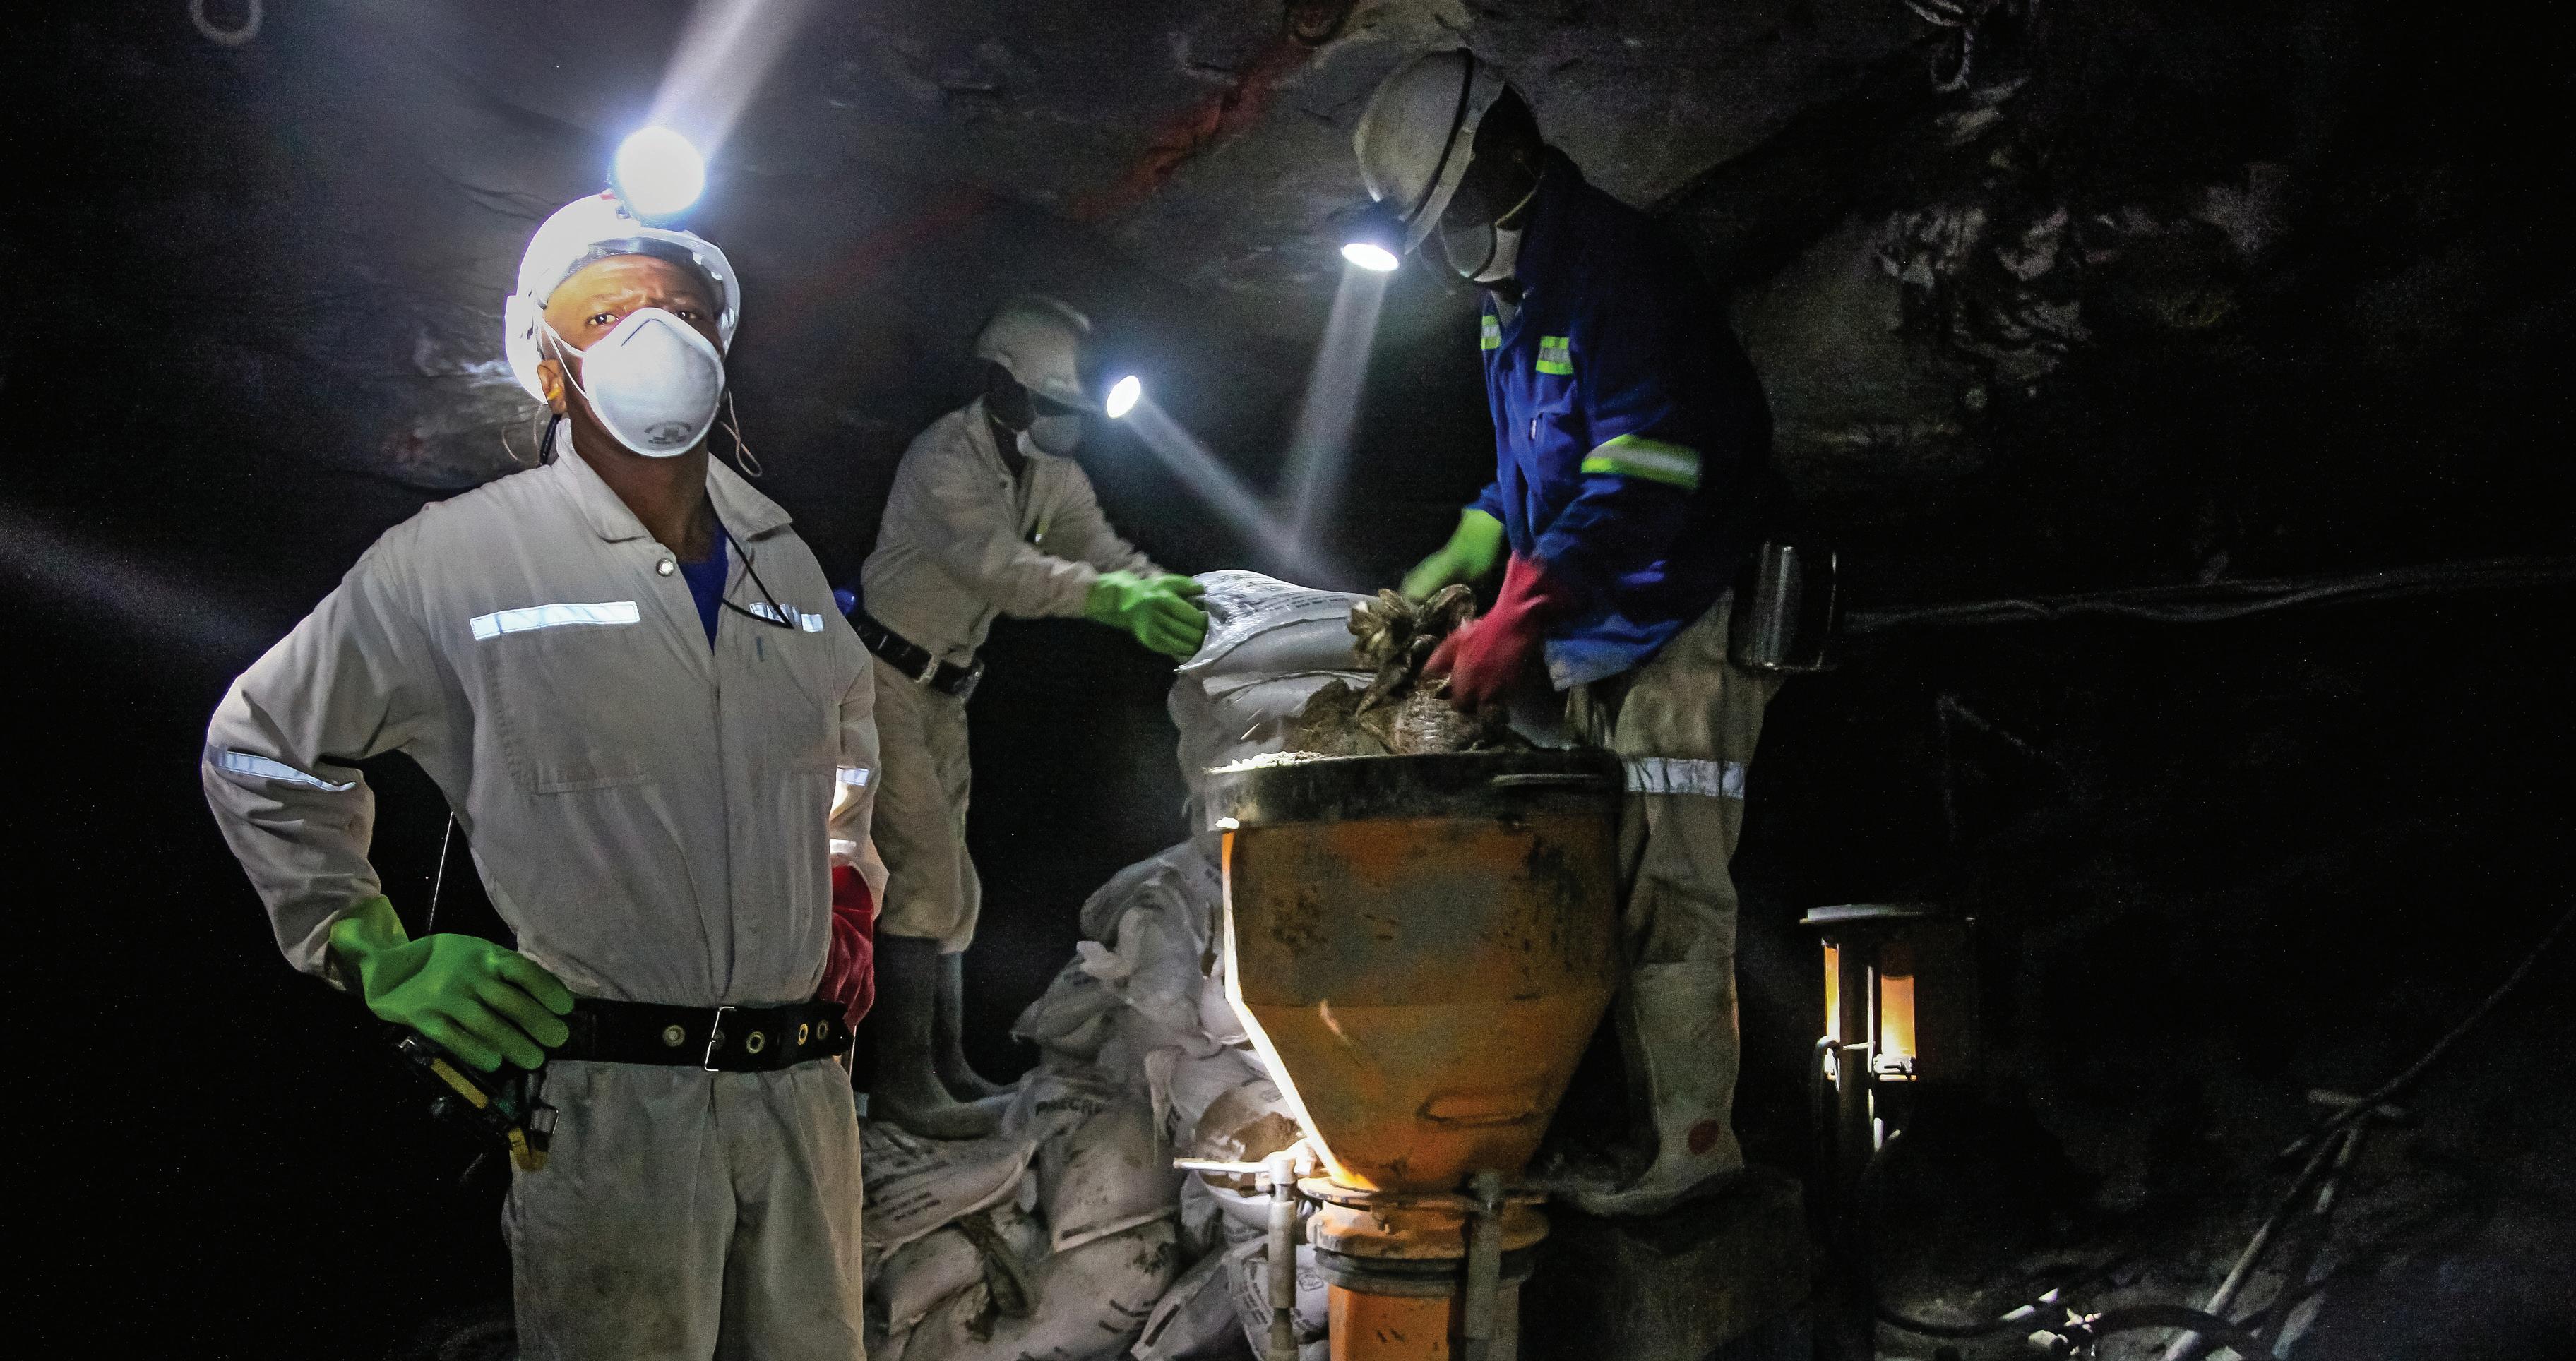
are numerous, may be seven times higher by the end of the next decade.
The second problem is particularly applicable to the West, and concerns China’s large, growing influence on supply chains. China refines 68% of the world’s nickel, 40% of its copper, 59% of its lithium, and 73% of its cobalt, according to the Brookings Institution. Brian Menell, the CEO of TechMet, a minerals company, comments that “China has had free rein for 15 years while the rest of the world was sleeping.” China is less dominant in mining, where its firms compete with multinational majors, and Western governments are concerned that, without more supply, firms will struggle to feed new downstream processing facilities that officials are keen to see built in friendly countries.
38 Manufacturing Outlook /April 2023 MATERIALS OUTLOOK
continued
Cobalt is a kind of barometer in this whole situation. Congo is the source of 70% of global production, and Chinese entities owned or had stakes in 15 of 19 cobalt-producing mines as of 2020. America’s decision to allow the sale of one of Congo’s largest copper-cobalt mines to a Chinese one in 2020 is seen in Washington as an “enormous act of stupidity.”
Last June, Antony Blinken, the U.S. Secretary of State, launched the Minerals Security Partnership, whose 13 members include all the G7 countries and the EU. Many of these countries are also in the hunt for minerals. This American-led partnership is a work in progress, but the idea seems to involve member countries supporting their own companies, which propose mining projects that will meet high environmental, social, and governance (ESG) standards. This support might include lobbying by diplomats in the country where the mine will be developed, project financed, or help attract private investment. Mr. Blinken mentioned a graphite mine in Mozambique whose owner has received a loan from the American government, which should serve to reduce the risk of conflict in the area by providing jobs to locals. Its production will be sent for processing in Louisiana.
America is looking to up its diplomacy levels in Africa. Since Joe Biden hosted more than 40 African leaders in Washington last December, several senior officials, including treasury secretary Janet Yellen, have visited the continent. Joe Biden is expected to visit this year. The U.S., Congo, and Zambia recently signed a memorandum of understanding, whereby the U.S. says it will help Africa’s two largest copper exporters build supply chains to process their raw minerals into battery precursors for electric vehicles.
Small mining companies are responding to the West’s signals. Australia is active. And BHP, the world’s biggest miner, has made its first significant investment in Africa for several years. But it is not clear whether the West’s ambitions will result in a massive increase in investment. The CEO of Anglo American says there are too few bankable projects in development. “I can’t get the math right,” he says. A consultant to the mining industry says part of the problem remains perception. “When U.S. investors think of mining in Africa, they still think of cobalt, Congo, and child labor.”
The Africans welcome and appreciate the U.S. involvement and intent, but many of them don’t think the
Americans know what they’re doing. The fears are that projects will take too long to get started because of American bureaucracy, and that America’s push to ally ESG-friendly investing with mining would not endure under a Republican president. And U.S. officials sometimes come across as patronizing when they warn Africans against doing deals with China. A former adviser to an African president says, “The Americans are completely clueless about what goes on in our politics.” He says that China’s success on the continent is due to their ability to “get things done on time.” Many African governments would like more American involvement, but they are in no hurry to let go of China.
There is little doubt that there are opportunities for the U.S. in Africa. There is also little doubt that these opportunities must be worked for. American bureaucracy does not help, neither do the whims of politicians. Somewhere there has to be compromise.
Author profile: Royce Lowe, Manufacturing Talk Radio, UK and EU International Correspondent, Contributing Writer, Manufacturing Outlook. n

Guiding Manufacturers Through Economic Turmoil

39 Manufacturing Outlook /April 2023
MATERIALS OUTLOOK
Your business needs a guide through today’s economic turbulence to assess the direction of your markets and the evolution of your industry. New World Economics tailors economic analysis and data creation for the unique needs of every manufacturing organization. For more information visit us at newworldeconomic.com
APRIL 2023
AUTOMOTIVE OUTLOOK
by Lawrence Makagon
Andreas and His Chinese EV Bloomberg spent some time recently following around a man called Andrea Tatt, who lives in Canterbury in the UK. Mr. Tatt was looking to buy a new car, and he knew it was going to be electric. He considered a Tesla Model 3 and a Porsche Taycan, but finally settled on a yellow-gold, battery-powered Polestar 2 manufactured by Volvo and its Chinese parent Zhejiang Geely Holding Group Co. Tatt waited four months for shipment from eastern China.
“I did have some concerns that the build quality may not be the best,” he says. “Upon test driving, any doubt of quality issues was put to rest.” China is going after more and more foreign customers and is on the verge of becoming the world’s No. 2 exporter of passenger vehicles. This could reshape the global auto industry and spark new trading issues.
Exports of cars made in China have tripled since 2020 to reach more
than 2.5 million last year, according to data from the China Passenger Car Association. That’s only about 60,000 units behind Germany, whose exports have fallen in recent years. China’s numbers are behind Japan’s but ahead of the U.S. and South Korea. In other words, China is hard on everybody’s heels.
Chinese brands are now market leaders in the Middle East and Latin America. In Europe, the Chinamade vehicles sold are mostly EVs continued

40 Manufacturing Outlook /April 2023 AUTOMOTIVE OUTLOOK
from Tesla and Chinese-owned former European brands such as Volvo and MG, and European brands like Dacia Spring, or the BMW iX3, which is produced exclusively in China. Not to forget Chinese companies like BYD Co., and Nio Inc., both of whom are looking to dominate in the sphere of new-energy vehicles. Backed by Warren Buffett’s Berkshire Hathaway Inc., BYD is already charming EV buyers in developed countries such as Australia. Xu Haidong, the deputy chief engineer at the state-backed China Association of Automobile Manufacturers, says the target is sales of 8 million passenger vehicles overseas by 2030, or more than twice Japan’s current shipments.
The surge in car exports has largely gone unnoticed in the U.S., partly because it happened during the coronavirus pandemic and partly because Chinese carmakers are mostly focused on Europe, Asia, and Latin America. GM did sell about 40,000 of its China-made Buick Envision compact SUVs in the U.S. in 2021, but political tensions, the continuation of Trump-era tariffs, and subsidies aimed at boosting domestic EV production have diminished the appeal of that market. In 2021, 28% of China’s exports went to the EU and other Europe, 30% to Asia, 21% to South and Central America, and 21% to other destinations. China had tried Europe in the early 2000s, but quality problems and a series of failed safety tests in 2007 ended their efforts.

The figures for 2022 are even more impressive and show an increase in passenger car exports of 56.7% to 2.529 million from an overall figure of 3.11 million, including commercial vehicles. Although most of this data was from Chinese sources, it was confirmed by figures from South Korea.
Increasing automation and resulting standardization have greatly improved quality, and Goldman Sachs Group Inc. says new auto plants in China have the highest levels of robot usage in the world. Improved quality over the past decade let Chinese cars through European safety tests with no problem. J.D. Power Initial Quality Survey suggests that the number of problems in Chinese cars converged with the US market average.
“To fight the Chinese, we will have to have comparable cost structures,” Stellantis NV CEO Carlos Tavares is quoted as stating. “Alternatively, Europe will have to decide to close its borders at least partially to Chinese rivals. If Europe doesn’t want to put itself in this position, we need to work harder on the competitiveness of what we do.” There has been, is, and will be a global push to cut carbon emissions and save the planet. This has prompted Beijing to encourage EV makers and buyers with subsidies, while a strong local supply chain has made it cheaper to make an EV in China than in any other place. Tesla’s Shanghai factory produced almost 711,000 cars last year and accounted for 52% of the company’s worldwide output. The measures have also spawned dozens of domestic manufacturers like Aiways. Many have barely made a dent, but BYD, Nio, and XPeng Inc. are among those
with the potential to shine on the global stage.
BYD, which also makes its own batteries and chips, is the biggest EV producer at home. It has ambitions of becoming the Toyota of EVs for the world’s budget buyer, and it’s betting its own cells and semiconductors will help it to reach that goal.
Tesla Inc.’s biggest competitor is likely to be a Chinese company, says Chief Executive Officer Elon Musk. Asked about Chinese car companies, Musk said they “work the hardest, and they work the smartest,” describing them as the most competitive in the world. “If I were to guess,” he said, “probably some company out of China is the most likely to be second to Tesla.” (So, still no doubt who’s the best).
The growth in the supply chain in China has also kept pace with car manufacturing. Domestic companies now make almost all parts, including those they used to import until about a decade ago, and materials such as high-strength steel and reinforced fiberglass. As a result, China ran a trade surplus in vehicles and vehicle parts for the first time in 2021. The assembly lines, however, still depend on advanced machinery from Japan and Germany. n
Lawrence Makagon, Staff Writer

41 Manufacturing Outlook /April 2023 AUTOMOTIVE OUTLOOK
CYBER SECURITY OUTLOOK
Learning the Language of Cybersecurity
By Ken Fanger, MBA, CMMC-RP, President, On Technology Partners
With as many acronyms and unfamiliar words cybersecurity professionals use, it may seem they speak their own language. This is just the cherry-ontop to an already confusing and often intimidating topic, but it may surprise you to hear that learning this foreign tongue is one of the best ways to prepare for your cybersecurity journey. I will admit that I have been sucked into the dark side of acronyms. I realized this once when I was talking at a networking event with many non-cybersecurity businesspeople. When discussing what set our businesses apart in our industries, I was proud to stand up and say, “We’re the Non-

MSP. We’re working to make sure you’re a part of the network journey.” Instead of the reaction I expected, I was met with silence and confusion. Then, someone asked, “What’s an MSP?” I was so accustomed to my everyday jargon that it didn’t occur to me that almost no one knew what an Managed Service Provider (MSP) was – it stands for Managed Service Provider, by the way.
It became evident that I was not speaking the language of my customers or even my peers; I was speaking the language of my industry. In doing this, I was alienating those
unfamiliar with the ins-and-outs of cybersecurity and working against my own desire to make cybersecurity accessible.
To help bridge the divide, I’ve defined below some of the more common terms that will help decipher what cyber nerds like me are truly talking about. I’ve also tried to explain their meanings in layman’s terms. This is not an exhaustive list, but it should give you a bit of understanding and confidence when approaching cybersecurity.
42 Manufacturing Outlook /April 2023
CYBER SECURITY OUTLOOK
continued
APRIL 2023
CMMC – Cyber Maturity Model Certification. Looking to have
a contract with the government?
CMMC is the new standard from the Department of Defense to ensure that companies have at least a basic level of cyber security and protection.
MFA/2FA – Multi-factor/Two-Factor Authentication. To boil it down simply, MFA requires you to have two or more different ways to log into your account. You may already be familiar with this, as many of us already use this authentication method with our banks and other financial institutions. This extra step, while sometimes frustrating, makes it a lot more difficult for a hacker to gain access to your accounts – not only would they need to hack your password, but they would also need to steal or otherwise gain access to your phone or alternative device/email to retrieve the verification code.
SSO – Single Sign-On. Passwords, passwords, passwords! It seems like we enter passwords everywhere, but a Single Sign-On is just wanted. It sounds like – sign on once and get access to all that you need! Yes, please!
VPN – Virtual Private Network. Remember when millions of people began working from home at the start of the pandemic? Well, it was quickly learned by many businesses that numerous employees working outside of their secure work network are a recipe for unsafe data. VPNs provide a degree of protection for situations like WFH. A VPN is a system that uses encryption (a method that makes your information unreadable to other people) to create a safer connection between your computer and the office network. A personal VPN also provides protection from people watching on the internet by creating an unreadable link to a third-party location.
MSSP – Managed Security Service Provider. Sometimes you just need (or want) someone else to take care of you. A MSSP will take care of all your security issues (but you should still be involved and accountable for all security measures).
NIST – National Institute of Standards and Technology. NIST is a government agency that builds security and compliance standards. So, if you’re stuck on what you should be doing, NIST has the answer.
DLP – Data Loss Prevention. A DLP Plan addresses the protection and recovery of important data. Let’s say you want to make sure that your client records don’t end up in the hands of a competitor, or your medical data could be stolen from your doctor’s office; this is where DLP Plans come in. A good DLP system should protect your information from both accidental losses and criminals trying to steal your information.
BDR – Backup and Disaster Recovery. “Where have 30 years of all my pictures gone?!” is never a question you want to ask. It can be deeply upsetting if your precious or vital information is lost. BDR is the process that restores important data in case of loss.
SIEM – Security Information and Event Management. How do you know you’ve been attacked? That’s the purpose of a SIEM system.
SIEMs will collect information about your computer or network and determine if there’s a threat or potential attack using real-time monitoring.

EDR – Endpoint Detection and Response. Computers are like the petri dish of your network: bad programs and viruses tend to grow there.
Protecting computers and phones, the endpoints, is the primary objective of EDR solutions.
XDR – Extended Detecting and Response. So, if EDRs ensure all your endpoints are locked down safely, XDRs protect all the equipment in between.
Now that you’ve picked up a few words in your newest language, you can go out into the world and start up that cybersecurity conversation, one step further in protecting your data.
Author profile:
Ken Fanger, MBA has 30 years of industry experience in the fields of technology and cyber security, and is a sought-after CMMC Registered Professional, helping manufacturers and contractors to meet DoD requirements for CMMC compliance. He is passionate about technology deployment, and his MBA in Operations & Logistics has helped him to be an asset in the designing and deployment of networks to enhance the manufacturing experience. Over the past 5 years, he has focused on compliance and security, including working on the SCADA control system for the Cleveland Power Grid. Mr. Fanger works with each client to identify their unique needs, and develops a customized approach to meeting those needs in the most efficient and cost-effective ways, ensuring client success. n

43 Manufacturing Outlook /April 2023 CYBER SECURITY OUTLOOK
APRIL 2023
ISSUES OUTLOOK
by Royce Lowe
Future Leaders
Jay Richards, a partner and member of the founding team at Denison, has ideas about choosing leaders for positions in manufacturing. He says bosses tend to be more about the power of their position, while a good leader looks at the influence of their position.

One of the main reasons employees leave their companies is because of their boss. Too many bosses and not enough leaders in a company will adversely affect the smooth running of that company, together with the quality of its products and harmonious relationships within its workforce. The turnover rate will be
high, and the workforce experience of the people leaving will be lost. It’s probably true to say that the more dynamic, eager employees will leave to get away from a “boss.”
To measure the characteristics of a good leader, Denison looked at results from the Denison Leadership continued
44 Manufacturing Outlook /April 2023 ISSUES OUTLOOK
Development 360 Survey, used by thousands of manufacturers over the past 25+ years, and effectiveness ratings for over 3000+ manufacturing leaders (bosses, direct reports, and peers). In this context, a direct report refers to an employee who reports to a manager, supervisor, or person in a leadership role within a company. The top five drivers of what bosses, peers, and direct reports see in effective leaders are:

1. Someone who has earned the confidence and trust of others, or someone who both gains and gives respect. They are dependable, accountable, and a model employee. They may be described as good, knowledgeable, and a hard worker. They are trustworthy and respectful. They will treat people the way they themselves would like to be treated. People on the shop floor describe this person as approachable, caring, friendly, positive, calm, and a good listener. A “people person.” Their metrics are above average; they have a strong safety, quality, and production record. They have a great attendance record and are typically in the top quartile on their performance evaluations.
2. Someone who engages others in ways that ensure buy-in and commitment. As employees move from individual contributors to supervisors/managers, you need them to act well with other supervisors/ managers. Not to set up “on their own.” Such people work well with everyone. They have friends at work and are good at setting up informal networks with people throughout the facility. They negotiate well, setting their ego aside for the good of the organization. They understand success is about we, not me. They both give good suggestions and listen to those of others. They are calm, ask good questions, and are good listeners.
3. People who are effective leaders are natural coaches. They understand the key to success for any team is to develop the people who work for them. This person’s boss has probably noted they are a natural trainer. When new people come on board, it is probably this person who does most of the training. On the other hand, this person is someone who knows how to ask for help. Delegating is a form of trust. People who seem like natural coaches tend to trust the people that work for them; therefore, they are more likely to delegate. Those who do not trust and do not delegate end up doing the work themselves and burn themselves out. The person will appreciate the importance of the development of the people working for them, and its beneficial effect on production and quality.
4. Someone who serves as a model that creates change in other parts of the organization. This person would not be described as negative. They come across as someone who generally wants to do what is best for the company. They are not interested in gossip, finding it wasteful and destructive. They talk more about process improvement and how to solve issues, and are involved in one or more process improvement
teams at the facility. They are not afraid to speak up at meetings or town halls with meaningful, constructive dialogue. They have a great work ethic and practice what they preach. People probably refer to them as a problem-solver.
5. Someone who provides employees with a clear mission that gives meaning and direction to their work. This is a good example of where the “we” comes before the “me.” The person appreciates how all the bits fit together, and is good at explaining it. There is no magic to running a company. There is no magic to people getting along. But Utopia doesn’t exist, not even in Robot land. In the final analysis, it’s up to each individual to take responsibility for themselves and for their job. Some people might enjoy a job, but just don’t want to be leaders. Some people may want to be leaders but aren’t qualified. So it’s up to the leaders of the potential leaders to decide who best fits in where. That’s a good starting point.
Author profile: Royce Lowe, Manufacturing Talk Radio, UK and EU International Correspondent, Contributing Writer, Manufacturing Outlook. n

45 Manufacturing Outlook /April 2023 ISSUES OUTLOOK


46 Manufacturing Outlook /April 2023
Champion Individual Annual Corporate
For companies of 200 or less employees — $995 For companies over 200 employees — $1,995
With your NOW!membership you receive:
l Applicant Advantage Annual Membership (student video resume portal)
l Annual membership certificate
l Finding America's Greatest Champion Book (signed by Terry Iverson)

l CNC Rocks Virtual Manufacturing Camp (annual subscription)


l Access to networking community/mentoring focused on MFG workforce development
l A promotional video produced by your company posted to the


Channel

JOIN THECAUS E JOINTHE CAUSE Help change the perception of Manufacturing in the USA! www.championnow.org terry@championnow.org 847-299-2461 Finding America’s Greatest Champion Audio Book $24.99 l eBook $9.97 Paperback $21.99 l Hard Cover $27.99 Training CNC Mill and Lathe Package Table Top Champ CNC Lathe $7,795 l Table Top Champ CNC Mill $7,795 (requires laptop or
for
Package with laptop $16,995 ➧ ➧ OUR FUTURE DEPENDS ON YOU. CNC Rocks Virtual Manufacturing Camp 22 videos 4.5 hours in length Schools: $500 annual subscription Industry: $750 annual
➧ www.championnow.org
PC
each )
subscription
Membership
ChampionNOW ROKU




MANUFACTURING TALK RADIO VIDEO PODCAST (MFGTALKRADIO.COM) Streaming New Shows Every Week (Over 1,000 Shows Since 2013) Listen To The Experts And Their Guests
Host Tim Grady
Listen to our entire family of podcasts at jacketmediaco.com
Host Lew Weiss


 by Jessica Baron


 by Dr. Chris Kuehl


 by Royce Lowe

 by Royce Lowe Blackouts; South Africa’s Huge Problem


 by Chris Anderson


 by Royce Lowe


 VIDEO INTERVIEWS AVAILABLE ON YOUTUBE


