INTRODUCTION
JOHN DE MONCHAUX Massachusetts Institute of Technology
The ability to design for growth and change is an essential one for those responsible for the invention, making and replacing of human artifacts at every scale, from nano-tubes to nations. In current city planning documents, urban research reports and planning practice the imperative to design – or plan – for growth and change is mentioned much less often than other sought-after performance outcomes such as efficiency, convenience, equity, justice, elegance, fit and others. And rarely is there data about significant changes in the setting over time or any monitoring of change in the demands that the intervention was designed to serve.
Recent annual editions of this journal have focused on some of these more familiar aspects of performance such as Justice, Equity and Sustainability (Projections 8, 9), and have examined how these performance outcomes are defined, detected and attached to the next generation of designs, plans and policy changes.
In the spring of 2010, Andres Sevtsuk, the editor for this edition of Projections, suggested that we investigate current thinking about design for growth and change. Our interest would be on whether and how contemporary design interventions in the landscape, infrastructure and other elements of the city and their companion processes, plans and policy changes, are being configured so as to underwrite their continuing performance in a future when conditions in the settings where they were introduced will have been subject to significant growth and change. Our interest has been to present speculative, theory-based ideas as much as it has been to show examples from practice. We distributed the call for papers in March 2010. With the generous help of our Editorial Board, the willing cooperation and patience of our authors, and the clear-headed energy of our Editor, MIT’s Department of Urban Studies and Planning is pleased to present seven papers on designing for growth and change.
In the paper that opens this journal, William Fawcett first reminds us that there has been very little systematic evaluation of the flow, magnitude and incidence of benefits and burdens that might arise from the explicit provision of flexibility in the design of buildings and cities to accommodate growth and change. But, he goes on to tell us that there is no such thing as a universally flexible environment. These somewhat contradictory realities lead him to suggest and demonstrate the use of the financial device of lifecycle options to derive a pattern of benefits and costs and how these are distributed.
9
de Monchaux
From a close reading of the Team 10 discussions in the 50’s and 60’s and with the benefit of more recent reflections by Alison and Peter Smithson, Jaime J Ferrer Forés builds a description of the designs for the Free University of Berlin by Candelis-JosicWoods and other approaches to the making of city parts of well connected low-rise ‘mat-buildings’. Of additional interest is Ferrer Forés’ recognition that the MIT campus itself constitutes a good example of ‘mat urbanism’. (See this journal’s cover illustrations of MIT’s growth very kindly made available to us from her thesis by Maria Zefeiriadou, SMArchS 2006).
Alexander D’Hooghe also presents the issues surrounding design for growth and change through an art/architectural history lens. He offers an account of the three formal properties successively displayed in the major infrastructure elements of the 20th century city. He suggests that the future city landscape will be enhanced by designs for new highway, drainage and open space elements of the city that meet the tests of a good system, offer their users, in the case of highways, intelligible and rewarding views of the city, and are also conceived and executed as works of art in their own right.
The re-building of existing urban areas is often a radical and frequently disruptive path to meet the demands of growth and change in the city. Once committed to that path, those responsible need to be able to summon thoughtful criteria, evidence and good judgment as to what buildings, public spaces, roads and infrastructure to preserve as working parts of the renewed urban area in order that those same facilities should serve the rebuilt area. Using a methodology derived from the renewal of the Sham Shui Po district in Hong Kong, the final paper in this journal, by Pui Leng Woo and Ka Man Hui, presents a systematic approach to the determination of ‘what to keep’, given the contribution such physical elements will make to the functions and memories of the renewed district. Of special interest is the case they make for keeping intact certain planes, points and lines embedded in the form of the existing district and able in the future, as they have been in the past, to be drawn upon to help shape the yet unknown and unknowable changes that the district will experience in the more distant future.
The remaining three papers in the journal each present a case or proposition about designing for growth and change in America. But their applicability and/or their outcome, adapted only slightly to respond to local cultural and political structures, is universal.
Grace Catenaccio shows us the workings and weaknesses of growth boundaries legislated in the 1980’s to restrain perimeter development of Portland, Oregon and Las Vegas, Nevada.
Stephen Cassell and Anne Barrett demonstrate an approach to the programming and design of the Greenwich South Area of Lower Manhattan that is based on de-
10 Projections
vising and sharing with all parties in the process configurations of built form that will respond to the current goals while keeping open genuine and varied options for change and design in the future.
Sam Bass Warner conveys the seriousness and scale of the disruption to cities and their suburbs that would flow from global warming and new economic conditions. In such circumstances he suggests that the considered densification of existing suburbs offers the best remedy to the burdens of over extended cities and their infrastructure. To provide a pool of professional skills to underwrite the design and planning of suburban infill in elegant and sensitive ways he advocates the organization of local cadres of volunteer architects and planners as an urgent supplement to existing public sector staff.
All the essays, papers and proposals received in response to the call for ideas about designing for growth and change revealed two underlying issues. First, they convey the enormous strength and reach of our abilities to gather and manipulate information about city change and the potential to apply these strengths to better understand the serious and complex issues that arise from such change. Secondly, and perhaps more critically, they remind us that attention to issues of growth and change lies at the root of the broad human concern for an enlargement of the freedoms and choices that can be made available in the future, and of the conviction that informed planning and design can make worthy contribution to that expansion of those choices.
11 de Monchaux
!"#$%&'(#)*
INVESTING IN FLEXIBILITY: THE LIFECYCLE OPTIONS SYNTHESIS
WILLIAM FAWCETT Cambridge University
ABSTRACT
Environmental flexibility is widely desired because of uncertainty about the future, but because it is poorly understood there is a risk of either under- or over-providing for flexibility. A more systematic understanding is offered by lifecycle options, which unify all aspects of environmental flexibility and allow the value of flexibility to be quantified. Lifecycle options are adapted from financial options, but instead of the advanced mathematics used in finance, lifecycle options are quantified with straightforward simulation models. Universal flexibility is impossible and whenever flexibility is sought it is necessary to specify what the flexibility is for, by defining a relevant set of possible future activity states. This can be done explicitly or by generating all possible activity states that are consistent with available knowledge. Many ingenious design strategies for flexibility already exist, and the lifecycle options approach can help determine when and where and to what extent they should be employed.
13 Fawcett
Environmental Flexibility
There is common agreement about the desirability of physical environments that can accommodate growth and change. If future growth and change could be predicted it would present a challenging technical problem but one that would be, in principle, capable of finely tuned solutions. However, growth and change cannot be predicted, which is why flexibility is sought.1
In the absence of credible predictions, people have relied on judgment, (and educated guesswork), when designing and investing in flexible environments for growth and change. There are two ways in which this could lead to poor outcomes:
• Under-provision for flexibility, leading to future problems that could have been avoided if there had been better provision for growth and change.
• Over-provision for flexibility, when provision is made for anticipated future growth and change, but not used.
Under-provision for flexibility is seen in every urban plan where a street layout scaled for a small settlement survives growth into a large city, creating congestion that is almost impossible to overcome, except by drastic surgery like Haussmann’s in nineteenth century Paris. Could the need for flexibility have been anticipated? Perhaps not in mediaeval Paris, but London rebuilt on its mediaeval plan after the Great Fire of 1666, despite the forward-looking proposals by Wren, Hooke and others.
A classic example of over-provision for flexibility is the Free University of Berlin by Candilis-Josic-Woods. Won in competition in 1963 and built in 1967-74, it is an indeterminate two-storey network (Figures 1, 2). The architects sought ‘a tentative use of a minimum structuring system where individuals and groups may determine desirable relationships’ (Joedicke, 1968). In their design concept, ‘The need for the building to be adaptable to different work programs has been dealt with through a flexible system “in the four dimensions”. … So a totally industrialized flexible constructional system has been adopted as the standard for this building. … Entire blocks of the building can be dismantled and put up again elsewhere’ (CJW, 1975). The building was a disaster. There was physical disintegration, institutional collapse and vandalism (Bensing, 2005). By the 1990s a major refurbishment was required. Comparison of the plans in 1974 and post-refurbishment show that the building envelope did not move, and the main internal alteration was the division of larger spaces into small offices – which could be done in studwork without the totally flexible construction system. It seems that the architects drastically over-valued the excessive (as it turned out) provision of physical interchangeability.
There are many examples of mismatches between investment in flexibility and the
14 Projections
Figure 1. The Free University, Berlin, under construction in 1970 (Candilis-Josic-Woods, architects). A complicated kit-of-parts construction system provided opportunities for reconfiguration that were never used.
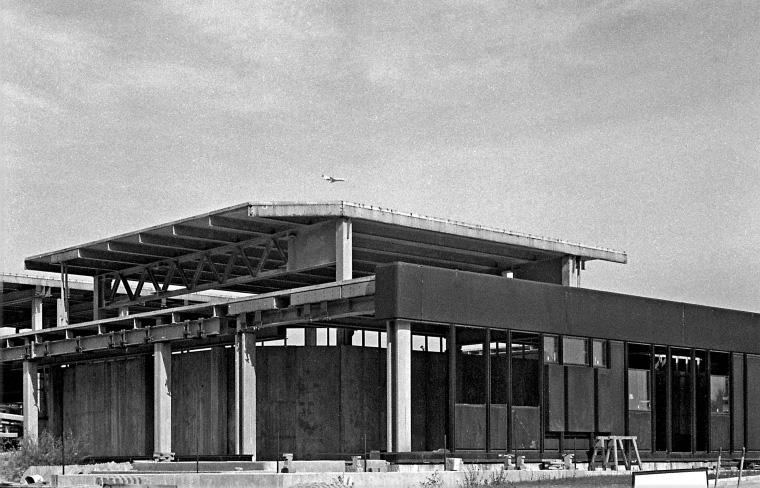
Figure 2. The bland interior of the Free University, Berlin, that resulted from a uniform, indeterminate and supposedly flexible design strategy (photo David Heath, 2009).

change that actually happens. To identify efficient strategies for environmental flexibility, minimising the risk of under- and over-provision, a more rigorous approach is needed.
Lifecycle Options
Over the last ten years or so a proposal for transforming environmental flexibility into a well-defined and quantifiable environmental attribute has been developed in Cambridge, UK, based around the core concept of ‘lifecycle options’.2 The research began with a study of evaluation tools for the sustainable refurbishment of existing buildings: designers come up with many ingenious ideas – but which ideas are best? Evaluating sustainability requires a long-term perspective, which should be provided by whole-life costing. But current methods of whole-life costing assume that the future can be predicted, an impossible precondition. The research developed a new approach to whole-life costing that acknowledges future uncertainty, and favours flexible strategies that can respond to unfolding events.
In this approach, a lifecycle option is a feature of a design or plan that makes it possible for new decisions to be made in the future. A simple example: if the future size of a hospital, university or factory is uncertain, build for current requirements and retain open space into which the buildings could be expanded. The retention of open space creates the lifecycle option to expand, which has flexibility value even though it is not known when, if ever, the expansion will be carried out. Lifecycle options transfer decision-making from people in the present to people in the future who will know more about the changing state of the world.
All existing propositions about environmental flexibility can be restated precisely in lifecycle options terms; for example, the lifecycle option of retaining land for future
15 Fawcett
expansion is seen in every master plan where phase two growth is indicated with arrows and dotted lines. There are two reasons for adopting the lifecycle options framework. First, diverse and apparently disconnected mechanisms for providing flexibility, for example, managerial and physical strategies, can be unified in a consistent framework; and more importantly, the lifecycle options framework gives a way of measuring and putting a value on flexibility, which up to now has been out of reach.
When the value of a flexible project incorporating lifecycle options is quantified, it can be compared to the cost of providing the options – if value exceeds cost it is worth investing in the flexible project, otherwise not. By valuing lifecycle options the risk of under- or over-provision for flexibility is minimized.
There are many kinds of lifecycle option. Some are embedded options: they exist even when they are not recognized. For example, a suburban bungalow with a large garden might be sold for a higher price than its owners expected, because they did not realize that they held the option to demolish the bungalow and develop a block of flats. Overlooking option value leads to incorrect valuation – usually under-valuation.
Other lifecycle options are acquired by some deliberate action. For example, a parcel of land without road access to a highway cannot be developed for housing, but if its owner buys a strip of land that is wide enough for an access road, he creates the option to develop the landlocked parcel. The increased value due to the development option must exceed the price paid for the access strip, or the deal wouldn’t go ahead.
Lifecycle options can be destroyed as well as created. For example, if a Victorian warehouse on a city centre site is declared a historic monument and protected from demolition, the option to redevelop the site is destroyed. The loss of the option reduces the value of the warehouse, or more accurately the value of the land on which it sits.
Environmental value is affected by other people’s lifecycle options. One reason why tenants buy the freehold of the house they are renting is to eliminate the landlord’s option to terminate the tenancy. An option was one factor when the architect Sir Albert Richardson and his wife were house-hunting in 1909: ‘Cavendish house in the London Road, St Albans, happened to be on a lease with the option to purchase and they took it because of its attractive front facade with Gothick sash windows’ (Houfe, 1980).
When an environment has embedded lifecycle options that are unrecognized they still exist, but there are two problems. First, lifecycle options contribute to environmental value, so if they are overlooked the environment may be undervalued. Second, unrecognized lifecycle options may be inadvertently destroyed. For example, when Victoriana was out of fashion many ornate shop fronts were boxed out or removed; boxing out retained the lifecycle option to reinstate when Victoriana came back into
16 Projections
fashion – as it now has – but removal destroyed this option. When removing Victoriana, the option to reinstate was ignored or assumed to be of negligible value, but the cycle of fashion is so inexorable that boxing did have positive option value.
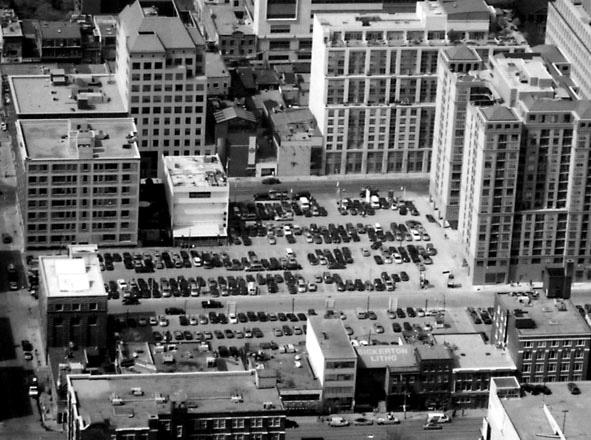
Lifecycle options can explain phenomena that are otherwise puzzling; for example, why are valuable city center sites used for car-parking (Figure 3)? Because the property owners believe that it is more valuable to retain the option to develop in the future than to proceed with current development in unfavourable market conditions. The owners rent the space as a parking lot and retain the lifecycle option to develop when the market changes. An option-holder can always choose whether it is more advantageous to exercise the option or retain it for possible future exercise – until the option expires.
The principles of lifecycle options are presented in the book New Generation Wholelife Costing (Ellingham & Fawcett, 2006); many examples in the book are at building scale but the ideas are equally applicable at urban scale.
The Real Options Paradigm
Lifecycle options are based on a direct analogy with financial options. Financial options have a long and controversial history, and only became fully accepted with the publication in 1973 of the revolutionary Black-Scholes equation for establishing the fair price for an option.3 Options are now an integral part of financial trading and were implicated in the recent financial crisis, but as Akerlof and Shiller note, ‘…there are two sides to creative finance: it may have gotten us into this crisis, but its genius may also get us out of it’ (Akerlof & Shiller 2009, p.92).
In a financial option, a deal is struck to buy or sell financial commodities at an agreed price within a specified time, but the option holder can choose whether or not to complete the transaction. The option holder has to buy this option contract, usually for a much smaller sum than the transaction itself. The option holder exercises the option and completes the transaction if it is financially advantageous to do so (the option is ‘in the money’), otherwise it is allowed to lapse (the option is ‘out of the money’) and the premium paid for the option is lost. When the option contract is
Figure 3. High-value city centre sites in Toronto in lowvalue car-parking use: the sites’ value comes from the lifecycle option to develop when the market for office development improves, not from car-parking income.
17 Fawcett
drawn up, it is uncertain whether the option will turn out to be ‘in the money’ or ‘out of the money’ (Brealey et al, 2007, explain financial options).
The two basic forms of financial option are the ‘call’ and the ‘put’ – options to buy and options to sell.
A call option confers the right but not the obligation to buy an asset at a specified price, within a given timescale. If the market price of the asset rises above the strike price the option is ‘in the money’ and is exercised; if the market price remains below the strike price the option stays ‘out of the money’, so it expires unexercised and the premium is lost. If the option is exercised, the difference between the market price and the exercise price is profit for the option-holder.
A put option is the mirror-image of a call. It confers the right but not the obligation to sell an asset at a specified price, within a given timescale. If the market price of the asset drops below the strike price the option is ‘in the money’ and is exercised; if the market price remains above the strike price the option stays ‘out of the money’, so it expires unexercised and the premium is lost. If the option is exercised, the difference between the market price and the exercise price is profit for the option-holder.
When options ideas are used in business rather than financial markets, they are called real options (Mun, 2006). Willis describes the use of options in the assembly of sites for the interwar New York skyscrapers, two generations before the BlackScholes equation: ‘Keeping the scope of their plans secret so as to protect against “hold-outs”, brokers would approach owners of various plots to arrange for [call] options in the names of different companies’ (Willis 1995, p.160). If options could be successfully acquired for all the plots forming a skyscraper site, they would be ‘in the money’ and exercised so that redevelopment could proceed; if the whole site could not be assembled, the options that had been acquired would be allowed to lapse.
All lifecycle options give value to the option-holder because they are only exercised if it is advantageous to so, but option value varies greatly from case to case and depends on the following factors:
1. The amount of uncertainty: In a situation with no uncertainty about the future, lifecycle options are pointless. As the amount of uncertainty about the future increases, the value of lifecycle options increases as well.
2. Duration of the option: Some lifecycle options are effectively perpetual, like a property owner’s option to sell. Others have a fixed term; for example, planning consents in the UK are usually valid for five years – if the option to develop is not exercised within that period it lapses. The longer the life of an option, the higher its value.
18 Projections
3. The probability of exercising the option: Every option has a trigger point, and if this point is reached it will be exercised, but the probability of reaching the trigger point varies. A lifecycle option has nil value to an investor who does not believe that it could ever be exercised. Compare, for example, two lifecycle options embedded in a power station for electricity generation: there is a higher probability of exercising the option to switch fuels from coal to oil than the option to switch use from a coal-fired power station to an art gallery – although both options were successively exercised at the Bankside Power Station in London, which is now the Tate Modern gallery. The greater the probability of exercising a lifecycle option, the higher its value.
4. The time to exercise: The value of lifecycle options is derived from future benefits, and the phenomenon of time preference tells us that people attach more value to a benefit that is received today compared to the same benefit received a year from now, and much more than if it is received far in the future. People have different intensities of time preference; a Cambridge college, for example, recently bought the option to acquire a river-front site in 125 years time; the college was founded over 700 years ago and took a long-term view, but even so the option would have been more valuable with an earlier exercise date. The earlier the probable exercise date of a lifecycle option, the higher its value.
5. The cost of exercising the option: Some options can be exercised at no cost; for example, if a building is repainted every five years, there is a no cost option to change the colour every five years. Most options incur a cost penalty when they are exercised; compare, for example, two technologies that provide the option to move non-structural partitions in a building: if the partitions are made of plastered blockwork it is slow, disruptive and expensive to exercise the option, but if they are made of demountable panels it is much quicker and cheaper to exercise the option – so people are prepared to pay more for demountable partitions. The lower the cost of exercising a lifecycle option, the higher its value.
6. The resulting benefit: The value of a lifecycle option depends on the scale of the benefit that would be derived from exercising it. For example, the benefit derived from exercising an option to change colour when repainting a building is modest. On the other hand, the benefit from exercising an option to extend the building stock of a university is very great – without it the university’s development might be strangled. This is why the new universities founded in the UK in the 1960s had large sites of at least 80 hectares, even though start-up student numbers were tiny: the cost of acquiring and retaining empty land bought the valuable option to expand. The value of a lifecycle option increases with the scale of the benefit that would result from exercising it.
These principles can be applied qualitatively when evaluating the lifecycle options or flexibility – indeed ‘options thinking’ is perhaps a greater contribution to good
19 Fawcett
decision-making than quantification. However, quantification of lifecycle options, and hence flexibility, is also possible in many situations.
Quantifying Lifecycle Option Value
The range of possible lifecycle options is unlimited, but they fall into three main types:
• Lifecycle options to expand/upgrade: for example, when specifying the infrastructure for a new urban extension, providing generous infrastructure capacity in relation to initial needs will create the lifecycle option to add further development. This corresponds to a typical strategy for environmental flexibility – the provision of redundancy or overcapacity, like the street grid of Manhattan.
• Lifecycle options to switch: for example, many non-prime office buildings in London have been changed to residential use – the office buildings had an embedded lifecycle option to switch use, even though it may not have been an objective in the original design. There are also acquired switch options, for example, when a high price dual-fuel boiler is specified because it creates the option to switch fuels in response to future changes in fuel costs and supplies. Provision for changing the use of a building, even when no physical adaptation is required, is also an example of a switch option.
• Lifecycle options to contract/abandon: for example, most multi-phase master plans are changed or abandoned before completion, so there is merit in devising plans that work well at each stage, even if later stages never happen. This corresponds to the concept of robust plans discussed by Rosenhead et al, although they do not use options terminology (Rosenhead et al., 1972).
Lifecycle options can derive from physical characteristics of the environment, like non-structural partitions that are easier to relocate, and they can also derive from social conventions or legal/contractual arrangements, for example, planning rules that permit change of use.
The ways of calculating lifecycle option value are similar for all types. The sophisticated techniques developed for valuing financial options would be the natural starting point, but in fact they are of limited value. There are three reasons: first, financial commodities are interchangeable and transactions repeatable, whereas all environments have unique characteristics; second, there are large and accurate databases of past financial transactions, providing input data for advanced mathematical modeling, whereas historic data about environments is patchy and vague; and third, the financial industry employs many high-powered mathematicians, but there are few working in construction or the environment.
20 Projections
As a result, lifecycle options are usually valued with relatively straightforward simulation methods, as in the examples in New Generation Whole-life Costing (Ellingham & Fawcett, 2006). The following example of a lifecycle option to expand/upgrade is based on a viaduct over a valley in Toronto that was built in 1919.4 The viaduct was initially required for road traffic, but the city was aware that a new railway commuter line might be built later along the same route. The new viaduct could be built for road traffic only, or with a road and railway deck, or with a roadway and the lifecycle option to add a future railway deck. Thus the city had three viaduct alternatives:
A. road-only viaduct, costing $30m (all prices adjusted to today’s values)
B. viaduct with an upper roadway and a railway on a lower deck, costing $38m
C. viaduct with an upper roadway and the lifecycle option to add a railway on a lower deck, costing $34m – the option adding $4m to the cost of a road-only bridge.
Additional data:
Exercise cost of adding railway, if lifecycle option acquired: $6m
Cost of building separate railway viaduct: $20m
Probability and timing of a new commuter line: 60% probability within 50 years Discount rate to reflect time preference: 2.75% per year (a low rate for public investment).
The uncertain future as viewed from 1919 was simulated with 500 scenarios, in each of which the year of constructing the new commuter line, or of not constructing it within 50 years, was generated using random numbers; in Alternative C, this would be the date of exercising the lifecycle option to add the railway to the viaduct. The three viaduct alternatives were evaluated for all of the 500 scenarios, and the costs incurred in carrying the commuter line across the valley discounted back to 1919 using the 2.75% per annum discount rate, giving the present value at the time when the decision had to be made. The result is shown in Table 1: Alternative C, with the lifecycle option to upgrade the viaduct, performs best in the simulation.
The viaduct was in fact built with the lifecycle option to add a railway (Alternative C), but the Great Depression and World War II – unexpected events! – intervened and the commuter line was not constructed until 1966, 47 years after the option had been acquired. Had the city known in 1919 that the commuter line would be constructed in 1966 they would have gone for the cheapest viaduct with a roadway only (Alternative A) – but with the uncertain knowledge that was actually available in 1919 their decision to invest in the lifecycle option was rational.
It is important to realize that all decisions about lifecycle options and flexibility have to be made with present knowledge, despite the fact that it is incomplete. If better knowledge were available, it would be used. Decision-makers know that later events will supersede their knowledge but this does not help them at all – except to reinforce
21 Fawcett
Alternative A: road viaduct only Alternative B: road and railway viaduct
Alternative C: road viaduct with lifecycle option to add railway
Initial cost$30m£38m$34m
Action when and if commuter line constructed
Present value of cost of action, discounted to 1919 – average of 500 scenarios
Build new railway viaduct, costing $20m No action required Exercise option to add railway, costing $6m
$7.4m0$2.2m
Total $37.4m$38m$36.2m
Table 1: Simulation results of lifecycle options for a viaduct over a valley in Toronto as seen in 1919.
the wisdom of providing lifecycle options.
Envisaging Possible Activity States
In the viaduct example the alternative strategies were evaluated with reference to a set of scenarios reflecting the decision-makers’ state of knowledge about possible future events. If a different set of scenarios had been used, the strategies would have been valued differently. Is there a paradox? – flexible strategies are sought because it is impossible to predict the future, but the evaluation of flexibility requires that possible futures are specified.
It is not a paradox, but it demonstrates something about flexibility that is not always acknowledged. Environmental flexibility cannot be added in ever-increasing quantities until eventually a universally flexible environment is achieved – one that could accommodate all possible future demands of any kind. This is fantasy: there is no such thing as a universally flexibile environment.
Any environment can accommodate a range of activity states – some environments are tightly adapted for a narrow range of activities, for example, a nuclear power station site, and others can be used in many different ways, for example, a gridded city like Manhattan. Environments with a wider range of possible uses are certainly more flexible, but each environment is flexible in a specific way. Manhattan is much more flexible than a nuclear power station site, but it cannot accommodate a nuclear power station.
Thus, when environmental flexibility is sought, one has to be able to answer the question – what is the flexibility for? One might imagine that flexibility makes the question
22
Projections
irrelevant, but this is incorrect. It is answered by defining a set of possible activity states, not states of configuration of the physical environment – a static environment may be able to accommodate all relevant activity states without physical change.
If a design with a changeable physical environment is put forward as a strategy for flexibility without an explicit statement about the relevant set of future activity states, then the design implicitly defines its flexibility by the activity sates that it can actually accommodate – and the flexibility may be of limited value. This seems to have been the case at the Free University, Berlin: the physical fabric could be changed, but it was not clear what activity states would require the physical change, and in fact there was very little physical change.
The Ensemble of Possible Activity States
In some cases the question ‘what is the flexibility for?’ can be answered with a list of the relevant activity states; for example, a family house might require flexibility to accommodate the successive stages of a family with young children, older children, and then elderly parents. But broader ranges of activity states can be defined by possible attribute values, not an exhaustive list; for example, a hospital accident and emergency centre might require flexibility to cope with demand between 100 and 200 patients per day and a male-female ratio between 60% and 40%. From the specified attribute ranges future scenarios can be simulated, as in the 500 scenarios for the viaduct example.
This is getting close to what Wiener termed the Gibbsian approach (Wiener, 1954), named after the Yale physicist J W Gibbs (1839-1903): ‘Gibbs’ innovation was to consider not one world, but all the worlds that are possible answers to a limited set of questions concerning our environment.’ The answers are termed the ensemble of possible states of the system. ‘If all objects are given, then at the same time all possible states of affairs are also given,’ as Wittgenstein observed (Wittgenstein, 1922, §2.0124).
Specifying the ensemble of all possible activity states may seem over-ambitious, but the level of description can exclude unnecessary detail. Take a pared-down but important example: the ways that a population of people can divide into separate groups. This is important for matching the physical environment to activities – when visiting a cinema a population is grouped together in a single space, but at a hotel a population is divided into sub-groups requiring many smaller spaces. The possible groupings of a population can be enumerated: for a population of four people there are five groupings (Figure 4a), and for a population of seven people there are 15; for larger populations the numbers rise quickly (Fawcett, 1979b). If the population is made up of distinct individuals, the number of ways that they can arrange themselves into a particular pattern of grouping can also be enumerated: these can be called microstates
23 Fawcett
Figure 4a. (left) There is a finite number of ways that a population can divide into groups – for a population of 4 there are precisely 5 possible groupings.
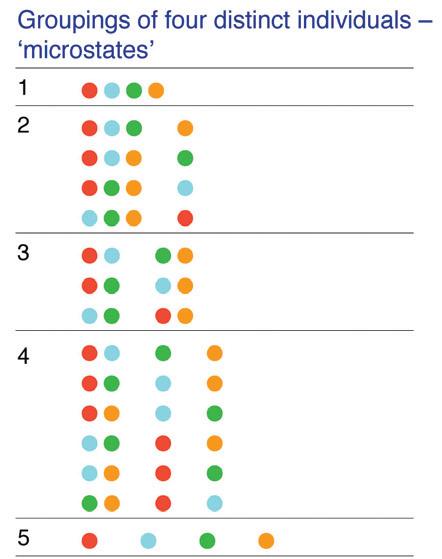

Figure 4b. (right) If the members of the population are distinct individuals, it is possible to enumerate microstates showing the possible ways that the individuals can form the groupings. The microstates are not evenly distributed across groupings. If all microstates are equally likely to occur, the number of associated microstates is a measure of the groupings’ probability of occurrence. If there is uncertainty about future grouping of a population, it is reasonable to believe that the groupings with the largest number of associated microstates are more likely to occur.
associated with the grouping (Figure 4b). There is wide variation in the number of microstates associated with different groupings; if the individuals in a population were able join groups in an unconstrained way, one would imagine that each microstate would have equal probability of occurrence and that the groupings with most associated microstates would be more likely to occur. This means that the probable patterns of grouping in a population can be anticipated, even when there is no information about people’s names, age, social class, reasons for joining other individuals, etc.
Following this line of reasoning, mathematical analysis predicts that the most probable groupings will follow a characteristic skewed pattern, with few very small groups, many quite small groups, and a diminishing number of groups as the size gets larger. Mathematically it is a positive Poisson distribution (Fawcett, 1979a).5 This theoretical result can be compared with empirical studies of free-forming groups carried out independently by James (James 1951, 1953). He observed regularities that matched the skewed distribution described above, and Coleman concluded that the observed groupings followed a positive Poisson distribution (Coleman & James, 1961) – a gratifying convergence of theoretical and empirical investigations. Both studies worked with highly simplified activity descriptions: choosing attributes parsimoniously is crucial for the Gibbsian approach.
Designing for Activity Uncertainty
How does this connect to environmental flexibility? Flexibility is sought because of uncertainty about future activity states, but the Gibbsian approach shows that we often know more about possible activities than we realise. This knowledge should be used.
Consider a worked example, about the design of a set of seminar rooms for a uni-
24 Projections
versity department with 80 students. Because the sizes of seminar groups is unpredictable a flexible design is required. Simplifying the problem, suppose that seminar groups are always made up of multiples of 10 students; then there are 22 possible seminar groupings, with 4945 microstates (Figure 5a); as before, the groupings have varying numbers of microstates, so are not equally likely to occur.
Suppose there are three alternative designs to evaluate (Figure 5b): (A) has four moving partitions that allow it to adopt 16 (i.e. 24) layout configurations; (B) has a slightly larger floor area but no moving partitions; and (C) is like (B) but with just one fixed partition replaced with a moving partition – it can adopt two layout configurations. When the three designs are compared with the Gibbsian ensemble of seminar microstates, (A) performs worst and (C) best. The results are shown in the Table 2.

It is evident that a design which aims to provide flexibility for activity change must be evaluated by comparison with possible activities, not by counting the number of
Grouping Seminar group sizes Microstates
1 80 1 2 70 10 8 3 60 20 28 4 60 10 10 28 5 50 30 56 6 50 20 10 168 7 50 10 10 10 56 8 40 40 35 9 40 30 10 280 10 40 20 20 210 11 40 20 10 10 420 12 40 10 10 10 10 35 13 30 30 20 280 14 30 30 10 10 280 15 30 20 20 10 1680 16 30 20 10 10 10 560 17 30 10 10 10 10 10 56 18 20 20 20 20 105 19 20 20 20 10 10 420 20 20 20 10 10 10 10 210 21 20 10 10 10 10 10 10 28 22 10 10 10 10 10 10 10 10 1 4945
Fig 5a. The 22 possible states of grouping for seminars with 80 students, when seminar sizes are in multiples of 10 students; and the associated number of seminar microstates.
Figure 5b. Three alternative designs for a set of seminar rooms, where each spatial module can accommodate 10 students. Alternative A has eight spatial modules; Alternatives B and C have nine. The partitions between modules are fixed partitions (solid line) or movable partitions (zig-zag line).
25 Fawcett
different physical configurations. Designers may find this unwelcome, as they have control over the physical environment and can expend their ingenuity on ways of increasing physical changeability. But to produce flexible designs or plans they have to engage with activity uncertainty, and the Gibbsian approach makes this possible even when there is little specific data about activities. It is not tenable to argue that provision for maximum physical reconfiguration is a valid response to activity uncertainty.
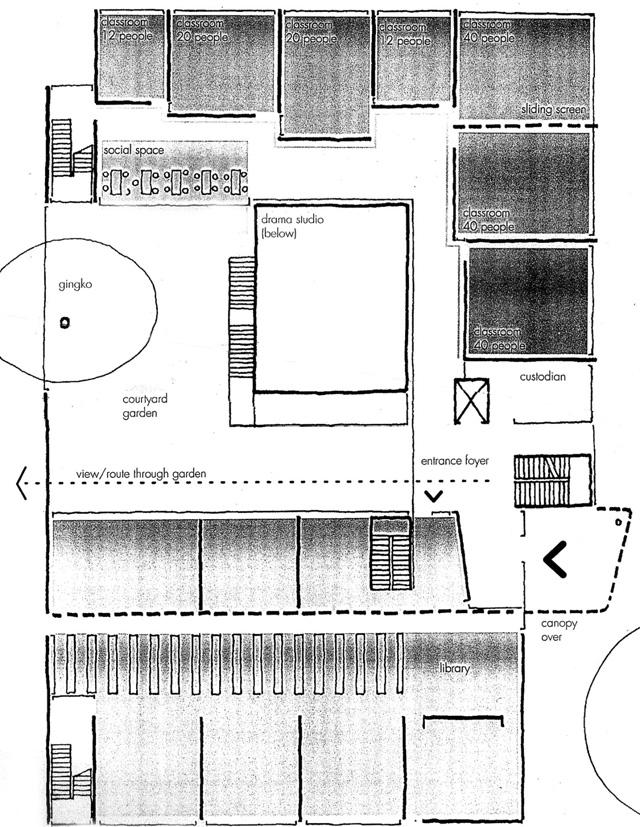
This theory was put into practice in the new building for the Faculty of English in the University of Cambridge (Allies and Morrison, architects, 2004) (Figure 6a, 6b). The author proposed that the sizes of seminar rooms should approximate to a positive Poisson distribution, with few very small rooms, more quite small rooms and a small number of larger rooms, as shown in Table 3.6
This proposal is in contrast to the ‘modularity bias’ of many architects who assume that a set of identical rooms will be most flexible. The Poisson-derived seminar room strategy was carried out in the Faculty of English and feedback from users of the new building has been positive – so far.
Alternative A:Alternative B:Alternative C: Possible layout configurations 16 1 2
Possible seminar groupings accommodated (max 22) 735
Possible seminar microstates accommodated (max 4945) 1695 2660 3290
Table 2 Possible layout configurations of layouts A, B and C in Figure 5b.
Room type and size Number
small group/supervision room (3 people) small class/seminar room (16 people) class/seminar room (24 people) classroom (30 people) large classroom (70 people) lecture room (100 people)
3 2 2 3 1 1
Table 3 The proposed distribution of seminar room sizes at the Faculty of English building in the University of Cambridge.
26 Projections
Figure 6a. The sizing of seminar rooms in the new Faculty of English building in the University of Cambridge (Allies and Morrison, architects, 2004) was based on an approximation to the positive Poisson distribution, to provide flexibility when there is uncertainty about the size of seminar groups.
Figure 6b. A design study for the ground floor of the Faculty of English building shows the size variation of seminar rooms (upper part of plan). The smaller seminar rooms were distributed around the building.
Conclusion
This paper has argued that environmental flexibility for future growth and change in activities is derived from lifecycle options, and that flexible strategies must be evaluated by comparison with an ensemble of relevant activity states. It is a pragmatic approach that attempts to make the concept of flexibility precise, quantifiable and useful.
The history of flexibility as a design objective has been far from precise, quantifiable and useful. It has sometimes been elevated to inappropriate prominence and used to justify crushing banality or irrational extravagance. The Free University, Berlin, falls into the first category (and the banality was expensive to build); the Centre Pompidou7, Paris, falls into the second, where flexibility ‘seems to have led to an overschematic solution … It is difficult to envisage any function which would require an unimpeded fifty-metre span with a height limitation of seven metres’ (Colquohoun, 1981, pp.116117). Neither tendency would be supported by a rational understanding of flexibility.
Even when flexibility has been pursued soberly, it has been unfocused. Lifecycle options to enhance/upgrade, to switch elements, or to contract/abandon are often encountered in the literature on design for flexibility, although the options terminology is
27 Fawcett
new. For example, Weeks’ papers on ‘indeterminate architecture’ and ‘multi-strategy buildings’ offer a fairly comprehensive overview of what can be done by architects to create lifecycle options (Weeks 1963; 1969). What is missing is a method for evaluating the options and deciding when and where and to what extent they should be employed.
The opportunities for re-inventing the wheel in design for flexibility seem inexhaustible. The catalogue of ingenious ideas in Flexible Housing by Schneider and Till is depressing, partly because of the duplication of design effort, but especially because no effort is made to test the ideas assembled so laboriously, either by simulation or by surveying the experience in use of the projects that were built (Schneider & Till, 2007). It implies that the field is open for the endless recycling of untested ideas.
By demystifying environmental flexibility the lifecycle options approach may strip the topic of some of its fascination, but if the approach can increase the long-term value of construction investment this will be a fair exchange.
ENDNOTES
[1] In this context the words flexibility and adaptability overlap in meaning. Sometimes a distinction is drawn between the precise meanings of the two words but, confusingly, this is not done in a consistent way. Here the word flexibility is used exclusively.
[2] The original study of lifecycle options was led by Cambridge Architectural Research Ltd, supported by two grants in the UK Department of Trade & Industry’s ‘Partners in Innovation’ programme of construction industry research, 1998-2002. Dr Kanak Patel of the Department of Land Economy in the University of Cambridge participated in the research team. The research is continuing through the European Commission-funded CILECCTA project (2009-13) – see www.cileccta.eu
[3] The Black-Scholes equation for pricing financial options was developed by Fischer Black, Myron Scholes and Robert Merton. Scholes and Merton were awarded the Nobel Prize for Economics in 1997; Black had died in 1995. For a survey see (Boer, 2002).
[4] This example was provided by Dr Ian Ellingham; the viaduct is real but the numbers are illustrative.
[5] The Poisson distribution is a mathematical formulation, defined in the early 19th century, that is widely used in the statistical analysis of social and physical processes. For example, it expresses the probability of a number of events occurring in a fixed period of time if these events occur with a known average rate and independently of the time since the last event.
[6] The advice was part of a pre-design and briefing study carried out by Cambridge Architectural Research Ltd.
[7] Renzo Piano & Richard Rogers architects, 1972.
WORKS CITED
Akerlof, G, and R Shiller (2009) Animal Spirits: how human psychology drives the economy and why it
28 Projections
matters for global capitalism (Princeton: Princeton University Press)
Bensing, C (2005) Review of refurbishment of the Free University, Berlin, by Foster & Partners. Architects’ Journal vol.222, no.8, pp.33-47, 15 September 2005
Boer, P (2002) The Real Options Solution: finding total value in a high-risk world (New York: Wiley)
Brealey, R, S Myers and F Allen (2007) Principles of Corporate Finance (9th edn) (New York: McGraw Hill)
CJW (Candilis Josic Woods) (1975) ‘Architect’s Report’ on the Free University, Berlin. Domus no.534, pp.1-8, May 1975
Coleman, J, and J James (1961) ‘The Equilibrium size of freely-forming groups’ Sociometry vol.24, pp. 36-45
Colquhoun, A (1981) Essays in Architectural Criticism (Cambridge, Mass: MIT Press)
Ellingham, I, and W Fawcett (2006) New Generation Whole-life Costing: property and construction decision-making under uncertainty (London: Taylor & Francis)
Fawcett, W (1979a) ‘All possible and most probable activity schedules in organisations’ Environment & Planning B, vol.6, pp.23-154
Fawcett, W (1979b) ‘Catalogue of activity schedules for small organisations’ Environment & Planning B vol.6, pp.293-300
Houfe, S (1980) Sir Albert Richardson: the Professor (Luton: White Cresset Press)
James, J (1951) ‘A Preliminary study of the size determinant in small group interaction’ American Sociological Review vol.16, no.4, pp.474-477
James, J (1953) ‘The Distribution of free-forming small group size’ American Sociological Review vol.18, no.5, pp. 569-570
Joedicke, J (1968) Candilis Josic Woods (London: Tiranti)
Mun, J (2005) Real Options Analysis (2nd edn) (New York: Wiley)
Rosenhead, J, M Elton and S Gupta (1972) ‘Robustness and optimality as criteria for strategic decisions’ Operational Research Quarterly vol.23, no.4, pp.413-431
Schneider, T and J Till (2007) Flexible Housing (Oxford: Architectural Press)
Weeks, J (1963) ‘Indeterminate architecture’ Transactions of Bartlett Society vol.2, pp. 83-106.
Weeks, J (1969) ‘Multi-strategy buildings’ Architectural Design October, pp.536-540
Wiener, N (1954) The Human Use of Human Beings: cybernetics and society (New York: Houghton Mifflin)
Willis, C (1995) Form Follows Finance: skyscrapers and skylines in New York and Chicago (New York: Princeton Architectural Press)
Wittgenstein, L (1922) Tractatus Logico-Philosophicus (1961 English edition – London: Routledge & Kegan Paul)
29 Fawcett
!"#$%&'(#)*
URBAN GROWTH BOUNDARIES: TWO AMERICAN EXAMPLES
GRACE CATENACCIO
Princeton University
ABSTRACT
The urban growth boundary—a regional boundary circumscribing a metropolitan area and distinguishing areas for urban development from areas to be preserved as rural or wilderness— is widely seen as a promising tool for reining in urban sprawl. This paper compares the growth of two cities, Portland, Oregon, and Las Vegas, Nevada, which have, for different reasons, grown within the limits of externally imposed boundaries since the early 1980s. Through a parallel analysis of the two cities’ statistical profiles, and of the planning policy decisions that have carried them to their present state since the 1970s, it investigates what impact planned growth boundaries have on the development of urban form, and raises questions about the role of planning in bringing about successful urban growth.
31 Catenaccio
Introduction
This paper compares the growth of two American cities: Portland, Oregon and Las Vegas, Nevada. At first glance, the two could not seem more different: Portland, paradigm of wholesome, progressive living; Las Vegas, city of gambling and nightlife, tourists and transients. Yet, both have—for very different reasons—grown within the limits of externally imposed boundaries since the early 1980s.
In Portland, the urban growth boundary was the product of progressive land use planning policies established by the State of Oregon in the 1970s. The Portland growth boundary is explicitly tied to land use planning, zoning, transportation planning, and environmental preservation in the region. The same body that governs the Portland boundary is responsible for deciding on the uses and densities that are permitted within it.
In Las Vegas, on the other hand, the boundary was a compromise between the Federal Bureau of Land Management, which owns almost all the land encircling Las Vegas, and the city’s developers. Gradually, the Bureau is auctioning pieces of its land to developers – but only land within the boundary is eligible for sale. Once land has been transferred, it is not within the Bureau’s purview to influence future development patterns for that property.
There are a surprising number of statistical similarities between Portland and Las Vegas. For example, according to the most recent U.S. Census estimates, the two cities are ranked adjacent to each other for population: Las Vegas the 28th largest city in the country with a population of 543,000 people, Portland the 29th largest city, at 535,000 residents. Both of these populations have a median age slightly below the national median of 36 years. The two cities differ in land area by only 30 square miles. Mean housing prices in both cities hover around $360,000. Many of these statistics remain similar if the area in question is expanded to each city’s metropolitan region.1
This paper will analyze the effect that the two types of growth boundaries under discussion have had on the urban form of their respective cities, Portland and Las Vegas. Analysis will focus on the two aspects of urban form considered to be most closely related to the institution of growth boundaries, 1) the degree to which development drops off or disappears entirely at the outer edge of the boundary, and 2) the density of development within the growth boundary.
Ultimately, this paper will question the role of planning in effecting successful urban growth boundaries. How much does the motivation behind the creation of such a boundary, and the resulting investment in the details of its implementation, determine its effect? To what degree will any boundary around a city have similar effects on urban form, regardless of why it was put there and how it is administered? Through a
32 Projections
parallel analysis of the current statistical profiles of Las Vegas and Portland, and the planning policy decisions that have carried the two to their present state since the 1970s, this paper hopes to reach a conclusion about what impact planned growth boundaries have on the development of urban form.
What Is an Urban Growth Boundary?
The concept of the city as an ideal, contained entity, fundamentally separate from the wilderness surrounding it, is as ancient as city walls. Given people’s limited mobility, concerns for safety, supply, and society kept them close. With the transportation advances of the 19th and 20th centuries, however, planners were led to make containment a priority, in the service of large-scale government initiatives on resource allocation and quality of life. Sprawl had arrived with the railroad, and continued to expand around cities as fast as the automobile could accelerate. Great European cities such as London were first to try to stop the rampage, but greenbelts were no match for the determination of newly-minted suburbanites and their shiny vehicles. Development continued on the far side of these supposed boundaries almost as if they had never existed.
In the United States, few concerted attempts have been made to rein in sprawl. In the early 1960s, the National Capital Planning Commission published guidelines for the urban expansion of Washington, D.C., which were highly praised but failed to be implemented.2 Several years later, in the late 1960s and early 1970s, a series of land-use planning bills were introduced in the Senate under the leadership of President Richard Nixon. Inspired by a disastrous 1969 oil spill in California, the new bills represented a shift in the role of land-use planning, away from urban design and towards environmental protection. By 1974, however, the bills had failed. In the decades since, the federal government has yet to resurrect land-use planning as a major national concern.3
Urban growth boundaries (UGBs) were first put into practice in the United States shortly after these failed national attempts at land use planning. Oregon was the first—and remains among the few—to make UGBs a key element in their statewide land use plan. Simply defined, an urban growth boundary is a regional boundary circumscribing a metropolitan area, which is used by governments to distinguish areas for urban development from areas to be preserved as rural or wilderness. In theory, UGBs control expansion onto farm and forest lands, while concentrating development to be more efficiently served by urban infrastructure. UGBs also create motivation to develop and redevelop land and existing structures in the urban core, and so help keep historic downtowns in business. By setting out future areas slated for development in advance, UGBs channel government and commercial investment to the areas that most need it, improving efficiency of new construction. They also create an incentive for cities and businesses to maintain their existing resources.
33 Catenaccio
I. Portland’s Urban Growth Boundary
Portland’s urban growth boundary is the product of a long series of planning decisions that started in the 1970s, when the state of Oregon set out to establish the first statewide land-use planning laws in the country. As such, the Portland boundary has always been the benchmark against which subsequent urban growth containment programs have been measured. The product of a state-wide policy, Oregon’s urban growth boundaries encircle not just Portland, but every large town and city in the state. Each boundary distinguishes the rural land outside from the urban land within, and protects rural lands from urban-type land uses such as commercial or industrial activities. Rural lands are also protected from subdivision into lots smaller than two acres.4
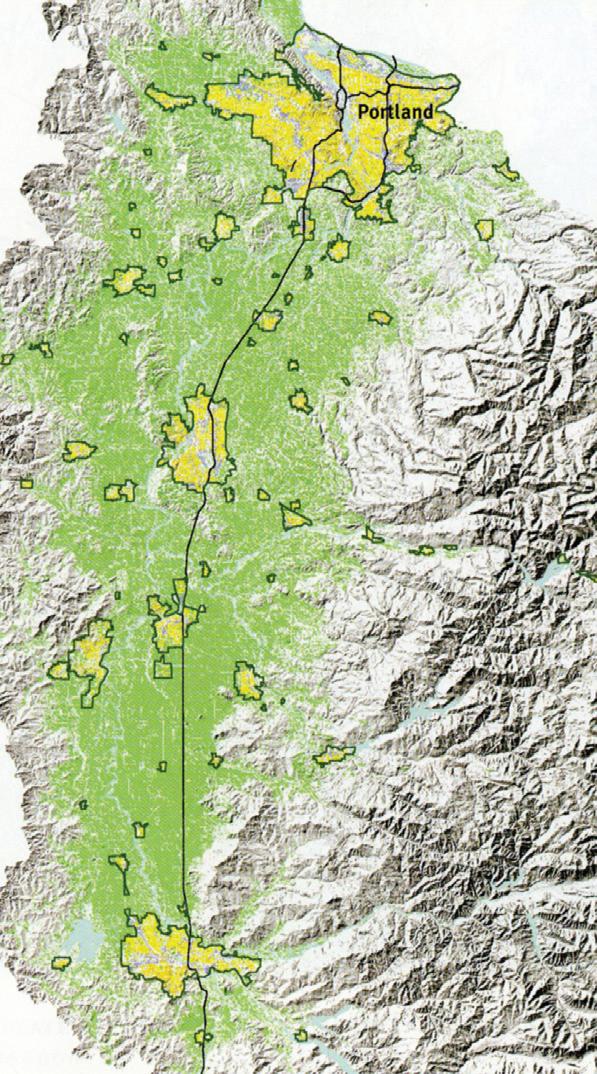
The fact that Portland’s boundary is the result of a state law, not a city law, has been critical to its success, as will be discussed further. In theory, by dividing the state into distinct urban and rural areas through the use of urban growth boundaries, Oregon has created an archipelago of urban islands within a sea of rural land. The relative success of this plan is visible in Figure 1, which shows urban development and open space in the Willamette Valley. If, however, it had been up to individual cities to set their own growth boundaries, their power to enforce such boundaries would disappear at the edge of the city—just at the very moment enforcement was needed. In order to succeed, growth boundaries must be overseen by a larger power that controls land both inside and outside of them. The change in development pattern that occurs at the north edge of the Portland boundary further proves this point: here, at state lines, the city’s otherwise contained suburbs suddenly sprawl into Washington.
Figure 1. Urban development and open space in Willamette Valley, Or. Source: Peter Calthorpe and William Fulton, The Regional City: Planning for the End of Sprawl (Washington, D.C.: Island Press, 2001)139.
Another essential aspect of the Portland UGB is its elasticity. Having learned from the experiences of European cities such as London that established greenbelts a generation earlier, only to watch development leapfrog the boundary and keep growing, Oregon’s legislators stipulated that their state’s UGBs would be subject to revision and expansion over time. Critics often de-
34 Projections
scribe the Oregon approach as “controlled sprawl,” rather than true planning, due to this flexibility of the urban boundaries. Yet controlling sprawl is an essential element of the urban and land-use planning agenda of the state, so perhaps this intended slur can be understood, rather, as oblique praise. Furthermore, recent additions and amendments to Portland’s planning schemes have increasingly focused on increasing density within the UGB, not just protecting land outside of it. Though the boundary continues to expand incrementally, Portland’s attention has now turned to strategizing new ways to use land already within the boundary.
Administration
Portland’s UGB is administered by Metro, a regional government agency. State law requires Metro to review the Portland UGB every five years, and to ensure at these reviews that the boundary contains a 20-year supply of land for growth in each of the three primary land uses: residential, commercial, and industrial. As of 2007, this law also requires Metro to designate additional “urban reserves” beyond the boundary edge, sufficient to satisfy a further twenty to thirty years of expansion.6 This adjustment addressed the uncertainty inherent to the original system: developers and landowners never knew in advance which land was next to be brought into the boundary. Though urban reserves had been designated before, they were not
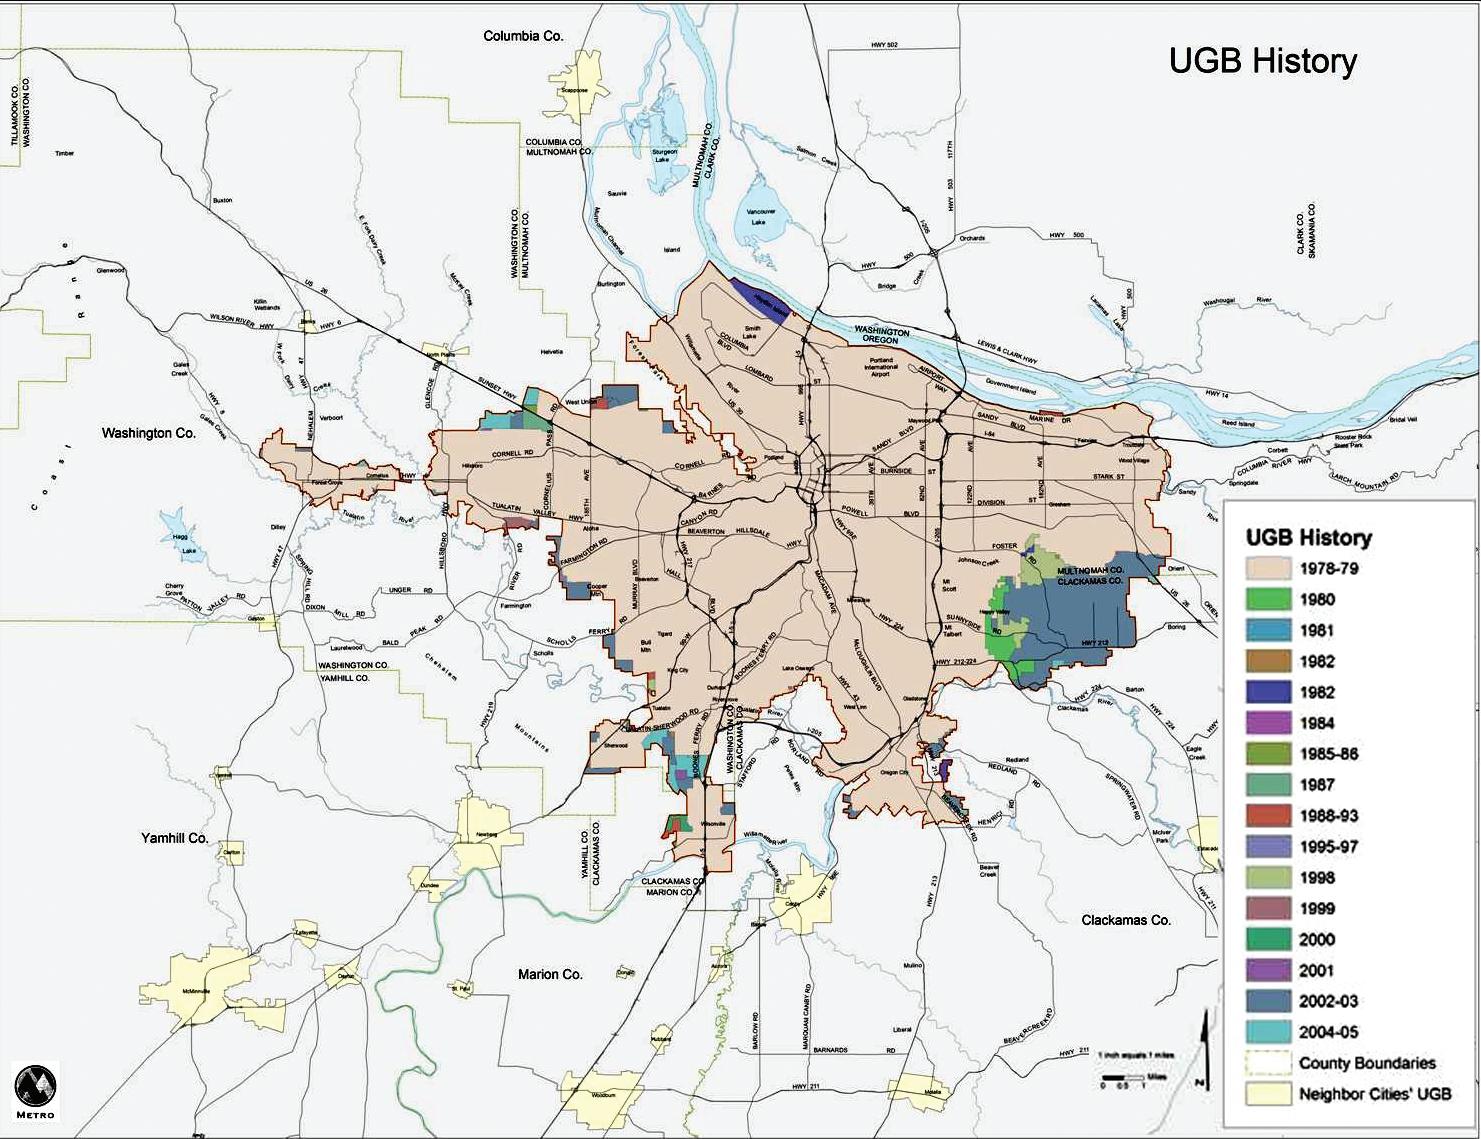
Figure 2. Historic expansions of the Portland growth boundary. Source: Courtesy Oregon Metro, www. oregonmetro.gov.
35 Catenaccio
planned to satisfy any specific timeframe. With the new system, up to 50 years of growth can be anticipated.8
Though Portland’s urban growth boundary is flexible, most of the expansions that have taken place have been small, as shown in Figure 2. Of the approximately three dozen expansions since the boundary’s establishment in the late 1970s, only a few have added more than 20 acres. The largest was in 2002, when 18,867 acres were added to provide 38,657 housing units and 2,671 acres for additional jobs. In total, the current boundary contains about 256,360 acres, or 400 square miles, of land, home to approximately 1.3 million people.9
History
The history of Oregon’s urban growth boundary policy begins in the early 1970s, in the first term of the fabled governor Tom McCall. Known for his fiery rhetoric, Governor McCall was dedicated from the outset to the preservation of Oregon’s natural treasures. He began with legislative measures to protect the state’s beaches and coastline. In his second term his ambitions expanded, and he proposed a controversial state-wide land-use plan.11
The state-wide plan was met with strong opposition, not only from real estate developers, but also from utility companies and the forest industry. In response, McCall declared a state of emergency, imposing a development moratorium on several coastline communities where sewer discharges from new subdivisions were reaching area beaches. This trump card served its purpose: in 1973, the Oregon legislature enacted a comprehensive land-use law, including formation of a state commission with the power to write regulatory policy—policy that came to include the growth boundary regulations.12
In his pursuit of a state-wide land-use policy, Governor McCall gathered an unlikely coalition of farmers and environmentalists to champion his cause. Condemning “sagebrush subdivisions and the ravenous rampage of suburbia,” McCall convinced his constituents that, without action, both the state’s natural beauty and its farmland would soon be lost to urban sprawl.13 Growth boundary regulations were not, at least in the beginning, meant to serve the goals of urban planning. Rather, they were for the purpose of environmental protection, bolstered by the desires of farmers to protect their own livelihoods.14
In 1977, the Columbia Regional Association of Governments (CRAG) formally proposed the Portland Urban Growth Boundary. Two years later, in 1979, Metro was created by voters, and inherited CRAG’s planning responsibilities, including administration of the UGB. The following year, in 1980, Portland’s UGB was approved by the state Land Conservation and Development Commission (LCDC).15
36 Projections
Throughout the 1980s, the Oregon growth boundary program was considered successful at its primary goal of protecting environmentally sensitive and farm lands. By the 1992 UGB five-year review, Metro began to acknowledge that preservation was an important goal, but it was not enough. From this discussion emerged the region’s first long-term plan, the Region 2040 Growth Concept. New to the state’s growth planning agenda was the prioritization of regional planning, including an emphasis on transportation infrastructure and alternative modes to the automobile. Also new was the Growth Concept’s insistence on controlling growth patterns within the UGB.16
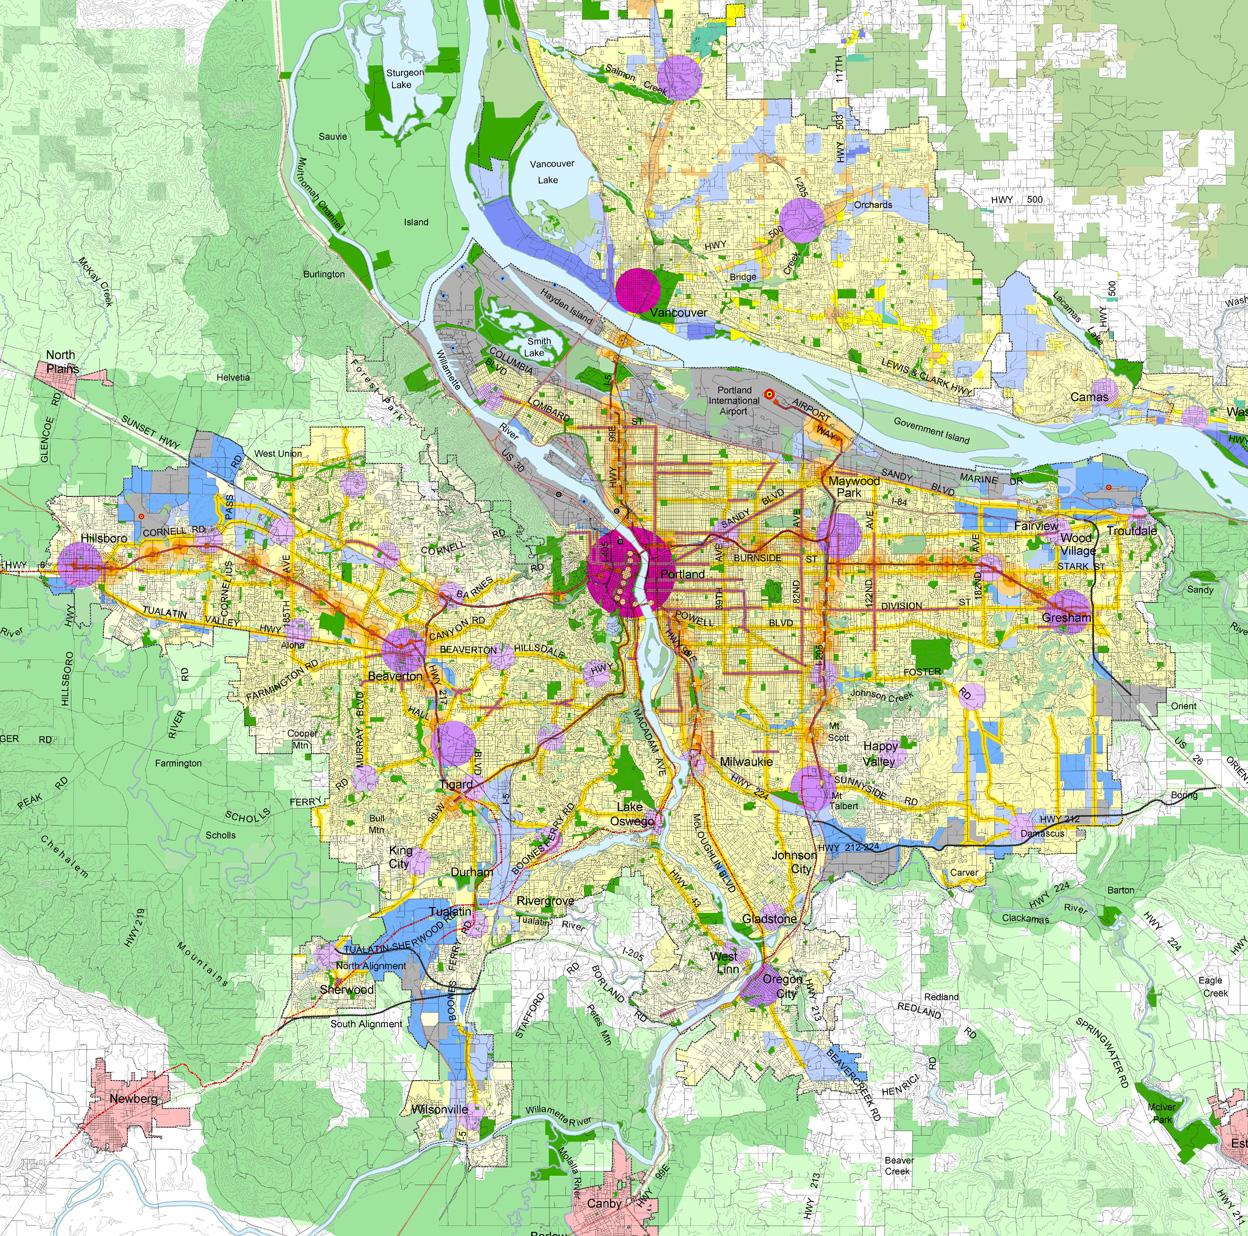
Over the course of four years, the Region 2040 Growth Concept developed into an adopted plan that focused on development within the UGB, using urban centers and transit-oriented development (TOD) to achieve desired densities and road relief, as visible in Figure 3. The plan also included a new, stronger open space element, with more explicit delineation of rural reserves and greenbelts never to be developed, even
 37 Catenaccio
Figure 3. Region 2040 Growth Concept for Portland. Source: Courtesy Oregon Metro, www.oregonmetro. gov.
37 Catenaccio
Figure 3. Region 2040 Growth Concept for Portland. Source: Courtesy Oregon Metro, www.oregonmetro. gov.
within the boundary.18
Adopted in 1996, the growth plan originally included eleven elements, since revised and expanded to thirteen. Requirements addressed a wide range of issues, from housing and employment accommodation to water quality and flood management. Since its implementation, the plan has been broadly criticized, but lives on in the city’s most recent initiative, ambitiously titled “Making the Greatest Place.”19 It continues to focus on transportation alternatives, and on channeling development along established transit corridors.
II. Las Vegas: the Burton-Santini Boundary
Las Vegas, notorious for its acres of subdivisions and skyrocketing population, is the last place most people would look for an innovative approach to urban boundaries. Yet, somehow, the city remains an island in the desert, its relatively low-rise, even pattern of development halting abruptly at the city’s edge, as shown in Figure 4. Beyond lies nothing but sand and scrub, for miles. Several local factors and historical events have prevented Las Vegas from sprawling ever outwards, while allowing the city to accommodate its rapidly growing population. Each of these reasons is related to the city’s location in the middle of the Mojave Desert.

History
The city of Las Vegas began in 1855 as a short-lived Mormon settlement beside a watering hole, resurrected a decade later during the California gold rush.20 The sec-
38
Projections
Figure 4. Satellite view of Las Vegas. Source: Google Maps.
ond settlement barely survived: by 1900 the Las Vegas Valley was still home to only 19 settlers. Rumors that the railroad was coming to the area spurred a small surge in population, and by 1904 a population of 30 residents was served by a new hotel, meat market, and general store, as well as four restaurants and a dozen bars, all built in anticipation of the railroad’s arrival.21
The railroad did come to Las Vegas, in 1905. By 1911, the town’s population had reached 1,500, and doubled over the next two years, reaching 3,000 by 1913. Financial constraints of the railroad companies caused growth to level off for the next decade, but the announcement of the planned Hoover Dam in 1928 spurred the biggest burst in growth yet. As the Great Depression gripped the nation, the hope of working on the new dam continued to draw people to Vegas through the early 1930s, and the population doubled and doubled again.22
Up until this point in its history, Las Vegas was still just a small railroad town, despite its rapid growth. New development clung to the small watering hole that had brought the town into existence. No one in Las Vegas, or even in the state of Nevada, was interested in the miles of barren, unpromising desert that extended in all directions. This land remained property of the United States federal government, even as the town continued to grow.23
The arrival of casino culture in Las Vegas spurred yet another surge in growth. Gambling had always been legal in Las Vegas, but the Strip itself did not begin to emerge until after World War II. With the growth of the Strip, the miles and miles of federally owned desert surrounding the city gradually became more desirable to the city’s developers. Strangely enough, however, it took an environmental crisis in the neighboring state of California to convince the federal government to sell.
The Burton-Santini Boundary
California Congressman Phil Burton represented the San Francisco Bay area in the late 1970s. At that time, the region’s greatest natural treasure, Lake Tahoe, was under threat from overdevelopment. In order to protect the lake and its surrounding landscape, the government would have to buy up as much expensive waterfront land as possible. And this is where the newly desirable federally owned land surrounding Las Vegas would play its part.24 In 1980, working closely with Nevada Congressman Tom Santini, Burton made a proposal: by selling land to developers in Las Vegas, the government could make enough money to buy up the threatened shoreline around Lake Tahoe. Land sales would be limited to no more than seven hundred acres each year from lands immediately surrounding Las Vegas.25
The proposal was implemented by federal land managers, who drew a square around Las Vegas to delineate which lands could be selected for sale. The Burton-Santini
39 Catenaccio
square was approximately ten miles on each side, and became, almost by accident, an urban growth boundary around Las Vegas.26
Unlike Portland’s UGB, however, the Burton-Santini square was not elastic. Soon developers began once again to clamor for more land beyond its lines. The boundary started to look vulnerable—though the law had symbolic strength, there was no language in it that explicitly forbade the Bureau of Land Management from selling land outside the boundary.27 Then, in 1986, a new Nevada senator stepped up ready to tackle the problem.
Senator Harry Reid of Nevada was always known as pro-growth, and this was an advantage when it came to protecting undeveloped land around Las Vegas. From the late 1980s on, Reid insisted that the future success of Las Vegas rested on provision of sufficient outdoor space for recreation and wildlife preservation. In order for the city to sustain growth, it must retain open space. His choice of language was the key to success, and it was Reid’s insistently pro-growth rhetoric that led, by the end of the twentieth century, to a final, legally fixed reiteration of the Burton-Santini square.
The shaping of the new boundary was incremental. North of the city, the Desert National Wildlife Refuge had been established in 1936 to protect bighorn sheep. Reid began his mission in 1990, when he convinced Congress to consolidate two hundred thousand acres to the west of Las Vegas as the Red Rock Canyon National Conser40 Projections
Figure 5. Revised Burton-Santini Square around Las Vegas. Map created by the author in Arc GIS using US Census data and map layers courtesy of the Southern Nevada GIS Management Office.

vation Area. Next, by 2002, Reid had gotten further legislation through to protect an additional fifty thousand acres of mountains and desert to the south of the city as the Sloan Canyon National Recreation Area.28
Environmental debates influenced the shape of the boundary on all sides. The longest-running of these began in 1990, when decades of habitat destruction put the tortoise on the Endangered Species List. The day the tortoise was listed, a development moratorium immediately fell on all desert tortoise habitat nationwide. Much of this habitat was in the low-lying desert surrounding Las Vegas, the federally owned land so desirable to the city’s developers.29
Again, Senator Reid played a key role in finding a solution that would both appease developers and increase protected land around Las Vegas, all while affirming his reputation as a pro-growth politician. Local developers, further frustrated by the potential development acreage taken from them with the tortoise listing, were at last ready to compromise on a habitat protection plan that might release at least some of the lost land for development. The plan that developed expanded the Burton-Santini boundary to a final, permanent perimeter, while all lands outside the revised boundary became fully protected tortoise reserves.30
Today, the revised Burton-Santini square—shown in Figure 5 as a dotted green line— still contains the entire city of Las Vegas, though development is starting to sneak out towards Henderson in the southeast. Annual auctions continue to put new, undevel-
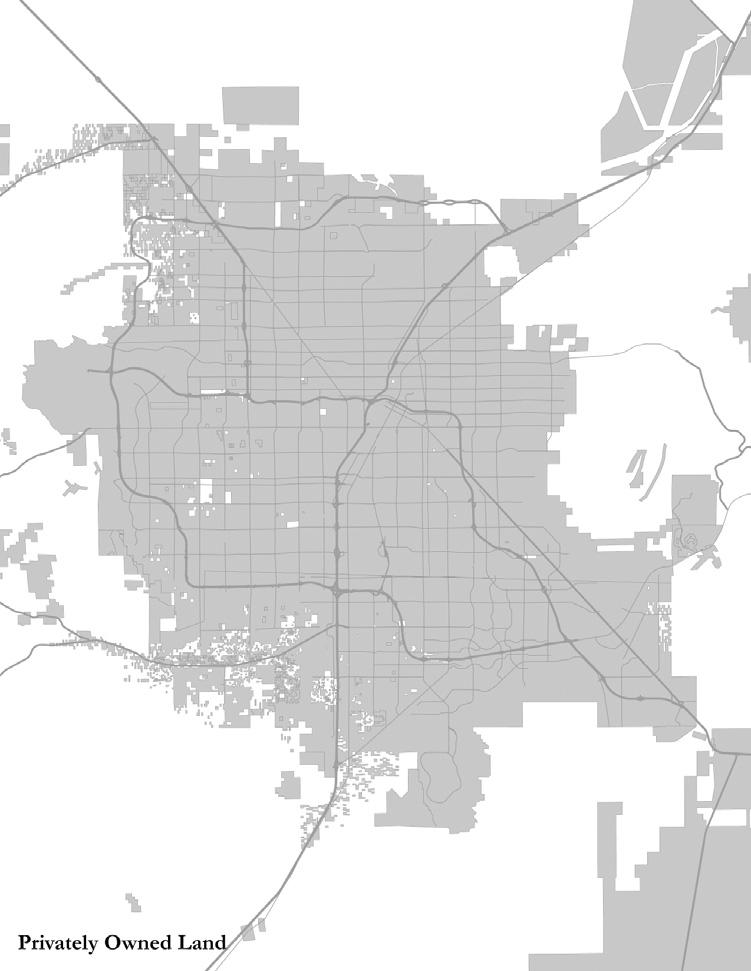
Figure 6. Extent of privately owned land in and around Las Vegas. Map created by the author in Arc GIS using US Census data and map layers courtesy of the Southern Nevada GIS Management Office.
41 Catenaccio
oped land within the boundary up for sale at a slow but steady rate. The city and its politics are still pro-growth, and little conventional “urban planning” is taking place. Yet the city is contained: GIS data shows that the figure drawn by the boundary is borne out in actual land ownership, as can be seen in Figure 6, which shows privately owned land in red. There is enough space for the time being, and residents seem to accept increasing density as a good thing. The city was hit hard by the foreclosure crisis beginning in 2008, and many of the subdivisions planned and constructed over the past decade have emptied out or been cancelled—a devastating loss in the short term, but in the long term, perhaps an opportunity to make better use of a limited supply of land.
III. Analysis & Conclusions
The literature available on Portland’s urban growth boundary is vast, whereas that on Las Vegas’s is virtually nonexistent. Most authors writing on the subject seem to take Las Vegas at its word—as a pro-growth city, how could it possibly be of interest to advocates of restraint? Yet, as discussed, the growth boundary surrounding Las Vegas is at least as legally definitive as the one surrounding Portland. And, from the data available on the two cities, it can be shown that the Las Vegas boundary has also been at least as effective as Portland’s with regard to the two critical indicators: the rate at which development drops off at the boundary edge, and the density of development within the boundary.
Key evidence can be found in a recent study on urban growth by Dr. Stephen M. Wheeler of the Landscape Architecture Program at University of California, Davis. In this study, Wheeler analyses growth patterns in six major American metropolitan areas, using historic maps, aerial photographs, and GIS software. Among the cities analyzed are Las Vegas, Nevada, and Portland, Oregon.
Wheeler’s data on development patterns in Portland and Las Vegas was generated through direct interpretation of visual information, mostly satellite images found through Google Earth. As a result, the data he produces for each city pertains not to any pre-established metropolitan area defined on paper by those jurisdictions, but rather to the physically urbanized areas as visible in the photographs. In this context, “urbanization” is defined as “subdivision of land for primarily non-agricultural use.”31 Accordingly, the edge of each metropolitan area was determined to be “the place where substantial land subdivision had no longer occurred.”32
Wheeler identifies seven main types of historic urban landscape, outlined in Table 1. In addition to these seven, separate categories are included for commercial and industrial/office landscapes, for a total of nine types. Focusing on the data for Portland and Las Vegas, shown in Table 2, the results are striking. Of the nine development patterns, five are equally prevalent in both Portland and Las Vegas. Both cities are
42 Projections
Current Residential Forms
Street Pattern/ Block Size Land Use MixResidential Density Typical Unit Size and Lot Layout Subdivision Scale
Rural SprawlHaphazard street pattern; street connectivity varies; little or no block structure
LowVery low density; lot sizes typically between 1 and 5 acres
Upscale Fringe “Loops and lollipops”; loose Low street patterns; low connectivity; large, irregular blocks; high amenity level (pools, golf courses, trails, etc.)
Suburban tracts “Loops and lollipops”; tight street patterns; low connectivity; moderate block size ; irregular blocks
MultifamilyLooping access roads; moderate block size and street connectivity
Trailer ParksVery tight, linear lanes; small blocks; moderate connectivity
New UrbanistGrid-like street pattern; small blocks; high street connectivity
LowLow density; lots typically 10,00040,000 square feet
Small to midsized houses; 1,0002,500 square feet; wide variety of structure type and lot layouts
Large houses; 2,000-5,000 square feet; lot layouts often vary due to custom construction
Small scale; 1-20 lots
Incremental Subdivision Haphazard street pattern; incremental adition of streets; block size and street connectivity vary
LowLow to moderate density; lots typically 4,00010,000 square feet
Midsized houses; 1,500-3,000 square feet; repetitive housing forms and lot layouts
Small to medium scale; 10-100 lots
LowModerate to high density; 8-60+ dwelling units per acre
LowModerate to high density; lots typically 1,500-3,000 square feet
Low but some addition of retail and offices
Small to midsized apartments and condos; 5001,500 square feet
Medium to large scale; 20-1,000+ lots
Medium scale; 20-500 lots
Small units; 5001,000 square feet Medium scale; 20-500 lots
Moderate density; lots typically 2,500-6,000 square feet
Low to moderate; frequently has a variety of small business
Low to moderate density; lots are irregular and sizes vary
Varying housing forms including second units and row houses; a range of lot configuration
Small to midsozed; 1,0002,500 square feet
Large scale; 1001,000 + lots
Small scale; 1-20 lots
Table 1. Wheeler’s categorization of U.S.
landscapes.
data from
M. Wheeler, “The Evolution of Built Landscapes in Metropolitan Regions,” (Journal of Planning Education and Research, no. 27, 2008) 408.
43 Catenaccio
urban
Source: reproduces
Stephen
Table 2. Per cent of developent in Wheeler’s nine urban form categories in Portland and Las Vegas. Source: Stephen M. Wheeler, “The Evolution of Built Landscapes in Metropolitan Regions,” (Journal of Planning Education and Research, no. 27, 2008) 408.
dominated by the suburban tract development type (44% and 51%, respectively), which Wheeler defines as low- to moderate- density, with low connectivity and the stereotypical “loops and lollipops” street pattern. This result is no surprise when it comes to Las Vegas, but one might have expected a denser type of development to predominate in Portland. Furthermore, the 7% difference between the two is overshadowed by the larger realization that approximately half of the urbanized area of both cities consists of suburban tract development.33
Most surprising, however, is the data on the development type termed “rural sprawl,” which, in theory at least, should be eliminated by urban growth boundaries. Rural sprawl is described as very low-density development, with large lots between one and five acres. The street pattern is loose, and large areas of open land are passed over between subdivisions. According to Wheeler’s results, not only does Las Vegas contain a significantly lower percentage of rural sprawl than Portland, at a mere 5%, it has the least rural sprawl of all six cities in the survey.34 Portland, by contrast, contains 20% rural sprawl, the same percentage as Atlanta, Georgia.35
The remaining two development types that differ significantly in prevalence between Portland and Las Vegas are the “incremental” development type, and industrial/office development. Incremental development is defined as having “varied or haphazard street patterns and a diversity of block sizes, housing forms, lot configurations, residential densities, and land uses.” It is generally the result of the piecemeal sale of small agricultural parcels over time, which are then each independently developed in a variety of styles and for a variety of purposes. Along with New Urbanist-style development—which Wheeler found hardly any evidence of in the six cities he looked at—incremental development is one of only two development types described as specifically mixed-use.36 Las Vegas, having grown in fits and starts around a watering
44 Projections
Tract4451 Rural Sprawl205 Upscale Fringe55 Multifamily33 Trailer Parks10 Incremental521 Commercial56 Industrial/Office199 New Urbanist 0 0
Form (Period 1980-2005)PortlandLas Vegas
hole for much of its early history, contains a relatively large proportion of incremental development, at 21%. Portland, perhaps because of its more hospitable location, contains only 5% incremental development.37
Industrial and office development, on the other hand, is highly drawn to Portland—yet another blow to the supposed success of its growth boundary. Such development tends to be scattered down the length of arterial roads or freeways. Buildings have large floorplates and parking areas, and are often surrounded by extensive landscaping. There is little connectivity between adjacent structures. This development type makes up a considerable 19% of the urbanized area of Portland, by far the greatest proportion of industrial and office development found among the six case study cities.38 Las Vegas, by contrast, contains the average proportion of 9% industrial and office development.39
The relative prevalence of these various development patterns in the Portland and Las Vegas metropolitan areas strongly implies that, by both of our criteria, the Portland boundary is not having as strong an effect as its advocates might hope. In particular, the comparatively large percentage of rural sprawl surrounding Portland suggests that urbanization is not dropping off completely at the edge of the growth boundary. The proliferation of big-box office and industrial development along transit corridors in and around Portland is likely to encourage rural sprawl, while contributing only low levels of density to the landscape within the boundary.
Conversely, Las Vegas appears to be remarkably well contained, especially with regard to rural sprawl. There are a number of possible reasons for this. First and foremost, of course, is the growth boundary of federally-owned and protected lands. Other side-effects of desert living may also play a significant part. For one, the scarcity of water means that urban development is limited to the reach of an already stretched infrastructural network. Furthermore, the hot climate may reduce demand for large yards. In Las Vegas, even luxury housing developments are built at a relatively high density, trading individual grounds for shared pool clubs, tennis courts, and golf courses.40
Density statistics for both cities are also found in Wheeler’s research, and these numbers corroborate the intuition that Las Vegas is denser than most would expect, and Portland more dispersed. In fact, of the six regions in the Wheeler study, the Las Vegas area is the only one that increased in density between 1980 and 2005. While Las Vegas was increasing in density by 18%, metropolitan Portland was experiencing an almost equally dramatic drop in density of 16%. As of 2005, the Las Vegas area had a density of 6,000 people per square mile, up from 5,100 in 1980. In the same time period, the density of the Portland area dropped from 6,900 people per square mile down to 5,800, leaving Las Vegas as the denser city.41 It is also worth noting that Portland’s drop in density and the implementation of its growth boundary took place simultaneously.
45 Catenaccio
To what extent can growth boundaries be held responsible for the surprising differences in sprawl and internal density between Portland and Las Vegas? Review of a large body of historic planning literature and research done over the past several decades reveals that, in fact, the differences between the two cities might well be expected, even in the absence of growth boundaries. In their paper “Causes of Sprawl: A Portrait from Space,” most recently revised and published in 2005, Marcy Burchfield, Henry G. Overman, Diego Puga, and Matthew A. Turner conduct such a review, and then seek to prove the logical conclusions of many years of urban economic theory through extensive analysis of satellite imagery covering the entire United States.
The results of this study find many conclusions of the previous literature to be borne out by the actual development patterns of American cities between 1976 and 1992. Five key points from this research are directly relevant to the Portland-Las Vegas comparison, namely:
• Cities specializing in sectors where employment tends to be more centralized will be more compact.
• Cities that have been growing faster will tend to experience less sprawl.
• Cities with few aquifers underlying the urban fringe will be more reliant on centrally supplied infrastructure, and therefore less likely to sprawl.
• Cities surrounded by high mountains tend to be more compact, whereas cities with more generally rugged terrain will be more dispersed.
• Cities with a pleasant temperate climate experience more sprawl.
All five of these points suggest that Las Vegas should be less susceptible to sprawl than Portland. The concentration of jobs along the Las Vegas Strip means that most workers in that city still work downtown. In Portland, as has been demonstrated, offices and industrial complexes tend to instead be dispersed along arterials and other roads outside of the city center. While both cities have seen their populations grow rapidly over the past few decades, for much of that time Las Vegas was the number one fastest-growing metropolitan region in the nation. The question of water has already been addressed: in Las Vegas, short supply of water ties development to the limited capacity of municipally supplied infrastructure. Portland, conversely, enjoys a more than adequate supply of groundwater.42 Las Vegas is in a broad desert valley surrounded by high mountains; Portland lies over several smaller rolling valleys with scattered volcanic hills. Finally, Las Vegas has an extremely hot desert climate where summer highs typically rise above 100 degrees Fahrenheit; Portland is often considered to have one of the most pleasant climates in the United States, with summer highs in the mid-eighties, and winter lows rarely dropping below freezing.43
46 Projections
Can we still believe that growth boundaries make a difference when it comes to sprawl and urban density? There remains evidence that Portland’s growth boundary has contained growth and increased density in a location that is physically, climactically, and economically predisposed to sprawl. The city’s position just south of the Oregon-Washington state line makes it an ideal test case for the effectiveness of an urban growth boundary, and, indeed, the portion of the Portland metropolitan area that lies under the auspices of Oregon’s growth-management laws is markedly less dispersed than the portion across the Washington border. Data from the Wheeler survey again confirms what is evident in aerial photographs of the region: rural sprawl accounted for only 13% of new land urbanized in the Oregon portion of the region between 1980 and 2005, the period since implementation of the UGB, but for 34% of new land urbanized in the Washington portion in the same time period. If only land under the jurisdiction of Portland Metro is considered, the percentage of rural sprawl drops to 11%.44
What is the role of planning in effecting successful growth boundaries? This study may be taken to imply that the earnest rhetoric and concerted efforts that have earned Portland its reputation are not critical for the success of a growth boundary. In fact, the more recent efforts by Portland to use poly-centric planning techniques and transportation corridors to boost the effectiveness of their growth boundary may be compounding the problem: evidence from the Burchfield study shows that the monocentric city model is far more conducive to the promotion of density.45
However, it has also been shown that Las Vegas is, for a variety of reasons, predisposed to the density it has attained. Its location in a desert with limited access to resources has created a natural boundary to growth, which has since been formalized. The very fact that the federal government was able to impose a growth boundary on Las Vegas, is, indeed, itself intrinsically related to the city’s desert location. Had the city been located in a more hospitable environment, the land surrounding Las Vegas would have been snatched up by homesteaders long ago.
In conclusion, it appears that growth boundaries are effective at curbing sprawl and promoting density, if only to a limited extent. Their effectiveness in these regards does not seem to be tied to their position within a larger progressive planning agenda, nor to the enthusiasm of local residents. Rather, the effectiveness of growth boundaries, to the extent that this effectiveness is under human control, is determined by the power and breadth of the larger body that controls their implementation. In Oregon, urban growth boundaries have succeeded as a state-wide land-use planning policy, and their effectiveness immediately dissipates at the state’s borders. In Las Vegas, the urban growth boundary is controlled by the federal government. As a result, it is far less subject to local interests than even a state-mandated boundary would be.
Cities grow and spread in response to a wide variety of factors, many of which are beyond human control. Yet it would be absurd to suggest that we build all our new
47 Catenaccio
cities in the most inhospitable environments possible so as to protect them from sprawl. As the planet’s limited resources become more clearly defined, a future of cities sustained by artificial climate control and piped-in utilities appears increasingly implausible and unwise. Urban growth will continue to cluster in areas, like Portland, with pleasant climates and abundant natural resources. We will be left to control our natural pioneering tendency and the market forces that encourage it with a limited palette of policy and planning tools.
In this projected future, growth boundaries will remain a critical tool for urban planners, primarily for their influence on sprawl and density, but also for a variety of other reasons. For example, studies have shown UGBs to have a positive influence on public health, finding an association between strong urban containment policies and higher participation in leisure time physical activity and active commuting.46 Others suggest that UGBs have the potential to promote equality and revitalize inner-city communities, both by incentivizing redevelopment and by broadening legislative influence to the scale of the metropolitan area or region.47 And urban economists have long argued that, in cases where cities are unable to institute congestion-charging measures, urban growth boundaries can act as second-best tools for managing traffic congestion.48 49
The ability of urban growth boundaries to effect any of these positive changes in urban development patterns, however, is contingent on a variety of factors—not least the interests of those enforcing them. If any policy recommendation is to come out of this discussion, it is that the federal government should return to the subject of landuse planning and urban growth at the national scale. Only the federal government has the scope of influence and broader vision necessary to require enforcement of such policies, and to avoid falling prey to the short-term interests of local economics.
ENDNOTES
[1] U.S. Census Bureau, www.census.gov
[2] Bruce Babbit, Cities in the Wilderness: A New Vision of Land Use in America (Washington, DC: Island Press, 2005) 75-76.
[3] Ibid, 77.
[4] Oregon Metro, www.oregonmetro.gov.
[6] Ibid.
[8] Established priorities and protections determine which land is eligible to be brought into the boundary at each five-year review. Urban reserve lands receive first priority for inclusion, by definition. Second priority lands include so-called “exception land” or “non-recourse land.” Exception land is land next to the urban growth boundary that is not farm or forest. Second priority could also include farm or forest land that is completely surrounded by exception land but that is not considered “high value” farm or forest land. Third priority for inclusion goes to designated “marginal land” a classification of non-resource
48 Projections
(exception) land unique to Washington County that allows dwelling units on exclusive farm-use land. Finally, farm or forest land is always last to be considered for inclusion within the boundary (Oregon Metro, www.oregonmetro.gov).
[9] Ibid.
[11] Babbit, 77.
[12] Ibid, 77-78.
[13] Thomas McCall, “Opening Address to the Oregon Legislature,” 8 January 1973.
[14] Oregon Metro
[15] Oregon Metro
[16] Peter Calthorpe and William Fulton, The Regional City: Planning for the End of Sprawl (Washington, D.C.: Island Press, 2001) 109.
[18] Ibid, 119; Oregon Metro.
[19] Ibid, 121-124; Oregon Metro.
[20] Barbara Land and Myrick Land, A Short History of Las Vegas, 2nd Edition (Reno: University of Nevada Press, 2004) 21-22.
[21] Land, 37.
[22] Land, 49.
[23] Babbit, 80.
[24] Ibid, 80.
[25] Ibid, 80.
[26] Ibid, 80.
[27] Ibid, 80.
[28] Ibid, 81.
[29] Ibid, 82.
[30] Ibid, 82.
[31] Stephen M. Wheeler, “The Evolution of Built Landscapes in Metropolitan Regions,” (Journal of Planning Education and Research, no. 27, 2008) 402.
[32] Wheeler, 403.
[33] Ibid, 408.
[34] The six cities in Wheeler’s study are Albuquerque, New Mexico (52% rural sprawl); Atlanta, Georgia (20% rural sprawl); Boston, Massachusetts (71% rural sprawl); Las Vegas, Nevada (5% rural sprawl); Minneapolis-St. Paul, Minnesota (40% rural sprawl); and Portland, Oregon (20% rural sprawl). The average percentage rural sprawl for the six cities is 35% (Wheeler, 408).
[35] Ibid, 408.
[36] Ibid, 407.
49 Catenaccio
[37] Ibid, 408.
[38] Industrial/office development percentages for the six cities are, as follows: Albuquerque, 4%; Atlanta, 9%; Boston, 6%; Las Vegas, 9%; Minneapolis-St. Paul, 7%; Portland, 19%. The average percentage industrial/office development for the six cities is 9% (Wheeler, 408).
[39] Ibid, 408-409.
[40] Ibid, 411.
[41] Ibid, 411.
[42] U.S. Geological Survey. “Ground Water Atlas of the United States,” http://pubs.usgs.gov/ha/ ha730/ch_h/index.html
[43] Western Regional Climate Center, “Historical Climate Information,” (Desert Research Institute, Nevada System of Higher Education) http://www.wrcc.dri.edu/
[44] Wheeler, 412.
[45] Marcy Burchfield, Henry G. Overman, Diego Puga and Matthew E. Turner, “The Determinants of Urban Sprawl: Portrait from Space” (unpublished manuscript, 7 October 2005) 16-17.
[46] Semra A. Aytur, PhD, et. al. “Urban Containment Policies and Physical Activity: A Time-Series Analysis of Metropolitan Areas, 1990-2002” (American Journal of Preventative Medicine, no. 34, vol. 4, 2008) 320-332.
[47] Alex Anas and Hyok-Joo Rhee, “When are urban growth boundaries not second-best policies to congestion tolls?” (Journal of Urban Economics 61, 2007) 263–286.
[48] Regarding the relationship between UGBs and traffic congestion, more recent papers have shown that this positive effect is only applicable in the ideal case of the mono-centric city, a finding that proves this boon irrelevant to cities such as Portland that have pursued poly-centric patterns of development (Anas and Rhee).
[49] David Pines and Efraim Sadka, “Zoning, First-Best, Second-Best, and Third-Best Criteria for Allocating Land to Roads.” (Journal Of Urban Economics 17, 1985) 167-183. Jan K. Brueckner, “Urban growth boundaries: An effective second-best remedy for unpriced traffic congestion?” (Journal of Housing Economics 16, 2007) 263–273.
WORKS CITED
Anas, Alex and Hyok-Joo Rhee. “When are urban growth boundaries not second-best policies to congestion tolls?” Journal of Urban Economics 61, 2007, 263–286.
Aytur, Semra A, et. al. “Urban Containment Policies and Physical Activity: A Time-Series Analysis of Metropolitan Areas, 1990-2002,” American Journal of Preventative Medicine, no. 34, vol. 4, 2008, 320-332.
Babbit, Bruce. Cities in the Wilderness: A New Vision of Land Use in America. Washington, DC: Island Press, 2005.
Brueckner, Jan K. “Urban growth boundaries: An effective second-best remedy for unpriced traffic congestion?” Journal of Housing Economics 16, 2007, 263–273.
50 Projections
Burchfield, Marcy, Henry G. Overman, Diego Puga and Matthew E. Turner. “The Determinants of Urban Sprawl: Portrait from Space.” Unpublished manuscript, 7 October 2005.
Calthorpe, Peter and William Fulton. The Regional City: Planning for the End of Sprawl. Washington, D.C.: Island Press, 2001.
Land, Barbara and Myrick. A Short History of Las Vegas, 2nd Edition. Reno: University of Nevada Press, 2004.
Oregon Metro, www.oregonmetro.gov.
Pines, David and Efraim Sadka. “Zoning, First-Best, Second-Best, and Third-Best Criteria for Allocating Land to Roads,” Journal Of Urban Economics 17, 167-183, 1985.
U.S. Census Bureau, www.census.gov
U.S. Geological Survey. “Ground Water Atlas of the United States,” http://pubs.usgs.gov/ha/ha730/ ch_h/index.html
Western Regional Climate Center. “Historical Climate Information.” Desert Research Institute, Nevada System of Higher Education, http://www.wrcc.dri.edu
Wheeler , Stephen M. “The Evolution of Built Landscapes in Metropolitan Regions,” Journal of Planning Education and Research, no. 27, 2008, 400-416.
51 Catenaccio
!"#$%&'(#)*
FIVE PRINCIPLES FOR GREENWICH SOUTH: A STRATEGIC FRAMEWORK FOR LOWER MANHATTAN
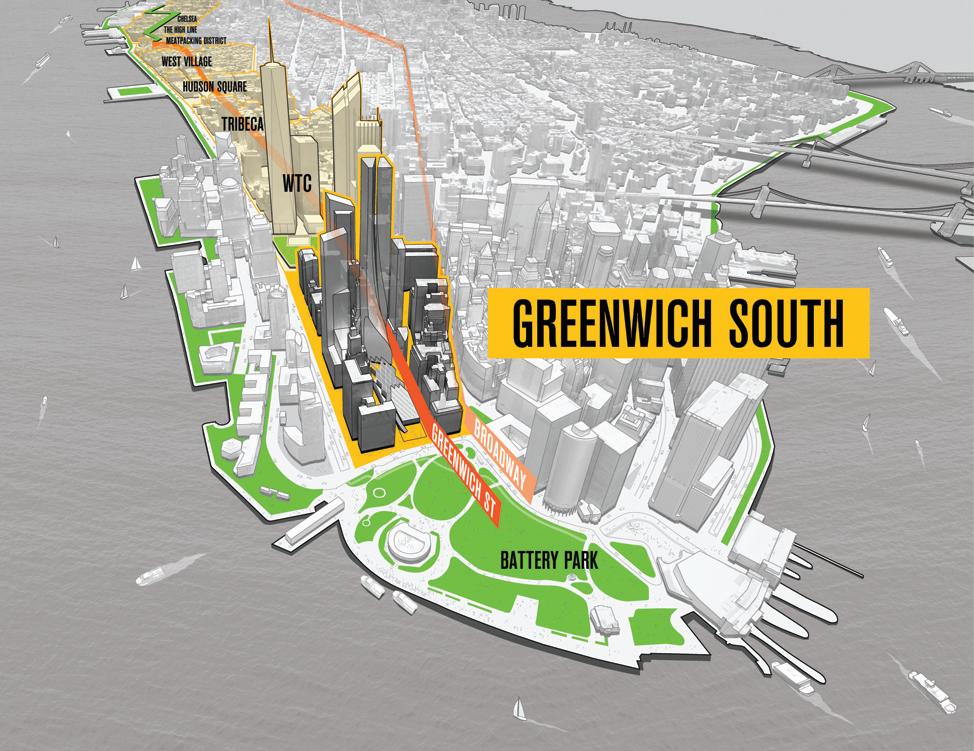 STEPHEN CASSELL AND ANNIE BARRETT Architecture Research Office
ABSTRACT
Architecture Research Office’s Five Principles for Greenwich South presents a valuable and innovative paradigm for urban design, an approach to planning that is engaged with its constituents and aligned to the complexities of growth and development in twenty-first century cities. Greenwich South is an underdeveloped and overlooked part of Lower Manhattan widely regarded by downtown residents, employees, and tourists as an obstacle to either avoid or ignore. Asked to create a masterplan for the neighborhood by the local business improvement district, ARO instead proposed a strategic framework that could frame its future around a few key overarching concepts. ARO developed a hierarchy of ideas that engage the project’s specific planning issues—a matrix of scales, scopes, and timeframes for actors to work within. These ideas, hierarchies and a series of hypothetical projects, commissioned from well known architects, were communicated to the public through publications and exhibits.
53 Cassell and Barrett
Greenwich South
Introduction

In May 2008, Architecture Research Office was invited to design a master plan to guide the growth of ‘Greenwich South’ – the area of Lower Manhattan bounded by the World Trade Center, the West Side Highway, the Brooklyn Battery Tunnel, and Broadway. An underdeveloped and overlooked part of the city, Greenwich South is widely regarded by downtown residents, employees, and tourists as an obstacle to either avoid or ignore. This attitude appears to be an unintended consequence of Lower Manhattan’s uncoordinated growth from a colonial settlement to a global business district, in which a legacy of large-scale infrastructure projects has rendered the area isolated from the city which surrounds it. But Greenwich South’s location and its store of developable air rights give it the potential to act as a lynchpin for Lower Manhattan if these current challenges are overcome. It was with this in mind that the Alliance for Downtown New York, Lower Manhattan’s Business Improvement District, commissioned this project to create a plan for Greenwich South’s growth that would guide the area toward the realization of its potential.
It was clear to us that this mission would be ill-served by a traditional master plan, a process which typically presents a singular vision for the future and is dependent on comprehensive implementation in order to achieve its goal. Instead of a master plan, we proposed the design of a strategic framework – a living document that could coordinate planning and development efforts at multiple scales across the short- and


54
Projections
Area of BID Greenwich South
Figure 1. Greenwich South comprises a signifi cant proportion of the Lower Manhattan Business Improvement District that is managed by the Alliance for Downtown New York.
long-term future. Working with a team that included planner Neil Kittredge of Beyer Blinder Belle, graphic designer Scott Stowell of Open, and journalist Marc Kristal, and with contributions from additional groups of thinkers and designers, we developed Five Principles for Greenwich South, an adaptable tool designed to guide incremental change in the long- and short-term.
The implementation of urban design is a complex and messy process. It involves overlapping actors and agendas. Five Principles for Greenwich South is an urban design proposal that responds to the unique conditions of Lower Manhattan and the economic climate of past two years. Yet Architecture Research Office and its collaborators are confident that both the process used to create this strategic framework and also the structure of the framework itself constitute a valuable and innovative paradigm for urban design, an approach to planning that is engaged with its constituents and aligned to the complexities of the growth and development of twenty-first century cities.
Context
The form of development in Manhattan is not the product of a master plan. Rather, its base condition is a framework: the 1811 Commissioner’s Plan nurtured a city whose characteristic juxtaposition of inconsistencies and contradictions, what Rem Koolhaas termed ”Manhattanism”, is both enabled and coordinated by the gridiron. While Lower Manhattan is emblematic of New York in its density, diversity, and drive for prosperity, its urban fabric is different from the rest of the city. It preceded the Commissioner’s Plan, so the colonial era’s narrow, winding streets still define it today (Figure 1). Without the grid, the City’s oldest and densest district has had no mechanism to coordinate growth, producing both spectacular and deficient urban conditions.
Two hundred years of ad-hoc development in Greenwich South have generated an agglomeration of diverse building types and urban morphologies, giving the area a rich architectural character. One of the oldest Federal townhouses in the city is at 67 Greenwich Street. The historic Curb Market Building, constructed in 1921 to formalize the unregulated trading that formerly took place on the street, still stands on the north edge of the site. The former Downtown Athletic Club, which encapsulated Koolhaas’s theory of Manhattanism, has been converted to condominiums and overlooks the Brooklyn-Battery Tunnel approach that occupies the southern half of the site. A long history of uncoordinated growth has also burdened Greenwich South with a succession of urban-scale infrastructure projects. The site’s western edge was once defined by an elevated railway, constructed in 1929, where today the West Side Highway begins. To the south, the Brooklyn-Battery Tunnel approach makes it difficult to traverse Greenwich South safely below Rector Street. To the north, Greenwich Street has been blocked since the construction of the original World Trade Center superblock in 1977(Figure 2).
55 Cassell and Barrett
Figure 2. Greenwich South’s boarders have been constructed by large-scale infrastructural projects, including the World Trade Center (1977), the West Side Highway (1970s), and the Brooklyn-Battery Tunnel and MTA Garages (1929-51).
Today, narrow dead-end streets and the presence of large infrastructure projects on all sides make it difficult to enter and depart Greenwich South, and harder still to cross along its east/west axis. The area lacks basic amenities and suffers from a lack of programming to support its 7,000 residents and anticipated additional 80,000 workers and 10,000 tourists expected with the completion of the World Trade Center complex and memorial. Development and improvements are occurring to the west (Battery Park City and the Hudson River Park), the south (Battery Park and the Staten Island Ferry Terminal) and the north (World Trade Center) yet Greenwich South has seen little development and no amelioration of its myriad planning deficiencies.
These conditions as well as its prime location and millions of square feet of developable air rights merit new attention to Greenwich South’s future. The site has potential to thrive by connecting four distinct neighborhoods to its north, south, east, and west, and this possibility is made more likely with the reopening of Greenwich Street as part of the World Trade Center site’s reconstruction. However, control of Greenwich South is held by multiple private land owners and public agencies, which sets a complicated context for the design and implementation of a large-scale planning effort. Although the Alliance for Downtown New York holds important influence over the district’s landowners, agencies, and authorities, as a business improvement district it neither owns the land nor possesses the authority to control its development.
These conditions made Greenwich South an ideal candidate for a strategic framework: a document that could provide the site not with a singular vision for the future, but, like Manhattan’s grid, with numerous possibilities guided by core principles. As
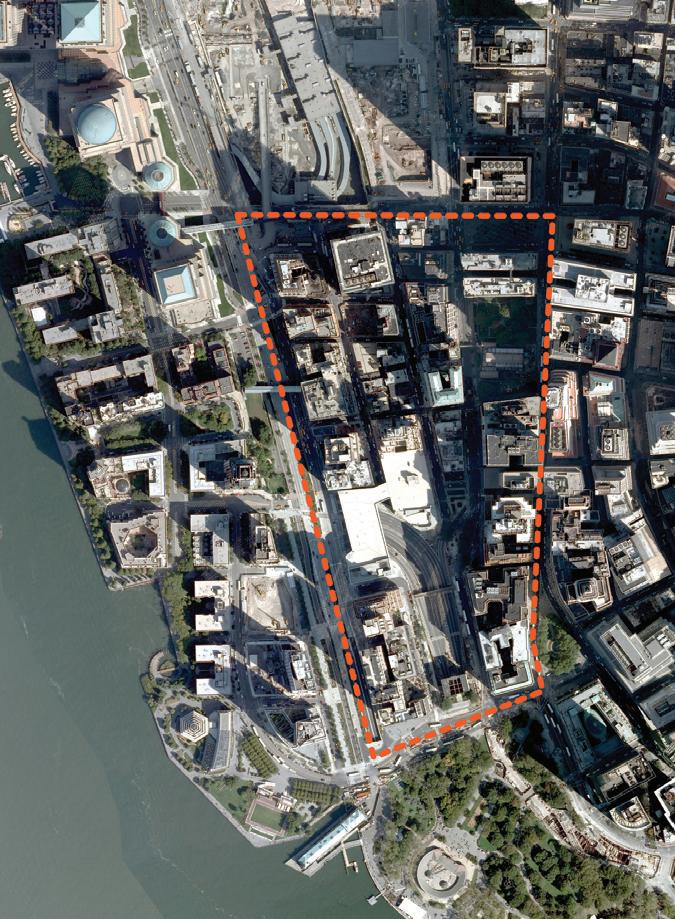
56 Projections
opposed to a comprehensive, static master plan, the strategic framework is a document that can evolve over time, informing and advising future growth and change in Greenwich South1.
Process
We created the strategic framework through a unique process—an iterative feedback loop in which we engaged constituents, design collaborators, and outside experts –and successively put forth and refined hypotheses and conjectures. Our process led to a project that engages stakeholders and coordinates participation in Greenwich South’s future in a broad range of directions (Figure 3).
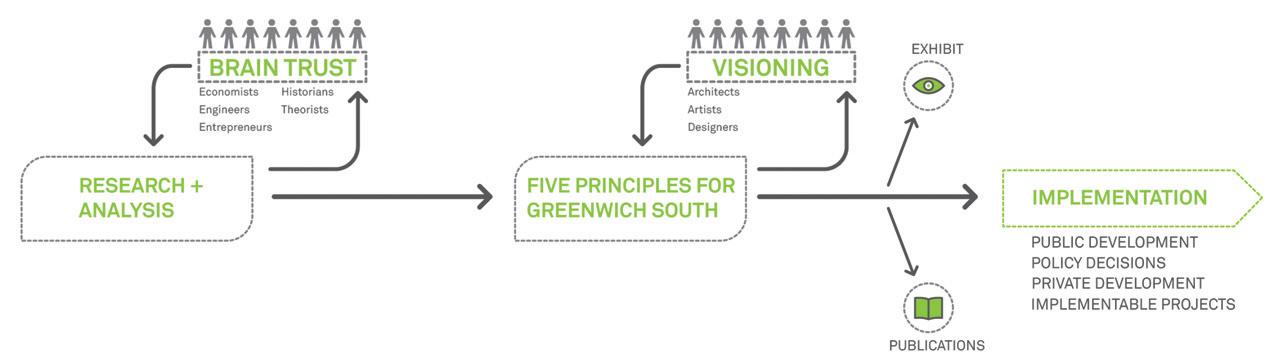
To frame and understand the problem, the study commenced with a research and analysis phase. Our interdisciplinary team took multiple approaches to assembling information and analyzing the site. Zoning, land use, and FAR studies revealed nearly ten million square feet of developable air rights latent in Greenwich South as well as strategies for unlocking this potential. A comprehensive survey of existing conditions demonstrated the under-use of the area by residents, tourists, and area workers on all sides. Information-gathering on current and planned future projects to the south, west, and north helped set the scene for Greenwich South’s future (Figure 4).
Out of this research, the team established a set of key questions and operating hypotheses. As a mechanism for testing our assumptions and expanding our outlook, we convened an event with a group of New Yorkers concerned for the future of Lower Manhattan—engineers, historians, arts professionals, architecture critics, restaurant owners, and business people (Figure 5). Presenting and discussing our preliminary work with this group, the Greenwich South Brain Trust, helped calibrate our approach to the problem. For example, we knew that dealing with extant infrastructure was one of Greenwich South’s primary challenges. The discussion not only helped us frame how that infrastructure could be re-invented in the future, but also maintain parts of it to provide a shared memory of the past. From a programmatic standpoint, these discussions developed our working definition of Greenwich South as a future ”lynchpin” with an emphasis on its integration with surrounding areas rather than its definition as a unique neighborhood. This refined set of key questions and challenges served
Figure 3. A unique process enabled an unconventional and adaptive planning proposal.
57 Cassell and Barrett
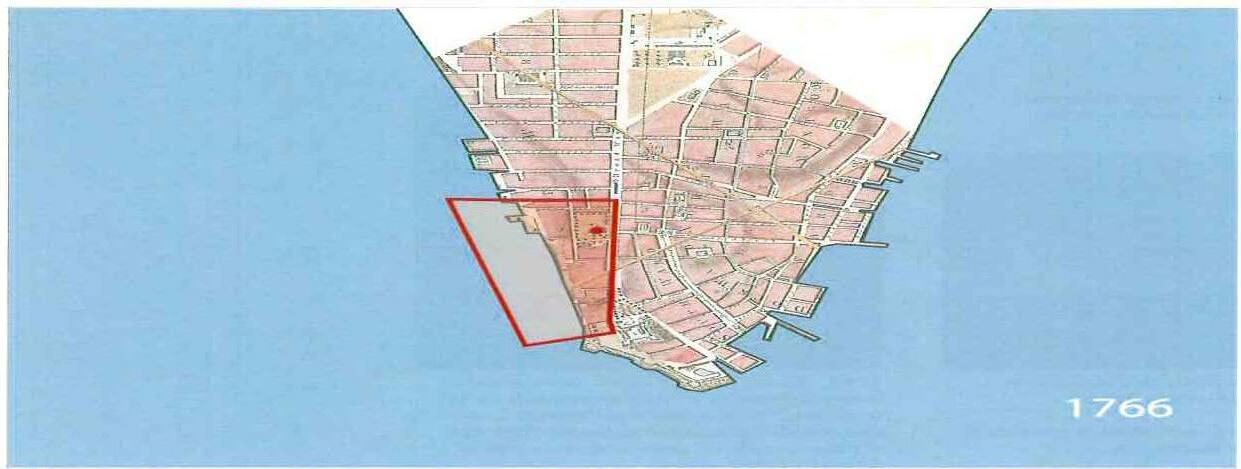
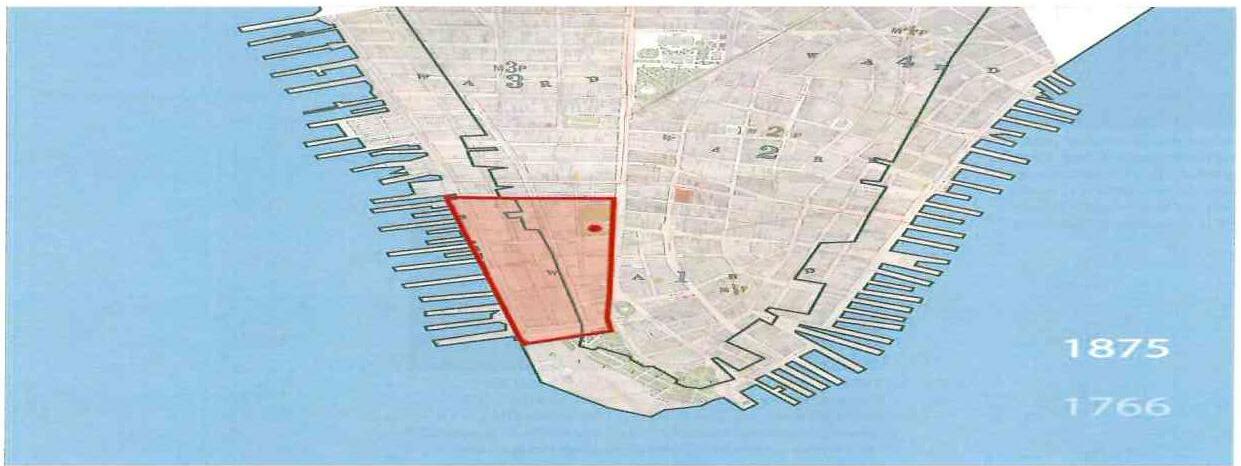
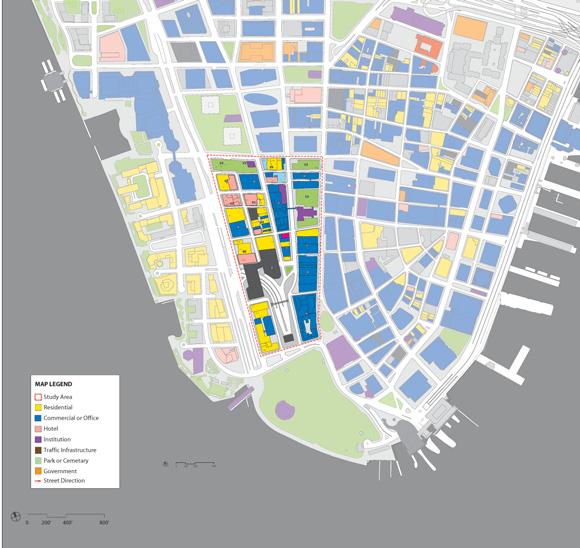
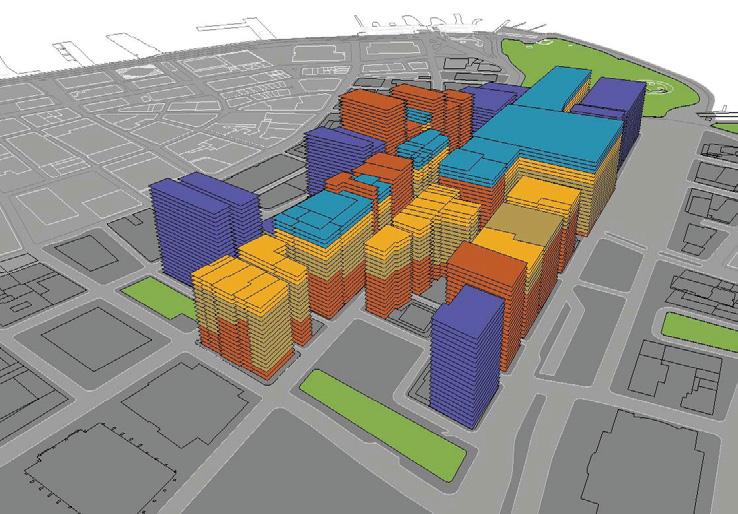
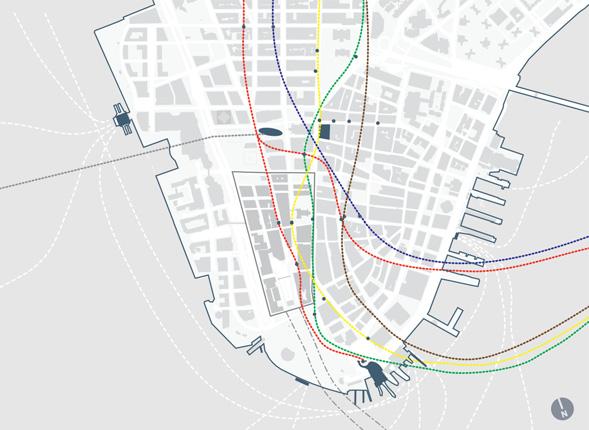
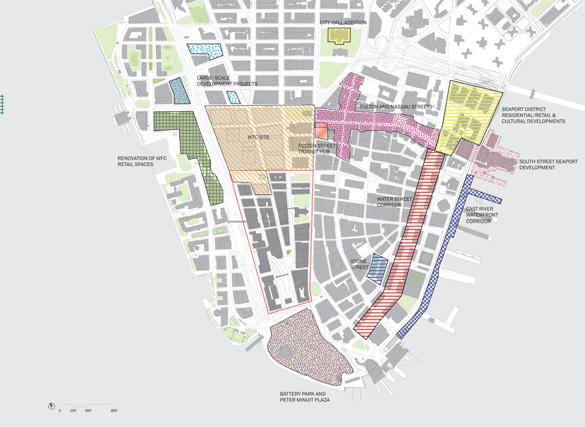
58 Projections 16’-0” SIDEWALK 18’-0” SIDEWALK 13’-0” MAX. CARTWAY 65’-0” RIGHT-OF-WAY MAX. SETBACK HEIGHT +97’-6” ABOVE CURB LEVEL (1.5 TIMES STREET WIDTH) (AS PER STREET WALL REGULATIOINS TYPE 3) 10’-0” TO 20’-0” SETBACK 10’-0” TO 20’-0” SETBACK 9’-0” AUTHORIZED VEHICLE PARKING OR LOADING ONLY 9’-0” AUTHORIZED VEHICLE PARKING OR LOADING ONLY 31’-0” *DESIGNATED RETAIL STREET (between LIBERTY STREET and EDGAR STREET) 0 100 200' 400' Built FAR LEGEND Landmark Building Sites Transferred Air Rights (max. 21.6 FAR) Unbuilt SF up to max. 15 FAR Unbuilt SF between 15 FAR and 18 FAR GREENWICHSTREET LIBERTYSTREET ALBANYSTREET WALLSTREET TRINITYPLACE BROADWAY WEST STREET Tower 5 Site WTC Site Battery Park B Financial District 15 52 17 14 51 27 29 7502 17 16 16 20 21 19 21 19 37 38 53 1 13 50 49 22 1101 1001 Landmarks Air Rights Recieving Sites Existing Non-Landmark Development on Site: 7.06 million sf (excluding 5 WTC) Existing Landmark Development on Site: 5.81 million sf EXISTING DEVELOPMENT Potential As-of-Right Development 15.0 FAR (excluding 5 WTC and Landmark sites): 6.53 million sf Potential Max. Bonus FAR Development 18.0 FAR (excluding 5 WTC and Landmark sites): 1.77 million sf Potential Max. Landmark Transfer 21.6 FAR (excluding 5 WTC): 1.37 million sf Total Potential Development (excluding 5 WTC and Landmark sites): 9.67 million sf POTENTIAL DEVELOPMENT
Research included programmatic, architectural, zoning, land use, and circulation studies of the neighborhood.
Figure 4.
as the foundation for the draft strategic framework written with our client and with feedback from various constituents and government agencies.
A Strategic Framework for Greenwich South
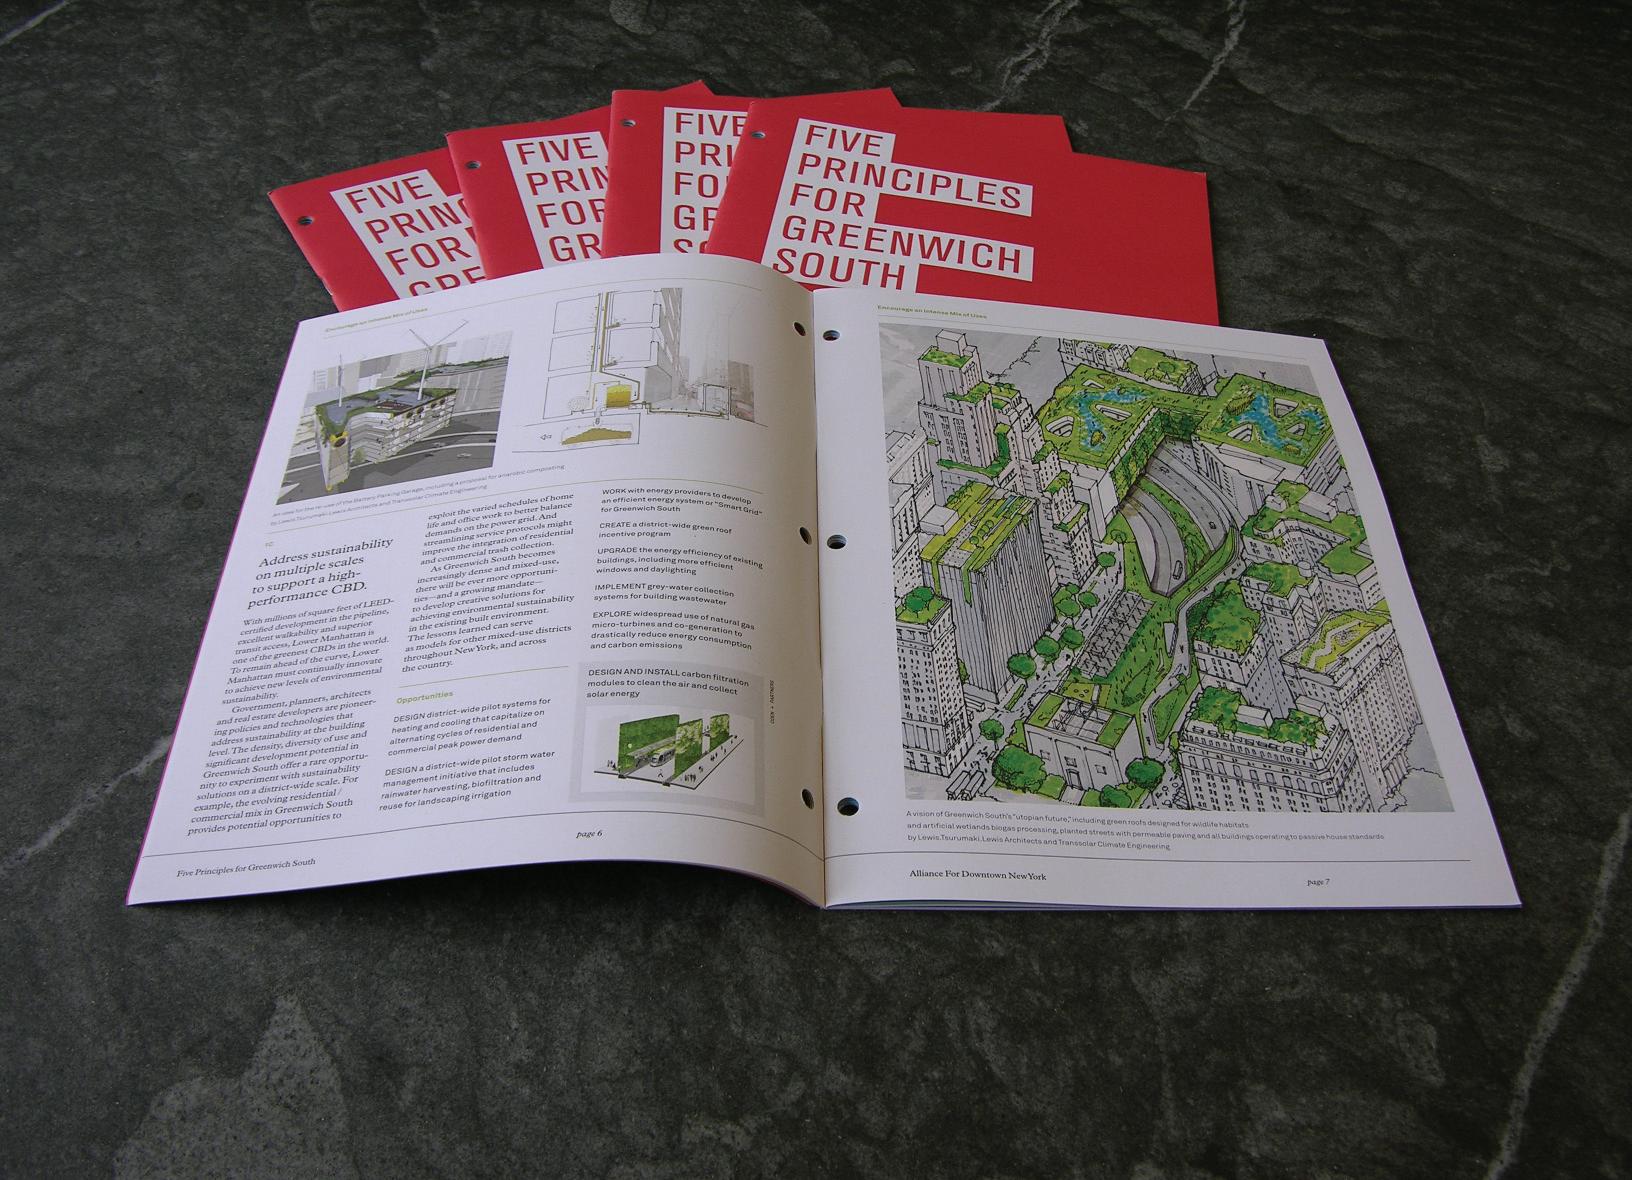


The framework had a delicate task to complete: to set forth a vision for the future in spite of an unstable present and many unknowns about the site and its surroundings; to resonate with the Alliance’s constituents, business owners and investors who would be key partners in achieving the goals of the framework; and, wherever possible, to work in concert with planning efforts already underway in neighboring areas of New York City. Architecture Research Office’s solution was based on a set of key overarching concepts, big ideas that embody the site’s main planning goals. From there, we developed a hierarchy of ideas that engage the project’s specific planning issues - a matrix of scales, scopes, and timeframes for actors to work within. This hi-

how do you build neighborhood connections across an 8-lane highway? sou can a giant piece of traffic infrastructure be a friendly neighbor? in 300 years, this could be underwater 300 years ago, this was underwater arturo di modica’s charging bull is the most iconic piece of public art in lower manhattan what does it mean to be “off the grid”? how do you get there from here?
59 Cassell and Barrett
Figure 5. Invitations to the ‘Brain Trust’ - the goal of the discussion was to examine how we were framing the problem and to make sure we were asking the right questions.
Figure 6. Five Principles for Greenwich South; a strategic framework for the neighborhood and district.
erarchical matrix became our strategic framework for Greenwich South, a document comprised of Principles, Objectives, and Opportunities which work together to build guidelines for short- and long-term growth at all scales (Figures 6; 9-13).
At the top of the matrix are five Principles, fixed goals that encapsulate the Framework’s response to the myriad challenges facing the site and form the basis of growth and change of the site’s internal development and integration with its surrounding neighborhoods. The five Principles we developed for Greenwich South are broad ideas about the cohesion of Lower Manhattan that may be interpreted in architectural, programmatic, and economic terms. They are independent from any specific action or initiative and can remain relevant over time and through changing conditions. Principle One (Figure 9) speaks holistically to Greenwich South’s synthesis with and contribution to Lower Manhattan, emphasizing the integration of businesses, residents, and tourists to produce environmental, economic, and programmatic prosperity. Principles Two and Three (Figures 10, 11) contend with issues of connectivity: Principle Two sets an agenda to capitalize on the reconnection of Greenwich Street through the World Trade Center site, and Principle Three establishes a set of goals to strengthen river-to-river connections between the neighborhoods to the east and west through Greenwich South . Principle Four (Figure 12) deals with the millions of square feet of developable air rights sitting latent in Greenwich South and organizes a set of planning and zoning goals to guide development in a way that benefits all of Lower Manhattan’s constituents. Principle Five (Figure 13) addresses programmatic deficiencies in Greenwich South, aimed towards the development of the area as a place that provides pragmatic, pleasurable, and entertainment amenities for residents, workers, and tourists.
Each Principle is a reduction of a complex set of dynamics and agendas that are expanded in the Objectives and Opportunities underlying each Principle. The simplicity behind the Principles ensures that they are easily communicated though also durable. But it is only in conjunction with the rest of the framework matrix that their content and meaning are clearly revealed.
Three to five Objectives describe the key components of each Principle, grounding the Framework in the specificities of the site. For example, Principle 2: Reconnect Greenwich Street – is elaborated in terms of scale, scope, and program through three Objectives that describe the application of the Principle at the scale of the building, the neighborhood, and the street. Objective 2A addresses infrastructural, landscape, programming, transportation, and architectural initiatives that could capitalize on the planned reconstruction of Greenwich Street through the new World Trade Center site. Objective 2B calls for the re-conception of the base of Greenwich Street as a landmark for Lower Manhattan and gateway to both the district and the city. Objective 2C looks towards initiatives to make the street a center of activity for the area (Figure 10).
60 Projections
Associated with each Objective is a list of Opportunities. It is at this smallest scale of information that design, policy, and planning initiatives are specifically recommended. Unlike Principles and Objectives, the Opportunities can be executed and are intended to be embraced, rejected, re-written, adapted, developed, changed, and replaced. Opportunities represent the many ways, from the pragmatic to the speculative, to achieve a given objective. For example, Objective 2C includes as Opportunities retail strategies, arts installations and zoning guidelines (Figure 10). The proposed Opportunities serve as examples to additional future changes that may be suggested and executed by others. Indeed, we assume that many of the opportunities described in Five Principles for Greenwich South may never be executed.
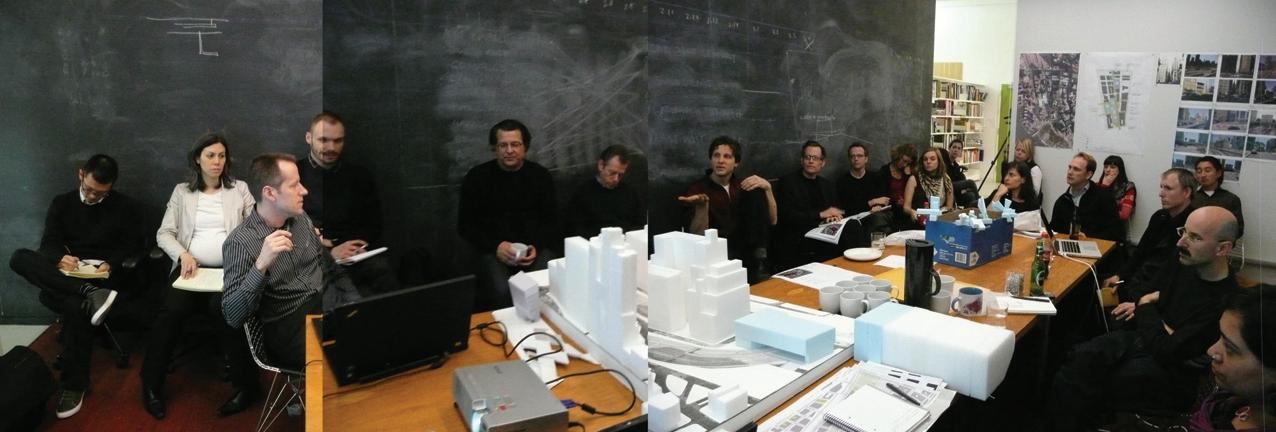
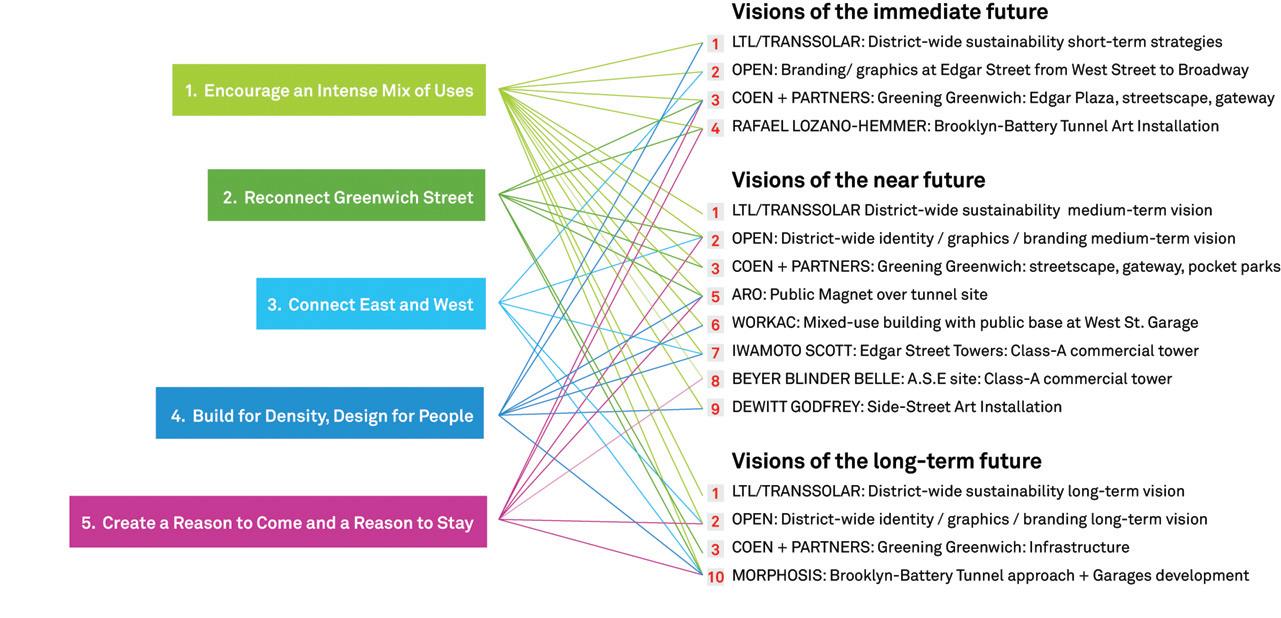
61
Cassell and Barrett
Figure 8. The Visioning Challenge Projects were tied to the Principles of the framework and assigned throughout the district across a range of timeframes.
Figure 7. Participants of the Visioning Challenges at an interim pin-up. Including, clockwise from left, Jejon Yeung (ARO) Kim Yao (ARO) David Lewis (Lewis.Tsurumaki.Lewis) Brian Kramer (Coen + Partners) Shane Coen (Coen + Partners) Marc Kristal, David White (Transsolar) Paul Lewis (Lewis.Tsurumaki.Lewis), Clark Manning, Anna Kenoff (WorkAC) Amale Andraos (WorkAC), Dan Wood (WorkAC), Craig Scott (IwamotoScott), Scott Lee (Morphosis), Adam Yarinsky (ARO), Sapna Advani (Beyer Blinder Belle).
INCORPORATE WiFi into public spaces
CREATE a “Green Exchange” trading oor for emerging green economy businesses
CREATE new spaces or reprogram older o ce spaces as co-working, live/work or incubators, which attract and accomodate diverse budiness sectors
INSTALL artist workspaces in the bases of new towers and vacant o ce spaces
INSTALL bike racks throughout Greenwich South
LAUNCH a retail attraction campaign to bring more residentially focused services and amenities

CREATE a community garden and start a Greenwich South garden club
INCENTIVIZE development projects to provide community resources such as sports and tness facilities, schools, artists’ studios, libraries and playgrounds
TRANSFORT Washington Street into a “shared street” with programmed public events
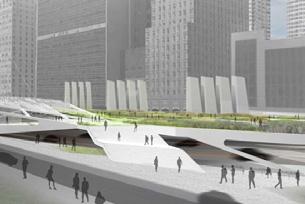
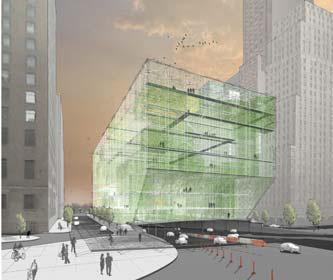
CREATE a neighborhood icon that can be a meeting place or “North Star”
CONVERT the existing West Street Garage into a public facility with recreation elds on the roof DESIGN district-wide pilot systems for heating and cooling that capitalize on alternating cycles of residential and commercial peak power demand
MODIFY zoning to enable the creation of pocket parks along Greenwich Street and improve streetscape with plantings and new street furniuture
DESIGN a district-wide pilot storm water management initiative that includes rainwater harvesting, bio ltration and reuse for landscaping irrigation
WORK with energy providers to develop an e cient energy system or “SmartGrid” for Greenwich South
CREATE a district-wide green roof incentive program
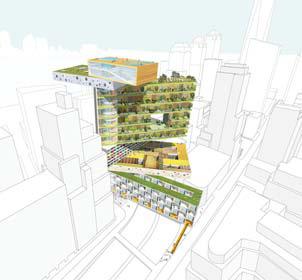
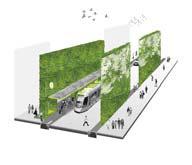
UPGRADE the energy e ciency of existing buildings, including more e cient windows and daylighting
EXPLORE widespread use of natural gas micro-turbines and co-generation to drastically reduce energy consumption and carbon emissions
62 Projections
1. Encourage an Intense Mix of Uses
1A.
Foster the growth of a diverse economy
1B. Create a neighbor hood within a business district 1C. Make Greenwich Street the Spine of Greenwich South
Figure 9. Principle 1.
2. Reconnect Greenwich Street
ADVOCATE for vehicular access through the World Trade Center along Greenwich Street
DESIGN security measures that are compatible with pedestrian and vehicle ow between the WTC and Greenwich South
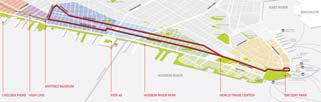
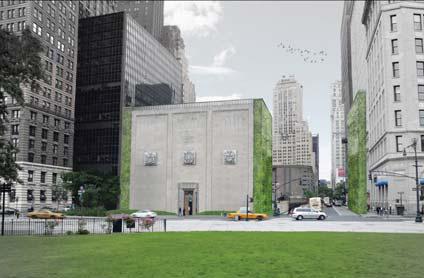
DESIGN AND IMPLEMENT a new sustainable public transportation route linking the Battery to Tribeca and the High Line along Greenwich Street
2A. Restore Greenwich Street from the Battery through the World Trade Center
REDESIGN sidewalks, landscaping and crosswalks along Greenwich Street to mirror Tribeca’s “Greening of Greenwich” program
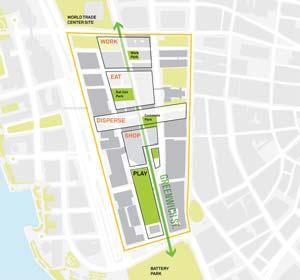
2B. Create a Gateway to Manhattan at the base of Greenwich South
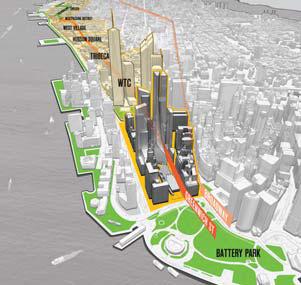
COORDINATE with streetscape, signage and lighting design of Battery Park to lead pedestrians to and from Greenwich Street
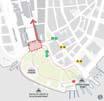
ESTABLISH a Lower Manhattan information kiosk at the bast of Greenwich Street CAPITALIZE on existing and planned attractions and transportation infrastructure
MAKE improvements to the base of Greenwich Street including plantings and lighting, starting with small e orts and adding to them over time INTEGRATE the concept of “it all starts here” into a new branding strategy
REPURPOSE ground oor spaces facing Greenwich Street as retail, restaurants, entertainment venues and other public uses
2C. Make Greenwich Street the Spine of Greenwich South
CAPITALIZE on the new market of WTC workers to attract retailers and restaurants that service the business community
COMMISSION temporary arts installations in vacant spaces
CREATE a spine of public art on Greenwich Street such as a series of large-scale sculptures
LOCATE major programmatic elements on Greenwich Street including arts and entertainment venues and public space
CREATE a sidewalk cafe district
MODIFY zoning to enable the creation of pocket pars along Greenwich Street and improve streetscape with plantings and new street furniuture
IMPLEMENT way- nding to orient people from the WTC site and along Greenwich Street into Greenwich South Figure 10. Principle 2.
Cassell and Barrett
63
3A. Reprogram side streets as magnets of activity connections
3. Connect East and West 3B. Reprogram side streets as magnets of activity 3C. Create visual connections from outside-in and inside-out
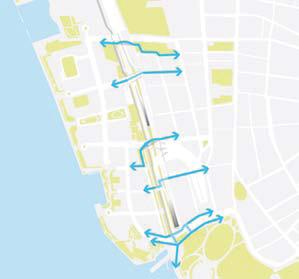
BUILD a bridge over West Street fro mWest Thames to JP Ward Street
USE tra c-calming measures to reduce speed of tra c along West Street
INCREASE the number and ease of at-grade crossings at West Street
REDESIGN streetscape on Rector Street to reinforce its function as a primary pedestrian route
COMMISSION a grapohic design, landscape and/or arts installation at Edgar Street crosswalk and through the MTA garage to improve the commuter corridor in the short-term
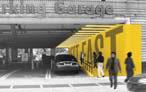
BUILD a new bridge over the tunnel approach to realign Morris Street
CREATE a uni ed way- nding system for West Street, Greenwich South and the World Trade Center
WIDEN the sidewalk and add landscaping to the streetscape to improve the pedestrian environment along the east side of West Street
EMBED one side-street with water and energy infrastructure to suppor markets and other seasonal activities and events
EHNANCE the pedestrian route de ned by Edgar Street by providing stronger midblock passage through a recon gured ground oor of the former American Stock Exchange building
DESIGNATE Exahange Alley as a long-term site for rotating site-speci installations
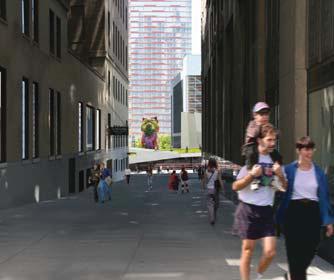
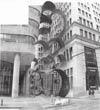
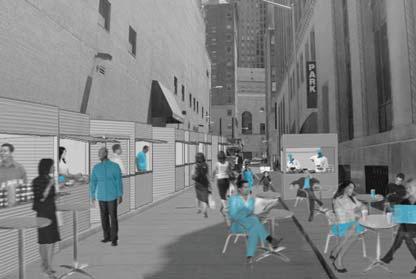
DONATE side streets to a rotating list of local arts- and communityorganizations one day every weekend
CREATE pocket parks that drive activity to underused streets
USE decking or green roofs to establish upper level public spaces and create river views
CURATE temporary art at strategic locations within the district to attract visitors
CREATE design guidelines that enhance pedestrian view corridors and encourage developers to follow those guidelines in new or redevelop-ment projects
COMMISSION permanent public artwors that are highly visible from side streets and points beyond the district, drawing people into the interior of Greenwich Street
TARGET AND INCENTIVIZE potential developers and investors to build iconic, visible buildings that de ne Greenwich South in the composition of Lower Manhattan’s distinctive skyline
LOCATE eye-catching architecture to establish a presence in the Lower Manhattan skyline
64 Projections
Figure 11. Principle 3.
CREATE a special zoning district for Greenwich South to allow the transfer of air rights from the Brooklyn-Battery Tunnel and historic buildings across the entire district
IDENTIFY sites of appropriate size and location for commercial development REDEFINE tower height, massing and dispersal to avoid the canyon e ect and to capture views, light and space
ENCOURAGE new residential units of varying types throughout the district
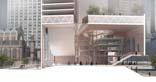
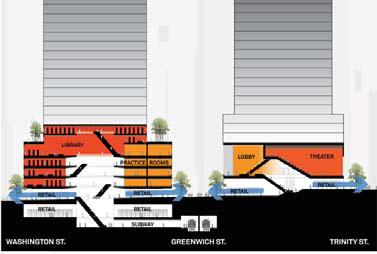
EMULATE Hong Kong’s zoning strategies to create generous bonuses based on publicly-programmed building bases
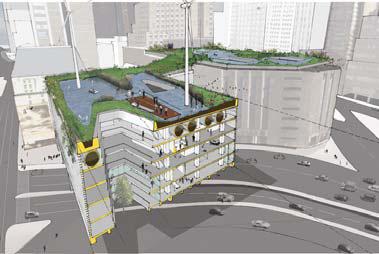
CREATE design guidelines to correspond with streets that encourage active ground oor use by design in Greenwich South
ESTABLISH a ne gran of continuous and engaging public-oriented activity at the street level
EXPLORE opportunities to adaptively reuse historic buildings that enhance development potential
INCENTIVIZE the inclusion of cultural and public programming above street level DEVELOP design guidelines to expand the public realm into building bases, and coordinate with streetscape to create and immersive pedestrian experierience
CREATE intensity of public-oriented activity in building bases
REPURPOSE ground oor spaces facing Greenwich Street as retail, restaurants, entertainment venues and other public uses CAPITALIZE on the new market of WTC workers to attract retailers and restaurants that service the business community
COMMISSION temporary arts installations in vacant spaces CREATE a spine of public art on Greenwich Street such as a series of large-scale sculptures
LOCATE major programmatic elements on Greenwich Street including arts and entertainment venues and public space
CREATE a sidewalk cafe district
MODIFY zoning to enable the creation of pocket pars along Greenwich Street and improve streetscape with plantings and new street furniuture
IMPLEMENT a comprehensive strategy for the long-term planning and redesign of Lower Manhattan infrastructure
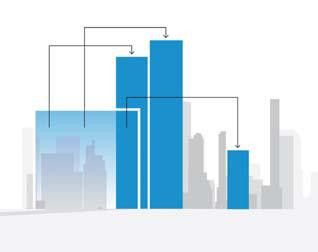
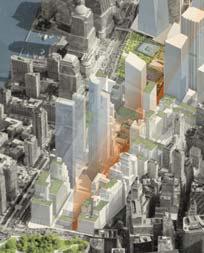
ENSURE that the pedestrian experience is foremost in the design and planning of future improvements along West Street
ADVOCATE for innovative methods of funding and design to support integrated and diverse modes of public transit
CONNECT public and private partners to explore options for the tunnel approach site Figure 12. Principle 4.
65
4A.
4B.
4C. Leverage
4D. Integrate
and
Community
Cassell and Barrett 4. Build for Density, Design for People
Enable dense, large-scale development
Encourage active building bases
the air rights of the BBT
infrastructure planning
design with
needs
5. Create a Reason to Come and a Reason to Stay
CREATE a network of public parks and plazas throughout the neighborhood
ENCOURAGE the creation of public facilities - markets, performance spaces, sports elds, outdoor movie theaters
CREATE strong architectural character with existing and new buildings by encourageing design excellence in adaptive reuse and new construction
5A. Create public spaces to support new development and a growing population
COMMISSION a district-wide public art program
CREATE a new signature community open space for area residents
CREATE an iconc meeting place in Greenwich South
WIDEN sidewalks and improve storefronts along the west side of Trinity Place to create a Shopping promenade
MAXIMIZE retail uses throughout the district with attractive street corners, incentives for new tenants and improved storefronts
REDESIGN Rector Street to make it a stronger connector between the WTC site and Wall Street
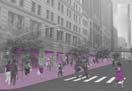
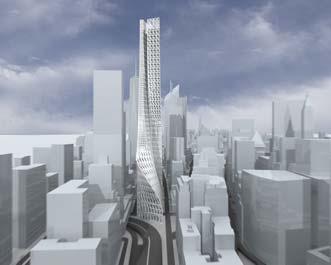
5B. Establish identities for north-south streets 5C. Compliment Lower Manhattan’s cultural destinations with dynamic programming
GIVE West Street a human scale and functional identity by retro tting and programming the east side of the street with services and retail REIMAGINE Washington Street as a shared street neighborhood amenity
PROGRAM Brooklyn-Battery Tunnel approach site to capitalize on the major destinations surrounding Greenwich South DESIGN Edgar Street Park with space for small outdoor performances
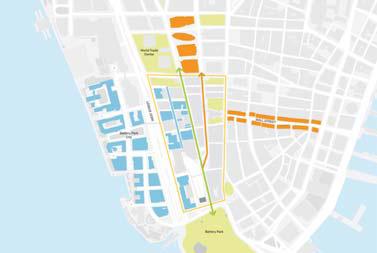
ATTRACT institutions and activities with contemporary and dynamic programs to maximize return visits
INCENTIVIZE creation of rehearsal, studio and/or performance spaces for small and medium-sized organizations within existing and future mixed-use buildings CURATE a district-wide art installation
RENOVATE Edgar Plaza and commission an art installation to create an icon and place for gathering
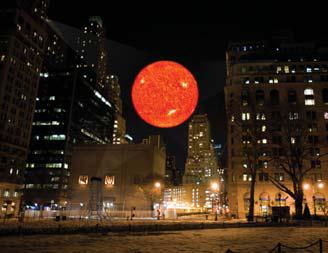
COMMISSION temporary art installations over the Brooklyn-Battery Tunnel approach and on the ventilation facility
5D. Create icons that establish a new identity and sense of place for Greenwich South Figure 13. Principle 5.
HOST a rotating architectural design competition at the Edgar Plaza or Greenwich Gateway site akin to the Serpentine Gallery in London or PS1 in Queens
BUILD a tall iconic structure that is not a building - like the St. Louis Arch - to enable a new perspective on Lower Manhattan and to establish a new datum for Greenwich South
BUILD a new public space for the long-term future of Lower Manhattan
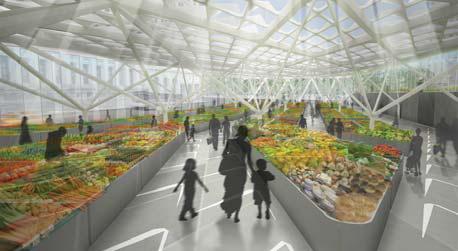
66 Projections
Figure 14. Iwamoto Scott proposed a mixed-use tower that responds to its immediate site context while establishing a strong relationship to the larger form of Manhattan. The towers’ design seeks to reinstate Edgar Street as an east-west public way, bifurcating at the base to reconnect Greenwich and Washington Streets. The space of this passageway through the building twists upwards, rising through the body of the towers, pinching at the mid level to allow for larger floorplates, and culminating at a rooftop sky lobby and civic space. Edgar Street Towers’ programmatic mixture serves the local neighborhood while enhancing the public realm of Lower Manhattan. It is envisioned to include spaces for living, working, art, performance, retail and a branch public library. The program is organized by the towers’ central atrium, enhanced by daylight channeled from above via an integrated transmitting fiber-optic array. By night, the light-flow is reversed, whereby the fi ber-optic array is lit from integrated solar-charged battery packs. On a macro scale, Edgar Street Towers takes advantage of the visibility and prominence offered by its site, where its dynamic form acts as a civic landmark and beacon for those coming to and leaving the city.
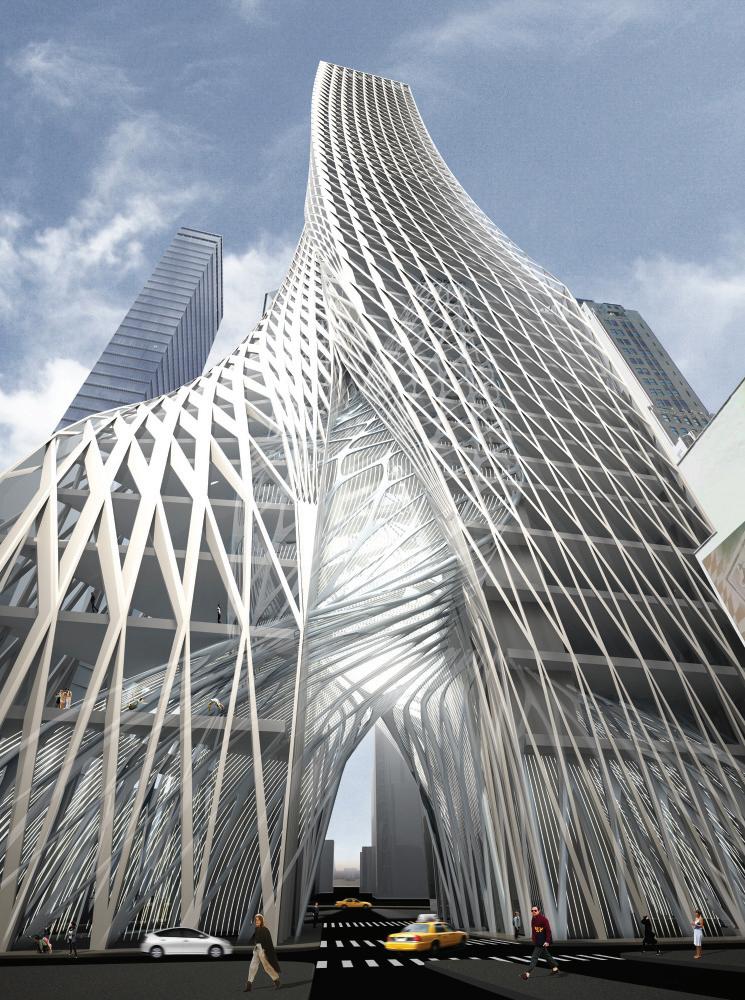
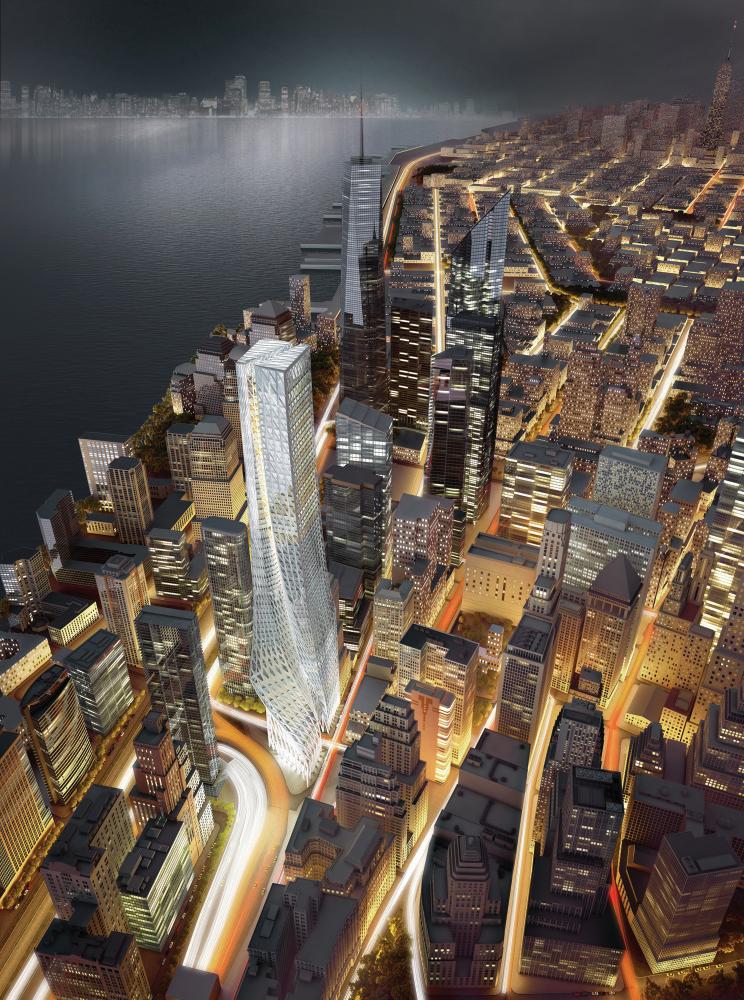
Envisioning Greenwich South
Like an open-source application, the strategic framework is designed to inform public consciousness, able to evolve, adapt and engage with diverse constituencies and forces at work in Lower Manhattan. Following the completion of our final draft of the strategic framework, we submitted the document to a final phase of testing and refinement before releasing it to the public. We invited teams of architects, environmental engineers, artists, planners, landscape architects and graphic designers to join our internal team in a “Visioning” phase2 with two objectives: first, gain feedback from our peers that would help us refine the framework, and, second, produce material that would serve as an illustration of the principles themselves (Figure 7).
67 Cassell and Barrett
Figure 15. Open’s proposal for a district-wide wayfinding system celebrates the idiosyncrasy of the neighborhood, combining traditional signage forms with the unexpected to draw attention to the history of the area and create an identity for and intrigue in Greenwich South.
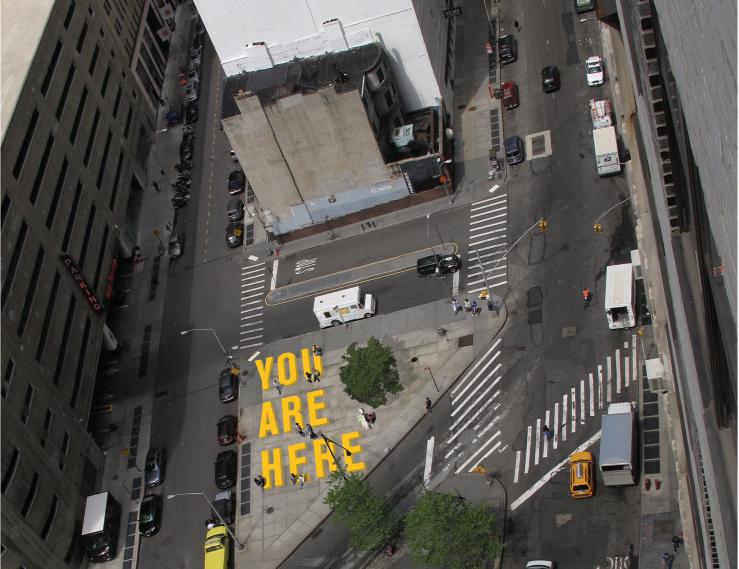
Each team was assigned one of ten hypothetical projects in Greenwich South that engaged key challenges of the site and aspects of the five Principles, and asked to approach the problem using the framework as a guide. The challenges were broken down into three temporal categories – short-term, medium-term, and long-term –and encompassed a range of scales, from site-specific arts installations to districtwide strategies for sustainability (Figure 8). Most importantly, the design challenges were purposefully organized so as NOT to fit together into a cohesive whole, but rather to overlap in both space and time. This encouraged a reading of the framework as a source of multiple possible futures based on numerous factors. It also meant that no one image came to characterize the project, and this enabled our client to use progressive, provocative work to illustrate the framework without being attached to specific proposals (Figures 14-16). The materials produced in the visioning exercises were bound with our research, analysis and strategic framework in the final deliverable, Five Principles for Greenwich South: A Model for Lower Manhattan.
The nature of the framework is such that its success depends on both awareness and interest to participate on the part of different communities — designers, public officials, developers, community organizations, and the general public. To connect with this range of potential users, we designed two publications—a tabloid newspaper (What If?) geared towards all audiences, and a formal, bound report (Five Principles of Greenwich South) oriented to public and private individuals and groups who might play a role in its implementation (Figures 17-18). Similarly, we mounted two exhibits. We designed an open-air exhibit for the general public at a downtown park, adjacent to the World Trade Center site through which 20,000 people pass through daily. A second exhibit, geared towards the urban planning community at the Center
68 Projections
Figure 16. Our proposal for ‘Market/Park’ reconnects Lower Manhattan across the Brooklyn-Battery Tunnel approach while creating a major destination for residents, tourists, and visitors. The building is designed as an occupiable deck that spans the Tunnel trench. To the south end of the site, where clearance above the roadway is greatest, a public market would contribute a significant new public program to the district – a place you might stop to grab lunch, run into a friend, or pick up groceries on your way home. Linking city and country while strengthening the availability of locally-grown and –produced foods, the market would also create a much-needed culinary destination Downtown. As the tunnel roadway rises to the north end of the site, the deck fl attens to support a neighborhood park. Accessible from West Street, Washington Street, and Greenwich Street, the park is also a new crossroads for those who live in, commute to, and visit Lower Manhattan. At the south, a broad Visitors’ Plaza would create both a gateway and a meeting point for Downtown’s growing tourist population. In addition to creating three major iconic public spaces in the city, Market/Park could be a key step in the future development of Greenwich South, The transferable air rights created by the construction of the deck will increase in value by virtue of their proximity to the deck, such that the project is mutually beneficial to both the public and the private realm.
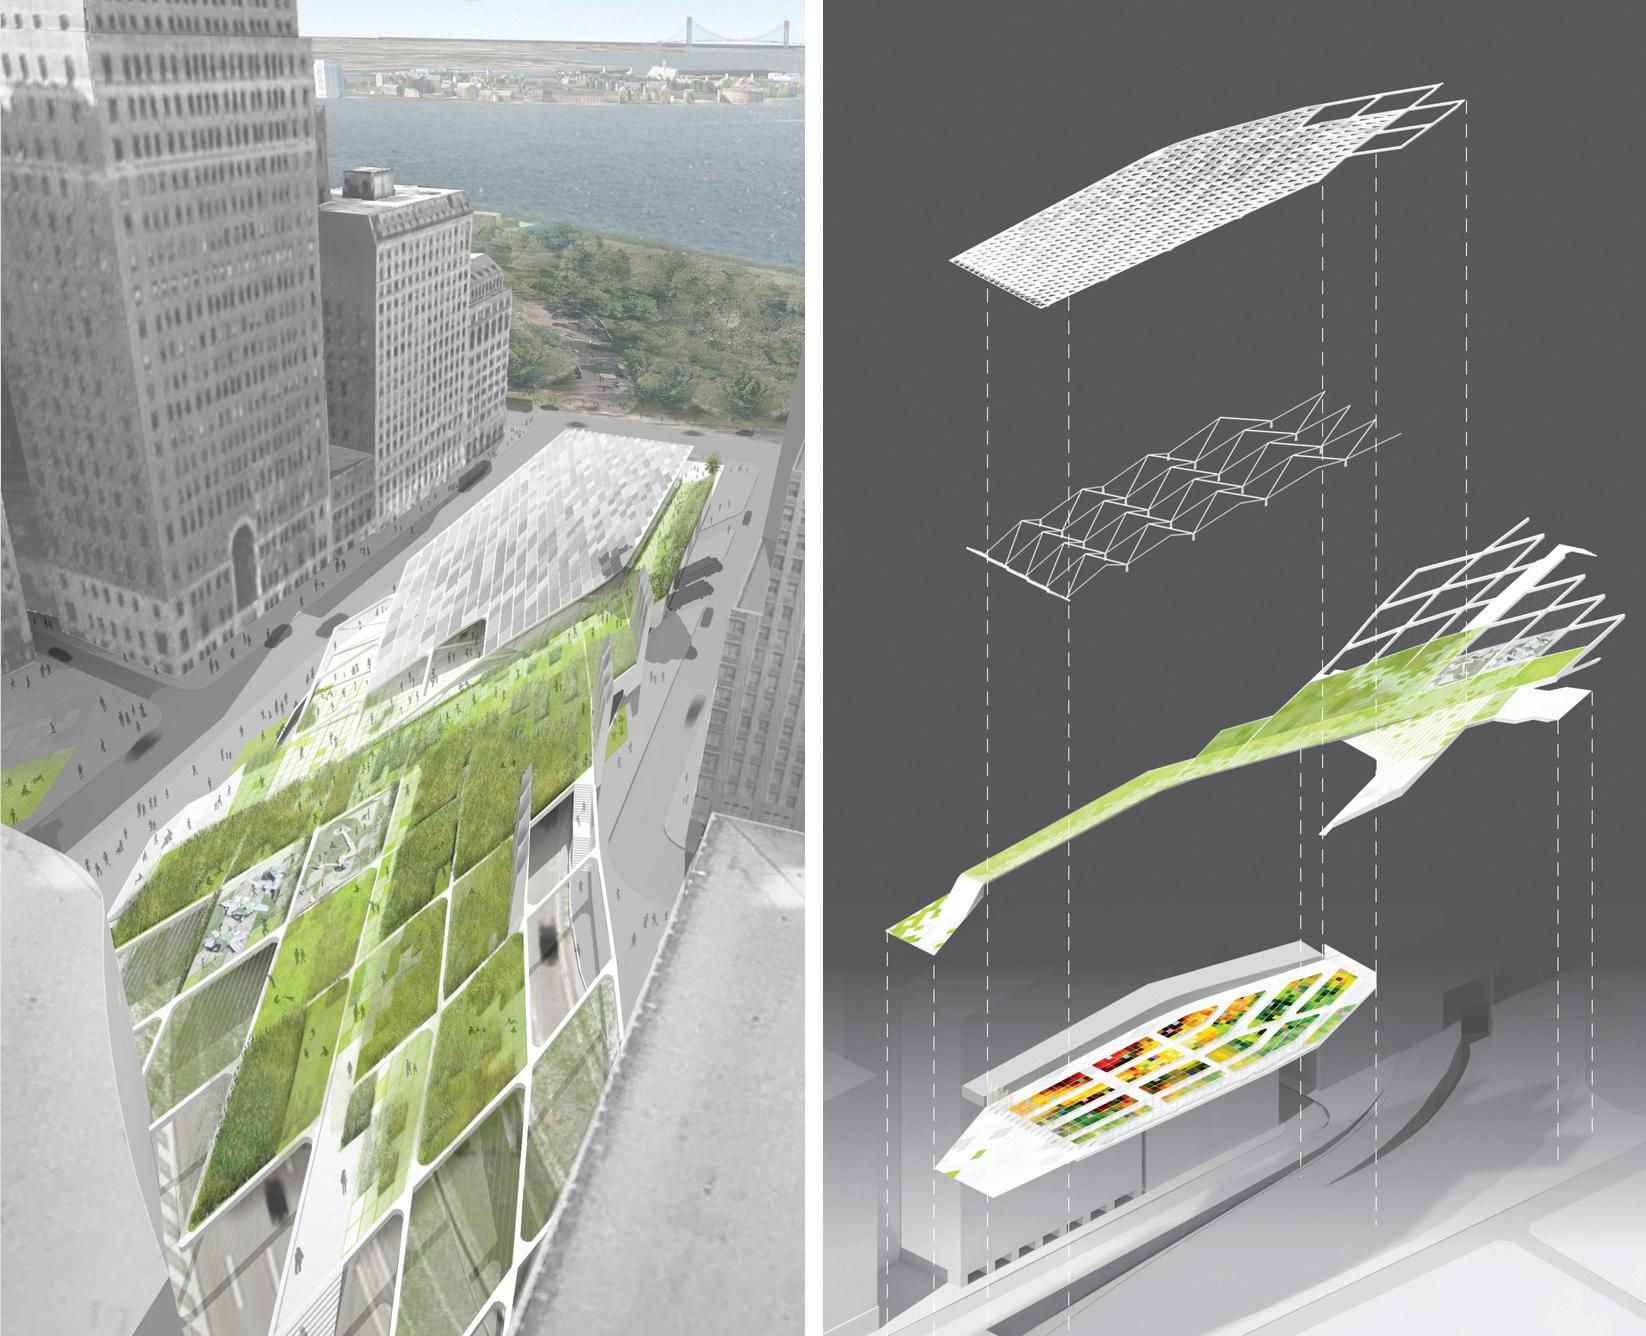
for Architecture in New York, displayed work from the Design Challenges in full detail, including models and a series of drawings for each project (Figures 19).
A Framework for Urban Design
We view Five Principles for Greenwich South as a living document, an ongoing project for the future of Lower Manhattan. Just as many voices were incorporated into the process of generating the strategic framework, ARO and the Alliance set forth a proposal crafted to engage the city’s heterogeneous users, stakeholders, and actors—from global financial firms to private local developers, from residents to tourists.
69
and Barrett
Cassell
Figure 17, 18. Two publications were designed to record and publicize the study to multiple constituents; a tabloid geared toward the wider public at-large and a full study binder oriented towards public and private agencies and individuals who might potentially partner in Greenwich South’s future.
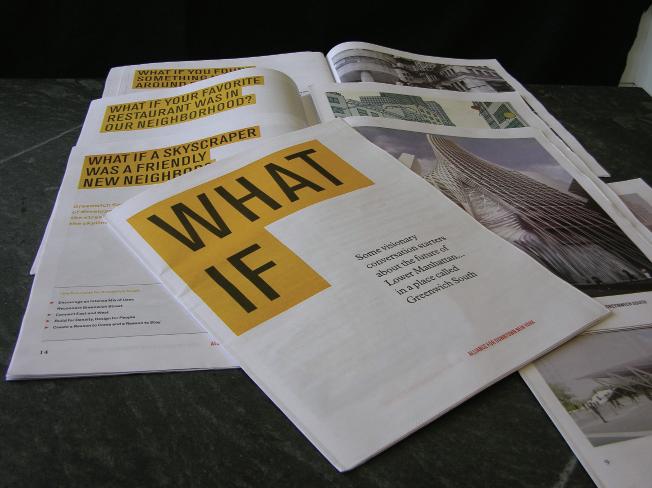

Figure 19. A public exhibit in Zuccotti Park, adjacent to Greenwich South, used a combination of supertext, visioning images, and fi ne-grained information from the Framework. The exhibit was designed to communicate at multiple scales, and asked visitors to imagine What If? Greenwich South were to grow in alignment with the Framework.
Five Principles for Greenwich South is a unique project created for a unique client. But we believe that both the process and the project itself contribute more than a solution to a particular planning problem in Lower Manhattan. Our process mobilized stakeholders, constituents, thinkers, and designers in collaboration, broadening engagement in Greenwich South while incorporating multiple viewpoints and agendas. In doing so, a robust document emerged, offering the clarity of core principles as well as the adaptability of objectives and opportunities. Our experience revealed that this planning process and the structure of the strategic framework function in parallel to each another. It is our hope that they also mirror the collaborative, dynamic achievement of Greenwich South’s potential by many actors, at all scales, in the near future as well as in decades to come.
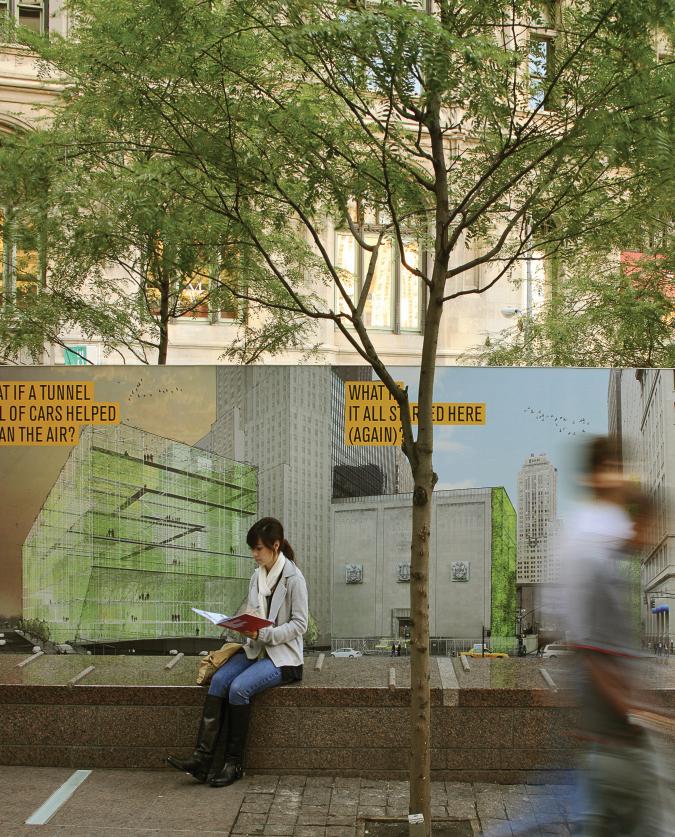
70 Projections
ENDNOTES
[1] The concept of using a framework rather than a master plan to guide the integrated growth of Lower Manhattan is not new. It was first introduced in 1966 when the New York Planning Commission published the Plan for Lower Manhattan to resolve disparate and uncoordinated efforts then underway. The Plan for Lower Manhattan was published during a time of massive change—Lower Manhattan was in a construction boom and large areas of the district, including the World Trade Center, Civic Center, and the Financial District were undergoing major development, often including sweeping changes to traffic and the city map. The influential but never-realized Plan was organized as a framework for growth that would be open to multiple players and interpretations. Conceived of as “not merely a project, or even series of projects, but [rather] a system of development” It proposed a massive, district-wide infrastructural effort that would comprehensively address vehicular and pedestrian circulation, land use, and development.” Rather than setting forth this proposition with a static plan, the document encapsulated “an approach, a process, and an organizing concept,” setting forth recommendations and goals which were anticipated to be achieved “in a number of different ways, at different times in different places”.
The Lower Manhattan Plan. The 1966 Vision for Downtown New York, a Reprint of the 1966 report by the New York City Planning Commission. Carol Willis, Editor. Princeton Architectural Press, New York / The Skyscraper Museum, New York. Page iii
[2] The visioning charrette included Coen+Partners, DeWitt Godfrey, IwamotoScott, Lewis.Tsurumaki. Lewis, Morphosis, Rafael Lozano-Hemmer, Transsolar, and WorkAC.
71 Cassell and Barrett
!"#$%&'(#)*
MAT URBANISM: GROWTH AND CHANGE
JAIME J. FERRER FORÉS Universitat Politècnica de Catalunya
ABSTRACT
The paper aims to re-evaluate a modern strategy of formal organization in architecture and urbanism called ‘mat-building’, exploring its potential to contribute to the contemporary discourse of sustainable built environments. The discourse of matbuilding emerged from the Smithson’s fascination with the traditional Arabic Kasbah (Smithson, 1974). In her search for signs that identify ‘mats’, Alison Smithson goes back to Katsura, Sinan, Honan, the vaulted constructions of Greek and Arabic architecture, as well as Mies van der Rohe’s work in America. The Kasbah also embodies a metaphorical reference: “full of starts and stops and shadows… with a high degree of connectedness to allow for change of mind and the in-roads of time” (Ibid). Team 10’s work in the late 1950s and during the 1960s became heavily influenced by mats, their urban structure, environmental identity, patterns of mobility and transformability. The influence of the Kasbah can be seen in Candilis-Josic-Woods’s project for the reconstruction of central Frankfurt and the Free University of Berlin in 1963, both proposing horizontal buildings that Shadrach Woods referred to as ‘groundscrapers’. Mat-building is a process, a growing structure of additive elements characterized by a delicate interplay between variations and repetitions of form. Retracing the formal evolution of mat-buildings, this paper tries to point to the typology’s relevance in the contemporary discourses of sustainabile urbansim and land-use planning.
73 Ferrer Forés
Introduction
Mat-building emerged in the late 1950s as a consequence of the debates within CIAM over principles of functional zoning. A group of younger architects, called Team 10, suggested an alternative to the functional city described in Le Corbusier’s Athens Charter (1933), in which the four functions of daily life — living, working, circulation and recreation — were segregated from one another. Alison Smithson described the mat concept and defined mat-building as follows: “mat-building can be said to epitomize the anonymous collective; where the functions come to enrich the fabric, and the individual gains new freedoms of action through a new shuffled order, based on interconnection, close knit patterns of association and possibilities for growth, diminution and change.” (Smithson, 1974)
It is through their insistence that modern urbanism could express a higher degree of particularity and identity that Team 10 argued for a greater individual focus over the universalizing approach of the functional city (Figure 1). Instead of a static architectural composition, mat-architecture is the installation of a generative structure: urban forms shaped by the unique characteristics of particular places, specific patterns of human association, open to transformation, respectful of local nature and climate. The mat was intended to provide flexibility in planning for a range of functions over time, thus assuring its own longevity; its very realization is spread out over time and subject to revision and adaptation. “The systems will have more than the usual three dimensions,” argued Alison Smithson, “They will include a time dimension.” (Smithson, 1974)
Mainstream mat-building became visible in Team 10’s work with the completion of the project for the Frankfurt-Römerberg center (1963) and the Berlin Free University (1963) by Candilis-Josic-Woods, where their work attempted to demonstrate the environmental responsiveness of mat-building in the context of a large and rapidly evolving institution (Figure 2, 3). The principles of these and other mat structures are now reappearing in the contemporary debates on sustainable architecture and urban development. According to Hashim Sarkis, “today mats are appearing everywhere. We call them fields, grounds, carpets, matrices. The mat answers to the recurring calls for efficiency in land use, indeterminacy in size and shape,
Figure 1. Cluster of overlapping functions. Source : Smithson and Smithson, 2005.
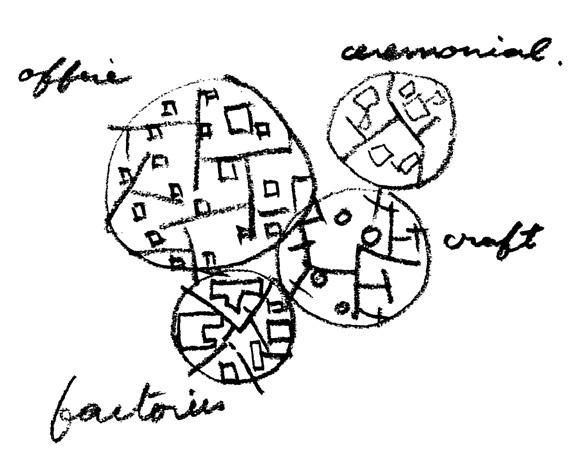
74 Projections
Figure 2. Competition for the reconstruction of Frankfurt-Römerberg centre, 1963, Source: Joedicke, 1968.
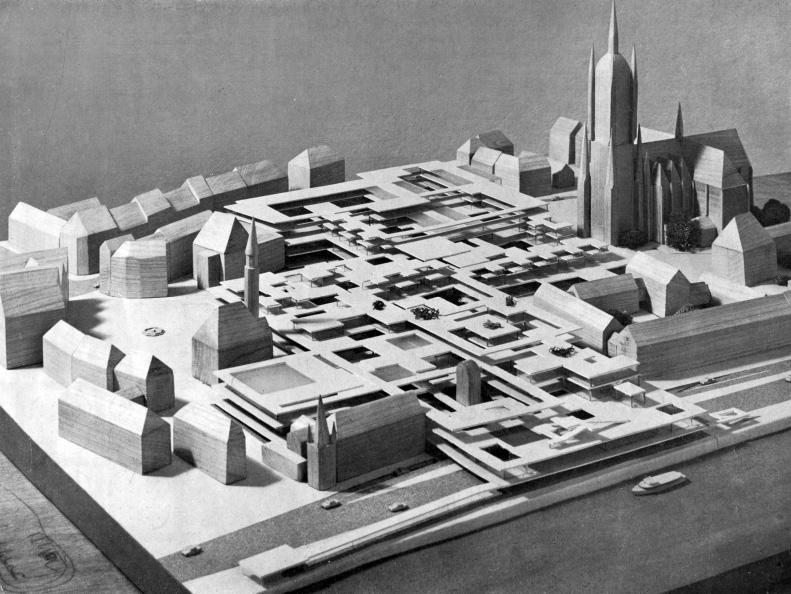
Figure 3. Competition design for the Free University, Berlin, 1963, Source: Joedicke, 1968.
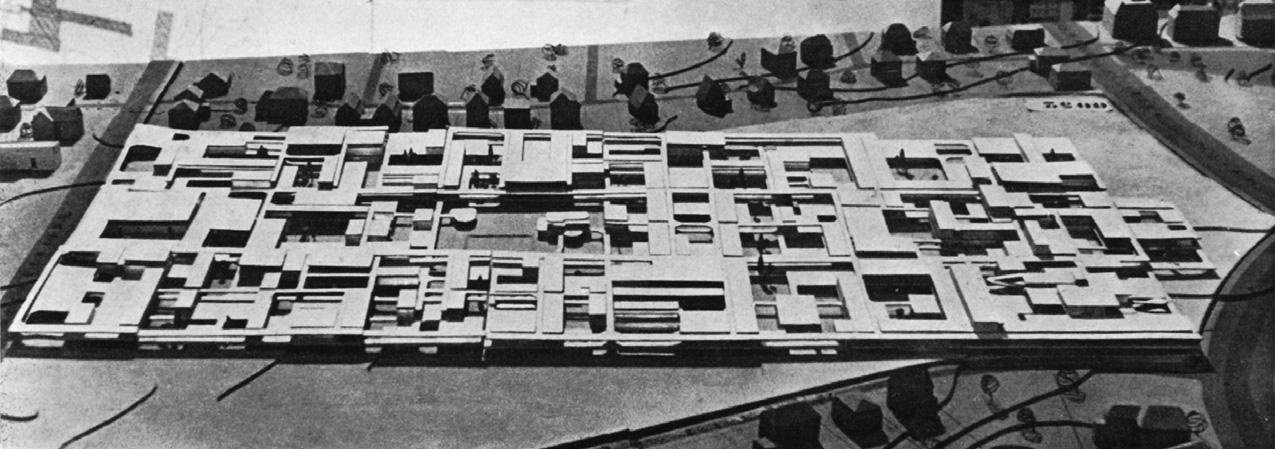
flexibility in building use, and mixture in program. In the face of these challenges, and in every other design published in every other magazine, the mat claims to address a wide range of problems preoccupying contemporary architecture” (Sarkis, 2001). Stan Allen has recently also re-evoked mat-building principles to meet the design challenges of contemporary architecture and urbanism, characterizing mat-buildings as “a shallow but dense section activated by ramps and double-height voids, the unifying capacity of a large open roof, a site strategy that lets the city and the landscape flow through the project, a delicate interplay of repetition and variation and the incorporation of time element as an active variable in urban architecture” (Allen, 2001).
This paper aims to re-evaluate the mat-building strategies of formal organization in architecture and urbanism, exploring their potential for contemporary sustainable environments. The paper traces a formal analysis of mat projects in the following thematic order: from cell to cluster, from cluster to stem and from stem to mat, presenting worked examples by Candilis-Josic-Woods and Alison and Peter Smithson.
From Cell to Cluster
The re-conceptualization of the urban tissue in Team 10’s work started with a single dwelling cell. The cell — an individual building or space that accommodates human activities — was organized through the ‘from cell to cluster’ principle, which separated the urban tissue into its smallest components, cells, and re-assembled them so as to establish intricate spatial variation between private and public space (Figure
75 Ferrer Forés
4). This essential characteristic of the traditional European city was put to practice by Candilis-Josic-Woods in their extremely diversified low-rise, high-density courtyard housing in Aulnay Sous Bois, France (1960) and in their competition entry for semi-urban housing in Algeria (1960), which the authors considered “an attempt to discover structuring principles which might be applicable to the organization of the physical environment” (Avermaete, 2005). The typology, which was forward-looking in its innovative treatment of vehicular traffic and site climate conditions, used the courtyard house as the organizing cell of the development, and the courtyard itself as a vital center and climate regulator of the house. The courtyard plan can adapt to different climates – in hot areas, exposure to the sun can be avoided by keeping courtyards small and overshadowed by high walls, wide eaves and foliage. The exposure of vertical surfaces to the sun is minimized by sharing the external walls with neighboring houses. Thick walls and small windows of the courtyard layout keep interiors cool, while allowing cross ventilation with shady verandas and patios facilitate outdoor living. The resulting cluster typology creates a rich variety of spatial experiences and a formal framework for changing patterns of use.
Figure 4. Cluster diagram of Fold Houses, 1955, Source : Smithson and Smithson, 2005.
From Cluster to Stem
In his declaration of the four functions of cities at the 4th CIAM Congress in 1933 – living, working, recreation, circulation – Le Corbusier proposed a comprehensive city desing framework for a Modern society. By the 1950s, the younger members of CIAM were advocating a planning approach that would better account for diversity — social, cultural, climatic and ethnic — in the built environment as well as its users (Statement on Habitat/Doorn Manifesto, 1954). Shadrach Woods, one of the opponents of functionalist zoning, argued: “The implantation of isolated housing projects or of dormitory towns makes as little sense as the building of educational or industrial parks. Public and private are contiguous and continuous, each supporting the other, but each limited to its own domain... when either clearly dominates over large areas, the fabric of life is discontinuous, creating zones of blight” (Woods, 1962). According to the Smithsons, “the forms and patterns derived from the garden city movement or the rationalism of the 30’s [were] endlessly repeated in contradiction to the climate, human habit, location and common sense”. For Team 10 architecture is not a ‘magnificent play of form in light’, as defined by Le Corbusier, but rather an attempt to create spaces for particular human activities over time. Architecture’s aim is to define a ‘carrying order’, an infrastructural project capable of variation and growth.

76 Projections
In line with their response, the Smithson studied groupings of dwelling that would foster community and develop a natural relationship to their environment: “this might be termed the ecological concept of Urbanism, a concept of obvious value when we are dealing with the problem of ‘habitat’”. (Smithson and Smithson 2005) Re-thinking the basic relationships between social life and mechanization, they searched for new patterns of Habitat for a new urban reality. Their work suggested that the structure of cities lies not in their geometries but in the activities within them. These activities are articulated or materialized by buildings and spaces, by paths and places, and by the careful articulation of public and private control. In contrast to standardized architecture that ignores the particularities of its location and uses, they argued that architectural order should derive from comunity hierarchies and contextual associations. The system of relationships and patterns of encounter, which the cells and stems of the cluster generate, provide the spatial framework for these hierarchies and associations.
Instead of ‘new monumentality’, grand piazzas and the ‘hearth of the city’ presented at the previous CIAM by Sert and Giedion, the Smithsons put forward the streets of London’s working class neighborhoods as inspiration for a new form of architecture and urban design. The idea of the street as a stem of public life was developed further in their competition entry for a new housing block at Golden Lane in 1952. The project’s ‘street in the air’ concept was designed as an ample gallery that gives access to flats, but at the same time also functions as a place for human encounter
Figure 5. Diagrammatic plan of a small city from the Golden lane project, 1952, Source : Smithson and Smithson, 2005.
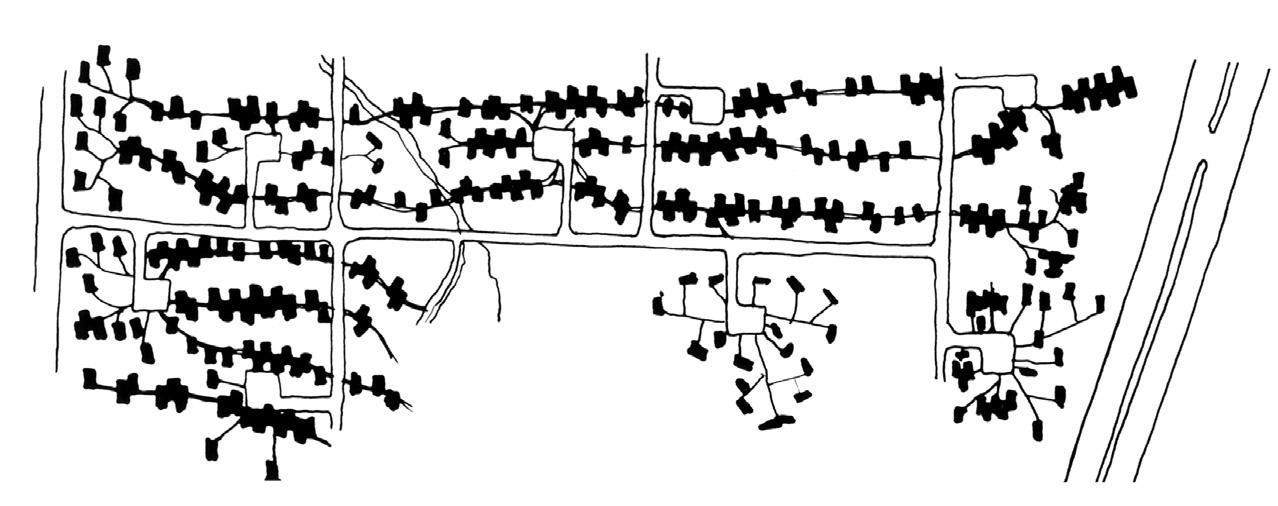
Figure 6. Cluster diagram of Close Houses from 1955, Source : Smithson and Smithson, 2005.

77 Ferrer Forés
and play (Figure 5). Instead of the rue intérieure proposed by Le Corbusier in his Unité d’Habitation in Marseilles, the Smithsons proposed to move the circulation space to the façade of their buildings, thereby accentuating the public character and spatial autonomy of the stem.
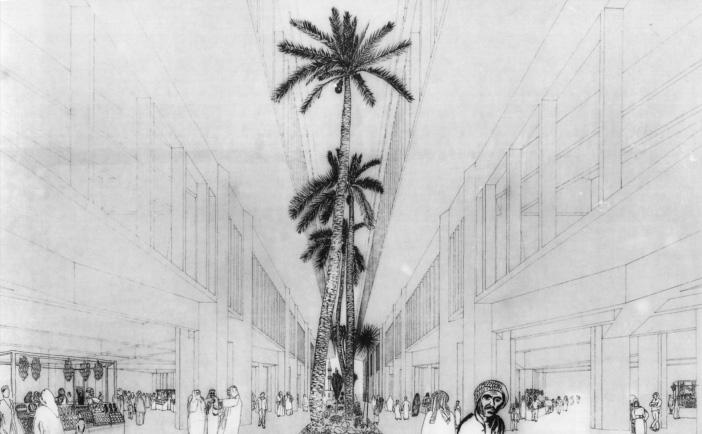
Placing the stem along the periphery, rather than the center of the cells, also allowed the stem to grow or change with greater ease over time. The Fold House ideogram, presented in 1954 as an infill to the fabric of an existing city, connected dwelling units by a straight ‘stem’ that could grow, shrink or change in response to needs over time (Figure 4). The stem is also the basic structuring device in the Close Houses of 1955, where multiple parallel stems start forming a network of covered passages that link various dwelling types and activities in a loosly defined grid (Figure 6). The nucleus of the project, in each case, is a stem, rather than a ‘hearth’.
From Stem to Mat
Eventually the concept of autonomous stems gave way to a two-dimensional network of stems and cells – a mat. Through its organizing network of circulation routes and support systems, the mat provides even greater flexibility for unifying diverse clusters of activity in multiple directions. It can grow along any of its stems in two dimensions, while stimultaneously maintaning a coherent and systematic interconnected order.
Mat-buildings were strongly influenced by the dense historical tissue of traditional cities. In parallel to their design work, the members of Team 10 studied the spatial structure and functional layout of traditional Islamic cities. As George Candilis pointed out, “in Morocco with Shadrach Woods, we began to work on an idea of a special conception to create place. Certainly the special concept was influenced by the Souks of Marrakech. These had two phenomena: two which always existed; spontaneity and diversity; with the ‘main street’ of the Souk as ‘the skeleton’” (Risselada and Heuvel, 2005). For Candilis and Woods, the mat typology became the vehicle for generating the spatial and functional density of the traditional city. Aldo van Eyck described Woods’ and Candilis’ inspiration of the Arab city as follows: “Shadrach Woods and George Candilis, in a different way since they are so different, both tended to project their
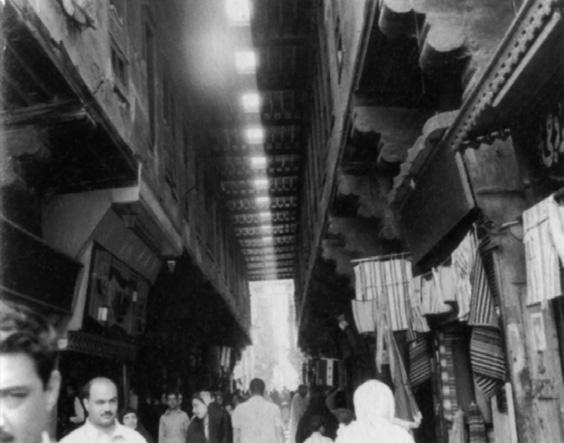
78
Projections
Figure 7. Interior of bazaar in Kuwait City and perspective of a gallery, 1968-72, Source : Smithson and Smithson, 2005.
experience – one in Morocco and one in Far East – into the souk and into the bazaar: they believed in the bazaar, in the souk and in the stem... We just used that one word ‘casbah’ as an image, as a poetic image. We were referring to any kaleidoscopic society where all the functions are more or less mixed, and always said the ‘casbah’ was the final limit. We don’t have to literally make a casbah, imitating a period of human history when things were mixed and closed knit, but we need to be a little more ‘casbahistic’, by putting things together: and letting things penetrate into each other again. That is what we meant by casbah.” (Tuscano, 2005)
The Smithsons too were fascinated by the traditional Arabic casbah, its rich texture, “full of starts and stops and shadow… with a high degree of connectedness to allow for change of mind and the in-roads of time” (Smithson, 1974) (Figure 7). Building on the spatial qualities of the ‘casbah’, mat buildings became condensed into continuous structures of interlinked stems. The Smithsons even had an opportunity to propose mat structures in an arabic context as part of their 1968-72 Kuwait Urban Study (Figure 8)2
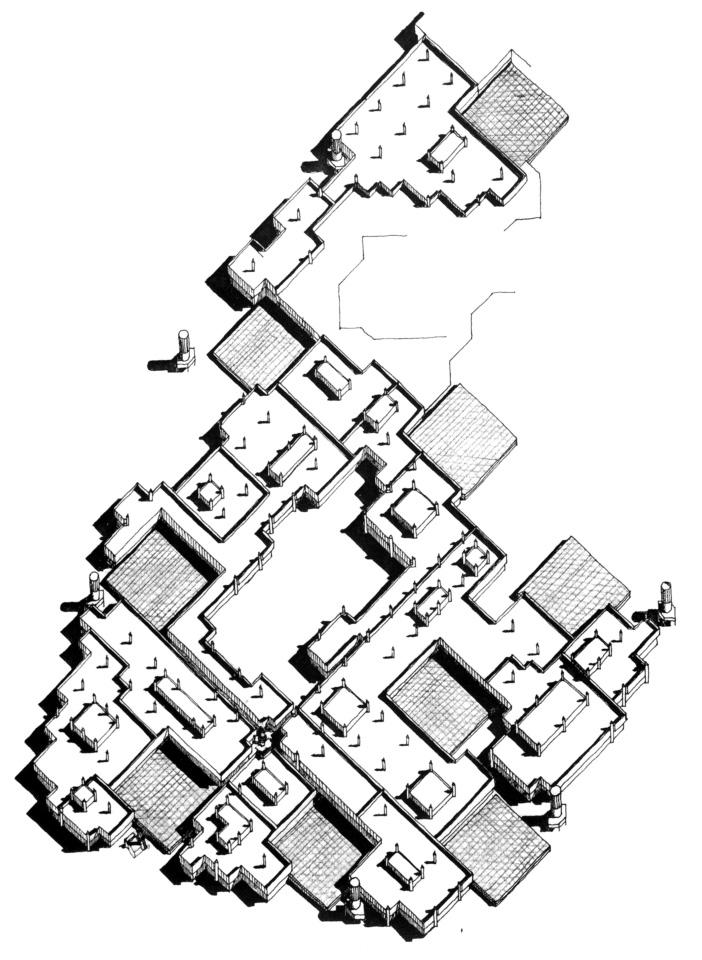
The mat’s structuring concept of mobility and connectivity was developed in collaboration between the Smithsons and Peter Sigmond in their competition entry for Hauptstadt Berlin (1958). Through its particular focus on urbanity and mobility, the project emphasizes the inseparable relationship between an individual and the city, between the part and the whole. The project illustrates the Smithsons’ ideas about mobility networks in post-war cities; instead of divisions, which characterize CIAM’s previous concepts of functional cities, the Smithson’s suggest that new forms of mobility demand physical patterns of connectivity. According to the Smithson’s, “the urban forms of Berlin Hauptstadt have as their basis the idea of mobility, of absolute maximum mobility, achieved by a layered movement pattern that separates the various means of expression and gives to each its own geometry, its own formal expression.” (Smithson and Smithson, 2005) The mat’s indefinite circulation network is the project’s generator.
The proposed pattern can flexibly accommodate growth and changes in use over
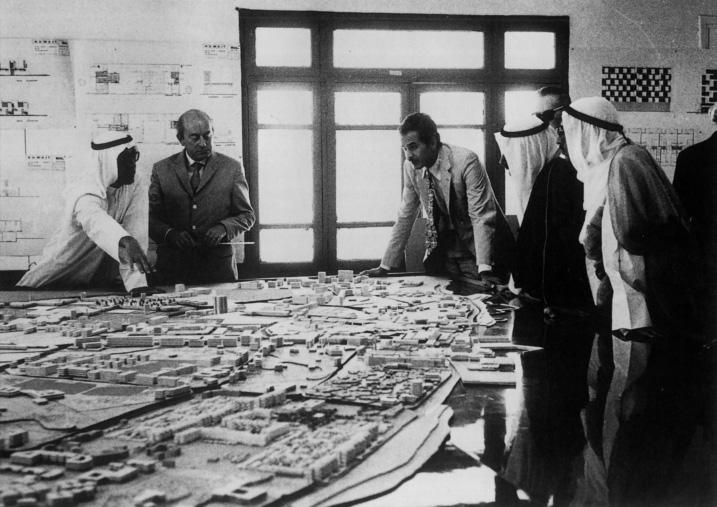
79 Ferrer Forés
Figure 8. Peter Smithson presents the model of the mat-building to the Crown Prince of Kuwait, Source : Smithson and Smithson, 2005.
time. The Smithson’s emphasized “the feeling for change, so that buildings, roads and services can develop freely according to their own laws without compromising the development as a whole” (Smithson and Smithson, 2005), which the two-dimensional circulation network of the mat generously provides. There are two interrelated
Figure 9. Competition for Berlin Haupstadt, 1958, Source : Smithson and Smithson, 2005.
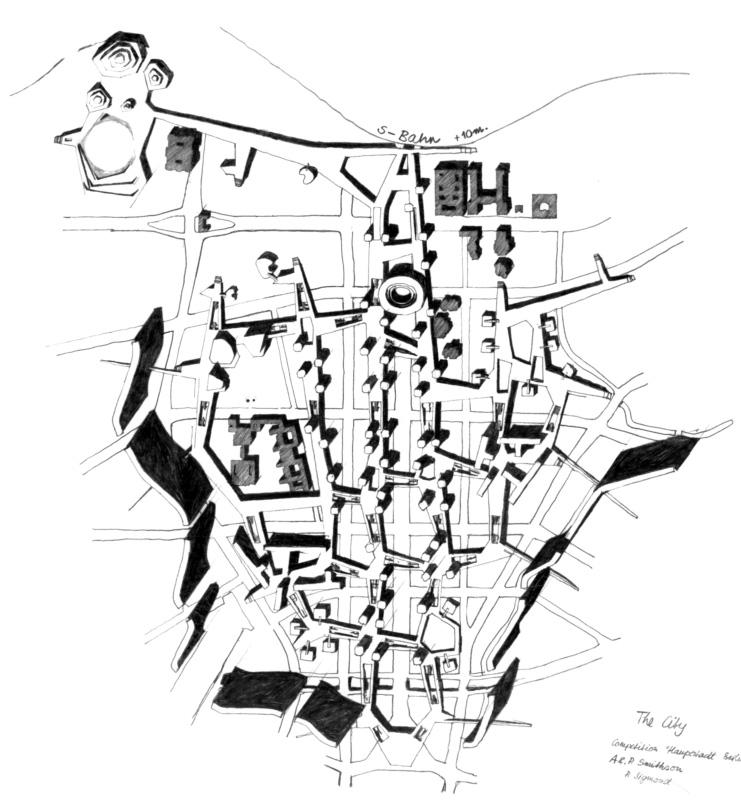
geometric systems of movement — the upper-level network for pedestrian paths and — platforms of vistas that integrate existing historical remnants of the city, and which are accessed by escalators over the street grid; and the lower-level fabric of vehicular streets (Figure 9). By overlaying movement systems, the Berlin Hauptstadt project jointly addresses the relationships between mobility, growth and change, producing an urban network that anticipated the mat concept. “Architecture and planning”, argued Woods, “which are each part of the other, are concerned with the organization of places and ways for the carrying out of man’s activities. The architectural process begins with a way of thinking about organization in a given place-time, then establishes a system of relationships and, finally, achieves plastic expression.” (Woods, 1962)
In Candilis-Josic-Woods’ competition entry for the reconstruction of FrankfurtRömerberg centre (1963), an area that was destroyed in the Second World War, the spatial organization also takes the form of a multi-level grid of pedestrian walkways that link public activities at the lower level with the private dwellings on the upper levels (Figure 2). The project brief asked for the reconstruction of a historical city centre in a ruined area between the city hall and the cathedral. For Candilis-Josic-Woods, structuring of new urban development in a historical urban tissue called for new spatial practices: “Such diversity of activities needs to be housed, that if all of these had to be considered separately, the result would be chaos. These diverse elements must be made into a whole, a single organism.” Using a mat typology enabled the partners “to organize the multitude of activities called for in the program, into a clear, comprehensible, adaptable order.” (Candilis, Josic and Woods, 1964)
80 Projections
The Frankfurt mat was not only meant to accommodate growth and change within its limits, but to also adapt to its surrounding context. Despite the apparent complexity of its grid, the scheme demonstrates that the scale, grain and traces of the surrounding urban fabric are reinterpreted on the ground level of the project as an attempt to harmonize the project and the neighboring urban tissue. The circulation grid of the mat corresponds to the existing network of pedestrian walkways on the site. Relationships with context are further intensified by the sequence of interrelated open spaces, courts and patios that permeate the entire project.
The structuring concept of the mat was developed further in Candilis - Josic - Woods’ design for the Free University in Berlin (1963). The project was handled as a ‘city in miniature’ that is structured around an orthogonal double-level pedestrian grid, with most public functions located on the ground floor (Figure 3). The scheme proposed a series of wider pathways, stems, which serve the most active areas of the building, with a secondary system of perpendicular pathways serving the less trafficked areas of the building. The resulting ‘groundscraper’ organization ensures abundant opportunities for communication and exchange between various parts of the mat without sacrificing their autonomy. Ample pedestrian pathways, ramps and escalators connect clusters of rooms into a two-layer mat that extends over the entire project site. The juxtaposition of platforms, open spaces and covered pathways generates a continuous and spatially diverse structure. Alison Smithson later recounted that: “the Berlin Free University makes mat-architecture recognizable” (Smithson, 1974). She defined the term “mat-building” as a structure whose order is based on three parameters: interconnectivity; relational patterns; and opportunities for growth, decline and change (Ibid).
Discussion
By exposing the evolution of mat structures in the work of Team 10, this paper has tried to outline advantages of mat configurations that may offer renewed interest for contemporary architecture and urbanism. The mat concept is a critique of both the functional separation of urban land uses in post-war Europe and the widespread adoption of high-rise buildings during the same period. It was a reaction, common to many Team 10 contributors, against the orthodox zoning of cities into discrete functional areas, advocating that urbanism be more than merely an organization of buildings and activities into coherent zones with limited connectivity. Rather than giving it definitive form, the mat is a planning instrument that allows the urban environment to be mixed and structured over time (Avermaete, 2005). As an effort to escape from earlier CIAM dogmas, the mat typology signaled an emerging awareness of the complexity and richness of the urban fabric, evident in historic vernacular environments, but lacking from mainstream Modernism.
The mat typology also offers a flexible framework for relating to a site through
81 Ferrer Forés
an uninterrupted continuation of the urban fabric into its own spatial network. The network of pathways, courtyards and platforms allow the neighboring urban or natural fabric to flow seamlessly through the project. Mat-buildings thus establish a system of relationships, present and potential, between the built and the natural. The spaces of transition and connection offer ‘poetry of movement’ and a ‘sense of connectivity’. The very essence of mats is urban: architecture made of relationships rather than form.
Future Research
Mat-typologies have been realized in large-scale institutions, such as the Free University and Massachusetts Institute of Technology, as well as in housing projects, such as the Agricultural City by Kisho Kurokawa (1960). The typology has been recently re-introduced in Foster and Partners’ plan for the Masdar City in Abu Dhabi (20072023) as a structural blueprint for sustainable development3. The typology has thus been mainly applied in singular institutional projects, and it remains unclear whether mats could be equally suited to more decentralized forms of development that are shaped by multiple owners over time. The case of Masdar City, which will need to transcend multiple institutions, might provide a partial answer to this question. Yet, it is also unclear whether mat-structures are bound to remain unique and rare for largescale development, or whether their benefits can attract larger interest and adoption in dispersed, small-scale developments in rapidly urbanizing cities. Due to a number of challenges, mat buildings have not yet entered mainstream urban design practice. The need for costly up-front infrastructure investment compared to conventional patterns of development, and the procedural difficulties involved in separating the permanent infrastructure from the more flexible and adaptable parts, have so far limited the widespread adoption of mat structures. More research is required to understand and desirably overcome these challenges.
ENDNOTES
[1] The Kasbah is a dense historic urban development typology encountered in many Islamic cities.
[2] Four international architecture teams were invited by the Emir of Kuwait in 1968 to participate in the Kuwait Urban Study. Besides the Smithsons, participants included Candilis-Josic-Woods; Reima Pietilä; and BBPR. Jørn Utzon, whose proposal won first prize in a restricted competition for Kuwait National Assembly, also proposed a growing mat structure. For Jørn Utzon “traditional Arab architecture will have an enormous influence on the future architectural development of the world and it is, therefore, a natural thing that the concept of the Kuwait National Assembly complex has been based on some of the major elements of traditional Arab architecture, such as the covered street -the bazaar street- the interior courtyard, the succession of structural arches” (Ferrer Forés, 2006).
[3] Though no provisions for long-term growth and change have been outlined in Fosters & Partner’s project.
82 Projections
WORKS CITED
Allen, S. (2001). Mat Urbanism: The Thick 2-D, in Sarkis, S., Allard, P. and Hyde, T. (eds) Case: Le Corbusier’s Venice Hospital and the Mat Building Revival. New York: Prestel.
Avermaete, T. (2005). Another Modern. The Post-war architecture and urbanism of Candilis-JosicWoods, Rotterdam: NAi Publishers
Candilis, G., Josic, A. and Woods, S. (1964). ‘Reserches d’Architecture’, L’Architecture d’Aujourd’hui, no. 115.
Candilis, G., Josic, A. and Woods, S. (1964). ‘Berlin Free University’, Le Carré Bleu, no. 1.
Ferrer Forés, J.J. (2006). Jørn Utzon. Obras y proyectos. Works and projects. Barcelona: Gustavo Gili.
Joedicke, J. (1968). Candilis-Josic-Woods, a decade of architecture and urban design (Stuttgart, 1968). The office was responsible for the structure of the book and the description of the project.
Risselada M. and Heuvel D. (ed.). (2005). Team 10: 1953-81: in search of a utopia of the present, Rotterdam: NAI Publishers.
Sarkis, H. (2001). Introduction, in Sarkis, S., Allard, P. and Hyde, T. (eds) Case: Le Corbusier’s Venice Hospital and the Mat Building Revival. New York: Prestel.
Smithson, A. (1974). ‘How to Recognize and read Mat-Building. Mainstream architecture as it developed towards mat-building’, Architectural Design, no. 9.
Smithson, A. and Smithson, P. (2005). The charged void: Urbanism. New York: The Monacelli Press.
Tuscano, C. (2005). The underlying reasons. Interview with Giancarlo de Carlo, Ralph Erskine and Aldo van Eyck in Risselada M. and Heuvel D. (ed.) (2005). Team 10: 1953-81: in search of a utopia of the present, Rotterdam: NAI Publishers.
Tuscano, C. (2005). Everybody has his own story. Interview with Aldo van Eyck in Risselada M. and Heuvel D. (ed.) (2005). Team 10: 1953-81: in search of a utopia of the present, Rotterdam: NAI Publishers.
Woods, S. (1962). ‘The Web’, Le Carré Bleu, no. 3
83 Ferrer Forés
!"#$%&'(#)*
THE OBJECTIFICATION OF INFRASTRUCTURE: ELEMENTS OF A DIFFERENT SPACE AND AESTHETIC FOR SUBURBAN AMERICA
ALEXANDER D’HOOGHE Massachusetts Institute of Technology
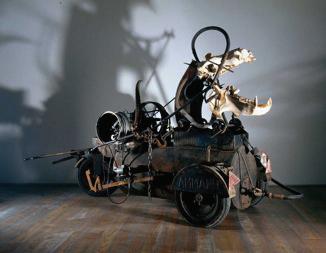
ABSTRACT
One can look at infrastructures of mobility as a system, or one can look at it as a series of artifacts. This paper argues that rather than a system of transportation planning and engineering, we may read infrastructures as objects of cultural production with a spatial content not unlike that of architecture or sculpture. Obvious as this statement may seem, it has far-reaching consequences on our own conventions and aesthetics in urban design. The reduction of infrastructures of mobility to a transportation system, blurring its recognition as a cultural stage (artifact + space) in its own right, may be to blame for the current disillusion Americans have with their suburbs, because this reduction depleted these suburbs of a consciousness of what they have in common: these bulky objects called roads.
85 D Hooghe
Hippopotamus Tinguely. Source: The Tinguely Museum, Switzerland.
Introduction
“the road … also exists as a static, bulky object in the landscape, a substantial piece of the urban scene for those who live along its borders.. it is a problem that we will not consider here.”
– Kevin Lynch and Donald Appleyard in “A View From the Road”.1
This article claims an intellectual space for the road in its ‘static, bulky objecthood. In doing so it aims to complement Kevin Lynch’s analysis of the modern road. It speculates about infrastructures of mobility as cultural artifacts rather than technocratic systems. In doing so it argues not only with the world of transportation planning / engineering, but also with a powerful tradition internal to urban design and social studies. Territorial design of infrastructure should abandon its instincts towards the systematic (or the anonymous, absolute, dehumanized, totalizing), and replace it with the cultural (authored, finite, crafted, subjectively positional).
Not Systems but Objects?
The last hundred years of English and American urban planning literature describes roads and other infrastructures of mobility primarily as systems of distribution (‘transportation’), or of cinematographic sequences of views of the surrounding picturesque country (‘highway as parkway’). Both attitudes make the material presence of the road itself subservient to its bigger purpose as conductor of flows of goods and people.
Against this reductive interpretation exists another, which reads infrastructure not as a system but as an object, not as a logic but as an artifact, not as a tube but as a space. From this point of view, infrastructures of mobility are prime candidates for becoming public spaces, or, better yet, public forms that are true and proper to the exigencies and demands of a modern urban society. Such an approach would privilege infrastructure by imposing on it all the demands that culture and the arts usually reserve for themselves but rarely apply to the technocracy that structures the very society in which they operate.
A Short Archeology of Infrastructural Thinking
The ‘systems turn’ in infrastructural thinking occurred about 100 years ago, when the American Planning Association turned from a City Beautiful attitude to a more functionalist approach of the city as a system. City Beautiful architects had aimed to restructure and grow the American city with architecture, monuments, and public
86 Projections
spaces. Increasingly inadequate to the demands of speed, flow control and scale increases, this approach was abandoned in favor of a more systematic approach through a tool called ‘the comprehensive plan’. To this corresponded a shift in the design of roads from one where architects and artists were often involved, to one dominated by engineers and policy maker — the field of culture was purged from what was to become suburbia’s main public realm: the roadway surrounded by green buffer zones. Planning’s technocratic turn coincided with widespread suburbanization, effectively bereaving the new field of a modern civic idiom uniquely adapted to its own spatial structure. Suburban roadway design, as emerged in the new roadway typology of the ‘parkway’, never developed an aesthetic consciousness about itself: “As urban sprawl, industrial development, and rising traffic began to diminish the appeal of suburban pleasure driving, however, it became necessary to create artificial landscapes to simulate the appeal of traditional vernacular roadways”. 2 As a result the exodus from the city avoided the development of a conscious presence. However, this self-denial could only last for a while.
By the 1950s, after decades of ‘marked suburbanization’3 and against the technocratic sterility of the expanding universe of post-war suburban roadways, a series of new approaches attempted to reconcile infrastructure as a distribution system with infrastructure as a humanist conception. We can distinguish three attempts at such reconciliation.
Architecture as an Infrastructural System
In 1962, Team X argued for a closer relationship between modern infrastructure and Modernist building.4 After focusing on the problem of the greater number and the associated questions of identity, change and growth, they saw a need for a designer’s conception of infrastructure. Van Eyck brought the ‘Noah’s Ark’ plan by his favorite student Piet Blom to the group’s 1962 meeting in Royaumont and explained it in terms of a ‘tree-leaf’ diagram. Van Eyck tried to demonstrate the inseparable reciprocity between the house and the city, a reciprocity he saw expressed in an exemplary and poetic fashion in Blom’s design. His presentation drew a vigorous dismissal, particularly from the British members of the Team X group. Though Blom’s plan might operate as ‘identifying structure’, Bakema later observed, it gave insufficient expression to the idea of ‘freedom of choice’.
Arguably, Blom’s proposal was to produce a total infrastructure, subsuming and exploding the objects of architecture within an infrastructural system. In fact, we could argue that he first naturalized infrastructure as a ‘new nature’, and then proceeded to integrate and dissolve architecture within this new totality. In other words, he naturalized the ‘new’ qualities of infrastructure as a technocratic, anonymous and total system by endowing it with organic terms such as ‘the stem’ (Candilis, Josic and Woods), by drawing it as an expanding system with roots and branches, and transfer
87 D Hooghe
that total system to architecture, injecting as it were the old body of architecture with the modern properties of infrastructure. In doing so the objecthood of infrastructure, its authored subjectivity, its lack of homogeneity, its self-consciousness, and its lack of belonging were destroyed. This attempt towards systematization can be discovered in much of the work done at MIT in the 1960-70’s under the aegis of Habraken’s ‘structure-infill’ system. ‘Structure-infill’ was nothing else but a way to blow up architecture’s objecthood, reconstituting the building as a series of layers with different life-spans in which structure corresponded to the urban design concept of infrastructure – long lasting, invisible and total support platform of the building. By dissipating infrastructure in the total body of urban production, which itself had turned every act of urban production into a infrastructural extension, infrastructure became to the city what water is to the fish — total.
Infrastructure as the Scenography of the Territory
Kevin Lynch and Donald Appleyard’s “A View from the Road” (1964) constituted another contribution, almost setting the script for the design of the new city of Milton Keynes in 1968-1969. The planning and design team of this project, brought together by Richard Llewelyn-Davies and led by John de Monchaux, deliberately twisted and deformed the proposed grid of roadways in order to account for the topography of rolling hills, and the preservation of woods and ancient villages. Rather than a mathematical operation to optimize grading, the roadway design operates according to the principles expounded by Lynch and Appleyard, organizing shifting views into a cinematographic experience of the surrounding territory. Lynch and the team at Llewellyn-Davies knew each other, and John de Monchaux would join Lynch’s faculty group at MIT a decade later. Lynch and Appleyard, as well as the designers of Milton Keynes, were amongst the first to bring infrastructure into design culture. Their projects take on the logic of the suburban road in a more immediate way than ever before. Lynch and Appleyard speak about ‘aesthetics of the highway’, but in fact they restricted themselves to an aesthetic from the highway. They themselves are extremely clear about this:
“While the road makes a dynamic impression on the driver and his passengers, it also exists as a static, bulky object in the landscape, a substantial piece of the urban scene for those who live along its borders. This presents a two-faced problem, much as if a theatrical designer had to be concerned with the visual form of his backstage apparatus. However important, it is a problem that we will not consider here.” 5
In hindsight, the prioritization of the view from the road over that of the road is not a coincidence but a re-articulation of traditional landscape picturesque roadway design principles, proper to the English landscape tradition that were previously explored by Robert Moses’ 1920’s parkway designs around New York City. The road has become a system, and while Lynch acknowledges its importance as an object, he never got
88 Projections
to analyzing it as such. Who, then, attempted to objectify infrastructure during the systems era?
Early Attempts to Objectify Infrastructure
Louis Kahn’s work on bee-hives — enormous transfer stations functioning as highway exits, ramps and parking garages around Philadelphia — may serve as embryonic, poetic and naïve declarations of intention towards such an architecture.6 What happened after that?
A generation of designers, more or less overlapping with practice that Kenneth Frampton has deemed ‘critical regionalism’, have also attempted to contextualize, localize, and objectify Modernist infrastructure systems. These practitioners have included Manuel De Sola Morales, Joan Busquets, Marcel Smets, and others. The embryonic objectification of infrastructure by these authors resulted in the downplaying of the hegemony of transportation as the primary function for the object. Instead of traffic along lanes, they have looked for transversal connections within infrastructure objects. Instead of a zone of speed, they have looked for means to turn the infrastructure itself into a civic space, shifting the attention from designing for one particular flow to organizing and negotiating between multiple flows. This tradition has identified infrastructural design on a human scale as the primary target of architectural intelligence. Almost each of their projects has emphasized multi-modality, the capacity of infrastructure to welcome several different speeds and modes of occupation, as one of the primary strategies to make them a public realm.
Towards an American Approach for Suburban Infrastructure Objects
Unfortunately, the bulk of the Mediterranean Modernists’ work only targeted infrastructures in historical city centers. Both qua scale and qua complexity, this differs from the contemporary infrastructure challenges of American suburbs and peripheries. The vast brown fields, half-developed fragments of civilization and decaying environments that constitute the middle-ring suburbs of the American city – the Passaics, Patersons around New York or the Maldens, Medfords around Boston – may well form a field ready for the critical insertion of a series of infrastructural objects.8
That is because these middle ring suburbs have become a demonstration par excellence of the endgame of infrastructure resulting from a systematic obsession with transportation mobility. The ubiquity of transportation infrastructures in the middle ring, whether roads, highways parking lots, interstates or residual spaces between them, may demonstrate that automobile infrastructure as a means to increase mobility has realized itself maximally, exhausted itself, and thus lost its critical edge. Indeed, the very reason that the American middle suburb has lost its appeal may well
89 D Hooghe
be attributed to its strangling excess of access, spaghetti of often redundant and overdesigned roadways. The outcome of the gradual pavement of what was once meant to be green is nothing else but a vast tarmac. To consider, under such circumstances, systematic mobility as a critical project seems inadequate. Quite the opposite, the middle ring demonstrates how the generational task of urban designers and architects graduating in America today, will involve the radical re-conceptualization of infrastructure as a series of finite, concrete objects that are simultaneously places: in short, a series of discrete stages.
Suburban Stages
The fine, small scale of infrastructure interventions proposed by Mediterranean Modernists in Barcelona need to be re-scaled and re-considered for these terrains; their intelligence made more inclusive of the automobile logic and multi-modal exchange, yet kept as project of objects rather than of systems.
The objectification of infrastructure in American suburbs would celebrate and, with limited means, civilize and monumentalize moments in which the thin strands of civic life clot into moments of conscious coexistence – moments of publicness. This being-in-coexistence does not come about automatically, it needs to be actively worked at and created by re-wiring traffic flows, stops, intermissions and crossings and especially by colliding and designing their temporary co-existence in one single space. Such spaces, as singularities where different flows co-exist, form the public essence, yes the very raison d’ être of the project of the infrastructure objects.
In that sense, the project of infrastructure objectification will rely on the intertwining of two sets of knowledge and intelligence: (a) curating flows and (b)designing singular objects in which these collide. On the one hand, the curating and designing of flows implies our capacity to organize their re-wiring, their staging, their intersecting. This knowledge obviously needs to draw on the fields of transportation engineering and planning. However, rather than using insight into the hydraulics of human circulation in order to maximize one logic only (automobile use only, or pedestrianization only), we may use this knowledge in a more deviant manner towards the deliberate staging of frictions and forms of co-existence, which from a traffic management point of view may make no sense, but from a public interest point of view are imperative. In other words, the weaving together of disparate thin strands of movement and existence into actual moments of public existence.
On the other hand, the role of the architect becomes clear in objectifying this re-wired moment into a singular space which gives that moment a form, a presence, an elevation and a boundary:
Infrastructure, instead of continuous, breaks up into a sequence of finite mo-
90 Projections
ments or bubbles of experience, corresponding to particular spatial and formal configurations.
Infrastructure, instead of ubiquitous, would be deliberately absent in certain areas, thus restating a degree of wilderness, while simultaneously raising awareness and consciousness about its very existence.
Infrastructure of being about one-dimensional movement becomes about the resolution of conflict between opposing flows and modes.
Infrastructure, instead of articulating a smooth flow, would instead take advantage of the moments of friction and begin to articulate those into delineated public spaces.
Infrastructure endings and entry / exit points, rather than anomalies of a circulation system, would become the primary anchors of civic life.
Infrastructure as we understand it here would, within the confines of Marxist theory, actually be categorized as superstructure.
The Aesthetics of Infrastructure as a High Art Project
Finally, the cultural sphere of an American stage object is so radically different from that of a historical European city (such as Barcelona) that the aesthetics and formal consistency of the latter cannot simply be copied. But the current approach of socalled ‘beautification of infrastructures’ may not succeed either. For in aesthetics, kitsch means the representation of something as that which it is clearly not – e.g. a cigarette lighter in the form of a tiger cub. With ominous kitsch in mind, the ‘beautifying infrastructures’ constitutes a form of aesthetic betrayal, a populist cop-out against the underlying aesthetic problem of design in our time. All attempts at beautification of roadways (benches, flags, pavements, etc.) are kitsch. Avoiding kitsch is one of the ways to achieve an integrity that we usually associate with so-called ‘high design’. Against the populism of low expectations, I would argue that our last vestiges of public space deserve the highest and best of our efforts. Furthermore, the continuing abstract quality of the Modernist aesthetic is the best guarantee towards its value as a collective form – for everyone reads and reconstructs the open aesthetic of the abstract differently when lacking obvious semantic clues.
With the sensibility of kitsch in mind, a design that strives towards a non-kitsch integrity becomes a piece of labor to formalize artifacts in a manner that does not deny their own, perhaps ugly but nevertheless honest, functional nature. The infrastructural object is in this sense doomed to celebrate its own technocratic origins. However, the self-conscious approach of culture and art may well have to consist of
91 D Hooghe
simple and modest tweaks and shifts in the existing language of American infrastructure, albeit tweaks that turn functionality on its head. There exist precedents in recent art history. The art works of Marcel Duchamp, Vladimir Tatlin, but most importantly and more recently, Jean Tinguely and Panamarenko, illustrate an existing lineage of absurd machine art. Tinguely’s auto-destructive and de-humanized machine art of the early 1960ies uses parts of machines, re-assembles them differently, destroying the functionality of the machine, but opening up different and subtly anthropomorphic interpretations of the machine – all while maintaining its machine-ness and avoiding the violation of the kitsch principle. Already in 1954, Michel Carrouges theorized this approach in ‘Les Machines Celibataires’.9
To Tinguely’s use of machine parts could correspond our use of technocratic codes and forms in infrastructure design. Any design of a contemporary infrastructure object should begin and end with an acknowledgement of the object crafted. The high design of an infrastructure object would have to directly address its own subject matter as a coded piece of technocratic, anonymous production. As a collective form, technocracy – the apparatus of codes and laws as enshrined in vast libraries and endless pdf’s that have governed roadway construction – has effectively created a true collective form: a form without any clear authorship of its own, without a ‘subject’ at work. The road, in its current form, lacks self-consciousness. It is almost as natural to modern society as water is to fish. A critical design project will then consist of the creative appropriation of these codes, forms and the entire syntax of bureaucratic order, in order to re-invent and re-build them as authored systems with a human poetic element. Using the same technocratic elements that gave rise to the original form of the infrastructure system, but re-arranging them in a way that multiplies their functionalities and directions of potential use, will enable a consciousness of their existence as cultural objects. Doing this would reconstitute the technocratic formalism as a quintessentially theatrical stage upon which the big dramas of America’s suburban life could unfold.
ENDNOTES
[1] P.4, ‘the highway experience’ in Appleyard, Donald; Lynch, Kevin; and Myer, John R. The view from the road. (Cambridge, MIT Press 1964)
[2] Davis, Timothy, “A Pleasant Illusion of Unspoiled Countryside”: The American Parkway and the Problematics of an Institutionalized Vernacular (pp. 228-246). In ‘Constructing Image, Identity and Place.’ Perspectives in Vernacular Architecture, Vol.9, 2003.
[3] As Chauncy Harris called the 1920s and 1930s, in: pp.1-14 in: Harris, Chauncy D. in: The American Journal of Sociology, (Chicago, July 1943).
[4] Notes from the meeting at Royaumont (France, 1962). In: Heuvel, Dik Vanden. Team 10 Meetings. Retrieved June 14, 2010, from Team 10 Online: http://www.team10online.org/team10/meetings/1962-royaumont.htm#2
92 Projections
[5] P.4, ‘the highway experience’ in Appleyard, Donald; Lynch, Kevin; and Myer, John R. The view from the road. (Cambridge, MIT Press 1964)
[6] These images have been published widely. Kahn presented them also in 1959 : Louis Kahn, “Talk at the Conclusion of the Otterlo Congress,” in CIAM 59 in Otterlo, edited by Oscar Newman (ed). Text republished as: Twombly, Robert (ed.) EssentialTexts. (New York, London: W.W. Norton, c2003). Images republished as: Ronner, Heinz; and Jhaveri, Sharad. Louis I. Kahn: Complete Work, 1935-1974. (Birkhauser, 1987)
[7] Especially during Oriol Bohigas’ leadership of Barcelona’s planning and development. See also: Bohigas, Oriol. Ten points for an urban methodology. Pp. 91-97 in Marshall, Tim. Transforming Barcelona. (Routlege, 2004)
[8] See also: definition of ‘grey goo’ in: D’Hooghe, Alexander, et.al. Crisis? What Crisis?, Volume, nr. 9, November 2006.
[9] See also: Hulton, Pontus; and Gunnar, Carl (ed.). The Machine as seen at the end of the Mechanics Age. ( New York: Museum of Modern Art, 1968).
J. Fonce, [ Transl: Panamarenko. At closer inspection: a structural-iconographic approach.] Panamarenko. Bij Nadere Beschouwing: een structureel-iconografische benadering. Pp. 83-92 in: Van Damme, Claire (ed.). [Ten Ways of Drawing in Contemporary Art.] X manieren van tekeningen in Hedendaagse kunst. (Gent: Academia Press, 1997).
93 D Hooghe
!"#$%&'(#)*
A PUBLIC SERVICE ROLE FOR PLANNERS AND ARCHITECTS
SAM BASS WARNER Massachusetts Institute of Technology
ABSTRACT
The consequences of world economic development and global warming will force the suburbs of the United States to densify. If there is not an adequate design response to these pressures these residential settings will be destroyed by slide-in small apartments, packaged accessory buildings, and heedless remodeling. This article proposes the creation of state-funded design teams to fashion place-sensitive land, structure and street reconfigurations in cooperation with existing neighborhoods in order to preserve the green suburbs of America.
95 Warner
A Public Service Role for Planners and Architects
A major local planning challenge for the reworking of American suburbs now confronts planners and architects. The challenge grows from a series of global and national problems that together threaten today’s commonplace ways of life in the United States. Since the 1980s, global warming has proceeded unabated. Forests everywhere have been reduced, oceans trashed and acidified, and the northern ice is melting at an alarming rate. If the nations of the world continue to emit pollutants at their present rate, catastrophes will surely ensue. (McKibben, 2010)
This same polluting global economy also over-consumes existing natural resources of water, timber, grass, oil and natural gas and places excessive demands on wheat, corn and rice production. Consequently, the price of the basic materials of modern life will rise steeply and soon. The current economic depression can suppress these price rises for at most one more decade. (Schor, 2010)
Since the 1980s employment has grown more uncertain and three quarters of all American families have seen their incomes decline. Costs for housing, food, transportation and education have increased substantially. These sharply rising prices will place further stress on already burdened family budgets. The direction of the world’s economy and global warming thus press down upon the circumstances of American life. (Chan & Carbone, 2010)
To address this challenge properly, planners and architects will need to work in new ways to address the coming press for densification. The goal of such efforts must be to redesign and to rebuild existing single family suburbs to make residential environments that are more energy efficient, more convenient and less expensive for American families to occupy while at the same time providing new kinds of green amenities for the residents. Among other changes, block-by-block attention to alter streets, residential landscapes and efforts to design satisfactory accessory apartments and structures will be needed. Fortunately, the suburban segments of urban regions can be substantially improved to cut family costs by at least 5% per year.
Although thoughtful planners and architects have been calling for denser, more transit-friendly residential neighborhoods for years, little has been accomplished. There has been little or no progress in retrofitting existing single family suburbs. The failure to institute new ways, however, cannot be placed at planners’ and architects’ doors. Federal and state initiatives necessary for support of local suburban action have not been put in place. There are no extensive federal policies for public transportation: neither plans nor adequate funds. The states are penniless and their public transportation agencies operate at a loss. Oil, gas, automobile and highway interest groups prevent the reduction of carbon emissions. Metropolitan land owners and developers resist the laying down of urban growth limits, and few have considered a materials
96 Projections
policy that might reduce the nation’s demands for costly resources. Thus, global warming goes forward unchecked and steep price increases for the basic materials of the economy can be expected by 2020. (Stern, 2010)
The shock of these twin forces may in time breach the national political log-jam. But when this moment arrives, will change come to the suburbs in a way that will improve conditions there? Or will it come as a series of corporate building packages that will worsen suburban environments? In the past, building packages for remodeling have not respected the variety of circumstances and possibilities that prevail in existing suburbs.
Currently there are no institutions in place within our suburbs capable of carrying out a comprehensive planning, infrastructure and home rebuilding process of the magnitude the coming crisis will demand. Planning is separated from architecture, and property law and finance treat existing lots as isolated entities rather than interdependent parcels. Homeowners, themselves, also treat their property as an independent entity. They do not generally behave in a cooperative manner with their neighbors in order to maximize the possibilities of their holdings. Of course, local planning boards could instantly alter zoning regulations to authorize two families to occupy an existing single family lot. Such a change, however, demands a revolution in the outlook of suburban residents. The culture of a single family house and lot is deep and long established. To affect change requires a patient approach. The immediate response to such a change would be cries of, “I paid my hard-earned money to live in a single family neighborhood and the proposed change to two families will ruin my investment in my house.”
With these issues in mind, I would like propose here a process for the purpose of opening a discussion of how planners and architects might meet the densification challenge. In putting forth this proposal, I am guided by my experience as a member of a planning board in a suburban town and by evidence from an excellent review of accessory unit policies in metropolitan Boston. (Stege, 2009)
My planning board experience tells me that suburban towns contain a wide range of quality in building design, a range that extends from simply awful to handsome. Recently, stock plans and manufactured housing have been replacing the work of private architects. Surely a few packaged designs for accessory apartments and structures cannot adequately serve such variety. Landscape architecture, for its part, is divorced from town design of streets, infrastructure and open spaces. Time-based fees drive services to towns by private planning firms. Such institutional patterns seem woefully inadequate to guide a shift in public beliefs and changes in residential arrangements.
The record of building accessory apartments and structures reveals further gaps between good intentions and action. Over 100 cities and towns in metropolitan Boston
97 Warner
have enacted accessory unit laws, but the laws have brought little response. Several reasons account for the want of action. Many homeowners lack sufficient credit to finance a remodeling or addition. Others need aid in obtaining good plans and passing through the many steps needed to advance from finance to building permit and construction. The most common and formidable obstacle, however, is the fear of alienating the neighbors.
This evidence leads me to believe that a successful densification process will require sustained education about alternatives to existing single family neighborhoods and a great deal of attention to the details of adding units. The program will necessarily be slow and detailed--a combination of needs that the fragmented planning and building institutions of the suburbs are ill-fitted to provide.
Therefore, I propose a state-financed planning and design process to follow on from federal-state programs for public transportation improvements. The location of enlarged public transportation services will indicate where in the suburbs densification can most usefully take place. The next step envisions that professional societies of planners, architects and landscape architects set forth panels of qualified members that cities and towns can chose from to form three-person teams for densification work. The team members must be state civil servants so that their work can be sustained over a number of years and so that they will be secure from real estate conflicts in particular places. The team’s task would be to work with town administrators and local landowners to transform the initiatives of private investment in accessory units into a town process of neighborhood betterment. The team’s process would begin with a succession of neighborhood or block meetings designed to stretch over several years. The goal would be to move from education of neighbors to bit-by-bit densification joined to municipal improvements that could add the benefits of a green neighborhood to the new efficiencies of transportation and housing additions.
A likely scenario would anticipate that team members move in two directions at once: toward town officials and toward the neighborhoods. Review of design alternatives for the improvement of existing streets and streetscapes with town authorities – especially the engineering department, the department of public works and the planning board—is especially needed. Current efforts to create traffic calming and child-safe streets offer a variety of patterns for greening existing neighborhoods by narrowing streets and altering their configuration. Cities and towns when they participate in densification can recapture the costs of their improvements in increased residential and retail land assessments.
Should a block or neighborhood request such changes, these new patterns could compensate for some of the yard loss caused by residential densification. (Southworth & Ben-Joseph, 2003; Kaplan, Kaplan et al., 1998)
The approach to neighborhoods or blocks might best be a voluntary process. For ex-
98 Projections
ample, if four landowners requested meetings with the team the consultation process could begin. A discussion of the values of residents would constitute the essential starting subject of the meetings. What do people like about their surroundings and how do they use the block or neighborhood? How do the children use the spaces? What are the shortcomings? Problems? The values embedded in these issues make up the foundation upon which the team’s later design suggestions can build so that these value discussions should not be rushed.
After a series of such meetings the team might begin to offer suggestions for alternatives that would add housing units here and there and also improve the neighborhood. Suggestions would be made for adding an apartment to an existing home, for accessory structures – either a remodeled garage or a new building--and for alternatives to improve yards and the street. In the end what is being sought is a vote among the majority of homeowners (not unanimity) to support such improvements and a willingness to support one or more neighbors who undertake to add a unit to their property.
Of course, discussions can break down and a majority not materialize, but if several blocks or neighborhoods are in play it seems likely that the momentum for change will build after a few demonstrations. After all, added units bring rents to their owners and the public improvements make a pleasant green setting. Single family homeowners have much to gain, but their values must be respected if their fears of property loss are to be overcome.
The team members also stand to reap substantial rewards for their patience and skills. They have secure employment in a public service role that allows them to design freshly and at the highest standards for each particular house, lot and street. In addition to having a sustained opportunity to practice, they will reap a long run satisfaction from reworking whole towns into greener settings and more convenient and efficient ways of life than are now possible.
WORKS CITED
McKibben, B., 2010, Earth, making life in a tough new planet, New York: Henry Holt.
Schor, J., B., 2010, Plenitude, the New Economics of True Wealth, New York: Penguin Press, Ch. II.
Cahn, N. and Carbone, J., 2010, Red Families v. Blue Families, New York: Oxford University Press, 3, 39.
Stern, N., “Climate Earth,” New York Review of Books (June 14, 2010, p.37).
Stege, E., H., 2009, What’s Next for Accessory Dwellings, Cambridge: Massachusetts Institute of Technology, Master’s Thesis in City Planning.
99 Warner
Southworth, M. and Ben-Joseph, E., 2003, Streets and the Shaping of Towns & Cities,Washington, D.C.: Island Press, Ch. V
Kaplan, R., Kaplan, S., Ryan, R. L., 1998, With People in Mind, Washington, D.C. Island Press.
100 Projections
CONTINUITY AND CHANGE IN THE URBAN TRANSFORMATION OF OLD DISTRICTS –A CASE OF SHAM SHUI PO, HONG KONG
PUI LENG WOO / KA MAN HUI The Chinese University of Hong Kong
ABSTRACT
Urban structure not only represents the past but also conceals catalytic drivers for the growth of a city in the future. With massive redevelopment of old districts in many rapidly changing cities, the structure of old neighborhood fabrics is often ignored and destroyed. Uninformed by history, contemporary urban redevelopment often leads to the loss of a sense of place and displacement of communities. This paper examines continuity in the built environment by identifying and analyzing catalytic elements of historic transformation in the Sham Shui Po district of Hong Kong. It identifies tangible evidence of permanence as the basis of a generative urban development armature. It attempts to demonstrate that certain land features, buildings, and public spaces can act as generators of historic continuity and should therefore be preserved as guides for future development decisions.
101 Woo and Hui
Introduction
The question of permanence was poignantly revealed through the demolition of Hong Kong’s Lee Tung Street in December 2007. Known colloquially as the “Wedding Card Street”, Lee Tung Street was famous for its concentration of print shops. Laid out perpendicular to topographic contours, the street represented the first phase of Wan Chai District’s land reclamation of 1902. Rebuilt after the Second World War, the street consisted of typical nineteen-fifties four to six-storey reinforced concrete buildings of Hong Kong. Replacing these buildings will be a project of four high-rise towers with one thousand luxury residential units and a shopping mall around three conserved historical buildings.1
Behind the project is the Urban Renewal Authority (URA), a government statutory body responsible for site clearance and redevelopment in Hong Kong. Having spent HK$3.58 billion to prepare the land, the authority will receive ‘the best benefit’ of HK$6.2 billion from a consortium of two private developers selected for the site. It hopes that business will return to help recreate the “wedding city” theme in the redevelopment project.2
Before Lee Tung Street’s demolition, denizens of the city made pilgrimages to the site, photographers took countless pictures, and protestors held demonstrations. After the buildings were torn down, the gaping hole reminded people of a loss, but brought in sunlight and hope for desirable change, at least until the construction began. Most people have now resigned their hope for a transformed street. Widespread dissatisfaction with this and other urban renewal sites suggests that Hong Kong needs a better approach in transforming its old districts.
Located in the northern end of the Kowloon Peninsula, Sham Shui Po is another old district, and the poorest one in Hong Kong. (Hong Kong Census and Statistics Department, 2009) Sham Shui Po currently contains ten urban renewal projects, which call for the demolition of all existing buildings and the construction of high-rise mixeduse residential towers. How can a place like Sham Shui Po be renewed without losing its history, identity, and community?
We believe that a city is neither historic nor modern, but evolutionary. A city is made up of buildings, streets, and spaces that have been constructed, demolished, and rebuilt. Certain constructions have become reference points in the process of change. Some have acquired the status of historical monuments, others have evolved to become catalytic elements in the transformation of a city. This study illustrates a method for identifying and working with the elements that could inform the processes of change involved in urban renewal.
102 Projections
Theoretical Proposition
Traces of urban growth are visible in the physical discontinuities of numerous cities. New infrastructure interventions in old neighborhoods, segregated land-uses, highrise developments replacing traditional buildings and privatized public spaces are now ubiqutous in Chinese cities. Many parts of Beijing, Hong Kong, and Guangzhou are becoming generic and seemingly instantaneous, artificial, and disconnected from their histories. Occasional public outcry and targeted policies lead to a designation of selected buildings or districts for conservation. But general planning strategies that address continuous urban transformation are lacking. This paper seeks to examine the persistent question of how cities can be designed for growth and change without losing their sense of time and place.
A desirable image of a city is one that celebrates and enlarges the present while making connections with past and future. (Lynch, 1972) The architecture of a city includes not only the visible image of the present built environment, but also traces of its construction over time. Aesthetic continuity and strive for better living conditions are permanent characteristics of architecture, which remind us of the close relationship between the form and history of cities (Rossi, 1982). Planning and city design require wider recognition as critical links in the continuous evolution of cities. In other words, we need to look backward in order to project forward (Blau & Rupnik, 2007) .
At least two directions in the theory of city design have consciously addressed the sense of time and place in cities. The first of these – Urban morphology – is a systematic study of the evolution of urban form. By providing an analytical framework for understanding and monitoring change, it recognizes the need for continuity of some built-form, and argues for the management of change rather than preservation (Pendlebury 2009). It is possible, through a morphological study, to identity elements of the city, which via their nature, history, meaning, and design have endured time and become catalytic elements for surrounding historic development. Such elements are not only “pathological”, they can be “propelling.”3
Second, the practice of Town Planning, the roots of which go back to 19th century garden cities, offers a basis for greater community involvement in urban transformation. Despite the differences of scale, and complexity between contemporary cities and garden cities, the latter’s theoretical underpinning of civic art as an expression of community life still appears to hold (Unwin, 1909). Unwin’s emphasis of civic art as an outward expression of a community’s needs, rather than decoration, still seems applicable to rapidly growing modern communities whose needs and aspirations seek expression in the form of their habitat. In order to foster social cohesion and avoid alienation, the contemporary dense and diverse city requires greater community expression in the design of its streets, public buildings, and open spaces. By working with these relatively permanent elements, the contemporary city can reinforce its connections with the past, while satisfying its collective aspirations of the present.
103 Woo and Hui
Urban Renewal in Hong Kong
Numerous districts of Hong Kong, which were rebuilt to higher densities after the Second World War, have once again become targets of urban renewal. These districts are mainly comprised of low-rise buildings of varying conditions that support a large number of low-income families, elderly people, recent immigrants, and minority groups. These districts support the social, economic, and residential needs of working class communities that are emblematic of Hong Kong’s history. Yet, under the pretext “to create quality and vibrant urban living”4, the present redevelopment projects of the city appear to be displacing and eliminating these communities through eminent domain, demolition, and reconstruction.
The URA’s stated goals are “to provide better living environments and neighbourhoods”, “to sustain local characteristics”, and “to revitalize through enhancing and strengthening the socio-economic and environmental fabric for the benefit of our urban communities.”5 The rhetoric is widely contradicted by a massive replacement of buildings in targeted sites by large high-rise podium structures. Much of the “socioeconomic fabric” of old districts is made up of small businesses and street markets. Demolition of these buildings destroys the “environmental fabric” that supports their economic life and social potential. The replacement of this fabric with shopping malls and exclusive residential towers is, in fact, the opposite of sustaining “local characteristics”. With the current practice of redevelopment, the original “neighbourhoods” disappear.
There are currently ten urban renewal sites in the Sham Shui Po District. The sites contain mostly four to six-storey reinforced concrete structures built in the nineteenfifties. The ground floors of these structures typically contain shops with upper floors subdivided into tenements. The housing conditions vary from moderate to poor. The new projects are planned at Floor Area Ratios (FAR) of eight to nine – twice that of the existing buildings, typically producing more than two hundred thousand square metres of gross floor area per project. The result is the familiar Hong Kong podiumtower with forty to fifty-storeys of apartments on top of a three-storey podium shopping mall.6
Hong Kong is well known as a a city of skyscrapers and rapid change (Abbas, 1997). Real estate development has always shaped the political economy and culture of the city. However, with Hong Kong’s return to China in 1997, its people have come to view the city, its history and form, with a heightened sense of belonging. Authorities that forge drastic change are now met with increasing resistance from residents, activists, and academics. The public concern with the life and architecture of their city is encouraging and calls for new methodologies to understand growth and change in relation to a wider public aspiration for continuity between the city’s past, present and future.
104 Projections
Defining Permanence
We define two properties of permanence in city design. The first is the duration of physical infrastructure through time, its continuity and long-term existence. The second is the persistence of social processes – their durability and continued functioning. Permanence thus refers to the endurance of both physical objects and social activities from the past to the future. The opposite of permanence is temporary, mortal, and transient. Analogous definitions of permanence are known in other disciplines. In digital technology, for instance, permanence is a measure of the life of digital data storage. In psychology, object permanence describes the awareness of existing objects even when they are no longer visible during a stage of cognitive development. Permanence in the built environment implies continuity for both static objects and dynamic processes. “Persistence is revealed through monuments”, argued Aldo Rossi, “the physical signs of the past, as well as through the persistence of a city’s basic layout and plans… sometimes these artifacts persist virtually unchanged, endowed
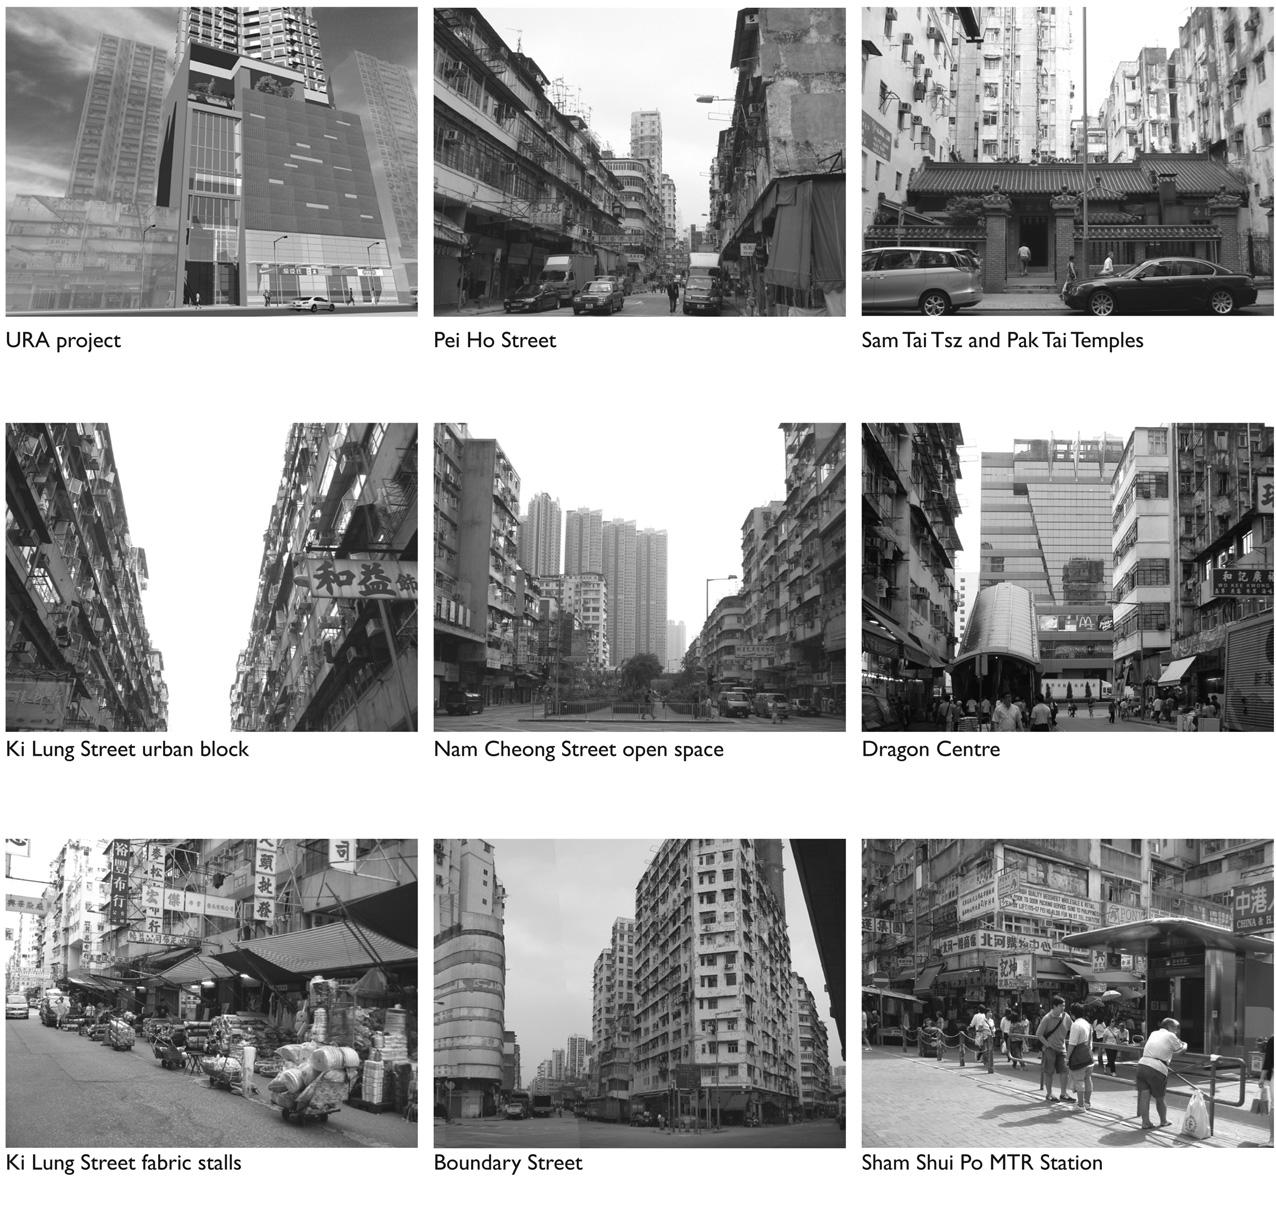
105 Woo and Hui
Figure 1. Images of Sham Shui Po.
with a continuous vitality; other times they exhaust themselves, and then only the permanence of their form, their physical sign, their locus remains”.7 Edmund Bacon argued, on the other hand, that “If the architect deals with movement systems…the chances of their survival, and indeed of their strengthening and extension over time, are very good indeed, even if the structures along them are torn down and rebuilt”.8
The Growth Of Sham Shui Po
The urbanization of the Kowloon Peninsula is clearly evident in the physical fabric of Sham Shui Po. Piers and reclamations, street layouts and speculative buildings, temples and markets, police stations and military camps, industrial buildings and public housing have transformed a number of villages on a jagged coast into a vast expanse of interconnected urban districts along Kowloon’s waterfront. The gridiron streets of Sham Shui Po are known today for their trade of electronic goods and clothing supplies. The area houses a community of working-class, low-income, and immigrant families in a variety of apartment buildings and public housing projects.
Sham Shui Po Village (1824-1898)
Prime areas of Hong Kong Island began to develop with the cession of Hong Kong Island to Britain in 1842. The district of Sham Shui Po, still a part of China on the fringe of Kowloon, initially remained rural. It was made up of a number of villages surrounded by a bay and mountain ranges. Separated by hills and water, the villages were linked by footpaths and waterways. Sham Shui Po, one of the villages with a strategic location near a coastal pier, became the center of the entire district. Sham Shui means deep water, Po refers to a bay with interlocking land and waterways (Cheng, 2007).
The original village, located at the intersection of present day Nam Cheong Street and Yee Kuk Street, no longer exists. It was a hamlet in the bay with a winding main street and several side streets. It contained dwellings, a market, two temples, shops, workshops, lime kilns, a custom house, and ten gambling houses (Smith, 1995). A boundary line (Boundary Street) south of Sham Shui Po marked the extent of Kowloon’s cession in 1860 from China to Britain (Figure 2). Located at the border of the two countries, Sham Shui Po attracted both legitimate and illicit business, and became known as a haven for criminals and smugglers (Smith, 1995).
Sham Shui Po New Town (1899-1944)
The leasing of the rest of Kowloon and the New Territories in 1898 for ninety-nine years was to have the greatest impact on Sham Shui Po. In order to grant new leases, the British Government drafted a new plan for Sham Shui Po in 1900. The
106 Projections
Figure
scheme was executed by private developers, mainly contractors, using land reclamation and building projects (Smith, 1995). Two streets, Nathan Road and Boundary Street, played a critical role for the layout of Sham Shui Po. Nathan Road was the first major road built in Kowloon, while Boundary Street was merely a line of high bamboo fences. The regulating line for the orthogonal layout of Sham Shui Po was set by bisecting the angle formed between Nathan Road and Boundary Street (Figure 2).
Another wave of development for Sham Shui Po was brought about by a fire in one of the villages (Apliu Village) in 1912. The resulting Sham Shui Po Improvement Scheme, which followed the fire, called for the removal of the village (Smith, 1995). Three hills were leveled and a nullah was built at Nam Cheong Street for drainage. The first stage of reclamation began in 1914. A gridiron of streets was laid out between Nam Cheong Street and Kweilin Street and building lots were sold to construct early two
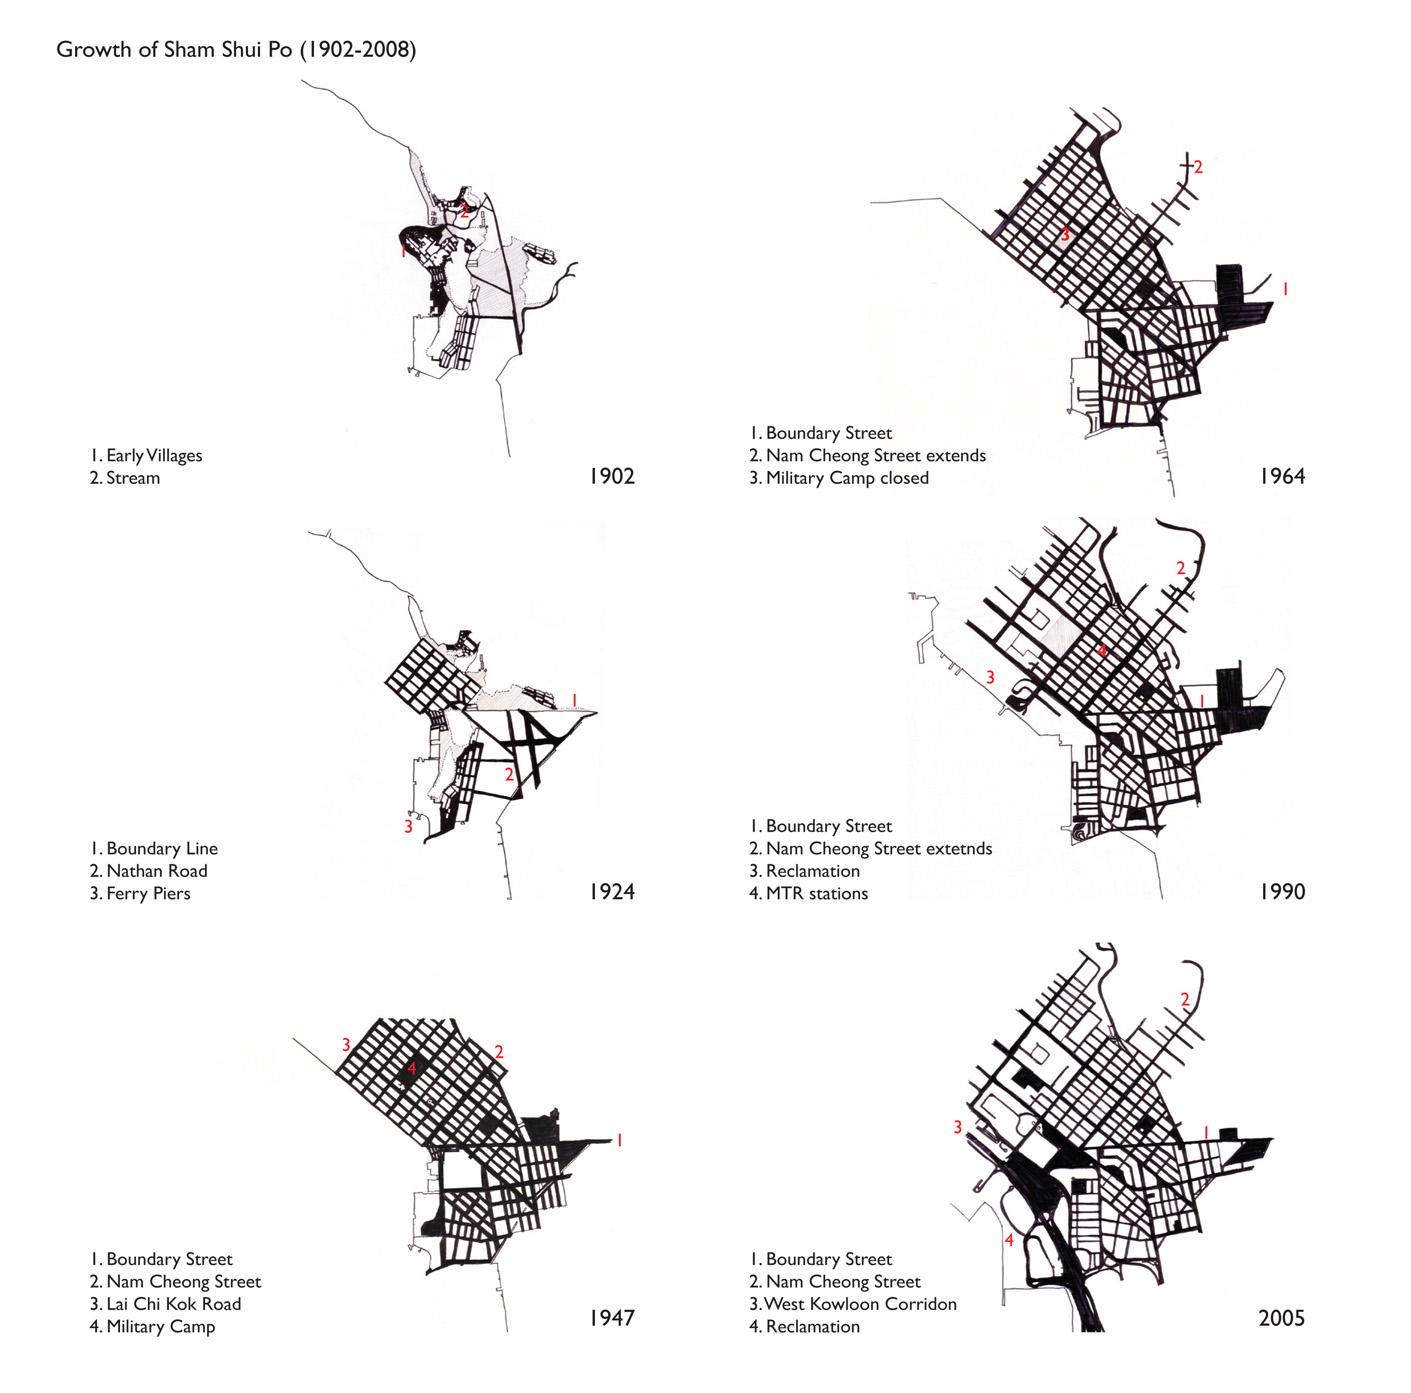
1 2 1 2 3 1 2 3 4 1 2 3 4 1 2 3 4 1 2 3
107 Woo and Hui
2. The growth of Sham Shui Po.
to four-storey Chinese residential tenements with shops on the ground floor.
The second stage of reclamation between Yen Chow Street and Tonkin Street began in 1919. The expanded layout and public amenities shifted the town centre northwest from the Boundary Street towards Pei Ho Street, where a new market was built in 1918 (Smith, 1995). A ferry service to Hong Kong Island was introduced in 1919 from the pier at Boundary Street, and relocated in 1924 to the Sham Shui Po Ferry Pier at the junction of Pei Ho Street and Tung Chau Street (Cheng, 2007).
Reclamation of Sham Shui Po was mostly complete by 1927 (Cheng, 2007). The area between Yen Chow Street and Tonkin Street was planned for public uses. The plan included a post office, a police station, a school and open spaces. A military camp was added with the increase of British troops in 1927 (Smith, 1995). The camp was later used for the internment of British prisoners of war during the Japanese occupation of Hong Kong between 1941-45 (Smith, 1995) (Figure 2).
Sham Shui Po District (1946-2008)
After the War, Sham Shui Po attracted a large number of refugees and immigrants, producing a rapid growth of squatter settlements on the hill slopes. A major fire in 1953 in nearby Shek Kip Mei launched the first public housing programme in Hong Kong. The military camp was closed in the late nineteen-seventies, and its land used for the additional construction of public housing estates (1981-1993) and the Dragon Centre shopping Mall (1994) (Figure 2). Large tracts of land were reclaimed in the nineteen-eighties for the construction of highways, a railway, housing developments, open spaces, and port facilities. The center of Sham Shui Po shifted inland towards a newly developed mass transit system. The waterfront attracted new large-scale developments. The once hamlet-by-the-deepwater-bay is located somewhere between the center and the bay.
Exploring the Permanence of Sham Shui Po
The following presents an attempt to outline spatial elements of Sham Shui Po, whose continuity could establish a desirable armature for maintaining a sense of the area’s past while simultaneously guiding future growth and change. We attempt to reveal the permanence of Sham Shui Po through tangible elements that have guided its growth and change between 1902 and 2007 and tell the history of the neighborhood’s transformations today.
Natural landforms and villages of the nineteenth-century marked the beginning of Sham Shui Po. The early twentieth-century gridiron layout of streets and blocks formed the armature of its urban structure that continues till this day. Markets and
108 Projections
temples marked the economic and religious expressions of the local population, while a police station and a military camp revealed the control and power structure of the government. A ferry pier and subway stations situate the area in a metropolitan mobility network, while public open spaces reveal the character and condition of its diverse inhabitants. Following a Lynchian tradition, these elements can be represented as points, lines, and planes. Points refer to the area’s landmarks and nodes; lines to the paths and edges; and planes to the physical forms of districts (Lynch, 1960). A combination of these points, lines and planes suggests a spatio-temporal structure, which appears to have guided the historic urban evolution of the area.
Points
Mo Tai Temple [Figure 3, Index 1]
Built in 1899 on Hai Tan Street, the Mo Tai Temple is one of the oldest temples of Sham Shui Po. Having resisted the 1922 Sham Shui Po Improvement Scheme, it still stands at an oblique angle to the orthogonal layout of the district. In front of the temple, facing the bay, lay the first marketplace of Sham Shui Po Village in the ninetheen-century (Smith, 1995). The temple thus marks the only place in the district, where the original coastline of Sham Shui Po is revealed.
Sam Tai Tsz & Pak Tai Temples [Figure 3, Index 2]
First built in 1898, the Sam Tai Tsz Temple is another historic symbol in Sham Shui Po. It was rebuilt and relocated to its present location on Yu Chau Street as part of the 1915 Improvement Scheme, which combined the Sam Tai Tsz and Pak Tai Temples into a single complex (Smith, 1995). Villagers believed that Sam Tai Tsz (The Third Prince) helped dissipate the area’s plague outbreak of 1894 (Cheng, 2007). It is the only temple in Hong Kong devoted to Sam Tai Tsz and it keeps attracting numerous worshippers. The Pak Tai Temple was built in 1920 by fishermen to worship Pak Tai (God of the North). The complex has now been registered as a Grade II historic building by the Hong Kong Antiquities and Monuments Office (Figure 1).
Tin Hau Temple [Figure 3, Index 3]
Though there are over seventy temples dedicated to Tin Hau (Goddess of the Sea) in Hong Kong, the Tin Hau Temple on Yee Kuk Street can be traced to only one of two such temples in the Sham Shui Po Village in 1867. It was relocated from its original location and rebuilt in 1913 under the Improvement Scheme (Smith, 1995). Like many Tin Hau temples in Hong Kong, it has lost its connection to the sea and
109 Woo and Hui
currently faces a narrow sidewalk and a busy street. The temple is registered as a Grade III historic building.
Pei Ho Street Market [Figure 3, Index 4]
The markets of Sham Shui Po are the area’s centres of economic and social life. We have already noted the first market, which was an open area in front of the Mo Tai Temple. As part of the Improvement Scheme, a new market consisting of two elongated buildings with a space in-between was constructed in the centre of Sham Shui Po at Pei Ho Street. Enlarged in 1928, and spilling onto surrounding streets, it formed one of largest concentrations of retail activities in Kowloon (Smith, 1995). The market was reconstructed in 1995 into a multi-storey Municipal Services Complex with a gymnasium, a library, and various community services. Like many similar buildings in Hong Kong, the complex is massive and inward-looking, its blank walls look harsh
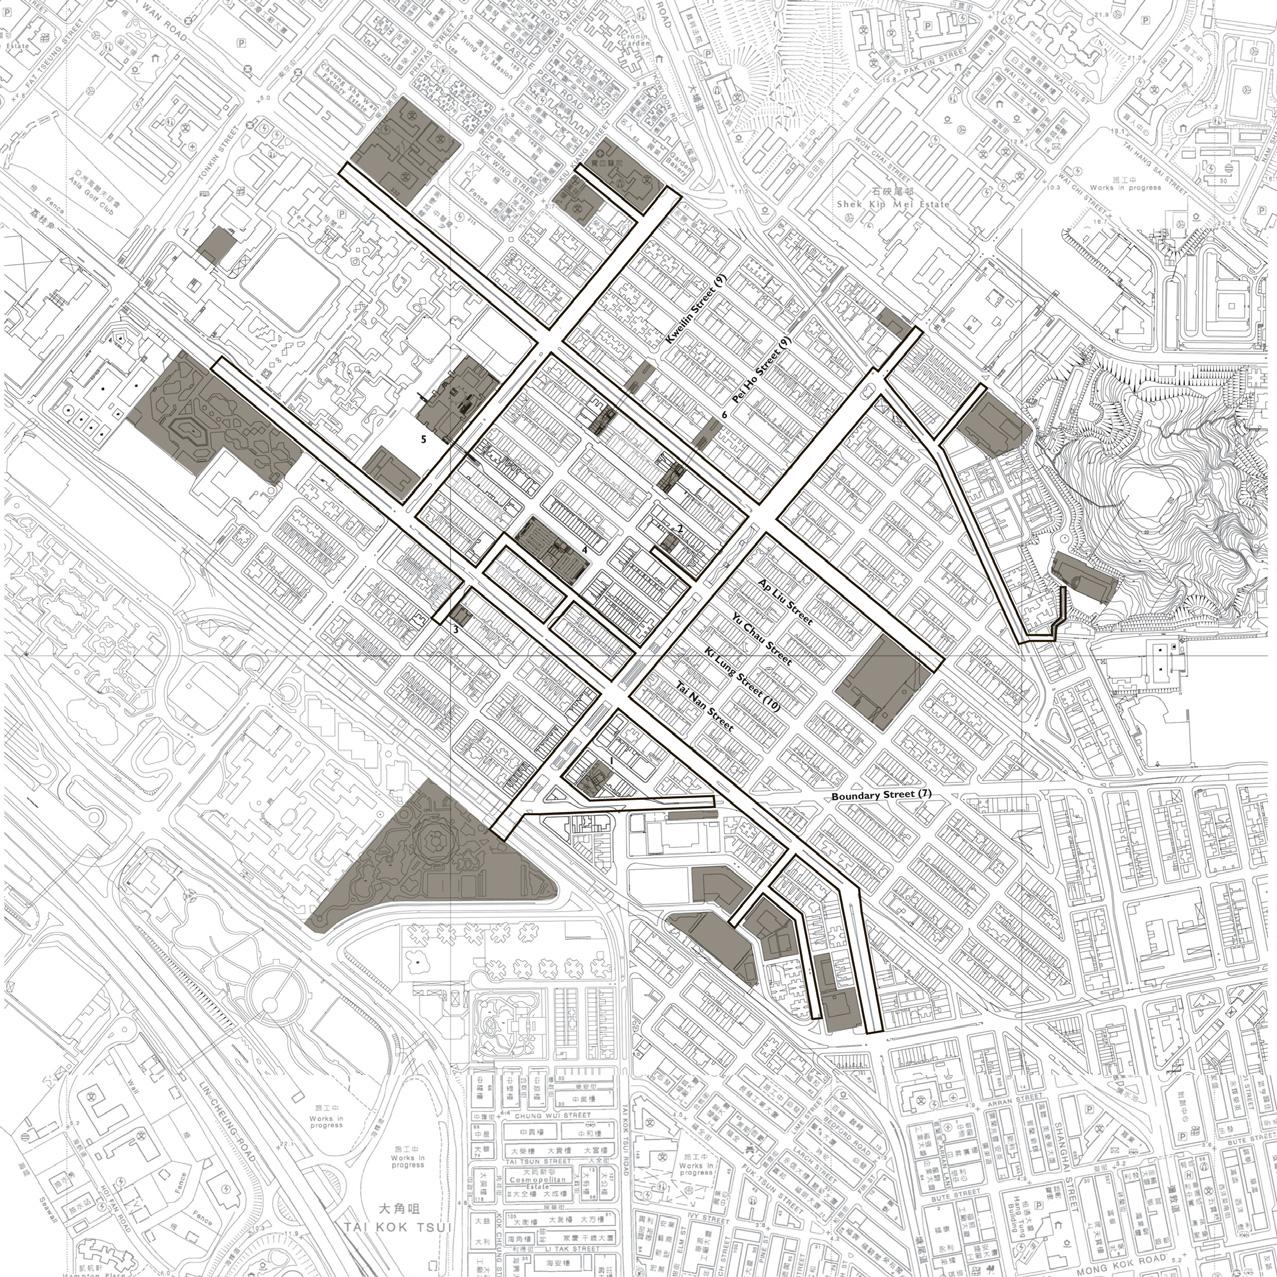
110 Projections NamCheongStreet CheungShaWanRoad YenChow Street 8 2 4 3 5 1 6 7 9 9 10
Figure 3. Map of Sham Shui Po showing imporatnt streets and landmarks.
and trite in comparison to the surrounding apartment buildings. Nonetheless, the complex provides vital community services and continues to generate vibrant street life in its vicinity (Figure 1).
Dragon Centre [Figure 3, Index 5]
Built in 1994 on the site of the old military camp, the Dragon Centre was the first shopping mall to bring large-scale air-conditioned retail activity to Sham Shui Po. Its corridors are lined with mini-stalls that evoke the feeling of a marketplace. An iceskating rink located on the top floor offers area’s working class people an opportunity try exotic winter sports. With two huge masts, a curved glass atrium, and a collage of architectural features, the Dragon Centre is bombastic and incoherent in appearance. Nevertheless, this shopping mall brings people in the community together, and ‘announces’ that Sham Shui Po can finally offer a contemporary Hong Kong experience (Figure 1).
Sham Shui Po MTR Station [Figure 3, Index 6]
Ferries used to provide a historically important mode of access to Sham Shui Po. However, the completion of the subway system in 1982 led to the closure of the ferry pier on Pei Ho Street in 1992. The Sham Shui Po Mass Transit Rail (MTR) Station has shifted and enlarged the centre of Sham Shui Po from the market towards Cheung Sha Wan Street (Figure 1). Next to the subway entrances are the famous Golden Computer Arcade and the Apliu Street electronic goods market.
Lines
Boundary Street [Figure 3, Index 7]
Initially developed as a bamboo fence that marked a political line on maps, Boundary Street captures a physical and emotional divide in Hong Kong’s history. It reminds people of the loss of sovereignty, the expansion of a colony, and eventually the unification of a country. It cuts into the orthogonal grid of Sham Shui Po, forming irregular streets and blocks. The experience of Boundary Street symbolizes fragmentation, disorientation, and ambiguity. It is a broken line that few like to recall, yet it is intricately bound to not only Sham Shui Po’s history, but also of Hong Kong’s (Figure 1).
111 Woo and Hui
Nam Cheong Street [Figure 3, Index 8]
Nam Cheong Street was one of several streets constructed to drain the area in 1912. The drain was covered over sometime in the nineteen-sixties. Squatter huts used to occupy the land in the middle of the street, which is now landscaped with pergolas in their place. Nam Cheong Street gives a feeling of openness and grandeur rarely seen in urban Hong Kong. More importantly, it serves as a reminder of the area’s coastal geography and the early urbanization of Sham Shui Po (Figure 1).
Pei Ho Street and Kweilin Street [Figure 3, Index 9]
These two parallel secondary streets that run from the hills to the coast share many similarities. Both were formed between 1915 and 1924 under the Improvement Scheme (Cheng, 2007). Between them is the Municipal Services Complex and both host three MTR entrances respectively. The streets also reveal the characteristics and disparities of three sub-districts. Northeast of Cheung Sha Wan Road, the center of electronic products, attracts a more prosperous and younger population. Between Cheung Sha Wan Road and Lai Chi Kok Road, the market of Apliu Street and the Municipal Services Complex mainly draw tourists and local residents. An area of dilapidated buildings between Lai Chi Kok Road and Tung Chau Street Park, is a gathering place for the elderly, peddlers, and the homeless (Figure 1).
Ki Lung Street [Figure 3, Index 10]
Perpendicular to Pei Ho and Kweilin Streets, Ki Lung Street cuts through the heart of Sham Shui Po. The street is composed of four sections. The first section, near Boundary Street, is relatively quiet. The second, between Boundary Street and Nam Cheong Street, is lined with many tiny stalls selling rolls of colourful fabric. The third section, between Nam Cheong Street and Kweilin Street, is marked by imposing urban blocks from the nineteen-fifties and sixties. On closer examination, these blocks express numerous signs of life through advertisement, curtains, laundry, and potted plants (Figure 1). The last section, between Kweilin Street and the Dragon Centre, attracts throngs of people to cheap goods, illegal trade, as well as shopping opportunities at the mall.
Planes
The streets of Hong Kong’s old districts are urban rooms. The rooms have clear spatial enclosures and fuzzy surfaces. Moveable and box-like stalls occupy the ground; balconies, laundry racks and planters extend from buildings; large overhead signs stretch into the void of streets. Seemingly unplanned, these colorful expressions of
112 Projections
habitation are actually supported by a regulatory structure of the city. The buildings of Hong Kong are shaped by regulations that maximize permissible density. Buildings constructed in a similar period thus generate an urban fabric that is coherent both in plan and in elevation.
A typical building in Sham Shui Po is five to nine-storeys high with a common staircase shared by two adjacent units on each floor. The elevation of the building is simple and contiguous, which due to the small width of the street is perceived more often as a street wall than a façade. Landlords have pierced the façade to widen their units by three to four foot enclosed extensions (Habraken, 1998). Though this practice is now prohibited with stringent building regulations, awnings, laundry racks, signage, and balcony enclosures are still permitted.
Apart from providing light and ventilation to the apartments, the wall plane of the street is also the surface of additions and alterations. Its functional nature stands in contrast to the sleek façades of the contemporary podium towers. The simple and malleable façades of apartment blocks produce planes of expression that register the imprints of habitation over time.
Discussion
An examination of Sham Shui Po’s transformation over the last several decades suggests that traditional elements of urban form have given way to more complex and elusive spaces, buildings, and technologies that often exceed the traditional focus of preservation strategies (Livesey, 2004). Outlining the morphologically structural elements of the site suggests that an armature of points, lines, and planes can be defined that could guide future development without compromising a holistic image of time and place in Sham Shui Po. Rather than ignoring the development generators of the past, present and future changes in the built fabric of a neighborhood could benefit from a better spatial, social and economic integration by following, rather than reversing, the course of decisions and customs that have withstood the test of time till now. By doing so, the area might achieve what Lynch has called a desirable image of the city – “The desirable image of a city is one that celebrates and enlarges the present while making connections with past and future”.9 Discrete points, as well as the armature of lines and planes outlined above are meant to stimulate debate on defining a generative structure that can guide the future growth and change of Sham Shui Po.
The historic analysis of the area suggests that such a structure has always been somewhat dynamic, expanding and shifting, with certain elements disappearing over time to give way to others, continusouly reflecting the aspirations of the area’s users at any given point in time (Figure 4). The list described above contains places and qualities, some of which date back to 1902, with others less than a decade old. These ele-
113 Woo and Hui
1947
ments should thus be taken as generative rather than constraining, inspiring rather than regulating, considered as part of an evolving whole that bridges the neighborhood’s past to its future. As in the course of an person’s lifespan, certain experiences are remembered and retained more vividly than others because they continue to offer guidance to daily life, so too should one carefully consieder the combination of these elements as collective experiences cristallized in the stones and habits of the neighborhood. A heightened awareness of their forms and histories could allow us to shape the present and future decisions of redevelopment without eradicating the historic wisdom embodied in the urban structure of a place.
1964
Conclusion
1990
Urban transformation creates opportunities for architecture and urbanism. Sham Shui Po was created at the turn of the twentieth-century through land reclamations, demolition of temples, and the displacement of residents. Can Sham Shui Po be renewed without destroying all of its original architecture, eradicating its public spaces, and displacing its inhabitants again? In this study, we have explored the elements of Sham Shui Po’s urban structure that have played a key role in its historic transformations through the study of the area’s morphology and planning.
Change is necessary for sustaining cities. Hong Kong has transformed from a landscape of villages into a preeminent hub of global trade. Change in the last one hundred and eighty years has greatly improved the lives of its people. However, 114 Projections
Figure 4. Evolving structure of continuity. 2005
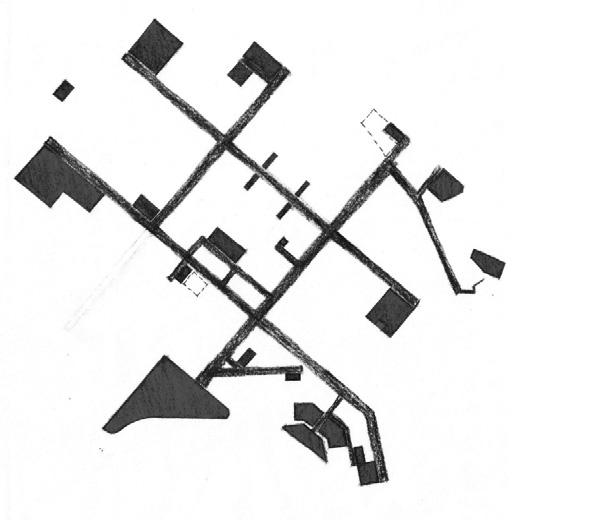
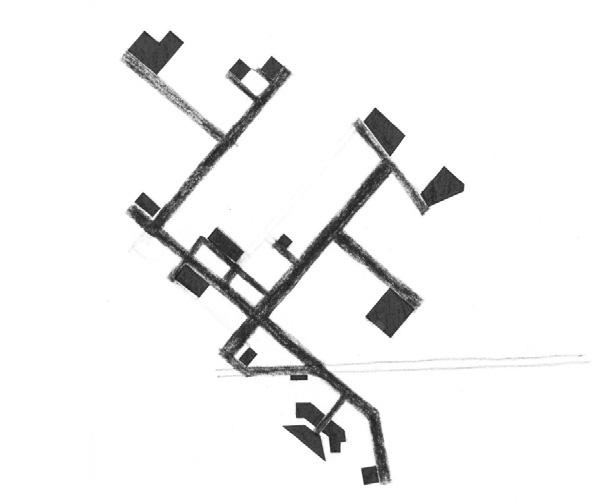
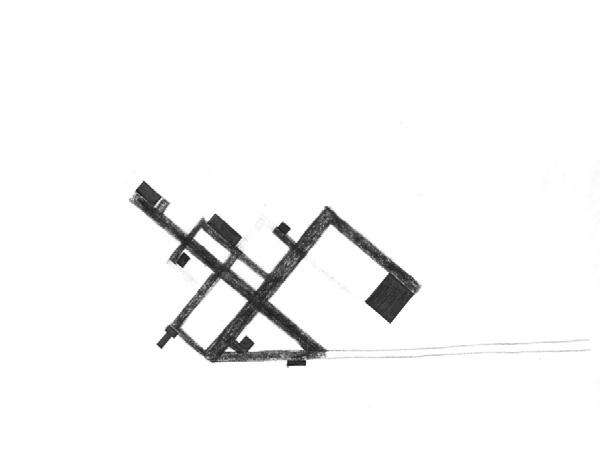
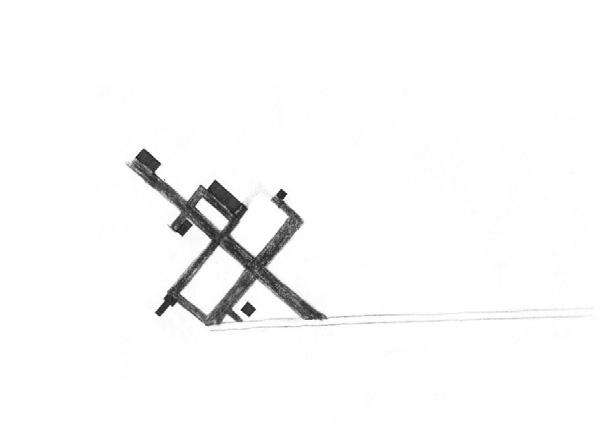
with higher standards of living and an increased sense of belonging, people now question the changes introduced by recent practices of urban renewal. Given the increasing concern to reatain the traces of Hong Kong’s history through urban renewal, we contend that contemporary transformations could benefit from a deeper understanding of the city’s continuous transformation in the past. We have tried to emphasize that not only has transformation always occured, but that it has occured in certain ways, with some of the city’s elements withstanding changes longer than others due to their continued capacity to guide the more rapidly changing fabric around them. A better understanding of these elements is required in the present urban renewal projects of old districts.
ENDNOTES
[1] URA notices, http://www.ura.org.hk/html/c1002092e323e.html, download on 1 July 2009.
[2] Wong, O., “HK$6b bid wins Wedding Card Street”, South China Morning Post, 24 June 2009.
[3] Rossi, A. The architecture of the city, p.21, 1982.
[4] URA website, http://www.ura.org.hk/html/c204000e1e.html downloaded on 19 September 2010.
[5] URA website, http://www.ura.org.hk/html/c204000e1e.html downloaded on 1 July 2009.
[6] URA website, http://www.ura.org.hk/html/c800000e1e.html downloaded on 1 July 2009.
[7] Rossi, A., Architecture of the city, p.59, 1982.
[8] Bacon, E., Design of cities, p.306, 1974.
[9] Lynch, K., What time is this place?, p.1, 1972.
WORKS CITED
Abbas, M. A. (c1997) Hong Kong: culture and the politics of disappearance, Hong Kong: Hong Kong University Press.
Bacon, E. (1974) Design of Cities, New York, London: Penguin Books.
Bédard. J.F. (1994) Cities of artificial excavation: the work of Peter Eisenman, 1978-1988, Montréal : Canadian Centre for Architecture; New York : Rizzoli International.
Blau, E., and Rupnik, I. (2007) Project Zagreb, transition as condition, strategy, practice, Barcelona: Actar D.
Cheng, P.H. (2007) Early Hong Kong’s Kowloon Peninsular, Hong Kong: University Museum and Art Gallery, The University of Hong Kong.
Conzen, M. R. G. (1975) Alnwick, Northumberland: a study in town-plan analysis, London: Institute of British Geographers.
Faure, D., Hayes, J, Birch, A. (1984) From village to city, studies in the traditional roots of Hong Kong
115 Woo and Hui
society, Hong Kong: Hong Kong Centre of Asian Studies, University of Hong Kong.
Habraken, N. J., (1998) The structure of the ordinary, Cambridge, Massachusetts: MIT Press.
Hong Kong, Census and Statistics Department, 2009.
Hui K.M. (2007) Urban transformation: permanence and change, unpublished M.Arch thesis, Hong Kong: Department of Architecture, Graduate School, The Chinese University of Hong Kong.
Hui, K.W.(2005) Transformation of city fabric, unpublished M.Arch. thesis, Hong Kong: Department of Architecture, Graduate School, The Chinese University of Hong Kong.
Krier, R. (1993) Architecture and urban design, London: Academy Editions.
Livesey, G. (2004) Passages: explorations of the contemporary city, Canada: University Calgary Press.
Lynch, K. (1960) The image of the city, Cambridge, Massachusetts: MIT Press.
Lynch, K. (1972) What time is this place? Cambridge, Massachusetts: MIT Press.
Pendlebury, J. (2009) Conservation in the age of consensus, Oxon: Routledge.
Rossi, A. (1982) The architecture of the city, Cambridge, Massachusetts: MIT Press.
Sitte, C. (1965) City planning according to artistic principles, New York: Random House.
Smith, C.T. (1995) A sense of history: studies in the social and urban history of Hong Kong, Hong Kong: Hong Kong Educational Pub. Co.
Unwin, R. (1994) Town planning in practice: an introduction to the art of designing cities and suburbs, New York: Princeton Architectural Press.
葉碧青 (2006) 從深水步到深水埗,第4版. [香港]: 深水埗區公民敎育委員會.
116 Projections
!"#$%&'(#)*
1928 1932 1940 1941 1942 1957 1965 1967 1983 1990 1994 1916
