
17th May 2023 Poster Competition Group C QI in Progress


Good record keeping is an essential skill for clinical staff for many reasons. These include continuity of care, information exchange, and record and explanation of actions and decisions. Patient care is affected by poor written communication between staff. Information in medicolegal cases rely heavily on documented evidence and “Poor records mean poor defence, no records mean no defence”1
To evaluate adherence to record keeping standards and to improve documentation and therefore patient safety over a period of 6 months.


Record keeping standards were generally good however some key areas were identified for improvement. Specifically, these included signing off entries with a printed name and designation.

There was significant improvement in documentation of Key Information areas as a result of restructuring the admission document.

The Association of Medical Royal Colleges (AoMRC) Generic Record Keeping Standards 2008 co-developed with the Royal College of Physicians (RCP) were used as the standards for assessing record keeping adherence.2
CPR decision, Treatment Escalation Plan, 4AT score, Clinical Frailty Score and venous thromboembolism risk are all expected to be completed on admission, as per the policy of the Western Isles Hospital, and therefore are included in this study.

The RCP “Generic Multi Disciplinary Record Audit tool” was used as a blueprint to record data.


We believe further improvement could be facilitated by electronic notes
Next steps – Repeat cycles with a larger samples size. Replicate the QI within other rural healthcare locations in the outer Hebrides. Campaign for improved IT systems.
Urinary tract infections (UTIs) are the most common infection affecting elderly patients1. Despite this, UTIs in this group are over-treated, often based on nonspecific symptoms2. This leads to suboptimal care and poor antibiotic stewardship. Dipsticks are not useful in the diagnosis of UTI in patients over 65 years due to the prevalence of asymptomatic bacteria (ASB), which does not need to be treated2 Approximately a third of patients with ASB receive unnecessary antibiotics3 We reviewed guidelines from the Scottish Intercollegiate Guidelines Network (SIGN)4. These stipulate that diagnosis of UTI in the elderly should be based on the presence of 2 or more symptoms and not use a urine dipstick. SIGN also state that samples should be collected and sent for culture and sensitivities (MC+S) in all symptom-based diagnoses. Antibiotics should then be tailored based on sensitivities to avoid side effects and morbidity associated with broad spectrum antibiotic use. We noticed that practice patterns did not follow these guidelines at Barnsley Hospital, therefore we aimed to:
1. Determine local adherence to SIGN guidance for the diagnosis and management of UTI
2. Improve the diagnosis and management of UTI in patients over 65
To improver the diagnosis and management of UTI in patients >65
Senior team knowledge and education Junior doctor knowledge, education and behaviour Nursing team knowledge, education and behaviour Unclear micro guidance in for UTI in >65s Primary drivers Out of date practice/knowledge Secondary drivers Knowledge of diagnosis of UTI in >65s and therefore when to treat Knowledge of diagnosis of UTI in >65s and therefore when to treat Poor handover to nursing team Staffing May not know to take urine sample Miseducation on importance of urine samples Guidelines for UTI not specific for age Possible solutions Education session Poster Up to date guidance Nursing education session Nursing handover section of AMU clerking pro forma Education session Poster Up to date guidance Poster Up to date micro guidelines for intranet and micro guide
Image 1: Driver diagram
1. Educational poster
2. Junior doctor teaching sessions
3. Update microbiology guidelines with clear section for over 65s
Prior to intervention we reviewed the notes of 30 patients >65 with UTI, this showed that only 13.3% had 2 or more symptoms documented, 70% had a urine dipstick done and 53% had MC+S sent (n=30).
Following poster circulation (cycle 1), the percentage of patients with MC+S sent rose to 59% on process measures (n=22).
Following junior doctor teaching (cycle 2), 35% had 2 or more symptoms documented, the percentage with a dipstick done fell to 60% and the percentage with MC+S sent rose to 60% (n=20).
Following the publication of the guideline, we saw an increase in the percentage of patients with 2 or more symptoms documented to 57% and the percentage with a dipstick done fell to 29%. However, we saw a drop in the number of samples sent for MC+S to 57% (n=14).
To investigate the diagnosis and management of UTI at Barnsley hospital, we reviewed notes and prescriptions of patients on elderly care wards and the acute medical unit. We included patients over 65 who had UTI documented as their diagnosis. Data collected: age, date of diagnosis, symptoms, antibiotic treatment, dipstick done (yes/no) and urine sample sent for MC+S (yes/no). We collected a full set of data before the first cycle and after the second and third cycles, with a process measures to check samples sent for MC+S between cycle one and two.

Exclusion criteria: age under 65, sepsis, catheter associated UTI, complicated (upper) UTI.
Cycle 1 improvement: we designed posters to educate medical and nursing staff on SIGN guidance including the importance of clinical diagnosis of UTI in over 65s, encourage sending samples for MC+S and discourage the use of urine dipsticks.
Cycle 2 improvement: we planned and delivered teaching sessions on the diagnosis and management of UTI in over 65s to the junior medical team. Key points included the prevalence of ASB in this population, the importance of clinical diagnosis and of sending urine for MC+S. Sessions were delivered at F1, F2 and general medicine teaching sessions.
Cycle 3 improvement: we designed an antibiotic guideline specific to the diagnosis and management of UTI in over 65s. This went through approval by the microbiology and pharmacy team prior to publication on Barnsley Hospital intranet and Microguide.
Change to be adopted: junior doctor teaching sessions
P D
Design and distribute educational poster (Image 1)

Plan to remeasure change after 6 months to determine sustained change
Implement microguide and trust guideline to support diagnosis and management
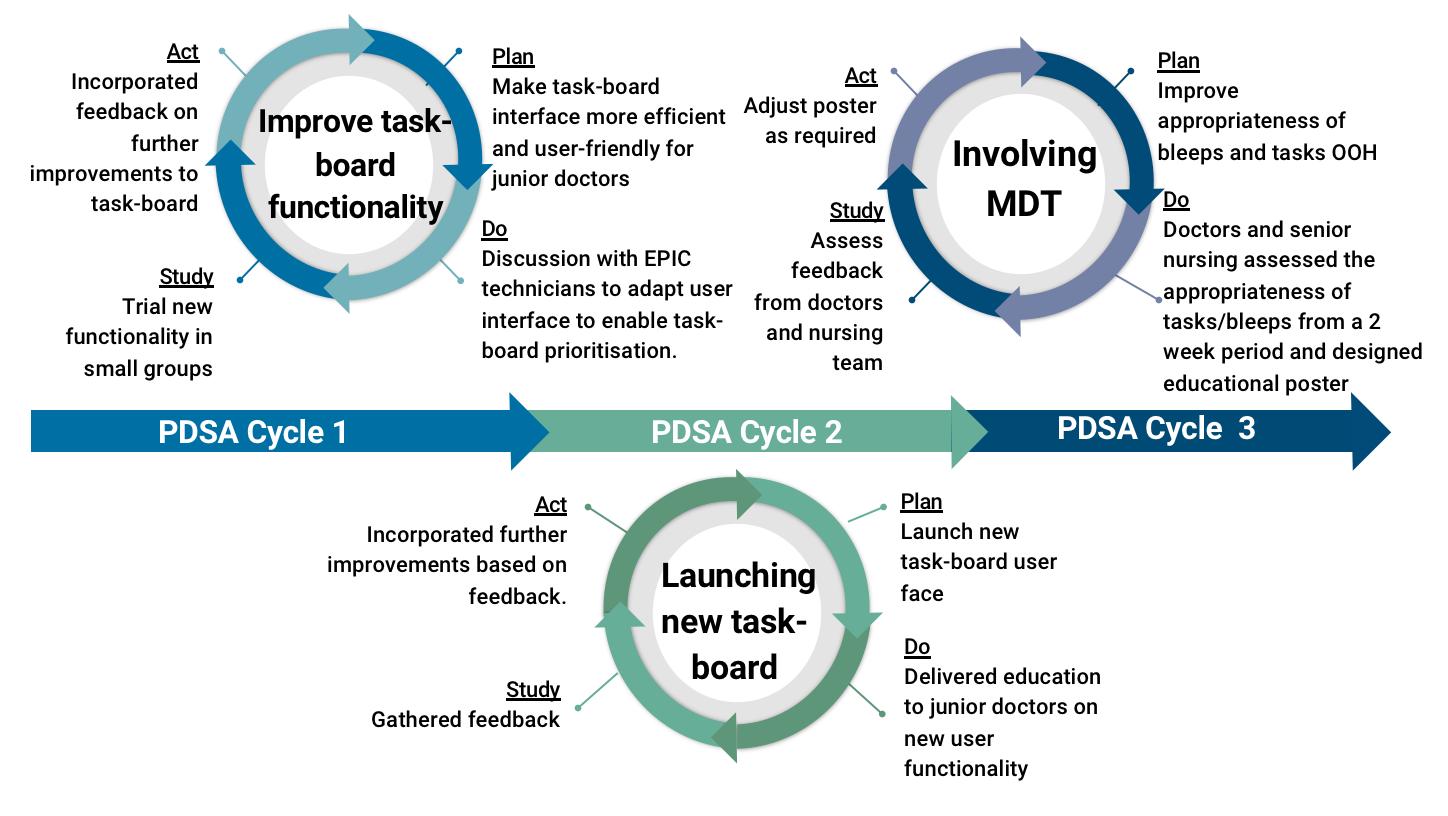
Image 3: Diagrams demonstrating plan, do, study, act cycles for each cycle of improvement. First (top left), second (bottom centre), third (top right).
70.00%
60.00%
50.00%
40.00%
30.00%
1 10.00%
80.00% Pre-intervention Post Cycle 2 Post Cycle 3 2 or more symptoms Urine dip MC+S
20.00%
3
Design guideline and gain approval from microbiology and pharmacy teams
Microbiology guideline for publication on trust intranet and microguide 2 or more symptoms recorded increased from 35% to 67% Urine dips decreased from 60% to 29%
2
To educate junior doctors about diagnosis and management of UTI in over 65s 2 or more symptoms recorded increased from 13.3% to 35%
Plan and deliver teaching sessions at F1, F2 and general medical teaching
Urine dips decreased from 70% to 60%
Overall, we have seen a marked improvement in the number of patients with 2 or more symptoms of UTI documented in their diagnosis from 13.3% to 67% and a decrease in the number of urine dipsticks done from 70% to 29%. We saw a modest increase in the number of samples sent for MC+S from 53% to 57%.
We believe that the change for cycle 3, a guideline published on the intranet, is our most sustainable improvement, and likely to provide the most lasting change. Regarding cycle 1, posters are sustainable, however they can lose impact over time as staff are less likely to notice old posters and they may have other things placed on top of them on busy notice boards. Cycle 2 is our least sustainable change as junior doctors rotate every 4 months meaning that it will quickly lose impact, we feel unable to continue this change forward.
The main challenge we faced was gaining approval for the microbiology guideline from the microbiology and pharmacy teams and this proved to be a length process. If we were to repeat this project again, we would commence discussions for this improvement as early as possible. Going forward, we aim to show lasting improvement as a result of our interventions by repeating a round of data collection in 6 months.

PJ Paralysis, otherwise known as deconditioning, is a syndrome of physical, functional and psychological decline, that is seen in response to prolonged periods of inactivity or ‘bed-rest’. It commonly affects older hospital inpatients, 83% of whom spend over 20 hours in bed each day!
It is associated with a number of poor outcomes; ranging from reduced mobility, sarcopenia, pressure areas and falls, to increased frailty, incontinence and confusion. A vicious cycle, it often results in an extended hospital admission and further deterioration.
This is a preventable harm!
This project hopes to take small, simple steps against PJ Paralysis on a healthcare of the elderly ward - focusing on regular mobilisation, participation in activities of daily living, and provision of routine.
Aims:
• Increase the number of patients getting out of bed / mobilising during daylight hours.
• Increase the number of patients dressed in their own clothing by midday.
T Approach: Targets for intervention were identified using a fishbone analysis, and a Plan-Do-Study-Act (PDSA) approach was taken to implement the proposed changes.
Data Collection & Outcomes: For each PDSA cycle performed, the number of ward inpatients wearing hospital pyjamas, versus their own clothes at midday; and the number of ward inpatients that had mobilised, versus remained in bed at 6pm, were measured. All data was confirmed with the RN, HCA or physiotherapist looking after the patient.


Duration: Each cycle of data collection lasted 5 days.
Review: After each round of intervention, data was analysed and shared with the ward team to allow for reflection and feedback. Wider involvement: An oral presentation was given to the wider healthcare of the elderly department, to raise awareness of the project and the key findings.
At Baseline: (n=168)
• 57% of patients had got out of bed / mobilised during daylight hours


• 39% of patients were dressed in their own clothing by midday
Intervention 1: Infographic posters on 'PJ Paralysis’ were created and displayed on the ward, with the aim of raising awareness and educating on prevention. They were placed in high-use areas, with a target audience to include: staff members, visiting family and the patients themselves.
Results (n=137)
• 77% of patients had got out of bed / mobilised during daylight hours
• 72% of patients were dressed in their own clothing by midday
Feedback: This intervention received positive feedback from staff members, however a repeated barrier to change was the lack of spare clothing for the patients to change into.
Intervention 2: Focused on the provision of spare clothes. Donations from charity shops were collected and stored on the ward for patient use as required. Adverts were made to request further donations, and signs installed to highlight the donation box location.
Results: (n=137)


• 77% of patients had got out of bed / mobilised during daylight hours
• 70% of patients were dressed in their own clothing by midday
Feedback: This intervention was strongly supported by the whole multidisciplinary team, and informal feedback from both patients and staff was overwhelmingly positive. Identified barriers included: infection control ward closures, and agency staff being unaware of the resource.
Intervention 3 was a morning routine checklist for patients.
Results: (n=135)
• 53% of patients had got out of bed / mobilised during daylight hours
• 45% of patients were dressed in their own clothing by midday
Feedback: This intervention was less successful. Many of the patients required assistance to complete the checklist, and staffing levels were not able to support this. Again, the ward was closed due to infection control measures.
Overview & Conclusions:
When comparing intervention data to baseline, each cycle found an improvement in the number of patients dressed. Whilst interventions 1 & 2 showed success across both outcomes.
Conclusions: This project highlighted that through simple interventions such as educational posters and clothing provision, we can help to protect our patients against PJ Paralysis during their hospital inpatient stay.
Successes: Areas of success included the level of MDT support and involvement; and how easily the interventions could fit into current ward practice. Improved ward wellbeing was also reported on staff feedback forms.
Barriers: Unfortunately, infection control outbreaks and closures were a challenge throughout and did impact patient's clothing and mobilisation opportunities. Future outbreaks aim to be minimised through the use of patient cohorting
Next steps: A ‘patient experience’ questionnaire is currently under development. It hopes to evaluate the impact on patient wellbeing and determine patient views on rehabilitation.
An activity rota is also being scheduled into afternoons on the ward, with the aim of increasing motivation and mobilisation.

• At Dr Kershaw’s Hospice, the on-call doctor is non-resident out-of-hours.

• Electronic prescribing is not currently available.
• Prescriptions are issued via email when no prescriber is on the premises.
• The email is printed out and serves as an administration record.
• The prescription is transcribed onto the paper drug chart when a doctor is next on site.
• Two medication errors related to remote prescribing prompted a review of the process and were the stimulus for this quality improvement project, which aims to improve patient safety.
The project aim is for 100% of remote prescriptions to be fully compliant with the hospice medicines management policy by March 2023.
Baseline data collection:
Remote prescriptions issued between 07/12/2022 –15/01/2023 were audited against the medicines management policy.
Stakeholder engagement:
Nursing sta were identi ed as important stakeholders with high interest and in uence over the project.
Generating change ideas:
I met with the Director of Clinical Services and Senior Sister to discuss ways to improve compliance with the existing policy for remote prescribing. They suggested we circulate the document via the nursing WhatsApp group.
ACT
A process map was created to establish current practice.
The hospice medicines management policy was consulted, which sets out the following criteria:
• Remote prescriptions must be in writing, using secure email communication.
• The patient must be identi ed by full name.
• The email must be printed and stapled to the front page of the medicines record.
• Where an existing prescription is stopped/altered, the nurse in charge must write the following text across a blank area of its administration record: ‘Prescription altered - see email dated [insert date]’ and initial this entry.
The medicines management policy was circulated on the nursing WhatsApp group on 17/01/2023.
• Twelve remote prescriptions were reviewed for baseline data collection: none were fully compliant with the policy.
• Preliminary results were presented at the hospice Nurse Forum on 08/02/2023.
Qualitative feedback:
‘Very
• Agreed that circulating the medicines management policy had been bene cial.
• Agreed that stapling the printed email to the drug chart and making an entry where prescriptions were stopped/altered improves the safety of the remote prescribing process and will be adopted.
• A simple intervention can have a signi cant impact i.e., circulating a policy on the nursing WhatsApp group.
• An existing policy may o er valuable instruction.
• Working closely with key stakeholders is crucial to the success of quality improvement.
• A signi cant improvement was seen following our rst intervention and no further medication errors related to remote prescribing were identi ed.
• Re-circulation of the medicines management policy and presentation of progress so far to the senior doctors at the hospice who work the non-resident on-call rota.
• A poster to be displayed in the treatment room as a reminder of the medicines management policy.
‘The measures that have been put in place will improve the process’
informative, clearly highlighted areas for concern and how the QIP has improved service’
Introduction


Virtual wards (VW) support patients, who would otherwise be in hospital, to get the acute care, remote monitoring and treatment they need in their own home. Remote monitoring may include the use of equipment and/or digital technology such as pulse oximeters and apps to provide regular readings to healthcare professionals.
A 2 week Virtual Ward Pilot took place across both Sandwell and City sites on the 6th June 2022. It aimed to support patients who were initially admitted to hospital with a primary respiratory condition and were stable or improving but required ongoing monitoring to be safely provided with it in their homes.

The results of the pilot showed that no bed days were saved with the introduction of the Respiratory VW due to the low acuity of patients recruited, and there was an unsatisfactory response time to clinical issues as they arose for patients being monitored in the community
Pilot conclusions
The pilot concluded that in order to save bed days in hospital, therapies that are currently delivered only in hospital would need to be delivered in patients home in order to truly expedite their discharge i.e. “Hospital at Home”

In subsequent operational meetings, it was determined we should calculate how many patients could have genuinely been sent home early if existing hospital therapies could be given to patients in their own home, and for respiratory patients, this was simply weaning an acute oxygen prescription
It was felt that that if an acute oxygen prescription could be weaned down in the community, then this would expedite discharges for respiratory patients, in a controlled and safe manner.
Cost effectiveness of moving an oxygen weaning service into the community: An Analysis
Here, we performed an audit to assess whether patients admitted to hospital with a respiratory presenting complaint suffered from a delayed discharge due to waiting for monitoring in hospital. Through this we aimed to estimate the bed time that could potentially be saved through the introduction of a VW.
Methods
We looked at all admissions to Sandwell hospital between 22/8/22 and 31/8/22 and selected all patients with a respiratory presenting complaint.
We further filtered these patients into those who were diagnosed with a condition that may benefit from a respiratory VW as determined by a respiratory consultant
Inclusion criteria: confirmed diagnosis of exacerbation of COPD, asthma, bronchiectasis and resolving pneumonia

We then examined each of these patient’s hospital documentation to assess whether or not they underwent a delayed discharge due to the weaning of oxygen or nebulisers
We collated this data and calculated the bed days lost due to delayed discharge for oxygen or nebuliser weaning
Results:

Of 35 patients with respiratory presenting complaints between 22/8/22 and 31/8/22 , 15 were diagnosed with conditions applicable for respiratory VW
These 15 patients had a total length of stay of 58 days. Of these, 12 days were found to be bed days lost due to delayed discharge (20.7%)
Assuming an average cost of £400 (consensus figure from Google web search), this amounts to £4,800 spent on weaning patients off oxygen and nebulisers over 2 weeks
£400 12 days £4,800 spent
• Our results show that introducing a respiratory virtual ward has the potential to substantially reduce patient’s length of hospital stay and make significant cost savings
• Further projects (PHASE 2) will aim to


• look at creating a safe oxygen weaning service in the community
• Develop an oxygen weaning protocol
Authors: Dr O.Helmy, Dr D Kavanagh

Background:


For several years, operating department staff at TROH have noted significant periods of inactivity between operations as a result of ineffective procedures for transferring patients from the wards. Long periods of inactivity between cases are an inefficient use of limited hospital resources and could impact patient outcomes through the following: 1) longer waits for time critical procedures; 2) longer stays in hospital; 3) reduced bed availability; and 4) an increase in out-of-hours operating.
Aim: Reduce the time taken to transfer a patient from the ward to the operating theatres by 50% over a six-month period by:
Identifying the barriers and facilitators to optimal theatre flow
Identifying key stakeholder groups capable of influencing theatre flow positively or negatively Analysing and adopting change concepts with positive influence on theatre flow
Plan: Previous Quality Improvement Projects based at TROH and literature on theatre flow were examined and used to identify key stakeholder groups important to theatre flow and conceptualise change interventions which could improve flow. Stakeholder groups were then consulted and questioned on the drivers of suboptimal theatre flow (Figure 1).
Do: A strategy for data collection was developed whereby an individual would go to the ward after the patient had been sent for and independently observe everything that happens to the patient, recording the time taken for each individual step in the process. If a step was completed before the data collector arrived on the ward, it was recorded as 0 time.
Study: Thematic analysis was undertaken to create a process map of the steps involved in transferring a patient to theatre (Figure 2) and identify common themes which were frequently limiting flow. Statistical analysis was then carried out.
Act: Repeat data collection is scheduled to take place six months after baseline data was collected.
Availability of theatre gowns, safety checklists, and wristband printers on surgical wards
Possible juniority of surgical ward staff


Staffing gaps on wards and significant workload
Unawareness for the urgency of maintaining optimal theatre flow

Fewer theatre specific porters compared to previously
Inefficient process for preparing/ transferring patients to theatre
Triaging cases of different surgical urgency
High number of temporary staff in department; unfamiliarity with hospital and systems
Multiple theatres sending for patients at the same time
Increase supplies on surgical wards
Ward training around the process of transferring patients to theatre and importance of maintaining optimal flow
Surgical wards to complete surgical safety checklists, change patients into gowns, and print wristbands during the night for patients attending theatre the next day


Increase number of theatre specific porters Recovery nurses to support theatre porters with moving patients
Establish an emergency surgery coordinator to control the ward-theatre interface and maintain optimal flow
• From the 18/10/2022-06/12/2022, 16 in-patients undergoing emergency operations (nonelective) at TROH were followed in their journey to the operating theatre. Average time taken for transfer was 41.3 minutes (Standard Deviation (SD) ± 21.4).

• The most significant rate limiting steps were waiting for porters and time where the ward was not carrying out any of the steps detailed in the process map (down time).

• Completing safety checklists, printing hospital wristbands, changing patients into theatre gowns and finding unoccupied ward staff to accompany patients to theatre also contributed significantly (19% of the overall transfer time). These steps have been highlighted as they can be completed prior to sending for the patient.
• Main Message: Likely secondary to significant workload and staffing pressures, wards frequently take a reactive rather than a proactive approach to preparing patients for theatre (only prepping the patient after they are sent for) and appear to lack awareness for the importance of maintaining theatre flow.
• In future: Remaining independent of the transfer is very difficult (ward staff discover your reason for being on the ward). Novel approaches to surveying the wards for data collection will be investigated.
The results of this analysis were disseminated to stakeholder groups through a quarterly anaesthetics audit meeting, and a meeting with the senior management team for surgery.
Whilst ward training is being developed, recommendations around completing safety checklists and changing patients into gowns overnight, and ensuring wristbands are printed before sending for the patient have been made to the wards.
We also advised the senior management team to increase the number of theatre specific porters and formalise the system for recovery nurses supporting porters with transferring patients.
Since dissemination, TROH have successfully interviewed for and employed an emergency surgery coordinator (band-6) who will oversee the theatre-ward interface and be in charge of maintaining optimal theatre flow.


Authors: C Gregory, L Ni Cheallaigh, E Gull, J Loomes-Vrdoljak, C Esculier, C Parsons, D Taylor-Knowles, F Khan, E Radcliffe, V Varley
Introduction and Aims

A combination of bleeps and digital task-board is used at the Royal Devon and Exeter hospital to identify high-priority tasks and request doctors’ support out-of-hours (OOH). This current system for task escalation is not fit for purpose. Although essential for urgent scenarios, bleeps can be disruptive and delay essential care when used inappropriately. By June 2023, we aim to:
1. Increase the efficiency of bleeps and taskboard during OOH
2. Improve doctors’ ability to effectively prioritise tasks
3. Reduce distraction due to inappropriate bleeps
Methodology
Results
43%
of bleeps assessed to be inappropriate preintervention

61.5% 0 %
were concerned that important tasks were missed
23.1% 100%
feel they can easily prioritise tasks
Taskboard Intervention
After
An efficient escalation system is crucial to patient safety. We hypothesise these interventions will result in improved patient care by reducing the time taken to achieve urgent tasks. We plan to assess the impact of our education poster by monitoring bleep numbers and appropriateness of bleeps. We will incorporate education of the OOH hospital systems in induction of all Junior Doctors in August 2023 to facilitate sustainable improvements to working OOH and to patient safety.
• Early inclusion of the multi-disciplinary team is crucial to improve the efficiency of how the hospital runs OOH.


• The ability to prioritise tasks by urgency can reduce the risk of missing time critical tasks
• When making changes to electronic user interfaces, early involvement or relevant engineers is essential to understand what is possible with the existing framework and developing realistic timelines.
Background

The bronchoscopy unit (BU) in Leeds undertakes 950 procedures a year, including Bronchoscopies, EBUS, Pleural procedures and Thoracoscopy. A piece of work was undertaken to try and identify inefficiencies and improve capacity in our current pathway which will reduce waiting times. Lost procedure capacity due to a high rate of avoidable cancellations was identified as a key area where efficiencies could potentially be made. Avoidable cancellations were due to incorrect pre procedure preparations, DNA’s and inappropriate post procedure care at home . The lost procedure capacity has financial implications and directly impacts staff utilisation and patient waiting times
Initial data collected over a 6 month period showed 119 avoidable cancellations equating to a loss of 19% of our capacity.
• A full service review including a process map and team affinity exercise was undertaken
• An audit on avoidable cancellations over a 10 week period was conducted
• An additional phone call in the patient pathway 72 hours prior to procedure was added.
• Appropriate staff identified to ensure continuity.
• Continue to audit avoidable cancellations for a further 10 weeks
In the first instance the clerical officer will call all patients 72 hours prior to their procedure. In the absence of clerical support, nursing staff will undertake the task. The aim of the phone call is to

• Confirm what procedure, where and when
• Reiterate individual pre-procedure instructions.
• Confirm anticoagulation instructions if appropriate
• Fasting times
• To further reduce avoidable cancelations from 71% to 100%
• To improve Inclusion within the patient pathway
• Send patients personalised texts in their first language

• Have templates provided by the interpreting service for those whose first language is not English, which allow for individual instructions to be added in the 24 hour clock.
• Collect patient feedback


• Confirming an appropriate adult is available to escort the patient home and stay with them for 24 hours post procedure.
• A 71% reduction in avoidable cancellation was achieved within the 10 week period following the introduction of the phone call.
• The emphasis is often placed on streamlining and reducing steps, however sometimes an extra step can reduce waste and save time.
• Not all patients were able to be contacted
• Identify key themes within the remaining cohort of patients who had avoidable cancellations.
Fully explanatory and extremely helpful
The 5 minute phone call improved efficiency and increased capacity. It reduced the clinical time wasted and the administrative burden associated with the cancellations, which equated to approximately 2 hours per patient. The bronchoscopy team have continued to monitor progress. To date, for April 2023, the department is on target to achieve a 100% reduction in avoidable cancellations for the first time. Overall this has improved patient experience, reduced patient wait times and contributed to service improvement. Positive feedback obtained showed the additional step added value to the patients by allowing them to feel at ease and ask questions.


The Mental Capacity Act (MCA) 2005 provides a framework for decision making and junior doctors should be aware its implications on their clinical practice. Junior doctors are frequently involved in applying the principles of the MCA and thus they should receive appropriate training to ensure this is being done within their competencies.
To survey junior doctors’ experiences and knowledge of the laws and principles behind capacity assessments and relevant paperwork. We hope to address any knowledge and/or confidence deficits with an educational programme.

We conducted a survey of 30 junior doctors at King’s College Hospital. The outcomes measured were in 3 categories:
1. Experience of teaching on capacity assessment at medical school and during induction/foundation teaching.
2. Experience of using the MCA including Deprivation of Liberty Safeguards (DoLS).
3. Knowledge assessment consisting of 11 multiple choice questions based on BMA toolkit
1. Majority of new junior doctors having been involved in the clinical application of the MCA and/or DoLS
2. Reportedly poor training with only a medium to low level of confidence in applying the MCA in their jobs.

3. A significant knowledge deficit was identified when assessing the basic principles behind the MCA. Although limited by sample size we have identified a potential training need for junior doctors and this further justifies the integration of a simulation-based Mental Capacity Act teaching session to the foundation teaching programme.

Working with Adult Safeguarding educational lead and Director of Nursing and the continuous quality improvement team


To design a bespoke educational programme which incorporates scenario based learning and simulation into foundation programme teaching
Plan to collect teaching feedback and resurvey foundation doctors
The majority of respondents (83.3%) reported performing at least one capacity assessment in the last 4 months.
In the knowledge assessment, the average score was 58% (range 27-93%).
70% of our surveyed doctors were unable to correctly identify both stages of a capacity assessment.
Free text analysis: difficulties with the practicalities of the paperwork surrounding MCA/DOLS, suggestions of simulations, scenario based teaching with trust specific practicalities and communication skills sessions.
Sara Memon1,2, Caroline Wilde3, Laura Ah-Kye3, Marcus Pederson3, Alice Milligan3, Hannah Timlin3
1University College London; 2Royal Bournemouth Hospital; 3Moorfields Eye Hospital NHS Foundation Trust


Orbital compartment syndrome (OCS) often presents to the emergency department (ED), requiring urgent lateral canthotomy and cantholysis to prevent irreversible vision loss This is a required competency for emergency medicine doctors and ophthalmologists Formal practical teaching opportunities are rare (limited to real patients or cadavers) and the procedure is often performed under pressure in an emergency or out of hours, where supervision may be limited We aimed to improve confidence in the procedure in both ophthalmology and ED registrars using a low-cost and anatomically correct model, made using only hospital equipment
Intervention: A low-cost and accessible simulation model was designed and used to teach at Moorfield’s Eye Hospital, North Middlesex University Hospital, St George’s Hospital and University College London Hospitals.
Measured Outcomes: Pre and post teaching questionnaires, assessing
1) Confidence in diagnosing OCS,
2) Confidence in locating the necessary equipment
3) Confidence in performing the procedure out of hours without supervision
4) Helpfulness of the model in understanding the anatomy of C+C (post teaching only)
Confidence and Helpfulness were measured using a 5-point Likert scale (1 = not at all confident/helpful, 5 = extremely confident/helpful).
Jan 2022

24 registrars, (8 ophthalmology, 16 ED)
PLAN: Pre-teaching, 21% (n=5) had performed the procedure before


Only 50% (n=12) had prior formal teaching on the subject 8% (n=2) and 13% (n=3) felt ‘quite confident’ in diagnosing OCS and locating the equipment for C+C respectively. Only one person felt at least ‘quite confident’ in performing the procedure out of hours without supervision
DO: Simulation session consisting of real life video demonstration of canthotomy and cantholysis, followed by simulation using model
STUDY: Post-teaching: 58% (n=14), felt ‘quite confident’ in both diagnosing OCS and locating the necessary equipment 42% (n=10) felt ‘quite confident’ in performing the procedure out of hours without supervision, and 8% (n=2) felt ‘extremely confident’ 25% (n=6) rated as ‘extremely helpful’ in their anatomical understanding of canthotomy and cantholysis
ACT: Aim to improve anatomical understanding of canthotomy and cantholysis.
July 2022
40 registrars, (9 ophthalmology, 31 ED)
Equipment:
1) 1 surgical glove


2) 6 cotton swab balls
3) 1 Specimen pot
4) 1 gauze sheet
5) Micropore surgical tape
6) Fabric dressing tape
7) 1 elastic band
Cost per model: £1.50
PLAN: Pre-teaching, 15% (n=6), 13% (n=5) and 15% (n=6) felt ‘quite confident’ in diagnosing OCS, locating the equipment for C+C, and performing the procedure out of hours without supervision, respectively 15% (n=6) ’quite confident’ performing the procedure out of hours without supervision, and nobody felt ‘extremely confident’
DO: Additional video demonstrating how to assemble the model (see QR code) was added to the ‘simulation teaching pack’

STUDY: Post-teaching, 50% (n=20) 58% (n=23) felt ‘quite confident’ in diagnosing OCS and locating the necessary equipment, respectively 42% (n=17) felt ‘quite confident’ in performing the procedure out of hours without supervision, and 4 participants felt ‘extremely confident’ doing this 50% (n=20) rated the model as ‘extremely helpful’ in their anatomical understanding of canthotomy and cantholysis
ACT: Incorporate our low fidelity simulation model into regular emergency and ophthalmic skills ’simulation days’
A lack of practical experience and robust prior teaching in the procedure was noted amongst all trainees Following intervention, significant increases in all 3 confidence parameters were seen (p < 0 01), with the majority of participants becoming ‘quite confident’ in all three measures. Introducing the model assembly video improved anatomical understanding of the procedure, with 25% finding the model extremely helpful for this in cycle 1, and 50% in cycle 2
The response to our educational simulation package was positive as 66% (n=43) of participants stated they would like further simulation teaching. Going forward, we aim to incorporate our simulation model into regular ‘simulation days’ across ED and ophthalmology departments
Fig 1: Model Assembly Illustration