ZONING
DETAILS

Detailed Zoning Information
RRFF5 (Rural Residential Farm/Forest 5 Acres)
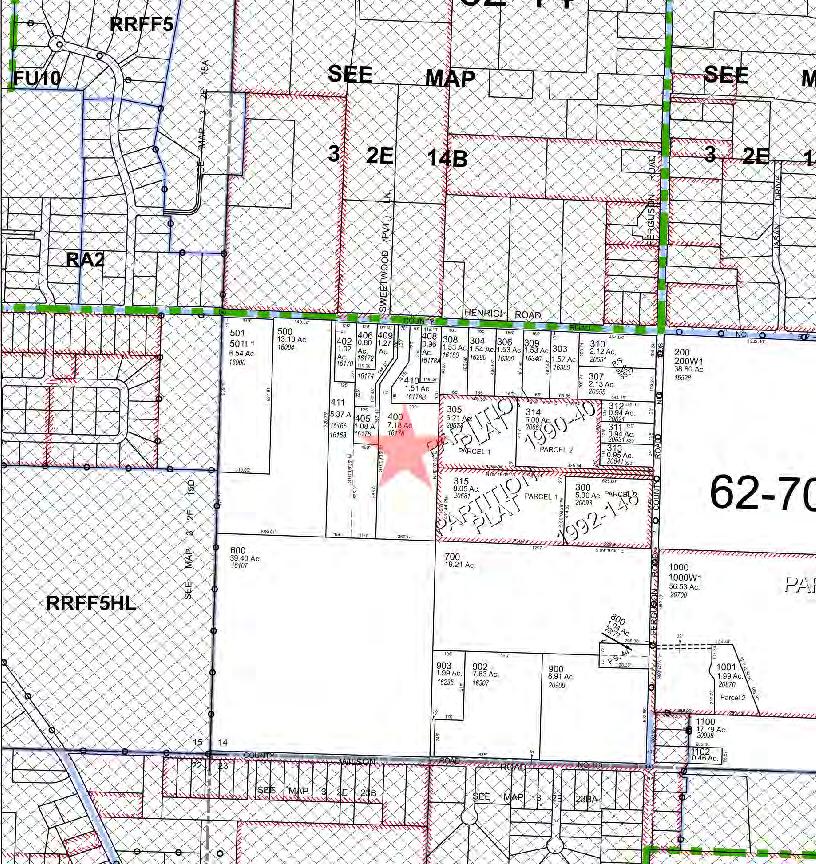
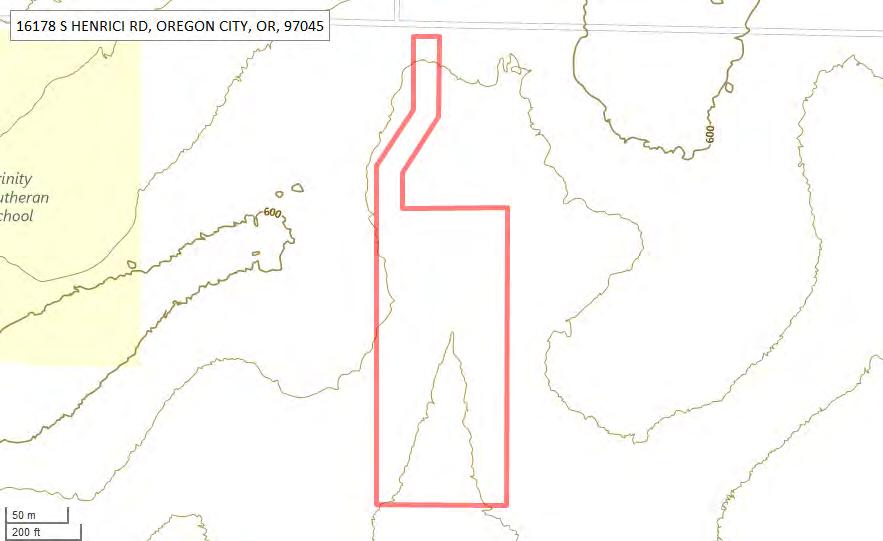
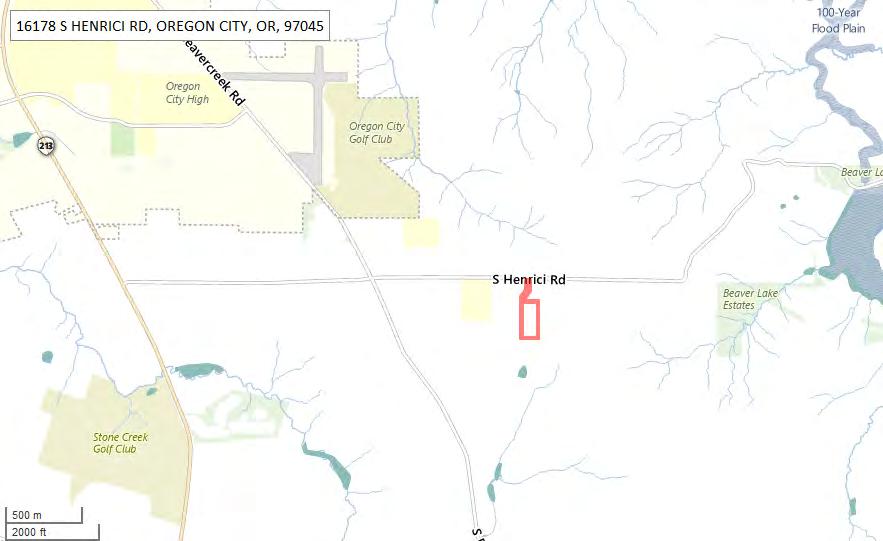
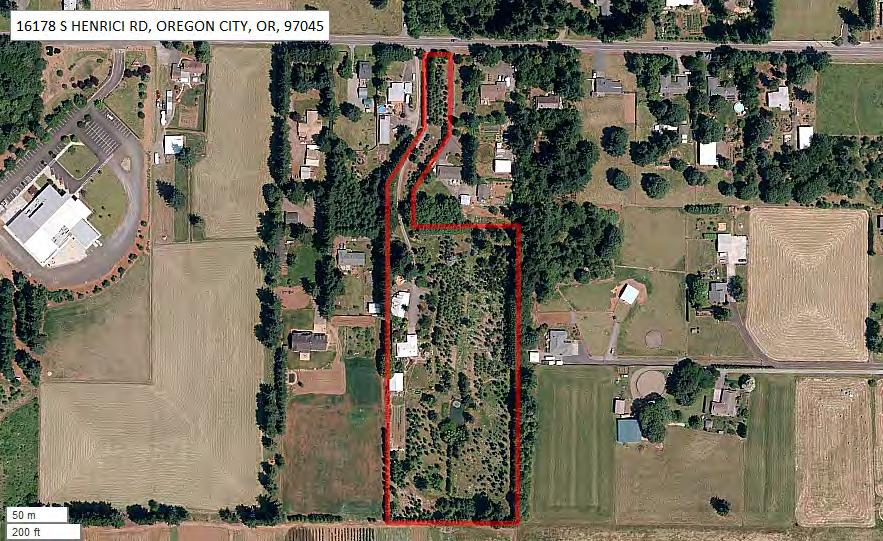
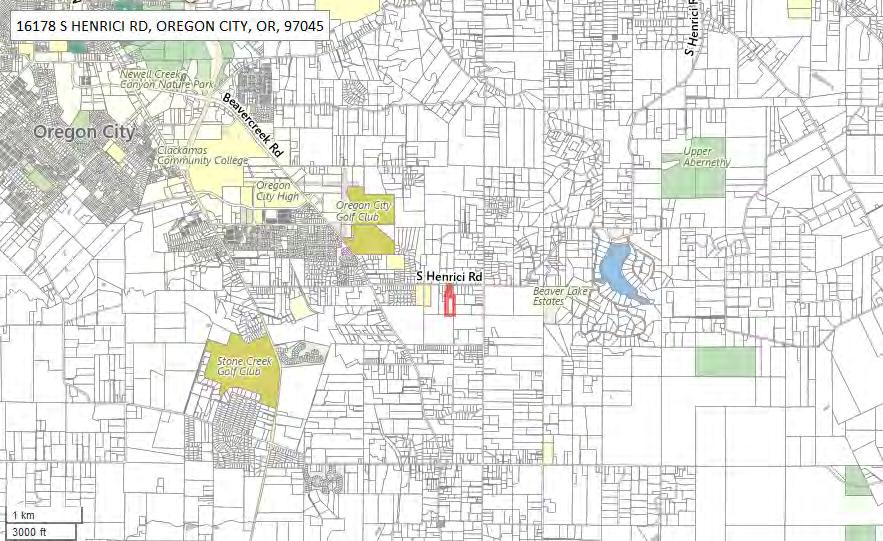
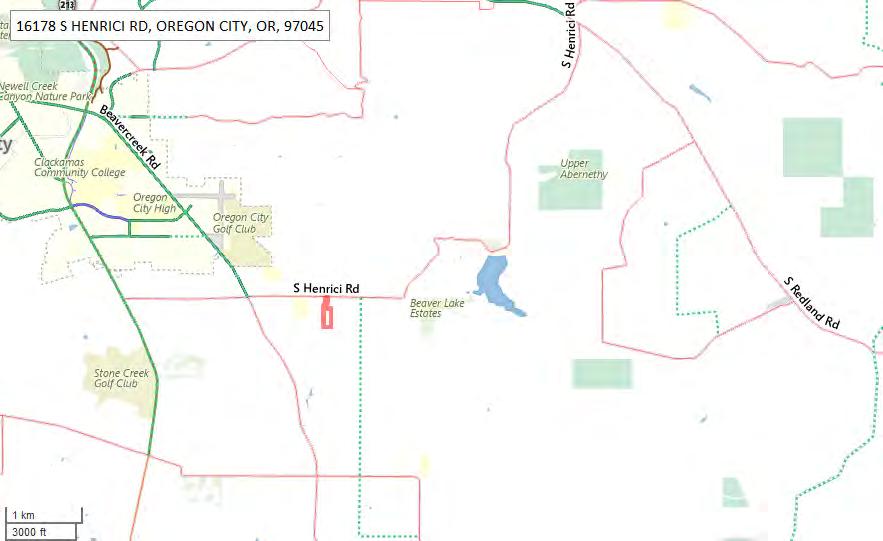
Zoning Map
Community Jurisdiction
The information contained is provided by WFG’s Customer Service Department to our customers, and while deemed reliable, is not guaranteed.
309.01
309.02
RURAL RESIDENTIAL FARMIFOREST 5 ACRES (RRFF-5) (6126/03)
PURPOSE
A. To provide areas for rural living where this type of development is compatible with the continuation of farm and forest uses.
B. To conserve the natural scenic beauty of the County.
C. To protect the watersheds of existing or potential major sources of municipal or domestic water supply from encroachment by uses that would affect the quantity or quality of water produced, protect wildlife habitats, and other such uses associated with the forest.
D . To avoid the potential hazards of danlage from flre, pollution, and conflict caused by urbanization.
AREA OF APPLICATION
The RRFF-5 zone is applied to those areas designated as Rural on the Clackamas County Comprehensive Plan map, aild which have a general parcel "size of flve (5) acres; are affected by development ; contain no serious natural hazards and the topography and soils are suitable for development, and are easily accessible to a Rural Center or incorporated city.
309.03 "PRIMARY USES
A. One single family dwelling, residential home as defined in Section 202, or manufactured dwelling subject to the provisions of Section 824. (11124/99)
B. Current employment of land for general fann uses including:
1. Raising, harvesting and selling of crops .
2. Feeding, breeding, selling and management oflivestock, poultry, furbearing animals or honeybees.
3. Selling of products oflivestock, poultry, fur-bearing animals or honeybees.
4. Dairying and the selling of dairy products .
5. Preparation and storage of the products raised on such lands for man's use and animal use.
6. Distribution by marketing or otherwise of products raised on such lands .
309
CLACKAMAS COUNTY WNING AND DEVELOPMENT ORDINANCE
309-1 Last Text Revision 6/26/03
309.04
7. Any other agricultural use, horticultural use, animal husbandry or any ',,\ combination thereof.
C. The propagation or harvesting of a forest product.
D. Public and private conservation areas and structures for the conservation of . water, soil, forest, or wildlife habitat resources.
E. Fish and wildlife management programs.
F. Public and private parks, campgrounds, playgrounds, recreational grounds, hiking and horse trails, pack stations, corrals, stables and similar casual uses provided that such uses are not intended for the purpose of obtaining a commercial profit.
G. Utility carrier cabinets, subject to Section 830. (2129/84)
H. Wireless telecommunication facilities listed in Subsection 835.04, subject to Section 835. (3/14/02)
ACCESSORY USES
A. Home occupations, subject to the provisions of Section 822. (2/4/81)
B. Accessory buildings and uses customarily incidental to any of the primary uses permitted in Subsection 309.03.
C. Produce stands, as defined in Section 202, subj ect to all applicable State regulations, and the requirements of this ordinance for parking and signing under 1007 and 1010. (6/4/86)
D. Signs, as provided under Section 1010. (8/6/81)
E. A guest house, as defined in Section 202, subject to the provisions under Section 833. (2/3/88)
F. Bed and Breakfast Homestays, subject to the major home occupation provisions under Section 822. (7/15/87)
G. Family daycare providers. (5/22/03)

CLACKAMAS COUNTY ZONING AND DEVELOPMENT ORDINANCE
309-2 Last Text Revision 6/26/03
USES SUBJECT TO REVIEW BY THE PLANNING DIRECTOR
(3/14/02)
The following use may be approved by the Planning Director pursuant to Subsection 1305.02: (3/14/02)
A. Wireless telecommunication facilities listed in Subsections 835.05(A)(2) and (3), subject to Section 835. (3/14/02)
CONDITIONAL USES
A. The following conditional uses may be allowed subject to review by the Hearings Officer pursuant to Section 1300. Approval shall not be granted unless the proposal complies with Section 1203 and any applicable provisions of Section 800. (5/22/03)
1. Churches, subject to Section 804; (5/22/03)
2. Schools, subject to Section 805, except as restricted by Subsection 309.07(F); (5/22/03)
3. Daycare facilities, subject to Section 807; (5/22/03)
4. Cemeteries, subject to Section 808; (5/22/03)
5. Service and recreational uses that exceed the limits of Subsection 309.03(F), subject to Section 813; (5/22/03)
6. Operations conducted for the exploration, mining, and processing of geothermal resources, aggregate and other mineral resources, or other subsurface resources, subject to Section 818; (5/22/03)
7. Sanitary landfills and debris fills, subject to Section 819; (5/22/03)
8. Hydroelectric facilities, subject to Section 829; (5/22/03)
9. Bed and breakfast residences and inns, subject to Section 832; (5/22/03)
10. Compo sting facilities, subject to Section 834; (5/22/03)
11. Wireless telecommunication facilities listed in Subsection 835.06(A), subject to Section 835; (5/22/03)
12. Kennels, provided that the portion of the premises used is located a minimum of200 feet from all property lines; (5/22/03)
CLACKAMAS COUNTY ZONING AND DEVELOPMENT ORDINANCE
309.05 309.06
309·3 Last Text Revision 6/26/03
13. Aircraft land uses, subject to Section 712 or 713; (5/22/03)
14. Commercial recreational uses that exceed the limits of Subsection 309.03(F); (5/22/03)
15. Commercial or processing activities that are in conjunction with timber and farm uses. (5/22/03)
PROHIBITED USES
A. Structures and uses of land not specifically mentioned in Section 309 are prohibited in all RRFF-5 districts.
B. Outdoor advertising displays, advertising signs or advertising structures, except as provided in Section 1010.
C. Any proposed division of land within the Rural Residential FarmlForest 5 acre zoning district and located within an Urban Growth Boundary of Sandy; Molalla, Estacada, and Canby resulting in the creation of one or more parcels ofland ofless than five (5) acres in size, with the exception of Conditional Uses approved by the Hearings Officer. (1/30/03)
D. A subdivision or partition within the Portland Metropolitan Urban Growth Boundary resulting in the creation of one or more lots or parcels of less than 20 acres in size. (1/30/03)
E. Residential subdivisions in Future Urban areas. (1/30/03) .
F. Public and private schools within the areas identified as Employment, Industrial and Regionally Significant Industrial on the Metro Region 2040 Growth Concept Map. (1/30/03)
DIMENSIONAL STANDARDS
A. Purpose; The provisions of this Subsection are intended to: (6/22/81)
1. Provide for and protect the unique character, livability, and scenic quality of rural areas of the county;
2. Provide for fire safety and protection of all structures;
3. Protect the privacy and livability of dwellings and yard areas; and
4. Preserve, within urban growth boundaries, large parcels of land for future development at urban densities.
309.07 309.08 CLACKAMAS COUNTY ZONING AND DEVELOPMENT ORDINANCE
Last Text Revision 6/26/03
309-4
B. The minimum average lot or parcel size shall be :five (5) acres. Variable sizing of lots or parcels in a partition or subdivision may be permitted pursuant to the flexible lot size development provisions of Subsection 1014.04B of this Ordinance or the Planned Unit Development provisions of Section 1013 of this Ordinance except as restricted in Subsection 309.07(C), (D) and (E). (1/30/03)
C. Right of Way Inclusion: For purposes of satisfying the lot size requirements of this district, lots which front on existing county or public roads may include the land area between the front property line and the middle of the road right of way.
D . Minimum Front Yard Setback: No structure constructed after the effective date of this amendment shall be located closer than thirty (30) feet from the front property line.
E. Minimum Rear Yard Setback: Thirty (30) feet.
F. Minimum Side Yard Setback: Ten (10) feet.
G. Minimum Setbacks for Accessory Structures: No accessory structures constructed after the effective date of this amendment shall be located closer than thirty (30) feet from the front property line. Accessory structures shall observe a minimum rear and side yard setbacks often (10) feet.
H. Bus shelters and roadside stands of no more than four hundred (400) square feet in size and not exceeding sixteen (16) feet in height, need not observe front yard setback lines excepting when located on a corner lot, then as provided in Subsection 309.08(1) below. (3/14 / 02)
I. Corner vision: No sight-obscuring or plantings exceeding thirty (30) inches in height shall be located within a twenty (20) foot radius of the lot corner nearest the intersection of two public, county or state roads, or from the intersection of a private driveway or easement and a public, county or state road. Trees located within a twenty (20) foot radius of any such intersection shall be maintained to allow eight (8) feet of visual clearance below the lowest hanging branches.
J . Scenic Roads: Structures built on lots adjacent to roads designated as Scenic Roads should be set back a sufficient distance from the right of way to permit a landscaped or natural buffer area.
K. See Section 900 for exceptions to dimensional standards.
CLACKAMAS COUNTY ZONING AND DEVELOPMENT ORDINANCE
309-5 Last Text Revision 6/26/03
L.
Variances: The requirements of this Subsection may be modified subject to staff review with notice pursuant to Subsection 1305.02, when the modifications is consistent with the purposes set forth under 309.08(A), and satisfies the criteria for a variance under Section 1205. (3/14/02)
DEVELOPMENT STANDARDS
A. See Section 1000 for applicable development standards.
B. Partitions in Future Urbanizable areas shall indicate the location of improvements, including easements and road dedications, structures, wells and septic drainfields which are consistent with the orderly development of the property at appropriate urban densities on the basis of the criteria for application of districts under Subsection 301.02
C. A property line adjustment may be granted pursuant to the provisions of Section 1020. (2/9/95)
D. Manufactured Dwelling Parks: Existing manufactured dwelling parks shall not be redeveloped with a differ ent use until a plan for relocation of the existing tenants is submitted and approved by the Planning Director or his designate. (11124/99)

309.09
CLACKAMAS COUNTY ZONING AND DEVELOPMENT ORDINANCE
309-6 Last Text Revision 6/ 26/03

Data Resource Center
600 NE Grand Ave, Portland, OR 97232
503.797.1742 – drc@oregonmetro.gov
This Web site is offered as a public service, integrating various government records into a region-wide mapping system. The property assessment records are a multi-county integration of Clackamas, Multnomah and Washington County records. MetroMap blends each county's records into a common database on a quarterly basis. Therefore, to view each county's official records, go to their respective web sites or offices. The other MetroMap data are derived from city, county, state, federal and Metro sources. The metadata (data about the data) are included on this site, including the sources to be consulted for verification of the information contained herein. It describes some cases where Metro blends city and county records by generalizing the disparities. Metro assumes no legal responsibility for the compilation of multi-source government information displayed by Metro Map.
Clackamas County
T3S R2E S14
Latitude: 45.307288






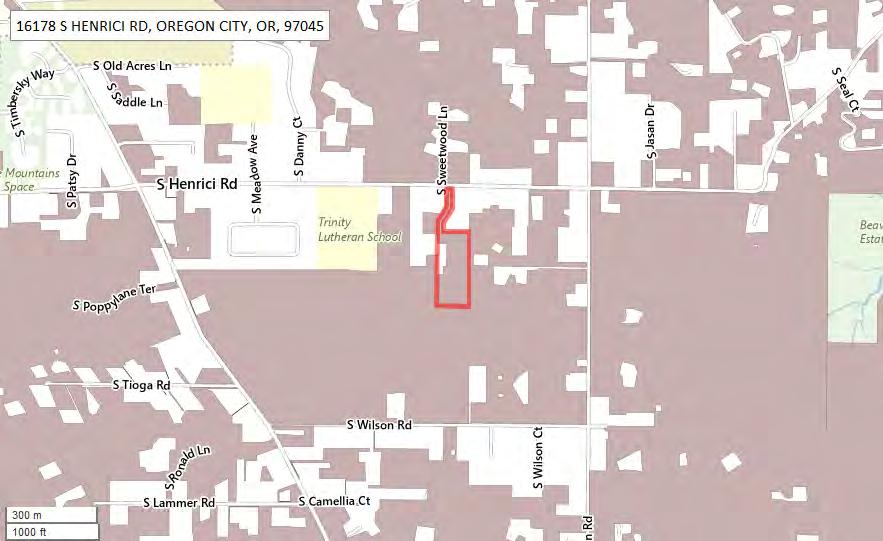
16178 S HENRICI RD, OREGON CITY, OR, 97045
TAXLOT
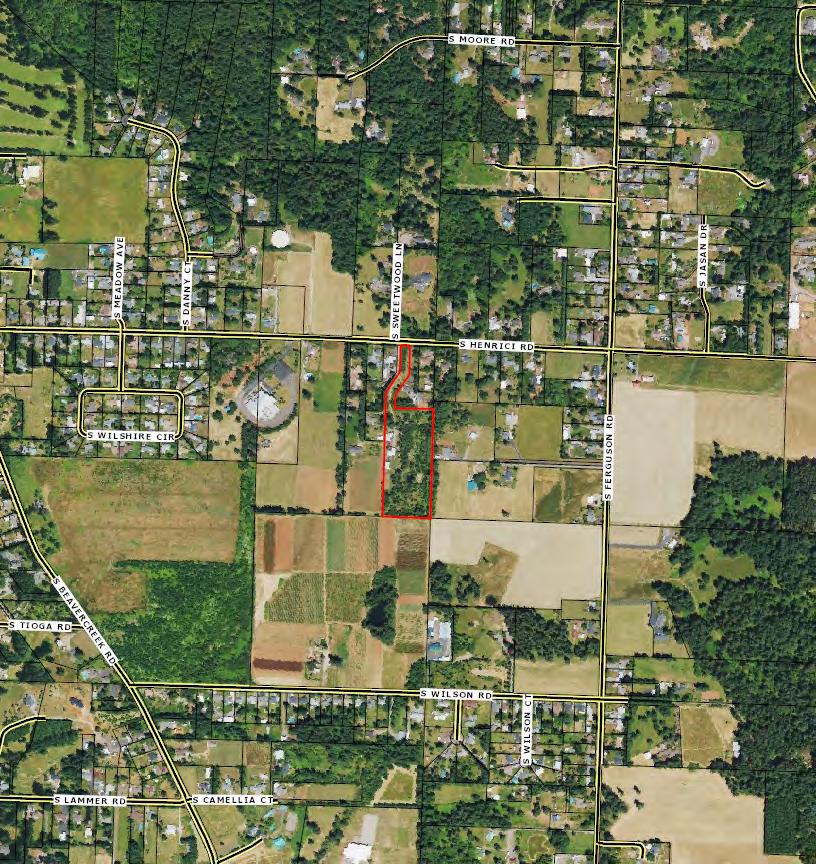
Tax Lot ID: R Number: Tax Lot Size: Building Area Market Total Value Land Use Year Built Sale Date Sale Price Market Land Value 640180.00000000 Market Building Value State General Property Class County Tax Code Site Address POLITICAL BOUNDARIES Jurisdiction Unincorporated Clackamas County Neighborhood Beavercreek Voting Precinct 514.00000000 Metro Council District N Metro Councilor Metro Councilor Email US Congressional District 5 Oregon House District 51 +100 m 500 ft
INFORMATION
(http://lea�etjs.com) |
©
Lea�et
Tiles:
Metro RLIS
Oregon Senate District 26
LAND USE AND PLANNING
Local Zoning RRFF5
Generalized Zoning RUR
Classi�ed Zoning RRFU
Watershed Abernethy Creek-Willamette River
Sub-Watershed Beaver Creek Basin Willamette
Sub-Basin Middle Willamette
Flood Plain Outside
Wetland Not in a wetland
Urban Growth Boundary Outside
Urban/Rural Reserve
Reserve Name
USGS Quad Name Oregon City
SERVICE DISTRICTS
Garbage Hauler
Commercial Hauler
Dropbox Provider
School District
School District Number
Oregon City Garbage Co.
Oregon City Garbage Co.
Oregon City Garbage Co.
Oregon Dept. of Ed. Dist. ID 1928
Natl. Center for Ed. Statistics Dist. ID 4109330
Water District
Park District
Sewer District
Clackamas River Water District
Fire District Clackamas Fire District #1
Fire Management Zone
OREGON
CITY
62
6801
23001.00000000
1
CENSUS INFORMATION Census Tract
Census Block Group

Data Resource Center
600 Northeast Grand Avenue, Portland, OR 97232
503-797-1742
drc@oregonmetro.gov
© Oregon Metro www.oregonmetro.gov/rlis
This Web site is offered as a public service, integrating various government records into a region-wide mapping system. The property assessment records are a multi-county integration of Clackamas, Multnomah and Washington County records. MetroMap blends each county's records into a common database on a quarterly basis. Therefore, to view each county's of�cial records, go to their respective web sites or of�ces. The other MetroMap data are derived from city, county, state, federal and Metro sources. The metadata (data about the data) are included on this site, including the sources to be consulted for veri�cation of the information contained herein. It describes some cases where Metro blends city and county records by generalizing the disparities. Metro assumes no legal responsibility for the compilation of multi-source government information displayed by Metro Map. Users of this information are cautioned to verify all information.
Census Block Population (2010) 2318
Topography
COMMUNITY
Demographics
Traffic Counts INFORMATION

The information contained is provided by WFG’s Customer Service Department to our customers, and while deemed reliable, is not guaranteed.

16178 S Henrici Rd, Oregon City, OR 97045


Sitewise Online Pop-Facts: Demographic Quick Facts Pop-Facts: Demographic Quick Facts 16178 S Henrici Rd, Oregon City, OR 97045 0 - 1 mi Population 2028 Projection 1,472 2023 Estimate 1,454 2020 Census 1,633 2010 Census 1,341 Growth 2023-2028 1.21% Growth 2020-2023 -10.99% Growth 2010-2020 21.77% Households 2028 Projection 529 2023 Estimate 525 2020 Census 588 2010 Census 480 Growth 2023-2028 0.78% Growth 2020-2023 -10.75% Growth 2010-2020 18.41% 2023 Estimated Population by Single-Classification Race 1,454 White Alone 1,259 86.57% Black or African American Alone 13 0.90% American Indian and Alaska Native Alone 11 0.79% Asian Alone 24 1.65% Native Hawaiian and Other Pacific Islander Alone 0 0.01% Some Other Race Alone 34 2.36% Two or More Races 112 7.71% 2023 Estimated Population by Ethnicity (Hispanic or Latino) 1,454 Hispanic or Latino 90 6.16% Not Hispanic or Latino 1,364 93.84% 2023 Occupied Housing Units by Tenure 525 Owner-Occupied 434 82.70% Renter-Occupied 91 17.30% 2023 Average Household Size 2.77
16178 S Henrici Rd, Oregon City, OR 97045

Copyright © Claritas, LLC 2023. All rights reserved.
2023 Est. Households by Household Income 525 Income Less than $15,000 15 2.81% Income $15,000 to $24,999 14 2.58% Income $25,000 to $34,999 16 3.14% Income $35,000 to $49,999 76 14.57% Income $50,000 to $74,999 56 10.61% Income $75,000 to $99,999 64 12.13% Income $100,000 to $124,999 76 14.47% Income $125,000 to $149,999 57 10.93% Income $150,000 to $199,999 54 10.35% Income $200,000 to $249,999 32 6.06% Income $250,000 to $499,999 41 7.78% Income $500,000 or more 24 4.56% 2023 Est. Average Household Income $140,860 2023 Est. Median Household Income $107,183 2023 Median HH Inc. by Single-Classification Race White Alone $108,508 Black or African American Alone $33,665 American Indian and Alaska Native Alone $42,641 Asian Alone $109,893 Native Hawaiian and Other Pacific Islander Alone $175,000 Some Other Race Alone $108,629 Two or More Races $73,191 Hispanic or Latino $44,703 Not Hispanic or Latino $109,677
Pop-Facts: Demographic Quick Facts 16178 S Henrici Rd, Oregon City, OR 97045 0 - 1 mi
16178 S Henrici Rd, Oregon City, OR 97045 Sitewise Online Pop-Facts: Demographic Quick Facts

Sitewise Online Pop-Facts: Population Quick Facts Pop-Facts: Population Quick Facts 16178 S Henrici Rd, Oregon City, OR 97045 0 - 1 mi Population 2028 Projection 1,472 2023 Estimate 1,454 2020 Census 1,633 2010 Census 1,341 Growth 2023-2028 1.21% Growth 2020-2023 -10.99% Growth 2010-2020 21.77% 2023 Est. Population by Age 1,454 Age 0 to 4 56 3.88% Age 5 to 9 63 4.36% Age 10 to 14 68 4.66% Age 15 to 17 52 3.55% Age 18 to 20 49 3.37% Age 21 to 24 64 4.43% Age 25 to 34 192 13.21% Age 35 to 44 170 11.67% Age 45 to 54 184 12.65% Age 55 to 64 238 16.34% Age 65 to 74 207 14.25% Age 75 to 84 90 6.18% Age 85 and over 21 1.44% Age 16 and over 1,249 85.91% Age 18 and over 1,215 83.55% Age 21 and over 1,166 80.18% Age 65 and over 318 21.88% 2023 Est. Median Age 45.69 2023 Est. Average Age 44.18
16178 S Henrici Rd, Oregon City, OR 97045

16178 S Henrici Rd, Oregon City, OR 97045
2023 Est. Population by Single-Classification Race 1,454 White Alone 1,259 86.57% Black or African American Alone 13 0.90% American Indian and Alaska Native Alone 11 0.79% Asian Alone 24 1.65% Native Hawaiian and Other Pacific Islander Alone 0 0.01% Some Other Race Alone 34 2.36% Two or More Races 112 7.71% 2023 Est. Population by Ethnicity (Hispanic or Latino) 1,454 Hispanic or Latino 90 6.16% Not Hispanic or Latino 1,364 93.84% 2023 Est. Population by Sex 1,454 Male 730 50.21% Female 724 49.79% Copyright © Claritas,
LLC 2023. All rights reserved.
Sitewise Online Pop-Facts: Population Quick Facts Pop-Facts: Population Quick Facts 16178 S Henrici Rd, Oregon City, OR 97045 0 - 1 mi

16178 S Henrici Rd, Oregon City, OR 97045 Sitewise Online Pop-Facts: Household Quick Facts Pop-Facts: Household Quick Facts 16178 S Henrici Rd, Oregon City, OR 97045 0 - 1 mi Households 2028 Projection 529 2023 Estimate 525 2020 Census 588 2010 Census 480 Growth 2023-2028 0.78% Growth 2020-2023 -10.75% Growth 2010-2020 22.57% 2023 Est. Households by Household Income 525 Income Less than $15,000 15 2.81% Income $15,000 to $24,999 14 2.58% Income $25,000 to $34,999 16 3.14% Income $35,000 to $49,999 76 14.57% Income $50,000 to $74,999 56 10.61% Income $75,000 to $99,999 64 12.13% Income $100,000 to $124,999 76 14.47% Income $125,000 to $149,999 57 10.93% Income $150,000 to $199,999 54 10.35% Income $200,000 to $249,999 32 6.06% Income $250,000 to $499,999 41 7.78% Income $500,000 or more 24 4.56% 2023 Est. Average Household Income $140,860 2023 Est. Median Household Income $107,183 2023 Median HH Inc. by Single-Classification Race White Alone $108,508 Black or African American Alone $33,665 American Indian and Alaska Native Alone $42,641 Asian Alone $109,893 Native Hawaiian and Other Pacific Islander Alone $175,000 Some Other Race Alone $108,629 Two or More Races $73,191 Hispanic or Latino $44,703 Not Hispanic or Latino $109,677 2023 Est. Households by Household Type 525 Family Households 422 80.42% Nonfamily Households 103 19.58% 2023 Est. Group Quarters Population 0

16178 S Henrici Rd, Oregon City, OR 97045 Sitewise Online
2023 Est. Households by Household Size 525 1-person 61 11.67% 2-person 253 48.19% 3-person 37 7.13% 4-person 141 26.93% 5-person 19 3.60% 6-person 6 1.09% 7-or-more-person 7 1.38% 2023 Est. Average Household Size 2.77
Household Quick Facts Pop-Facts: Household Quick Facts 16178 S Henrici Rd, Oregon City, OR 97045 0 - 1 mi
Pop-Facts:

16178 S Henrici Rd, Oregon City, OR 97045
2023 Est. HHs by Type by Presence of Own Children 422 Married-Couple Family, own children 130 30.74% Married-Couple Family, no own children 226 53.62% Male Householder, own children 8 1.89% Male Householder, no own children 10 2.35% Female Householder, own children 24 5.67% Female Householder, no own children 24 5.73%
Copyright © Claritas, LLC 2023. All rights reserved.
Sitewise
Pop-Facts: Household Quick Facts Pop-Facts: Household Quick Facts 16178 S Henrici Rd, Oregon City, OR 97045 0 - 1 mi
Online

16178 S Henrici Rd, Oregon City, OR 97045
Sitewise
Pop-Facts: Demographic Snapshot (Part 1) 16178 S Henrici Rd, Oregon City, OR 97045 0 - 1 mi Population 2028 Projection 1,472 2023 Estimate 1,454 2020 Census 1,633 2010 Census 1,341 Growth 2023-2028 1.21% Growth 2020-2023 -10.99% Growth 2010-2020 21.77% 2023 Est. Population by Single-Classification Race 1,454 White Alone 1,259 86.57% Black or African American Alone 13 0.90% American Indian and Alaska Native Alone 11 0.79% Asian Alone 24 1.65% Native Hawaiian and Other Pacific Islander Alone 0 0.01% Some Other Race Alone 34 2.36% Two or More Races 112 7.71% 2023 Est. Population Hispanic or Latino by Origin 1,454 Not Hispanic or Latino 1,364 93.84% Hispanic or Latino 90 6.16% Hispanic or Latino by Origin 90 Mexican 70 78.00% Puerto Rican 10 11.58% Cuban 0 0.00% All Other Hispanic or Latino 9 10.42% 2023 Est. Hisp. or Latino Pop by Single-Classification Race 90 White Alone 19 21.24% Black or African American Alone 1 0.80% American Indian and Alaska Native Alone 4 4.26% Asian Alone 0 0.00% Native Hawaiian and Other Pacific Islander Alone 0 0.00% Some Other Race Alone 28 30.83% Two or More Races 38 42.87%
Online Pop-Facts: Demographic Snapshot (Part 1)

16178 S Henrici Rd, Oregon City, OR 97045
2023 Est. Pop by Race, Asian Alone, by Category 24 Chinese, except Taiwanese 5 20.99% Filipino 2 6.76% Japanese 3 11.93% Asian Indian 5 19.71% Korean 3 14.20% Vietnamese 0 0.00% Cambodian 0 0.00% Hmong 0 0.00% Laotian 0 0.00% Thai 0 0.00% All other Asian Races, including 2 or more 6 26.41% 2023 Est. Pop Age 5+ by Language Spoken At Home 1,398 Speak only English 1,239 88.63% Speak Asian or Pacific Island Language 16 1.16% Speak IndoEuropean Language 52 3.72% Speak Spanish 90 6.45% Speak Other Language 1 0.04%
Sitewise Online Pop-Facts: Demographic Snapshot (Part 1)
Demographic Snapshot (Part 1)
Pop-Facts:
City,
97045 0 - 1 mi
16178 S Henrici Rd, Oregon
OR

16178 S Henrici Rd, Oregon City, OR 97045 Sitewise
2023 Est. Population by Sex 1,454 Male 730 50.21% Female 724 49.79% 2023 Est. Population by Age 1,454 Age 0 to 4 56 3.88% Age 5 to 9 63 4.36% Age 10 to 14 68 4.66% Age 15 to 17 52 3.55% Age 18 to 20 49 3.37% Age 21 to 24 64 4.43% Age 25 to 34 192 13.21% Age 35 to 44 170 11.67% Age 45 to 54 184 12.65% Age 55 to 64 238 16.34% Age 65 to 74 207 14.25% Age 75 to 84 90 6.18% Age 85 and over 21 1.44% Age 16 and over 1,249 85.91% Age 18 and over 1,215 83.55% Age 21 and over 1,166 80.18% Age 65 and over 318 21.88% 2023 Est. Median Age 45.69 2023 Est. Average Age 44.18
Online Pop-Facts: Demographic Snapshot (Part 1) Pop-Facts: Demographic Snapshot (Part 1)
S Henrici Rd, Oregon City, OR 97045 0 - 1 mi
16178

16178 S Henrici Rd, Oregon City, OR 97045 Sitewise Online
Pop-Facts: Demographic Snapshot (Part 1)
Pop-Facts: Demographic Snapshot (Part 1) 16178
2023 Est. Male Population by Age 730 Age 0 to 4 29 3.94% Age 5 to 9 32 4.44% Age 10 to 14 36 5.00% Age 15 to 17 30 4.04% Age 18 to 20 27 3.65% Age 21 to 24 32 4.34% Age 25 to 34 100 13.65% Age 35 to 44 84 11.57% Age 45 to 54 94 12.81% Age 55 to 64 116 15.85% Age 65 to 74 101 13.84% Age 75 to 84 40 5.54% Age 85 and over 10 1.32% 2023 Est. Median Age, Male 44.45 2023 Est. Average Age, Male 43.33 2023 Est. Female Population by Age 724 Age 0 to 4 28 3.81% Age 5 to 9 31 4.29% Age 10 to 14 31 4.32% Age 15 to 17 22 3.06% Age 18 to 20 22 3.08% Age 21 to 24 33 4.51% Age 25 to 34 92 12.77% Age 35 to 44 85 11.77% Age 45 to 54 90 12.49% Age 55 to 64 122 16.84% Age 65 to 74 106 14.67% Age 75 to 84 49 6.83% Age 85 and over 11 1.57% 2023 Est. Median Age, Female 46.92 2023 Est. Average Age, Female 45.05
S Henrici Rd, Oregon City, OR 97045 0 - 1 mi

16178 S Henrici Rd, Oregon City, OR 97045 Sitewise Online
Pop-Facts:
© Claritas, LLC 2023. All rights reserved.
2023 Est. Pop Age 15+ by Marital Status 1,266 Total, Never Married 281 22.21% Males, Never Married 196 15.48% Females, Never Married 85 6.73% Married, Spouse present 795 62.80% Married, Spouse absent 20 1.55% Widowed 64 5.03% Males, Widowed 10 0.80% Females, Widowed 54 4.23% Divorced 106 8.41% Males, Divorced 50 3.94% Females, Divorced 57 4.47% 2023 Est. Pop Age 25+ by Edu. Attainment 1,101 Less than 9th grade 61 5.53% Some High School, no diploma 44 4.01% High School Graduate (or GED) 281 25.54% Some College, no degree 296 26.87% Associate Degree 112 10.18% Bachelor's Degree 257 23.29% Master's Degree 28 2.54% Professional School Degree 8 0.69% Doctorate Degree 15 1.35% 2023 Est. Pop. Age 25+ by Edu. Attain., Hisp./Lat. 53 No High School Diploma 30 56.74% High School Graduate 6 10.61% Some College or Associate's Degree 14 25.73% Bachelor's Degree or Higher 4 6.92%
Copyright
Pop-Facts: Demographic Snapshot (Part 1)
S Henrici Rd, Oregon City, OR 97045 0 - 1 mi
Demographic Snapshot (Part 1) 16178

16178 S Henrici Rd, Oregon City, OR 97045 Sitewise Online Pop-Facts: Demographic Snapshot (Part 2) Pop-Facts: Demographic Snapshot (Part 2) 16178 S Henrici Rd, Oregon City, OR 97045 0 - 1 mi Households 2028 Projection 529 2023 Estimate 525 2020 Census 588 2010 Census 480 Growth 2023-2028 0.78% Growth 2020-2023 -10.75% Growth 2010-2020 22.57% 2023 Est. Households by Household Type 525 Family Households 422 80.42% Nonfamily Households 103 19.58% 2023 Est. Group Quarters Population 0 2023 HHs by Ethnicity: Hispanic/Latino 17 3.20% 2023 Est. Households by HH Income 525 Income < $15,000 15 2.81% Income $15,000 to $24,999 14 2.58% Income $25,000 to $34,999 16 3.14% Income $35,000 to $49,999 76 14.57% Income $50,000 to $74,999 56 10.61% Income $75,000 to $99,999 64 12.13% Income $100,000 to $124,999 76 14.47% Income $125,000 to $149,999 57 10.93% Income $150,000 to $199,999 54 10.35% Income $200,000 to $249,999 32 6.06% Income $250,000 to $499,999 41 7.78% Income $500,000+ 24 4.56% 2023 Est. Average Household Income $140,860 2023 Est. Median Household Income $107,183 2023 Median HH Income by Single-Class. Race or Ethn. White Alone $108,508 Black or African American Alone $33,665 American Indian and Alaska Native Alone $42,641 Asian Alone $109,893 Native Hawaiian and Other Pacific Islander Alone $175,000 Some Other Race Alone $108,629 Two or More Races $73,191

16178 S Henrici Rd, Oregon City, OR 97045
Pop-Facts: Demographic Snapshot (Part 2)
Pop-Facts: Demographic Snapshot (Part 2) 16178 S Henrici Rd, Oregon City, OR 97045
Hispanic or Latino $44,703 Not Hispanic or Latino $109,677
Sitewise Online
0 - 1 mi

16178 S Henrici Rd, Oregon City, OR 97045 Sitewise Online
Pop-Facts: Demographic Snapshot (Part 2)
Pop-Facts: Demographic Snapshot (Part 2)
2023 Est. Family HH Type by Presence of Own Children 422 Married-Couple Family, own children 130 30.74% Married-Couple Family, no own children 226 53.62% Male Householder, own children 8 1.89% Male Householder, no own children 10 2.35% Female Householder, own children 24 5.67% Female Householder, no own children 24 5.73% 2023 Est. Households by Household Size 525 1-person 61 11.67% 2-person 253 48.19% 3-person 37 7.13% 4-person 141 26.93% 5-person 19 3.60% 6-person 6 1.09% 7-or-more-person 7 1.38% 2023 Est. Average Household Size 2.77 2023 Est. Households by Presence of People Under 18 525 Households with 1 or more People under Age 18 182 34.68% Households with No People under Age 18 343 65.32% Households with 1 or more People under Age 18 182 Married-Couple Family 143 78.49% Other Family, Male Householder 10 5.27% Other Family, Female Householder 28 15.24% Nonfamily, Male Householder 2 0.91% Nonfamily, Female Householder 0 0.09% Households with No People under Age 18 343 Married-Couple Family 214 62.37% Other Family, Male Householder 8 2.36% Other Family, Female Householder 20 5.83% Nonfamily, Male Householder 50 14.62% Nonfamily, Female Householder 51 14.81%
16178 S Henrici Rd, Oregon City, OR 97045 0 - 1 mi

16178 S Henrici Rd, Oregon City, OR 97045 Sitewise Online
Pop-Facts: Demographic Snapshot (Part 2)
Pop-Facts: Demographic Snapshot (Part 2)
2023 Est. Households by Number of Vehicles 525 No Vehicles 9 1.67% 1 Vehicle 72 13.76% 2 Vehicles 245 46.59% 3 Vehicles 121 23.11% 4 Vehicles 35 6.66% 5 or more Vehicles 43 8.20% 2023 Est. Average Number of Vehicles 2.51 Family Households 2028 Projection 426 2023 Estimate 422 2010 Census 387 Growth 2023-2028 0.80% Growth 2010-2023 8.98% 2023 Est. Families by Poverty Status 422 2023 Families at or Above Poverty 415 98.21% 2023 Families at or Above Poverty with Children 163 38.66% 2023 Families Below Poverty 8 1.79% 2023 Families Below Poverty with Children 1 0.33% 2023 Est. Pop Age 16+ by Employment Status 1,249 In Armed Forces 0 0.00% Civilian - Employed 820 65.68% Civilian - Unemployed 25 1.96% Not in Labor Force 404 32.35% 2023 Est. Civ. Employed Pop 16+ by Class of Worker 812 For-Profit Private Workers 495 60.93% Non-Profit Private Workers 106 13.00% Local Government Workers 66 8.12% State Government Workers 17 2.04% Federal Government Workers 2 0.29% Self-Employed Workers 116 14.30% Unpaid Family Workers 11 1.31%
16178 S Henrici Rd, Oregon City, OR 97045 0 - 1 mi

2023 Est. Civ. Employed Pop 16+ by Occupation 812 Architect/Engineer 10 1.24% Arts/Entertainment/Sports 11 1.40% Building Grounds Maintenance 15 1.87% Business/Financial Operations 79 9.72% Community/Social Services 9 1.08% Computer/Mathematical 7 0.83% Construction/Extraction 40 4.98% Education/Training/Library 25 3.02% Farming/Fishing/Forestry 23 2.77% Food Prep/Serving 35 4.29% Healthcare Practitioner/Technician 29 3.61% Healthcare Support 8 0.97% Maintenance Repair 20 2.49% Legal 15 1.90% Life/Physical/Social Science 1 0.16% Management 115 14.21% Office/Admin. Support 82 10.16% Production 52 6.36% Protective Service 29 3.61% Sales/Related 98 12.05% Personal Care/Service 27 3.38% Transportation/Moving 80 9.90% 2023 Est. Pop 16+ by Occupation Classification 812 Blue Collar 193 23.73% White Collar 482 59.38% Service & Farm 137 16.89% 2023 Est. Workers Age 16+ by Transp. To Work 798 Drove Alone 664 83.19% Car Pooled 30 3.73% Public Transportation 8 1.05% Walked 7 0.91% Bicycle 0 0.00% Other Means 6 0.71% Worked at Home 83 10.41% 2023 Est. Workers Age 16+ by Travel Time to Work* Less than 15 minutes 136 15 to 29 Minutes 228 30 to 44 Minutes 175 45 to 59 Minutes 121 60 or more Minutes 46
Sitewise Online Pop-Facts: Demographic Snapshot (Part 2) Pop-Facts: Demographic Snapshot (Part 2) 16178 S Henrici Rd, Oregon City, OR 97045 0 - 1 mi
16178 S Henrici Rd, Oregon City, OR 97045

2023 Est. Avg. Travel Time to Work in Minutes* 31.90 2023 Est. Occupied Housing Units by Tenure 525 Owner-Occupied 434 82.70% Renter-Occupied 91 17.30% 2023 Occupied Housing Units: Avg. Length of Residence Owner-Occupied 13 Renter-Occupied 5
Sitewise Online
Demographic Snapshot
2) Pop-Facts: Demographic Snapshot (Part 2) 16178 S Henrici Rd, Oregon City, OR 97045 0 - 1 mi
16178 S Henrici Rd, Oregon City, OR 97045
Pop-Facts:
(Part

16178 S Henrici Rd, Oregon City, OR 97045
2023 Est. Owner Occupied Housing Units by Value 434 Value Less than $20,000 0 0.00% Value $20,000 to $39,999 4 1.01% Value $40,000 to $59,999 1 0.21% Value $60,000 to $79,999 1 0.23% Value $80,000 to $99,999 1 0.18% Value $100,000 to $149,999 0 0.11% Value $150,000 to $199,999 1 0.22% Value $200,000 to $299,999 5 1.25% Value $300,000 to $399,999 24 5.52% Value $400,000 to $499,999 69 15.98% Value $500,000 to $749,999 174 40.03% Value $750,000 to $999,999 91 21.01% Value $1,000,000 to $1,499,999 42 9.79% Value $1,500,000 to $1,999,999 18 4.21% Value $2,000,000 or more 1 0.27% 2023 Est. Median All Owner-Occupied Housing Unit Value $658,063 2023 Est. Housing Units by Units in Structure 541 1 Unit Attached 25 4.60% 1 Unit Detached 488 90.29% 2 Units 0 0.00% 3 or 4 Units 0 0.00% 5 to 19 Units 0 0.00% 20 to 49 Units 0 0.00% 50 or More Units 0 0.00% Mobile Home or Trailer 23 4.25% Boat, RV, Van, etc. 5 0.87% Dominant structure type 1 Unit Detached 2023 Est. Housing Units by Year Structure Built 541 Housing Units Built 2014 or Later 11 1.99% Housing Units Built 2010 to 2013 12 2.14% Housing Units Built 2000 to 2009 57 10.52% Housing Units Built 1990 to 1999 124 23.00% Housing Units Built 1980 to 1989 46 8.48% Housing Units Built 1970 to 1979 166 30.65% Housing Units Built 1960 to 1969 55 10.25% Housing Units Built 1950 to 1959 16 2.91% Housing Units Built 1940 to 1949 15 2.79% Housing Units Built 1939 or Earlier 39 7.26% 2023 Est. Median Year Structure Built** 1979
Sitewise Online Pop-Facts: Demographic Snapshot (Part 2)
16178 S Henrici Rd, Oregon City, OR 97045 0 - 1 mi
Pop-Facts: Demographic Snapshot (Part 2)

16178 S Henrici Rd, Oregon City, OR 97045 Sitewise
Online
Pop-Facts: Demographic Snapshot (Part 2)
Pop-Facts: Demographic Snapshot (Part 2)
Copyright © Claritas, LLC 2023. All rights reserved.
* This row intentionally left blank. No Total Category.
**1939 will appear when at least half of the Housing Units in this reports area were built in 1939 or earlier.
1970 to 1979
Dominant Year Structure Built
0
1 mi
16178 S Henrici Rd, Oregon City, OR 97045
-

Sitewise Online
Pop-Facts: Census Demographic Overview (Part 1) 16178 S Henrici Rd, Oregon City, OR 97045 0 - 1 mi Population 2028 Projection 1,472 2023 Estimate 1,454 2020 Census 1,633 2010 Census 1,341 Growth 2023-2028 1.21% Growth 2020-2023 -10.99% Growth 2010-2020 21.77% 2020 Population by Single-Classification Race 1,633 White Alone 1,251 76.58% Black or African American Alone 13 0.77% American Indian and Alaska Native Alone 13 0.78% Asian Alone 25 1.55% Native Hawaiian and Other Pacific Islander Alone 0 0.03% Some Other Race Alone 31 1.93% Two or More Races 135 8.26% 2020 Population By Ethnicity 1,633 Not Hispanic or Latino 1,539 94.25% Hispanic or Latino 94 5.75% 2020 Hispanic or Latino by Single-Classification Race 94 White Alone 22 23.36% Black or African American Alone 1 1.00% American Indian and Alaska Native Alone 4 3.73% Asian Alone 0 0.00% Native Hawaiian and Other Pacific Islander Alone 0 0.00% Some Other Race Alone 27 28.53% Two or More Races 41 43.39% 2010 Population by Sex 1,341 Male 678 50.55% Female 663 49.45% Male/Female Ratio 1.02
16178 S Henrici Rd, Oregon City, OR 97045
Pop-Facts: Census Demographic Overview (Part 1)

16178 S Henrici Rd, Oregon City, OR 97045
2010 Population by Age 1,341 Age 0 to 4 52 3.89% Age 5 to 9 74 5.52% Age 10 to 14 102 7.64% Age 15 to 17 72 5.34% Age 18 to 20 57 4.23% Age 21 to 24 52 3.90% Age 25 to 34 110 8.20% Age 35 to 44 169 12.61% Age 45 to 54 244 18.21% Age 55 to 64 233 17.35% Age 65 to 74 123 9.18% Age 75 to 84 43 3.17% Age 85 and over 10 0.75% Age 16 and over 1,092 81.44% Age 18 and over 1,041 77.61% Age 21 and over 984 73.38% Age 65 and over 176 13.10% 2010 Median Age 43.94
Sitewise
Pop-Facts: Census Demographic Overview (Part 1)
Census Demographic Overview (Part 1) 16178 S Henrici Rd, Oregon City, OR 97045 0 - 1 mi
Online
Pop-Facts:

16178 S Henrici Rd, Oregon City, OR 97045
2010 Male Population by Age 678 Age 0 to 4 29 4.20% Age 5 to 9 35 5.16% Age 10 to 14 52 7.67% Age 15 to 17 44 6.56% Age 18 to 20 31 4.57% Age 21 to 24 27 3.93% Age 25 to 34 56 8.27% Age 35 to 44 83 12.17% Age 45 to 54 120 17.76% Age 55 to 64 114 16.74% Age 65 to 74 62 9.16% Age 75 to 84 21 3.15% Age 85 and over 5 0.67% 2010 Median Age, Male 42.93 2010 Female Population by Age 663 Age 0 to 4 24 3.57% Age 5 to 9 39 5.90% Age 10 to 14 50 7.60% Age 15 to 17 27 4.09% Age 18 to 20 26 3.88% Age 21 to 24 26 3.87% Age 25 to 34 54 8.14% Age 35 to 44 87 13.07% Age 45 to 54 124 18.66% Age 55 to 64 119 17.97% Age 65 to 74 61 9.20% Age 75 to 84 21 3.20% Age 85 and over 6 0.84% 2010 Median Age, Female 44.90 Copyright
© Claritas, LLC 2023. All rights reserved.
Census Demographic Overview
Henrici Rd, Oregon City, OR 97045 0 - 1 mi
Sitewise Online Pop-Facts: Census Demographic Overview (Part 1) Pop-Facts:
(Part 1) 16178 S

Pop-Facts: Census Demographic Overview (Part 2)
Sitewise Online
Pop-Facts: Census Demographic Overview (Part 2) 16178 S Henrici Rd, Oregon City, OR 97045 0 - 1 mi Households 2028 Projection 529 2023 Estimate 525 2020 Census 588 2010 Census 480 Growth 2023-2028 0.78% Growth 2020-2023 -10.75% Growth 2010-2020 22.57% 2010 Households by Household Type 480 Family Households 387 80.73% Non-family Households 92 19.27% 2010 Group Quarters Population 0 2010 Hispanic or Latino Households 11 2.20% 2010 Households by Household Size 480 1-person 69 14.48% 2-person 188 39.25% 3-person 81 16.89% 4-person 85 17.68% 5-person 35 7.30% 6-person 12 2.41% 7-or-more-person 10 2.00%
16178 S Henrici Rd, Oregon City, OR 97045

2010 Households by Type and Presence of Children 480 Married-Couple Family, own children 117 24.46% Male Householder, own children 6 1.35% Female Householder, own children 19 3.98% Married-Couple Family, no own children 213 44.38% Male Householder, no own children 9 1.89% Female Householder, no own children 22 4.66% Non-family Households 92 19.27% 2010 Households by Presence of People Under Age 18 480 HH with 1 or More People Under Age 18: 163 33.90% Households with No People Under Age 18: 317 66.10% HH with 1 or More People Under Age 18: 163 Married-Couple Family 130 79.91% Other Family, Male Householder 8 4.96% Other Family, Female Householder 23 14.21% Nonfamily, Male Householder 1 0.92% Nonfamily, Female Householder 0 0.00% Households with No People Under Age 18: 317 Married-Couple Family 200 63.17% Other Family, Male Householder 7 2.34% Other Family, Female Householder 18 5.81% Nonfamily, Male Householder 46 14.64% Nonfamily, Female Householder 45 14.05% 2010 Occupied Housing Units by Tenure 480 Owner-Occupied 433 90.21% Renter-Occupied 47 9.79% Copyright © Claritas, LLC 2023. All rights reserved.
Henrici Rd, Oregon City, OR
Sitewise Online Pop-Facts: Census Demographic Overview (Part 2) Pop-Facts: Census Demographic Overview (Part 2) 16178 S Henrici Rd, Oregon City, OR 97045 0 - 1 mi
16178 S
97045

Market Power Opportunity Gap Report By Retail Store Types
Total retail trade including food and drink (NAICS 44, 45 and 722)
(NAICS 44 and 45)
vehicle and parts dealers (NAICS 441)
dealers (NAICS 4411)
dealers (NAICS 44111)
(NAICS 44112)
(NAICS 4412)
(NAICS 44121)
44122)
(NAICS 4441)
4442)
44422)
and other grocery (except convenience) stores (NAICS 44511)
stores (NAICS 44512)
(NAICS 4452)
Sitewise
Retail
16178 S Henrici Rd, Oregon City,
97045 0 - 1 mi 2023 Demand 2023 Supply Opportunity Gap/Surplus
$42,506,457 $8,641,682 $33,864,775 Total
$37,711,188 $7,682,845 $30,028,343 Motor
$8,744,282 $ 0 $8,744,282 Automobile
$7,145,419 $ 0 $7,145,419 New
$6,384,134 $ 0 $6,384,134 Used
$761,286 $ 0 $761,286 Other motor vehicle dealers
$851,323 $ 0 $851,323 Recreational vehicle dealers
$323,089 $ 0 $323,089 Motorcycle,
$528,234 $ 0 $528,234 Boat dealers (NAICS
$204,553 $ 0 $204,553 Motorcycle, ATV, and all other motor vehicle dealers (NAICS
$323,681 $ 0 $323,681 Automotive parts, accessories, and tire stores (NAICS 4413) $747,540 $ 0 $747,540 Automotive parts and accessories stores (NAICS 44131) $471,039 $ 0 $471,039 Tire dealers (NAICS 44132) $276,501 $ 0 $276,501 Furniture and home furnishings stores (NAICS 442) $821,024 $ 0 $821,024 Furniture stores (NAICS 4421) $466,495 $ 0 $466,495 Home furnishings stores (NAICS 4422) $354,529 $ 0 $354,529 Floor covering stores (NAICS 44221) $181,276 $ 0 $181,276 Other home furnishings stores (NAICS 44229) $173,253 $ 0 $173,253 Window treatment stores (NAICS 442291) $ 9,782 $ 0 $ 9,782 All other home furnishings stores (NAICS 442299) $163,471 $ 0 $163,471 Electronics and appliance stores (NAICS 443) $591,311 $ 0 $591,311 Household appliance stores (NAICS 443141) $125,290 $ 0 $125,290 Electronics stores (NAICS 443142) $466,021 $ 0 $466,021 Building material
garden equipment
supplies
$2,726,743 $2,439,505 $287,238 Building material and supplies dealers
$2,373,772 $2,247,710 $126,062 Home centers (NAICS 44411) $1,345,456 $954,754 $390,702 Paint and wallpaper stores (NAICS
$ 79,508 $182,781 -$103,273 Hardware stores (NAICS
$198,532 $343,545 -$145,013 Other building material dealers
$750,276 $766,630 -$16,354 Lawn
$352,970 $191,795 $161,176 Outdoor
$ 71,834 $ 5,631 $ 66,204 Nursery,
$281,136 $186,164 $ 94,972 Food and beverage stores
445) $5,303,965 $2,568,446 $2,735,519 Grocery stores
$4,746,998 $2,568,446 $2,178,552 Supermarkets
$4,547,429 $2,568,446
Convenience
$199,569 $ 0 $199,569 Specialty food stores
$137,607 $ 0 $137,607
16178 S Henrici Rd, Oregon City, OR 97045
Online Retail
Market Power Opportunity Gap Report By Retail Store Types
OR
retail trade
car
car dealers
boat, and other motor vehicle dealers (NAICS
441222)
441228)
and
and
dealers (NAICS 444)
44412)
44413)
(NAICS 44419)
and garden equipment and supplies stores (NAICS
power equipment stores (NAICS 44421)
garden center, and farm supply stores (NAICS
(NAICS
(NAICS 4451)
$1,978,983

16178 S Henrici Rd, Oregon City, OR 97045 Sitewise Online
Retail Market Power Opportunity Gap Report By Retail Store Types
Retail Market Power Opportunity Gap Report By Retail Store Types
(NAICS 44521)
(NAICS 44522)
(NAICS 44523)
(NAICS 44529)
(NAICS 445291 + 445292)
goods, hobby, musical instrument, and book stores (NAICS 451)
goods, hobby, and musical instrument stores (NAICS 4511)
(NAICS 45112)
needlework, and piece goods stores (NAICS 45113)
(NAICS 4512)
(NAICS 4522)
16178 S Henrici Rd, Oregon City, OR 97045
Meat markets
$ 42,409 $ 0 $ 42,409 Fish and seafood markets
$ 16,638 $ 0 $ 16,638 Fruit and vegetable markets
$ 28,539 $ 0 $ 28,539 Other specialty food stores
$ 50,020 $ 0 $ 50,020 Baked
stores
$ 26,322 $ 0 $ 26,322 All other specialty food stores (NAICS
$ 23,698 $ 0 $ 23,698 Beer, wine, and liquor stores (NAICS 4453) $419,360 $ 0 $419,360 Health and personal care stores
$2,169,264 $ 0 $2,169,264 Pharmacies and drug stores
$1,857,981 $ 0 $1,857,981 Cosmetics, beauty supplies, and perfume stores
$128,313 $ 0 $128,313 Optical goods stores (NAICS
$ 65,879 $ 0 $ 65,879 Other health and personal care stores (NAICS
$117,091 $ 0 $117,091 Food (health) supplement stores (NAICS 446191) $ 41,384 $ 0 $ 41,384 All other health and personal care stores (NAICS 446199) $ 75,707 $ 0 $ 75,707 Gasoline stations (NAICS 447) $2,915,330 $ 0 $2,915,330 Clothing and clothing accessories stores (NAICS 448) $1,835,011 $ 0 $1,835,011 Clothing stores (NAICS 4481) $1,254,822 $ 0 $1,254,822 Men's clothing stores (NAICS 44811) $ 49,246 $ 0 $ 49,246 Women's clothing stores (NAICS 44812) $246,280 $ 0 $246,280 Children's and infants' clothing stores (NAICS 44813) $ 45,696 $ 0 $ 45,696 Family clothing stores (NAICS
$736,324 $ 0 $736,324 Clothing accessories stores (NAICS 44815) $ 64,777 $ 0 $ 64,777 Other clothing stores (NAICS 44819) $112,499 $ 0 $112,499 Shoe stores
$205,939 $ 0 $205,939 Jewelry, luggage, and leather goods stores
$374,250 $ 0 $374,250 Jewelry stores
$242,932 $ 0 $242,932 Luggage
$131,318 $ 0 $131,318 Sporting
$612,810 $173,729 $439,080 Sporting
$541,628 $173,729 $367,899 Sporting goods stores
$366,256 $170,263 $195,993 Hobby, toy,
game stores
$134,888 $ 3,466 $131,421 Sewing,
$ 18,127 $ 0 $ 18,127 Musical instrument
supplies
$ 22,357 $ 0 $ 22,357 Book stores
news dealers
$ 71,182 $ 0 $ 71,182 Book stores (NAICS 451211) $ 66,290 $ 0 $ 66,290 News dealers and newsstands (NAICS
$ 4,892 $ 0 $ 4,892 General merchandise
$4,714,322 $1,779,771 $2,934,551 Department stores
$639,759 $175,072 $464,687 Other general merchandise stores
$4,074,563 $1,604,699 $2,469,864 Warehouse clubs and supercenters
$3,692,542 $1,591,453 $2,101,089 All other general merchandise stores
$382,021 $ 13,246 $368,775
goods and confectionery and nut
445299)
(NAICS 446)
(NAICS 44611)
(NAICS 44612)
44613)
44619)
44814)
(NAICS 4482)
(NAICS 4483)
(NAICS 44831)
and leather goods stores (NAICS 44832)
(NAICS 45111)
and
and
stores (NAICS 45114)
and
451212)
stores (NAICS 452)
(NAICS 4523)
(NAICS 452311)
(NAICS 452319)
0 - 1 mi 2023 Demand 2023 Supply Opportunity Gap/Surplus

16178 S Henrici Rd, Oregon City, OR 97045 Sitewise Online Retail Market Power Opportunity Gap Report By Retail Store Types
store retailers (NAICS 453)
(NAICS 4531)
supplies, stationery, and gift stores (NAICS 4532)
and stationery stores (NAICS 45321)
and souvenir stores (NAICS 45322)
merchandise stores (NAICS 4533)
miscellaneous store retailers (NAICS 4539)
45391)
(NAICS 45392)
(mobile) home dealers (NAICS 45393)
(NAICS 45399)
(NAICS 453991)
other miscellaneous store retailers (except tobacco stores) (NAICS 453998)
72233)
GAFO (General merchandise, Apparel, Furniture and Other) represents sales at stores that sell merchandise normally sold in department stores. This category is not included in Total Retail Sales Including Eating and Drinking Places.
16178 S Henrici Rd, Oregon City, OR 97045
$799,954 $119,219 $680,735 Florists
$ 38,755 $ 0 $ 38,755 Office
$149,450 $ 0 $149,450 Office supplies
$ 61,990 $ 0 $ 61,990 Gift,
$ 87,460 $ 0 $ 87,460 Used
$115,511 $ 0 $115,511 Other
$496,238 $119,219 $377,019 Pet
$157,142 $ 32,715 $124,428 Art
$ 71,444 $ 0 $ 71,444 Manufactured
$ 57,081 $ 0 $ 57,081 All
$210,570 $ 86,505 $124,066 Tobacco stores
$ 58,196 $ 17,077 $ 41,119 All
$152,374 $ 69,428 $ 82,946 Non-store retailers
$6,477,172 $602,175 $5,874,997 Electronic shopping
$6,200,540 $602,175 $5,598,365 Vending machine operators (NAICS 4542) $ 33,100 $ 0 $ 33,100 Direct selling establishments (NAICS 4543) $243,532 $ 0 $243,532 Fuel dealers (NAICS 45431) $143,331 $ 0 $143,331 Other direct selling establishments (NAICS
$100,201 $ 0 $100,201 Food services and drinking places (NAICS 722) $4,795,269 $958,837 $3,836,432 Special food services (NAICS
$376,007 $153,204 $222,803 Food service contractors (NAICS 72231) $299,582 $ 20,766 $278,816 Caterers (NAICS 72232) $ 68,991 $132,438 -$63,447 Mobile food services (NAICS
$ 7,434 $ 0 $ 7,434 Drinking places (alcoholic beverages)
$166,860 $225,792 -$58,932 Restaurants and other eating places
$4,252,402 $579,840 $3,672,561 Full-service restaurants (NAICS 722511) $2,130,644 $ 10,258 $2,120,386 Limited-service restaurants (NAICS 722513) $1,800,624 $569,583 $1,231,041 Cafeterias, grill buffets, and buffets (NAICS
$ 45,901 $ 0 $ 45,901 Snack and nonalcoholic beverage bars (NAICS
$275,234 $ 0 $275,234 GAFO* $8,574,627 $1,953,501 $6,621,127 General Merchandise Stores-452 $4,714,322 $1,779,771 $2,934,551 Clothing & Clothing Accessories Stores-448 $1,835,011 $ 0 $1,835,011 Furniture & Home Furnishings Stores-442 $821,024 $ 0 $821,024 Electronics & Appliance Stores-443 $591,311 $ 0 $591,311 Sporting Goods, Hobby, Book, Music Stores-451 $612,810 $173,729 $439,080 Office Supplies, Stationery, Gift Stores-4532 $149,450 $ 0 $149,450 *
Miscellaneous
novelty,
and pet supplies stores (NAICS
dealers
other miscellaneous store retailers
(NAICS 454)
and mail-order houses (NAICS 4541)
45439)
7223)
(NAICS 7224)
(NAICS 7225)
722514)
722515)
Retail Market Power Opportunity Gap Report By Retail Store Types
0 - 1 mi 2023 Demand 2023 Supply Opportunity Gap/Surplus

16178 S Henrici Rd, Oregon City, OR 97045 Sitewise Online
Retail Market Power Opportunity Gap Report By Retail Store Types
Retail Market Power Opportunity Gap Report By Retail Store Types
Retail Market Power data is derived from two major sources of information. The demand data is derived from the Consumer Expenditure Survey (CE Survey or CEX), which is fielded by the U.S. Bureau of Labor Statistics (BLS). The supply data is derived from the Census of Retail Trade (CRT), which is made available by the U.S. Census. Additional data sources are incorporated to create both supply and demand estimates. The difference between demand and supply represents the opportunity gap or surplus available for each merchandise line in the specified reporting geography. When this difference is positive (demand is greater than the supply), there is an opportunity gap for that merchandise line; when the difference is negative (supply is greater than demand), there is a surplus.
Copyright © 2023 Environics Analytics. All rights reserved.
S Henrici Rd, Oregon City, OR 97045 0 - 1 mi 2023 Demand 2023 Supply Opportunity Gap/Surplus
16178
16178 S Henrici Rd, Oregon City, OR 97045
June 4, 2024
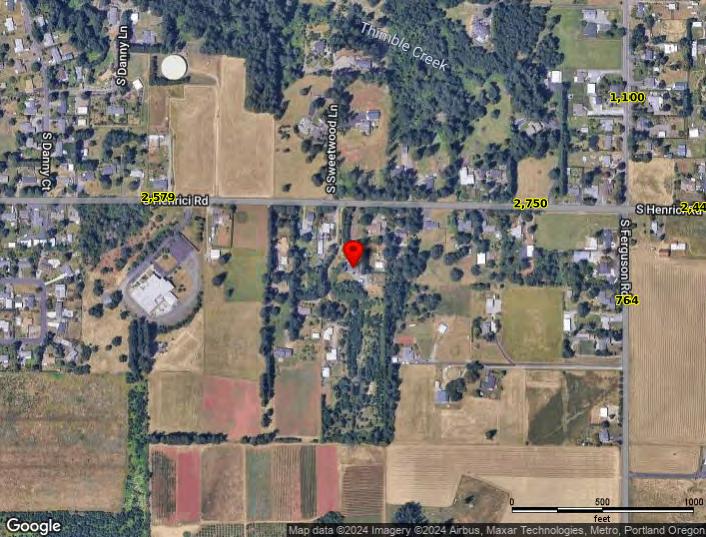
Powered by Sitewise Data Source: Kalibrate TrafficMetrix
Traffic Listing
Map # Street Cross Street Dir. Volume Type/Year Dist. (mi) 1. S Henrici Rd S Ferguson Rd E 2,750 Published (2000) 0.2 2. S Henrici Road S Danny Ct W 2,579 Current Year 0.2 3. S Ferguson Rd S Henrici Rd N 764 Current Year 0.3 4. S Ferguson Rd S Henrici Rd S 1,100 Published (2000) 0.3 5. S Henrici Rd S Jasan Dr E 2,445 Current Year 0.4 6. S Henrici Road S Athens Ct NE 2,228 Current Year 0.5 7. S Henrici Rd S Meadow Ln E 3,280 Current Year 0.5 8. S Beavercreek Road S Tioga Rd SE 8,018 Current Year 0.6 9. S Beavercreek Rd S Henrici Rd NW 8,778 Current Year 0.6 10. S Beavercreek Rd S Henrici Rd SE 10,788 Current Year 0.7 11. South Ferguson Road Meyrick Rd S 808 Current Year 0.7 12. S Henrici Road S Patsy Dr W 3,097 Current Year 0.8 13. South Beavercreek Road Timbersky Way SE 11,331 Current Year 0.9 14. South Henrici Road 4,075 Current Year 0.9
