4 minute read
I. Introduction

from The EKOEXCEL Effect
by NewGlobe

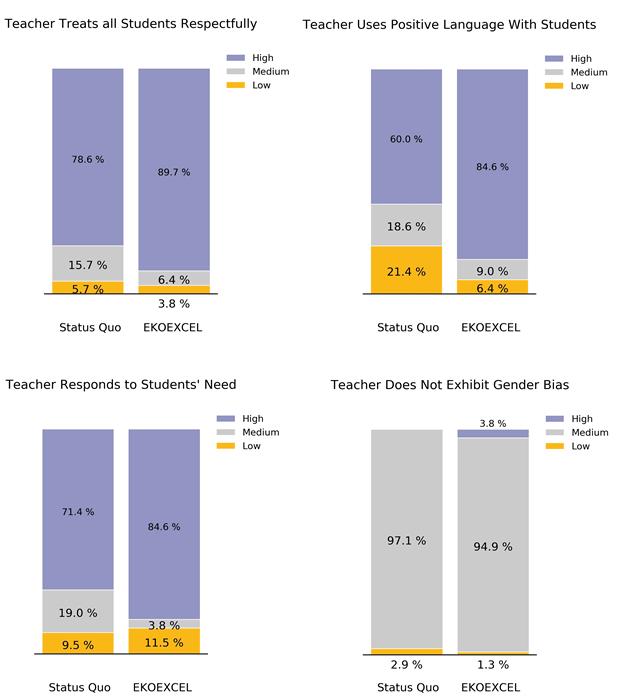
Figure 8. EKOEXCEL Drives Changes in Each Supportive Learning Environment Behavior
In establishing positive behavioral expectations, EKOEXCEL teachers are more likely to score high on setting clear expectations (8.5%), acknowledging positive student behavior (52.6%) and redirecting misbehavior (16.7%).
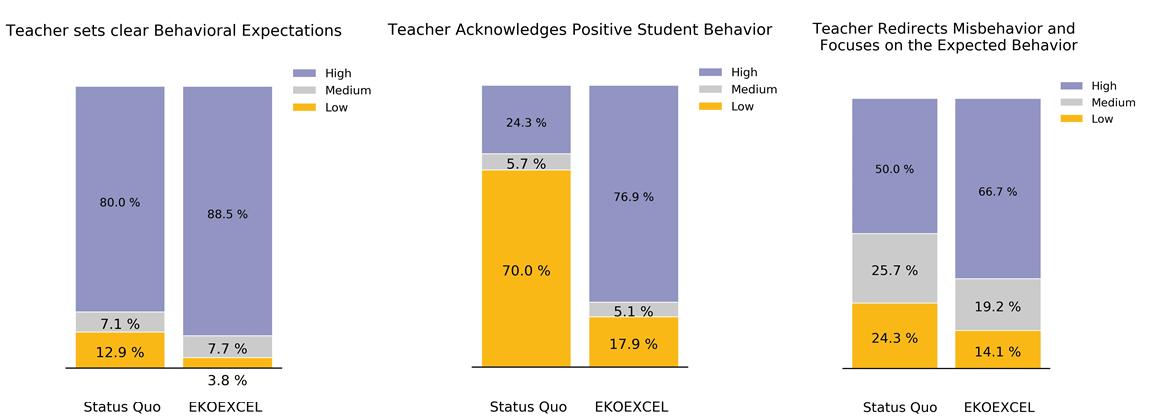
Figure 9. EKOEXCEL Drives Changes in Each Positive Behavioral Expectation Behavior Technical note: These differences in classroom culture are statistically significant. We examine the difference between EKOEXCEL classrooms and control classrooms by treating the element score (from 1 to 5) as a continuous variable. Our first model uses linear regression to estimate the impact of EKOEXCEL by solely looking at the average element score difference between the treatment and control schools.6 We find on average that EKOEXCEL classrooms score 0.33 and 0.93 points higher (statistically significant at the 95% level) on both the Supportive Learning Environment and Positive Behavioral Expectations respectively. Because the size of the classroom, length of the class, grade, subject of the lesson, segment (first 15 minutes versus last 15 minutes) and LGEA relate to overall scores, our second model controls these aspects. Our estimates of the impact change only slightly, but as these added controls increase the precision of our estimates, our model with controls is our preferred estimate of the EKOEXCEL impact on classroom culture. These estimates can be seen in Table 5 in the Appendix.
With respect to the environment of the overall school community, the school management survey results indicate similar levels of parental engagement at EKOEXCEL and control schools. The average score from 0 to 3 on the three-question parent engagement category is 2.0 for EKOEXCEL and 2.2 at control schools, with no statistical difference. Most head teachers from both school types report that PTA meetings and open days are lines of communication between parents and the school, and that the schools do encourage and guide parents to be active in their child’s schooling, although the explanations provide varying levels of detail. The school management survey also captures an element of the overall school environment through questions about the goals of the school and the extent to which teachers, the community, and school system leadership actively support these goals. Again, results show no statistical difference. When queried on goal specificity for student learning and improvement, and details about active support for the goal, responses by head teachers at EKOEXCEL schools averaged 6.4 of 10 compared to 5. 9 of 10 at control schools.
6 Due to time constraints, Teach was not conducted at the baseline. Because student levels looked similar at the baseline (see https://docs.google.com/document/d/1KoLbc2jbWOVgyhkTb404OXoUA0jonYlXetBVQyE6_Qg/edit) our assumption is teaching practices would be the same at EKOEXCEL schools and control schools in the absence of the treatment.
Instructional Quality Results: No Clear Differences in the Classroom
Differences in Instructional Quality do not yet appear to have manifested, at least through the lens of the Teach tool. The EKOEXCEL theory of change argues that improvements in school management, teaching practices, and better alignment with pupil academic needs are the key drivers in improving overall instructional quality. The Teach instrument measures lesson facilitation, checks for understanding, feedback, and critical thinking. Across these elements, we do not see any statistically significant differences.
Figure 10. Instructional Quality Estimates Similar Treatment and Control

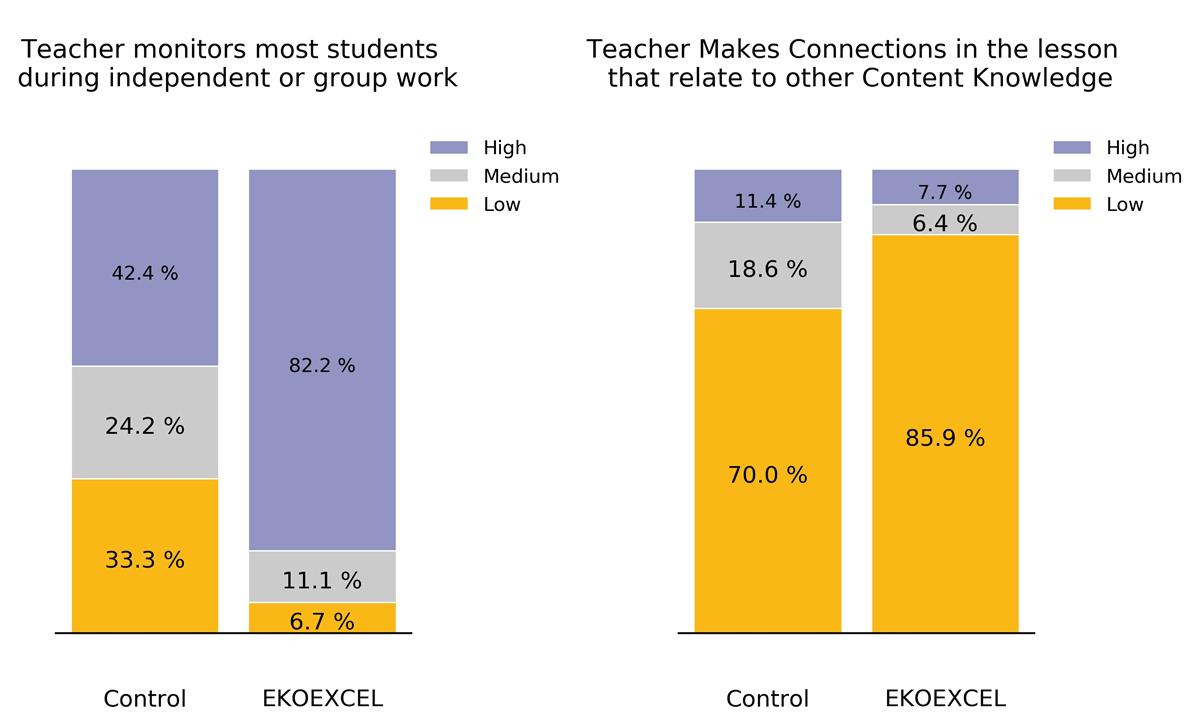
However, there are specific behaviors where we see differences between EKOEXCEL and comparison schools. During independent work, EKOEXCEL teachers were much more likely to monitor student work, as 93.4% of teachers at EKOEXCEL schools scored high or medium on this behavior relative to 66.6% at control schools. Separately, teachers at control schools were more likely to make connections in the lesson that relate to other content knowledge, with 30.0% scoring high on this behavior relative to 14.1% at EKOEXCEL. Given the EKOEXCEL theory of change, these findings are unsurprising. Teachers are trained on using the Check-Respond-Leave method to monitor all pupils during their independent work. Similarly, EKOEXCEL’s instructional approach makes it unlikely that teachers will reference content knowledge beyond the scope of the lesson. Lesson guides are modular and scripted with focused content that introduces, demonstrates, facilitates practice, and reviews each new concept in the skills progression.
Figure 11. Significant Differences in Teacher Behaviors Related to Instructional Quality
Stepping outside of the classroom, the school management survey measures head teacher explanations of expectations for curriculum and teacher lesson plans, and the review and monitoring processes put in place to ensure lesson quality. For these dimensions, we do find a clear difference between EKOEXCEL and comparison schools. EKOEXCEL lesson plans are developed, levelled and reviewed by the EKOEXCEL Instructional Design Team in alignment with the Lagos curriculum and in collaboration with Lagos SUBEB. These detailed lesson plans are provided electronically every day to the appropriate teachers and head teachers. Consequently, EKOEXCEL head teachers do not have to take it on themselves to review lesson plans for curriculum adherence and quality. Similarly, EKOEXCEL head teachers have easy access to all lesson plans through their smartphone, so they are empowered to regularly monitor teachers in the classroom to ensure that the lessons are delivered according to plan. It is therefore not surprising that EKOEXCEL schools average a perfect 1 out of 1 on the lesson plan review details, and a high 0.8 out of 1 on the explanation of the lesson plan monitoring process, while comparison schools score lower at 0.5 out of 1 on both measures. Both differences, shown in Figure 12 below7, are statistically significant at 99% on simple t-tests. On other curriculum components discussed in the survey - instructional resource availability and expectations of a set curriculum and lesson plan - average scores are basically the same for both school types.
7 Results are shown as the percentage of total possible points for the category or item.


