
2 minute read
Table of Contents

from The EKOEXCEL Effect
by NewGlobe

and behaviors emphasized in the EKOEXCEL training. Regarding instructional quality, important procedures for lesson plan and lesson delivery quality assurance are demonstrably more present in the head teacher responses at EKOEXCEL schools.
Time on Task Results: More Time to Learn & Higher Engagement
EKOEXCEL pupils have more time to learn. We examined pupil attendance records and the Time on Task component of Teach. EKOEXCEL Primary 2 girls are 6.7% more likely to be at school than their counterparts (statistically significant at a 90% confidence level). In EKOEXCEL classrooms, it is 9.1% more likely that either all or the majority of pupils are engaged, and when controls are included to account for differences in grades, LGEAs, subjects, time in lesson, and length of lesson, EKOEXCEL results in a 14.9% increase in pupil engagement, which is statistically significant at the 95% confidence level. Regression results for changes in attendance rates and the Time on Task component of Teach can be found in the Appendix (Table 3 and Table 4).
Figure 5. Teach Time on Task
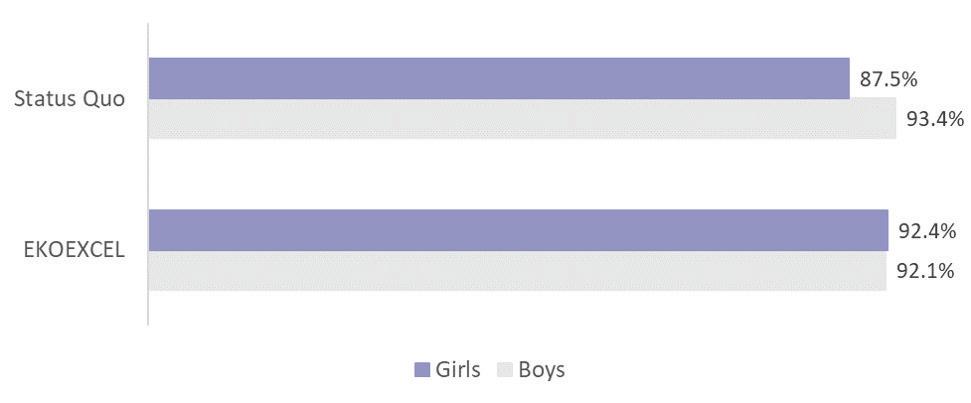
At the school management level, head teachers at EKOEXCEL and control schools report similarly on the presence and details of daily pupil and teacher attendance procedures. Results are statistically indistinguishable. The average item scores (scaled on 0, ½, or 1 point) for daily teacher attendance and daily pupil attendance at EKOEXCEL schools are .97 and 0.8 respectively. At comparison schools, these averages are 0.87 and 0.7. Finally, there is early evidence that EKOEXCEL may have a differential impact on girls’ attendance. At EKOEXCEL schools, girl pupils attended school at a slightly higher rate than boy pupils; more than 92% of the girls were present. At our comparison schools, girl pupils were 6% less likely to attend school than boy pupils.
Figure 6. Attendance Rates Boys and Girls - 13v13 Sample
Learning Environment Results: A Better Classroom Culture
Observers noted significant differences in EKOEXCEL and control school classrooms as measured by the two classroom culture elements in Teach. 87% of EKOEXCEL classrooms receive the two highest ratings for Supportive Learning Environment, compared to 60% of control classrooms. Similarly, Positive Behavioral Expectations in the top two highest ratings are evident in nearly 85% of EKOEXCEL classrooms, compared to just 46% of control classrooms (see Figure 7).
Figure 7. EKOEXCEL Results in Improved Classroom Cultures

The differences in classroom culture are driven by changes across a number of measured behaviors. In forming a supportive learning environment, EKOEXCEL classrooms are more likely to score in the high category on treating all students respectfully (11.1%), using positive language with students (24.6%), responding to pupil needs (13.2%), and challenging gender stereotypes in the classroom (3.8%).


