13 minute read
III. Drivers of Learning

from The EKOEXCEL Effect
by NewGlobe

Figure 14: EGRA Zero Score Reduction
Figure 15: EGMA Zero Score Reduction
Higher Growth Across Subtasks
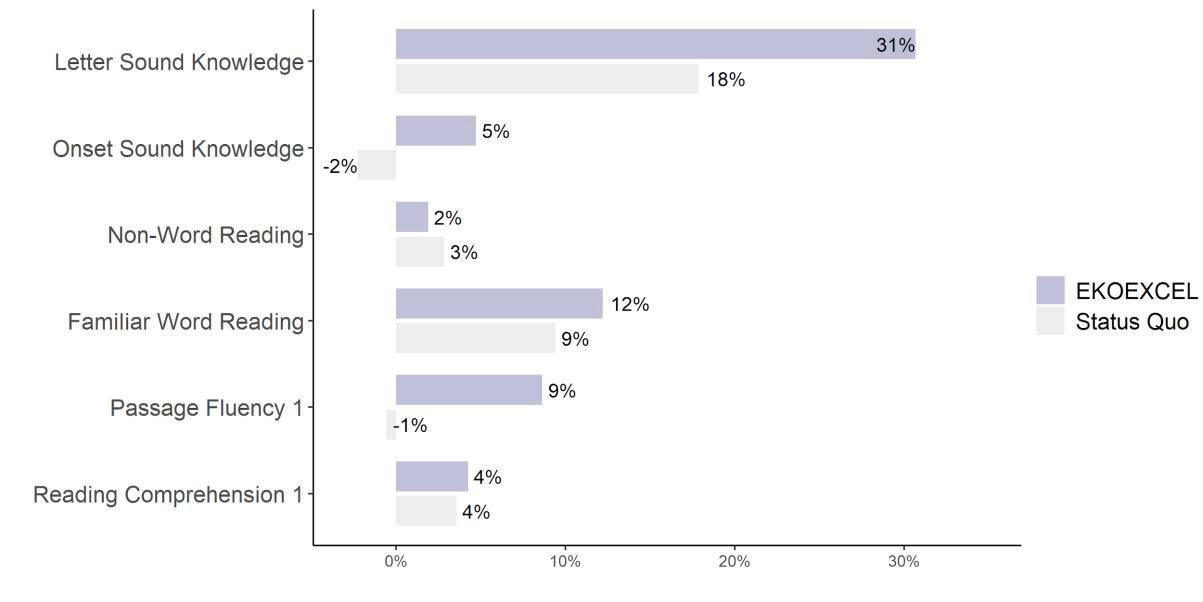
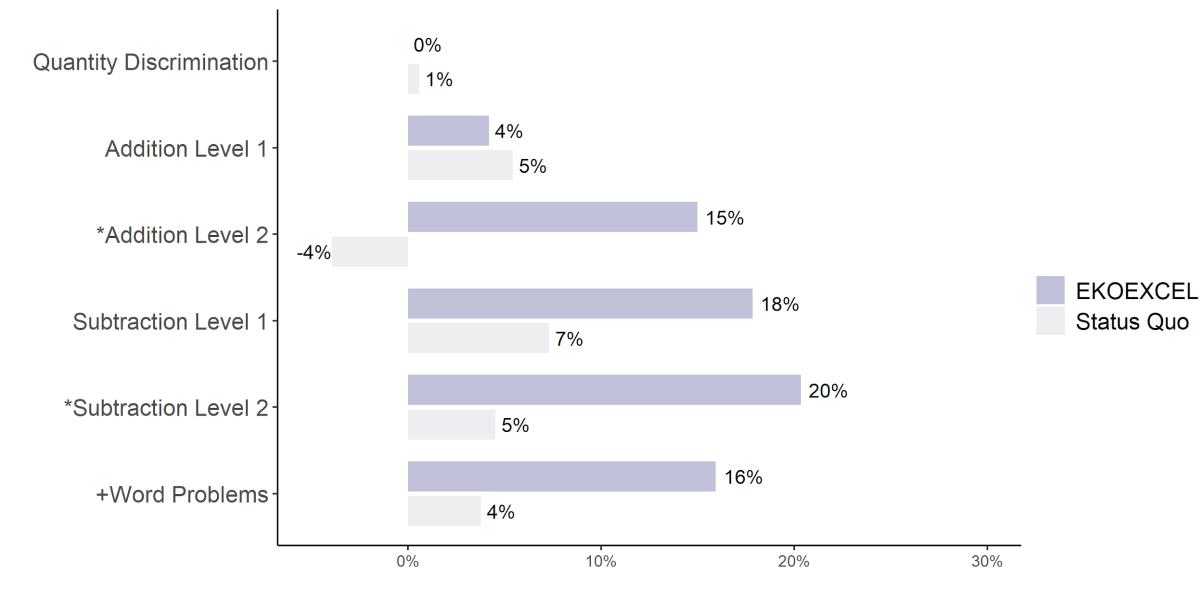
Across subtasks, we find that EKOEXCEL students learned more than their counterparts in control schools (see Figure 16. EGRA Differential Growth by Subtask). While both sets of students started at similar levels at the beginning of Term 2, by the end of Term 2, EKOEXCEL pupils were outperforming their counterparts on all six subtasks. Differences for Primary 2 girls in letter sounds, non-word reading, familiar word reading and passage fluency are statistically significant at a 95% confidence level (see Table 12. EGRA Results for Primary 2 Girls in the Appendix). These differences are also large in magnitude; EKOEXCEL pupils learned an additional 5 letter sounds, read an additional 1.2 non-words, 2.1 familiar words, and 1.8 words in the passage. On EGMA subtasks, we find a similar pattern of higher differential growth for EKOEXCEL. For four of the six subtasks, differences were statistically significant; P2 girls in EKOEXCEL earned an additional 9% between the baseline and midline on Addition Level 2, answered an additional 1.2 questions per minute on Subtraction Level 1, and grew an extra 7% on Subtraction Level 2 (differences on Subtraction Level 2 are significant at a 90% confidence level). The other three subtasks (Quantity Discrimination, Addition Level 1, and Word Problems) show a positive growth differential, though these differences are not statistically significant.
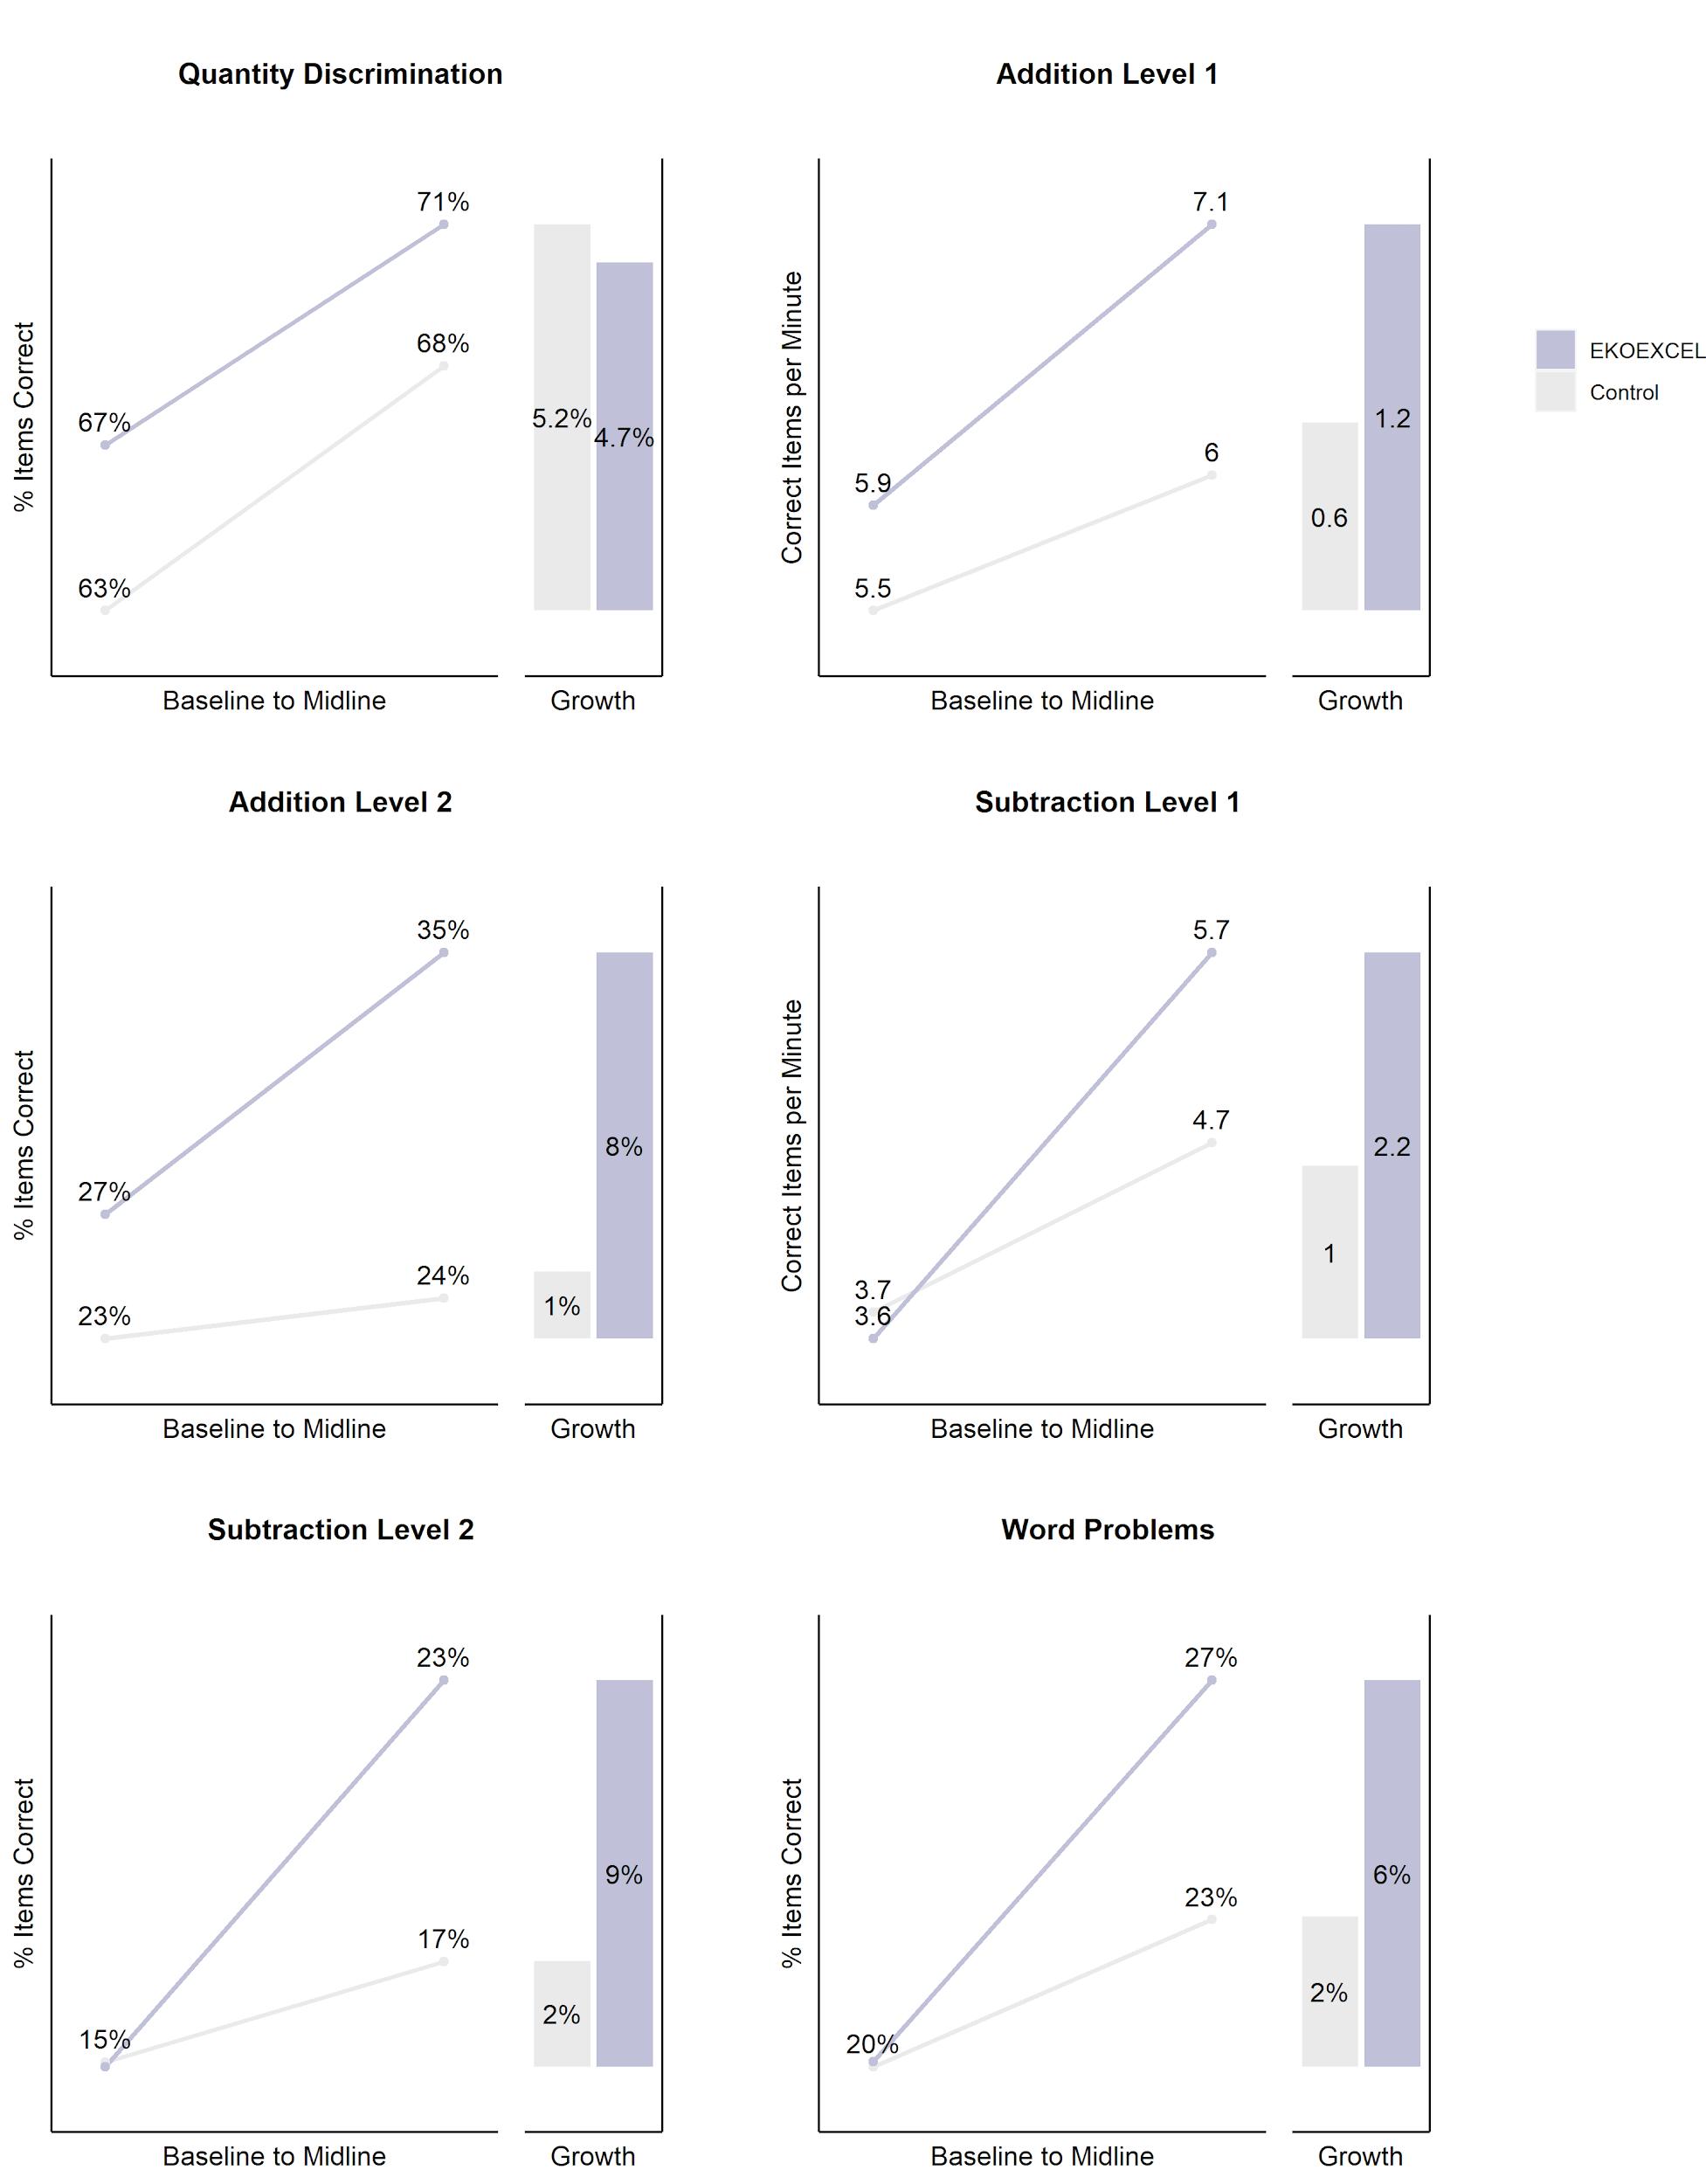
Technical note: We measure pupil growth by estimating the difference between average performance at baseline and average performance at midline. This estimate is restricted to pupils who were available both at the baseline and the midline. We find no pattern of differential attrition between the treatment and control group as seen in Table 9 in the Appendix. In other words, regardless of baseline ability, pupils were equally as likely to be measured at EKOEXCEL and non-EKOEXCEL schools. Figures 16 and 17 below provide raw estimates to better contextualize levels and growths of pupils across subtasks. Statistical significance is calculated by fitting a regression to estimate midline performance as a function of baseline scores (including squared and cubed terms to account for nonlinear growth), age, English as a home language, whether the child had lunch, dinner, and/or breakfast, and (for EGMA) whether the subtasks were conducted in English. Note that the model is not sensitive to controls - in other words, adding more controls increases precision of our estimate but does not change the magnitude of our results. Also note that regression coefficients differ slightly from the simple average differences shown in Figures 16 and 17. The full regression model is as follows:10
midlinei,j = ����0+ ����1*treatmenti,j + ����2*baselinei,j + ����3*baseline2 i,j + ����4*baseline3 i,j + ����5*child_agei,j + ����6*home_language_englishi,j + ����7*lunchi,j + ����8*dinneri,j + ����9*breakfasti,j + ����i,j
10 For the full regression results, see Table 12. EGRA Results for Primary 2 Girls and Table 13. EGMA Results for Primary 2 Girls in Appendix Section EGRA/EGMA Regression Results - Primary 2 Girls.
Figure 16. EGRA Differential Growth by Subtask Figure 17. EGMA Differential Growth by Subtask

Further Progress Toward Literacy
We zoom in on the intervention’s impact on one key subtask: passage fluency. Pupil growth has accelerated quickly under the EKOEXCEL program; excluding the zero scores, we find that EKOEXCEL pupils grew by 4.7 words per minute, while control schools grew by 2.8 words per minute. This higher growth is reflected in more progress along the reading ability continuum from illiteracy to reading proficiency, which educators often define with categories based on reading speed. Using the four categories Non-Reader (0 wpm), Emergent Reader (1-19 wpm), Basic Reader (20 - 44 wpm), and Proficient Reader (45+ wpm), we find that EKOEXCEL pupils have made more progress into the higher categories.11 While the majority of these pupils continue to be either emergent readers (44%) or non-readers (36%), 27% of P2 EKOEXCEL girls have progressed to higher categories, as compared to 23% at control groups. We also observed pupils whose performance dropped a category between baseline and midline. By subtracting the percentage of pupils who drop from the percentage who move up, we calculate the net gain achieved by the cohort of pupils. In EKOEXCEL schools, the net gain is 16.7%, over twice as much as the 7.1% net gain in control schools, as is shown in Figure 18.
Figure 18. Literacy Category Growth Baseline to Midline & Net Gain

More Than Two Times Higher Growth in Literacy and Numeracy
We confirm overall improvement on underlying literacy and numeracy by using Item Response Theory (IRT) to estimate that literacy grew 2.5 times faster at EKOEXCEL schools and numeracy grew 2.1 times faster.
Technical note: the IRT method capitalizes on the fact that we have item-level data for each subtask to estimate overall literacy and numeracy ability. When we look at literacy, we know that identifying letter sounds, being able to read familiar and unfamiliar words, reading passages fluently, and understanding reading comprehension are all aspects of overall literacy. On some items, we would
11 These literacy correct words per minute cutoffs are based on general early grade reading categories referenced in a benchmark setting workshop with USAID in 2015. See USAID (2015). expect the majority of pupils to provide the correct answer (74% of P2 girls identified the familiar word up at the midline). Other items that are much more difficult (only 23% of pupils could answer the first reading comprehension question). IRT creates a performance estimate by determining relative difficulty of items and providing an overall literacy score based on performance on all of these items.
Using these literacy and numeracy measurements, we calculate differential growth by looking at the difference in performance between the baseline and the midline for the treatment group relative to the difference between the baseline and the midline for the control group12. For literacy, we find that control school pupils grew on average 0.18 standard deviations during this period. By contrast, EKOEXCEL schools grew 0.45 standard deviations. Growth was 0.27 standard deviations higher in EKOEXCEL schools. For numeracy, pupils grew 0.20 standard deviations in control schools and 0.43 standard deviations at EKOEXCEL schools, meaning EKOEXCEL resulted in an additional 0.23 standard deviation growth over their counterparts. In other words, EKOEXCEL students grew 2.5 times faster than the control in EGRA and 2.1 times faster in EGMA. These results are large in magnitude and statistically significant (see Table 14. IRT Regression Results Literacy and Numeracy in the Appendix).
Figure 19. Growth is 2.5X higher in literacy and 2.1X higher in numeracy for EKOEXCEL

But what exactly do these scores mean and how do they reflect the types of pupils we see in the classroom? While IRT results in a continuous, standardized score range, we create score range categories13 to better illustrate differences in performances for literacy and numeracy; pupil profiles for bands of scores can be seen in Table 20 below.
12 This is also calculated in a regression framework estimating the midline performance as a function of the baseline performance and EKOEXCEL. We find similar treatment effect estimates as seen in Tables 12 & 13. in the Appendix. 13Score types were binned based on cuts within the data: students scoring below -1.5 standard deviations were scored a 1, between -1.5 and -0.5 a 2, between -0.5 and 0.5 a 3, between 0.5 and 1.5 a 4, between 1.5 and 2.5 a 5 and above 2.5 a six.
Table 20. Pupil Profiles - Literacy and Numeracy
EKOEXCEL was more successful in moving pupils into higher literacy and numeracy categories.. If these gains are maintained, we would expect EKOEXCEL pupils to take just over two terms to advance a category. By contrast, it would take control pupils almost two years to move up a category.
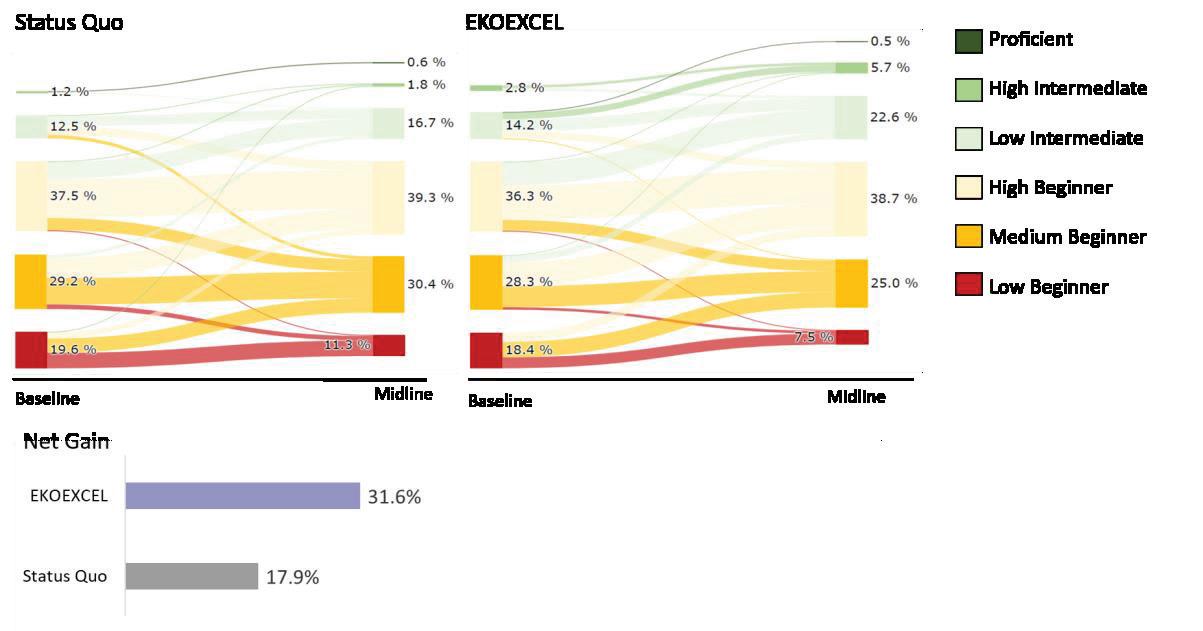
Using the cohort net gain definition introduced in the previous section, we find that the EKOEXCEL schools had a net gain of 40.6% in literacy over the first seven weeks of the program, compared to 12.5% at control schools. On numeracy, the net gain at EKOEXCEL schools was 31.6%, compared to 17.9% at control schools. Figure 21 and Figure 22 below show differences in growth between the treatment and control schools between baseline and midline for literacy and numeracy respectively. Figure 21. Movement on Literacy Between Baseline and Midline
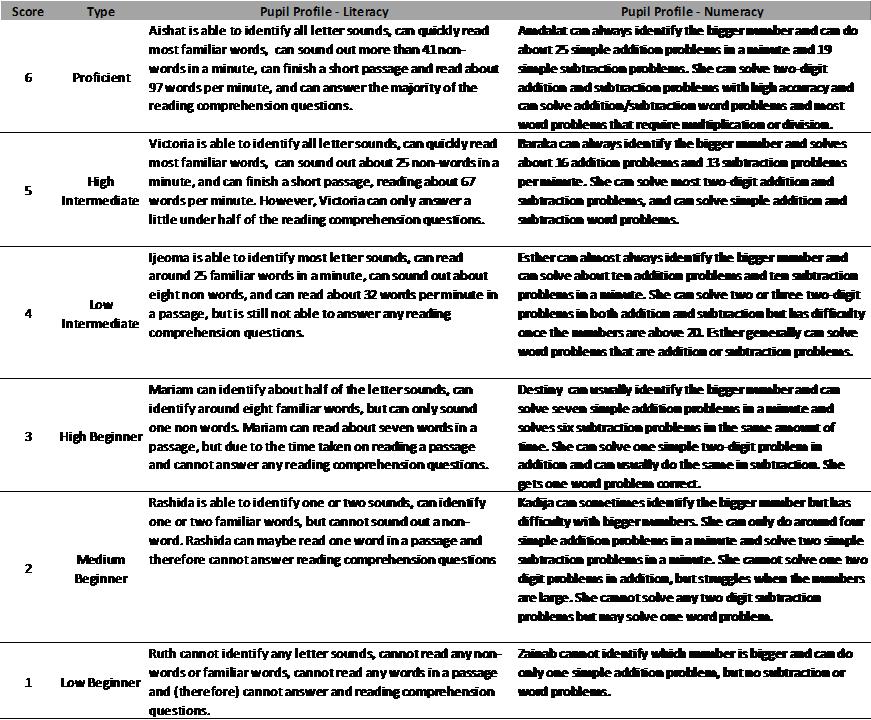
Figure 22. Movement on Numeracy Between Baseline and Midline
We are excited that these results are appearing after only seven weeks of the intervention. Furthermore, while these differences may appear slight at this juncture, they have additive effects that will fundamentally impact pupil performance in the years to come. These additive effects are further explored in Section V.

Pupil Growth for Other Samples
Patterns of differential growth are not just restricted to Primary 2 girls. When we look at our sample of Primary 2 girls and Primary 2 boys at the 26 schools that had assessments for all grades, we see that the results are similar across both samples. Out of the 6 EGRA subtasks, all but Reading Comprehension are the same in direction with only slight differences in magnitude. For EGMA, 4 out of 6 subtasks are the same directionally, with larger differences in Addition Level 1 and Addition Level 2. Differential performance by subtask can be seen in the Appendix in Table 10 and Table 11, which provide EGRA/EGMA differential growth by grade and subtask.
Kindergarten and Primary 5 results from the 26-school sample are less definitive. Unsurprisingly, given the small sample size, we only find three subtasks that are statistically significant. For these three subtasks, we do see positive differential growth for EKOEXCEL schools of substantial magnitude, suggesting EKOEXCEL is having an impact on these grades. On other subtasks, these results are trending in the same direction as our main results but with less significance due to sample size. We believe that our results for Primary 2 can be generalized across all grades.
V. Predicting the Long-term Impact of EKOEXCEL
The shifts in performance we see after only seven weeks in the EKOEXCEL program could have major impacts over the course of the next few academic years. Below, we describe how (under certain assumptions) 68% of EKOEXCEL pupils could become proficient readers by the end of Primary 4 compared to 21% at control schools, and as a cohort achieve stronger fluency than their peers on overall numeracy and literacy skills. Note that all predictions assume continued learning and do not factor in likely learning loss due to COVID-19.
A Cohort Reaching Proficiency on Passage Fluency a Year Earlier
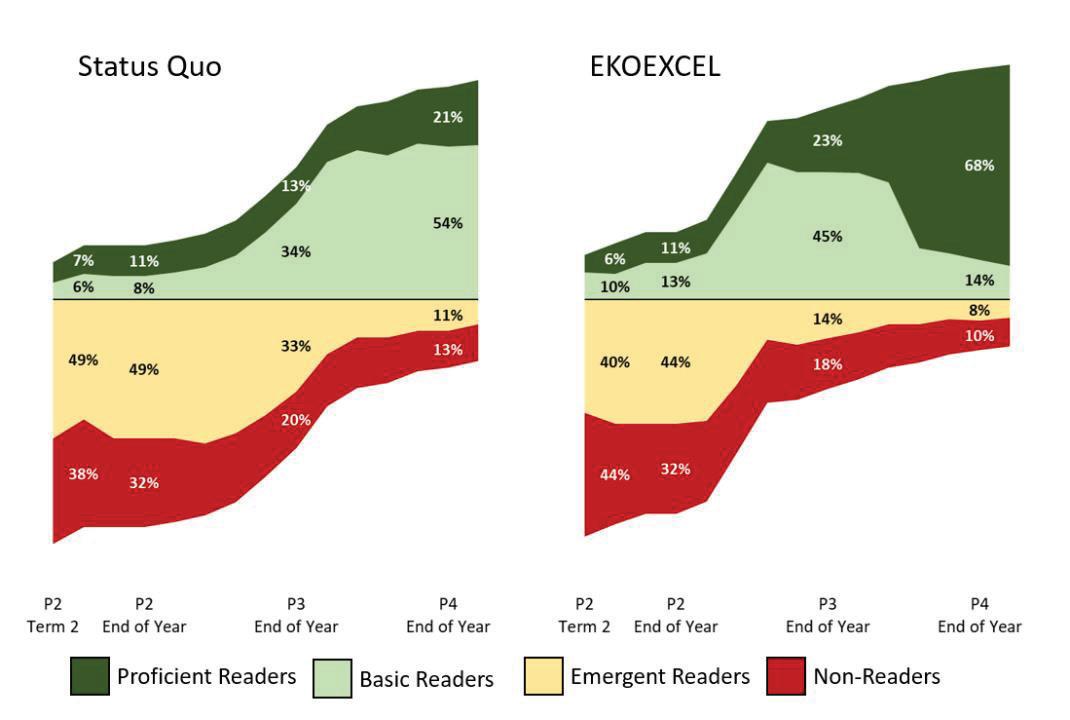
First, we use estimates of growth for non-zero scores (2.8 and 4.7 more words every seven weeks for status quo and EKOEXCEL schools respectively) and model pupil-level growth and the probability of moving from a non-reader to an emergent reader (10% for both groups). We then estimate pupil-level growth over the next two years for each group assuming five 7-week periods per term.14
14 When we extend estimates for status quo schools through term 2 in Primary 5, our estimates roughly align with Primary 5 performance on EGRA measured in January. Figure 23. Predicted Literacy Categories from Primary 2 Term 2 to End of Primary
The impact of the EKOEXCEL school results in a larger proportion of pupils reaching proficiency levels at a faster rate; by the end of Primary 4, just under 70% of pupils at EKOEXCEL schools are expected to reach proficiency while it takes until the end of Primary 5 for the same proportion of pupils to reach the same levels at status quo schools.
Growing More by Learning from Top Performers
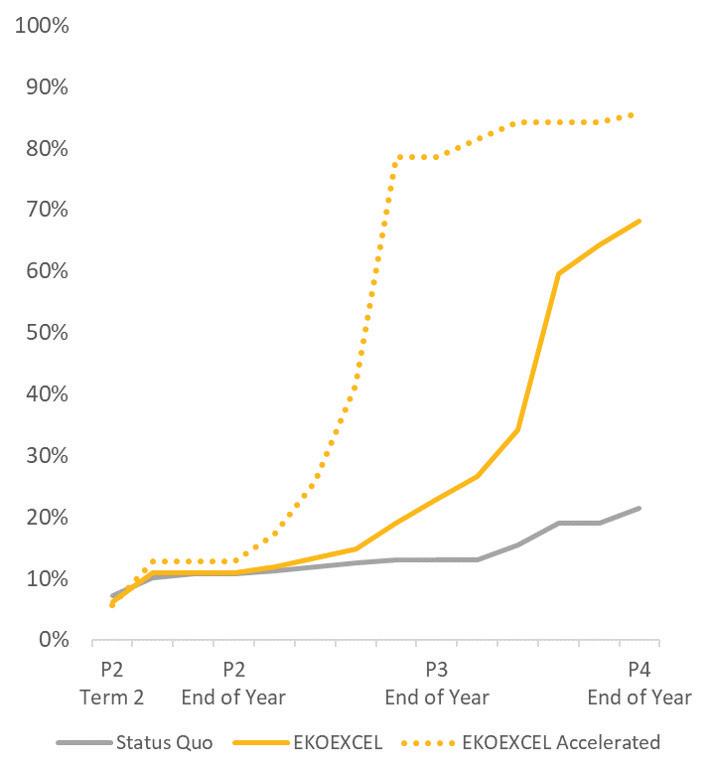
This accelerated growth is impressive, but there is still a large gap to fill. Through improved quality assurance and continued performance management, literacy growth could approach levels seen in the six top performing EKOEXCEL schools, where literacy growth for non-zero pupils averaged 9.0 words per minute and 57% of pupils were transitioned from non-readers to emergent readers. Figure 24. shows how sustained accelerated growth could result in the majority of pupils reaching proficiency before the end of Primary 3. Note that students at the top performing EKOEXCEL schools had similar baseline performance to students at the 6 comparison schools. Furthermore, these comparison schools perform similarly to all other status quo schools. This suggests the observed differences for these positive outlier schools are due to school management rather than underlying differences among students.
Figure 24. Projected Proficiency Growth by Treatment & Top Performing Schools
Accelerated Learning in Literacy and Numeracy
These predictions, though, are based solely on passage fluency scores, and do not take into account overall movement in literacy across subtasks, including reading comprehension ability.They also do not include any projection estimates on numeracy. To make these projections, we can use the IRT estimates and their literacy and numeracy categorizations.15 Taking this approach, we estimate that by the end of P4, the majority of EKOEXCEL pupils are not only reading fluently, but also have much higher levels of reading comprehension with 88% reaching level 6 (where students can read around 90 words per minute and answer the majority of reading comprehension questions) compared to 7% at control schools.
15 We projected growth using two methods. The first estimated performance based on movement between categories assuming the patterns we observed at midlines persist through the future. For example, at EKOEXCEL, if 20% of pupils moved from level 4 to level 5 between baseline and midline, we assume that 20% of pupils in level 4 at midline will move to level 5 over the next seven weeks. Second, we projected linear growth using the raw IRT values. Our final estimate is derived from averaging these two growth projections. Because this methodology is different from our literacy projections, our IRT category projections do not perfectly align with the literacy proficiency projections. Figure 25. Projected Literacy Performance: Control Schools vs EKOEXCEL

We predict similar differences in numeracy, though the impact appears less pronounced. We find that 48% of pupils reach category 6 - students who can quickly do simple addition and subtraction problems (relying on mental math) and are accurate in solving more difficult addition and subtraction problems using pen and paper. These pupils are also able to ascertain a multiplication or division problem within a word problem and solve it correctly.
Figure 26. Projected Numeracy Performance: Control Schools vs EKOEXCEL


VI. Conclusion
The pandemic-induced school interruption has increased the pressure on schools to accelerate learning for affected pupils. In just a short demonstration period, EKOEXCEL has proven to generate more effective school management, better classroom culture, and more learning opportunities for students. Should the gains observed during this initial period continue over time, schools enrolled in EXOEXCEL will help their pupils to achieve literacy and numeracy proficiency at much higher levels.