
2021 - 2022 CARBON X SchoolBartlettThe18RCof Architecture M.ArchB-Pro Urban Design Design Tutors - Enriquetta Llbares Valls Zachary Fluker History & Theory Tutor - Sheng-Yang Huang Samritha Yogesh - 21042282 Zhengwei Li - 20156995 Nipun Garg - 21130850


2 CARBON X Samritha Yogesh - 21042282 Zhengwei Li - 20156995 Nipun Garg - 21130850 Design TutorsEnriquetta Llbares Valls Zachary Fluker History & Theory TutorSheng-Yang Huang M.ArchB-Pro Urban Design Research Cluster - 18 2021Bartlett2022School of Architecture University College of London London UK


We would like to take this time to thank Enriqueta Llbares-Valls and Zachary Fluker, our design tutors, for helping us with this project. Without their input and direction, this project could not have taken the form it did. We would want to express our sincere gratitude to Sheng-Yang Huang, our history and the ory professor, for helping us build this project and achieve greater heights. We appreciate the assistance from all of the Bartlett School of Architecture and University College London staff members. Finally, we would like to convey our sincere appreciation to our technical instructors, classmates, friends, and family for their unwavering support.
3
Acknowledgement
4 Inspired by Ayn Rand’s character Howard Roark we as a sign it isn’t enough to just have the right buildings that works of the cancer cell. Therefore, we see a great potential in use their environment in more emphatic way. We believe that urbanization can be revitalized by ensuring aware about their surroundings and they can self-scrutinize make them conscious towards the environment. The state less which is the environment in this case, which is why which can be used to propagate this. “I have, let’s say, spent working. I’ve joy in it, then I’m only ture. And I can find possible to me. But my own standards. dition. I may, perhaps, - Ayn Rand, ‘The Preface - Nipun Garg - Samritha Yogesh - Zhengwei Li

5 a group strongly believe in this quote where in urban deworks well. Growth for the sake of growth, is the ideology Urban design which addresses how people perceive and ensuring that the people living on the planet can become more self-scrutinize every step taken towards urbanization which would state of art technology can actually be a voice to the voice we strongly feel that technology is a very powerful tool sixty years to live. Most of that time will be I’ve chosen the work I want to do. If I find no only condemning myself to sixty years of torfind the joy only if I do my work in the best way But the best is a matter of standards—and I set I inherit nothing. I stand at the end of no traperhaps, stand at the beginning of one.” Fountainhead’
6
ANTARCTICA THE GLOBAL CLIMATE INDICATOR
The carbon emissions emitted by the countries in the world is the predominant reason for climate change of Antarctica.

7
Abstract Keeping RC 18’s theme which is “Relational Ur banism & Planetary Urbanisation” in mind, the project starts by understanding the Earth’s prima ry biochemical cycle which is carbon as a complex dynamic system as it identifies the relevant scales leading to relevant research in order to tackle urban issues ranging from the molecular to the planetary Planetarylevel. urbanisation which suggests that opera tional landscapes in the extended urbanisation also needs to be considered unlike present where urbanisation is only conceived as agglomerations, dense concentrations of population etc, has brought atten tion to Antarctica which has become a global con cern due to climate change. Climate change and global warming has triggered the melting of Antarctica, whose weather and cli mate systems are now known to feed into the sys tems of the rest of the world. They can either act as a buffer to change or cease long changes in climate once the triggers have been stabilized. This very reason makes Antarctica the “Global Climate Indi Thecator”.project in response to this and with the belief that “A global issue requires a global action”, cre ates a media gaming platform where people collab orate and are empowered to collect, store and share data on carbon thereby making them understand as to how local acts can have global implications while also pass on the motto “Think Local, Act Global”, that could possibly save this global indicator from disappearing.change which has led to the melting

8 12-2324-3940-4501 Planeteristion through Carbon X Theory & social background - Planet Earth is warming up.... - Time for action.... - How to collaborate? - How to engage users? - How to motivate the users? 02CONTENTSPlanetaryBackgroundofCarbonX - Carbon X - What is Carbon X? - How does the design address carbon? - Evolution of “Colours of Carbon” - Hyphothezing concept of ‘‘Colours of Carbon’’ - Role of colours of carbon in Carbon X 03 Carbon X Interface - Welcome to Carbon X


9 04 Carbon X as a Media Interface - Locate yourself - Profile - Digitised Urban Environment 05 Carbon X- The Carbon Data Bank - Carbon X Data Bank - Sequestration Data - Emission Data - Envisage through the Carbon Lens - Creating assets 06 Carbon X in the real world - Digitised Urban Environment - When augmented reality becomes reality 46-6364-8788-97


10 07 Carbon X as a Gaming Interface - Immerse into the virtual world - Discover the global indicator of climate‘‘Antarctica’’ 08CONTENTSPlanetarycollaborationthroughCarbonX - Think local and act global 09 Appendix - Formation of Antarctica - Anthropogenic dilemma - Discovery of Colours of Carbon - Global representation of Colours of Carbon - Experimentation of urban sequesters in an urban setting - Immersive Environments 98-113 125-185114-125


11 10 Bibliography 186-193

13 01 PLANETERISATION THROUGH CARBON X Planeterisation01 Through Carbon X Theory & Social Background - Planet Earth is warming up.... - Time for action.... - How to collaborate? - How to engage users? - How to motivate the users?
14 CarbonEmissionsinMetricTonnesperYear(mt/yr)thataffectsAntarctica1010101010101010101010101010101010102234567893456789 THE GLOBAL CLIMATE INDICATOR IS MELTING Earth’s ice sheets are depleting, with Antarctica predominantly melting as it contains 90% of the Earth’s ‘‘Climate Change’’ has been triggered. The above graphic depicts the carbon emission emitted by different impacting Antarctica which is the global indicator of climate as it controls the global climate change. ANTARCTICA

Planet Earth is warming up.... warming isn’t a prediction, it is actually happening’’ -James Hansen ‘‘Tragedy of the Commons’’ Tragedy of the commons by Gareth Hardin is a con cept highlighting the conflict between individual and collective rationality. It is a dilemma in which multiple individuals who are rational actors serve their own self-interests and then share the limited resources which will eventually deplete despite the fact that each actor knows this is not beneficial in the long-term. The dilemma therefore arises due to the difficulty in privatising the benefits gained through an individual’s sacrifices to preserve the commons. “Freedom in a common brings ruin to all”-Gareth Hardin (1968) ‘‘Tragedy of the Planet Earth’’ Planet Earth is the global commons in context to planetary urbanization. Thirty years ago, a differ ent future was available but now the future is stolen from us, it is stolen by powerful carbon-polluting interests. Considering Hardin’s diagnosis, it requires us to name the true culprit for the climate crisis which is the human race. Human race’s individual interests as led to depletion of the commons. The consequence of the depletion is ‘‘Climate Change’’.
15 01 PLANETERISATION THROUGH CARBON X
EffectofsealevelrisethatAntarcticacanhaveifitmeltscompletely Earth’s ice because of which different countries and how it is
‘‘Global

16

17 01 PLANETERISATION THROUGH CARBON X
Time for action....
Prisoner’s Dilemma ‘‘Climate Change’’ in Planetary Urbanisation can be considered as a “Prisoner’s Dilemma” where indi viduals are acting in their own self-interest do not bother about the consequences. Climate change is a global problem triggered by the carbon interests which are produced by human race. The conse quence of climate change is melting of Antarctica which is the global climate indicator hence disrupt ing the global climate. To prevent the consequence, it requires individual action by many people, companies and countries around the world. As a result, from the worlds collec tive actions, it will impact the future generations far more than today’s but because the actions required are turbulent, most people choose to let others take the strain, leaving the global problem unaddressed hence this situation is considered as Prisoner’s Di lemma. Collaboration In game theory, the solution to the prisoner’s dilem ma framework presents a situation where two par ties, separated and unable to communicate, must each choose between cooperating with the other or not. The highest reward for each party occurs when both parties choose to co-operate and collaborate with each other. “Collaboration is the optimal solution to a Prisoner’s Dilemma.”
18
COLLABORATION THROUGH SOCIAL MEDIA
The above graphic depicts has to how social media is a popular platform among the population belonging how social media helps to share information at a global level.

19 01 PLANETERISATION THROUGH CARBON X
Social Media One of the ways to greatly influence others and cre ate an open space to reach more people across the world, is by utilising social media that rely on the internet to learn, gather information, entertain, and socialise. A wider message to broader audiences is formed and shared by people around the world through it. Social media platforms can be used not only to share valuable knowledge about the current climate con dition but also to collaborate with artists, activists, politicians, and academic institutions to show how, nowadays, the world is in a constant state of climate emergency. “In a massive audience, even one voice could make a difference.” belonging to various age group and
How to collaborate?

20

- Sam (ChiefBarrettofEducation & Advocacy)
How to engage the users?
Gaming Interface
21 01 PLANETERISATION THROUGH CARBON X
Globally, 2.6 billion people play games and a grow ing number are taking an interest in the environment and conservation. A 2019 UNEP report, playing for the Planet, found that games could engage billions to contribute to solutions to social and environmen tal Gameschallenges.canalso teach important skills or address serious issues, organizations such as ‘‘Games for Change’’ promote the use of games for education and social action, and often involve young people in the creation of games they can use to express them selves on important issues and current events.
“Gaming is one of the biggest communication mediums on the planet.”
22

How to motivate the Incentiveusers?
23 01 PLANETERISATION THROUGH CARBON X
Incentives are one of the driving forces that shape human behaviour in all areas. Whether it be business, government, or game design, they are designed to motivate or encourage people to behave a certain Theway.incentive needs to be high enough to make peo ple do things they don’t want to do, something that a game does in the form of extrinsic incentives (i.e., tangible incentives) such as by awarding the player with victory points, currency, or anything else that could improve their chances of winning. One such incentive to rebalance the carbon cycle is the 100-million-dollar prize which Elon Musk offers through the XPrize competition that would be awarded to the best carbon capture technology. 100 million dollars.... “An incentive is a bullet, a key: often a tiny object with astonishing power to change a situation.’’ - Steve Levitt
24

25 02 PLANETERY BACKGROUND OF CARBON X Planetary02 Background of Carbon X - Carbon X - What is Carbon X? - How does the design address carbon? - Evolution of “Colours of Carbon” - Hyphothezing concept of ‘‘Colours of Carbon’’ - Role of colours of carbon in Carbon X
26


27 02 PLANETERY BACKGROUND OF CARBON X
Carbon X ‘‘In Planetary Urbanization, you think big because you are thinking decades -Kushalahead’’ Pal Singh Role of Carbon X in Urban Design... The role of urban design is to function as a mul tidimensional interdisciplinary interface that deals and transforms the interactions of different aspects of urban life into a tangible form. The increased car bon emissions are a resultant of “The Tragedy of Commons” as described by Gareth Hardin. Com putational intelligence by decoding the voiceless (carbon in this case) can enable a wider democratic process and help sustain the symbiotic relationship between human & nature. In order to bridge the feedback loop between the human and the environment, the project creates “Carbon X” for the environment. A “Media Gaming Interface” that encourages the cities on a whole to reduce carbon emissions via the platform, with the soul motto being to “Think Local and Act Global”. A platform that connects people and gives them the power to generate data and create assets on carbon in order to rebalance the global carbon cycle. To achieve this, the project backs on some of the al ready existing technologies produced by the giants around the world and scientific theories of carbon.
28 What is Carbon X ?
OVERVIEW OF The above graphic depicts an overview of Carbon X as to how it functions concepts it banks on.

29 02 PLANETERY BACKGROUND OF CARBON X OF CARBON X functions in different layers and what are the main technologies and

30

31 02 PLANETERY BACKGROUND OF CARBON X How design addresses carbon? Through hypothesizing concept of colours of carbon.... 1) BLUE CARBON 2) GREEN CARBON 3) RED CARBON 4) BROWN CARBON 5) BLACK CARBON Why colours of carbon ? Besides our individual biological make up, colour perception is less about seeing what is actually out there and more about how our brain interprets col ours to create something meaningful. The percep tion of colour mainly occurs inside our heads and so is subjective—and prone to personal experience.
32 EVOLUTION OF COLOURS OF CARBON The above graphic depicts has to how carbon came into existence and has to how it has evolved on planet

3.5 BILLION YEARS AGO After oxygenation occurred, carbon reached the stratosphere and was transformed into ozone which protects earth from the ultraviolet radiation that gradually allowed life to spread (from the oceans to the land) on planet earth.
33 02 PLANETERY BACKGROUND OF CARBON X
180 MILLION YEARS AGO
Evolution of colours of carbon.......
Initially, the carbon sequestration was found in the sea beds of the “Supercontinent Antarctica” which split into Australia and Antarctica. Formation of Antarctica led to the formation of the world’s largest carbon sequester. 1773 The world’s southernmost and fifth largest continent was discovered- Antarctica. 2006 Melting of Antarctica due to increase in carbon emissions was the first sign of global warming.planet earth.
During differentiation of earth, carbon was par titioned into its core, mantle, crust, & atmosphere which led to the formation of volcanoes that store carbon in their rocks. This is how volcanoes became the first carbon sequesters of planet earth. The carbon dioxide content in the atmosphere after the evolution was much higher than it is presently but it had no negative impact on the planet as they found natural sequester zones like volcanoes and oceans to sequester itself.
“Carbon is omnipresent within the Earth System” 4.5 BILLION YEARS AGO

34

Hypothesis of concept Colours of Carbon....
Drastic climate changes started when ice shelves in Antarctica started melting due to global warming, which alarmed everyone. This led to the study of climate change and its causes that further lead to the study of carbon and its impact on the environment. Carbon came into radar of world climate change be cause of the melting ice caps in the polar regions specifically Antarctica as it consists about 90% of glacier ice. Antarctica is the origin to the discov ery of different colours of carbons as they were first found here. The carbon which was found predominantly in the Antarctica’s atmosphere was termed as Black Car bon as its sediments which were found on the ice caps were black in colour. Some brown sediments were found as well which was coined as Brown Car bon. On further exploration, red pigmentation was found on snow which led to the discovery of Red Carbon. Blue Carbon was termed when researchers found that the sea beds were acting as carbon sinks that eventually led to the discovery of Green Car bon as the Phytoplankton were the ones sequester ing carbon in the oceans.
35 02 PLANETERY BACKGROUND OF CARBON X
36 What is Colours of Carbon? COLOURS OF The above graphic depicts has to how carbon is categorised into different questration locations.

37 02 PLANETERY BACKGROUND OF CARBON X OF CARBON different colours based on its sources of generation or based on its se

38

Role of colours of carbon in Carbon X.......
The concept of colours of carbon plays a crucial role in Carbon X. This concept is the foundation on which Carbon X is built on. Colours of carbon is used to categorise and quantify carbon in an urban environment through point cloud technology. This would help to archive all the carbon data which would be stored in the carbon li brary. The carbon data stored in Carbon X will be come the global carbon monitor. The colours of carbon become a parameter on which the balance of the carbon cycle will be achieved. The balance of colours of carbon can be achieved by increasing urban sequesters. In an urban setting, the colours of carbon are ana lysed through point cloud after which the urban se questers is increased to achieve balance. The colours of carbon give identity to carbon which ultimately helps in reducing the carbon content.
39 02 PLANETERY BACKGROUND OF CARBON X
40

41 03 CARBON X INTERFACE Carbon03 X Interface - Welcome to Carbon X

42

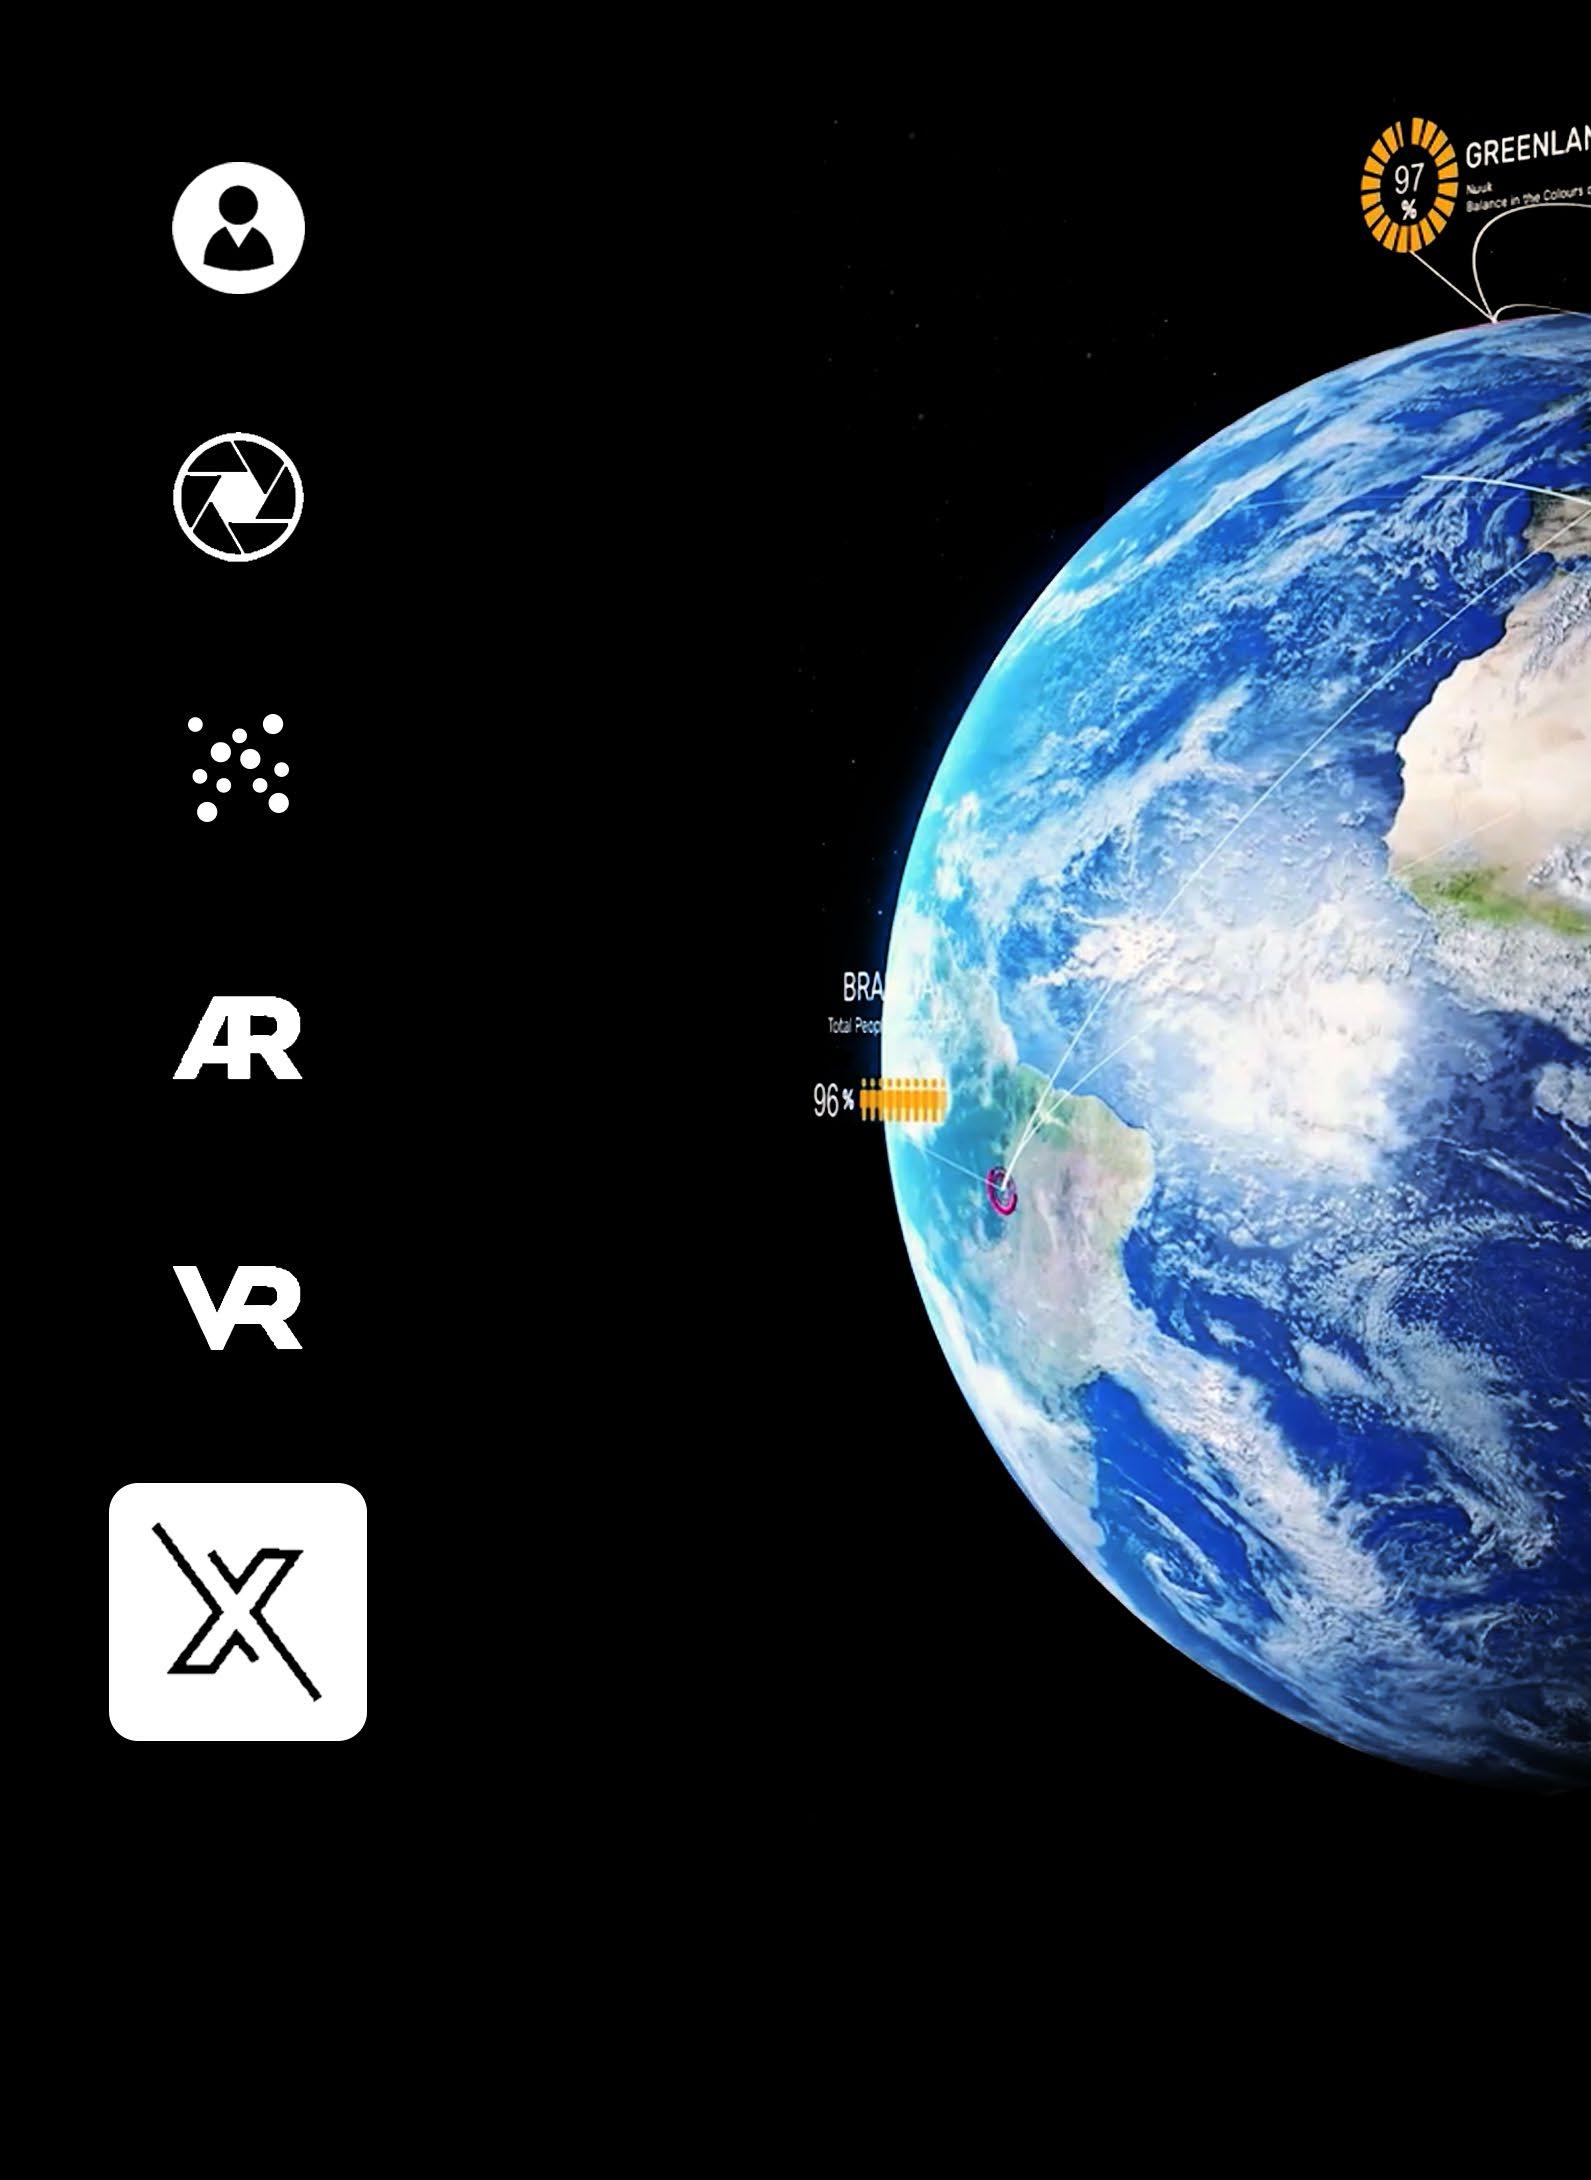
43 03 CARBON X INTERFACE Welcome to Carbon X This is the first step we come across in Carbon X. Here we get a full understanding as to how the inter face works and what are the different modes: MODES: • Profile • Photogrammetry • Point cloud • AR • VR • Media
scribed
The above graphic depicts the structure and basic understanding of to
44 DECIPHERING
give a gist of the functioning of Carbon X. Welcome to Carbon X

45 03 CARBON X INTERFACE
An
DECIPHERING CARBON X the Carbon X interface. overview of the function is de
interface

46

47 04 CARBON X AS A MEDIA INTERFACE Carbon04 X as a Media Interface - Locate yourself - Profile - Digitised Urban Environment
48

49 04 CARBON X AS A MEDIA INTERFACE Locate Yourself...... The first step towards achieving the carbon balance is to locate oneself and explore the surrounding environment. But Throughhow?Google Maps........ The interface helps to orient and track the user by making use of the already existing technology which is Google Maps. How the technology is integrated in Carbon X? To acquaint the users to the presence of carbon around them, Carbon X uses the technology of maps to project the carbon data so that the users can ex plore their urban environment in perspective to the carbon data. Site Selection Carbon X is gaming interface which is designed to be used globally but to explain our interface we are using coal drops yard as a case scenario. Why Coal Drops Yard? • It is an ideal example of an urban regenerated site. • It has a good mix of landscape, buildings, construction sites, open spaces and water bodies. • The concept of Carbon X could easily be ex plained in this location. • Popular location so people can relate better.
50
The above graphic is shown as a split screen with the map The Antarctica map depicts the carbon emission emitted tica. This helps to understand as to how their city is affecting
LOCATING THE USER’S


51 04 CARBON X AS A MEDIA INTERFACE
USER’S CITY IN CARBON X map of the city the user resides in and the map of Antarctica. from the city which contributes to the melting of Antarc affecting Antarctica.

52
The
LOCATING THE USER’S NEIGHBOURHOOD above graphic is shown as a split screen with the map same in the gaming map of Antarctica. The gaming map depicts to and the map also highlights as to how many neighbourhoods

53 04 CARBON X AS A MEDIA INTERFACE
NEIGHBOURHOOD IN CARBON X map of the city’s neighbourhood the user resides in and the depicts the location of the neighbourhood the user belongs neighbourhoods of the city is unlocked in Carbon X.

SITUATING IN CARBON X above graphic depicts the location map which would appear in the Carbon X. environment for the user to have a better understanding of the area the person is situating
54
The

55 04 CARBON X AS A MEDIA INTERFACE X. It’s an overview of the urban situating in Carbon X.
56

57 04 CARBON X AS A MEDIA INTERFACE Profile After locating one-self, the user gets to sign up and create their profile in Carbon X. The profile is basi cally the homepage which gives information about the user in context to Carbon X. But how? Carbon X uses the social network as the medium here. It has built its introductory interfaces keeping the media giants like Facebook and Instagram as a foundation. These technologies will play a very im portant role in Carbon X as it allows users to sign-up for free profiles, to connect with people. How the technology is integrated in Carbon X? To ensure that the users are situating themselves in the area they reside, they have to initially sign up in Carbon X with giving proof of address which will be stored securely in the Carbon X database. This information will help keep a track about the number of users in a particular streets, neighborhoods and city. Next after sign up, they get to create a profile which will be their identity in Carbon X. The profile also shows information about the user which can be seen by other users. This interface will function based on the interface design of Facebook and Instagram.
58 Profile KNOW ABOUT The above graphic depicts the profile template of Carbon X. The profile of their activities in Carbon X. This also acts like a homepage for Carbon

59 04 CARBON X AS A MEDIA INTERFACE ABOUT YOURSELF profile stores the information of the user which helps the user keep a tab Carbon X.

60

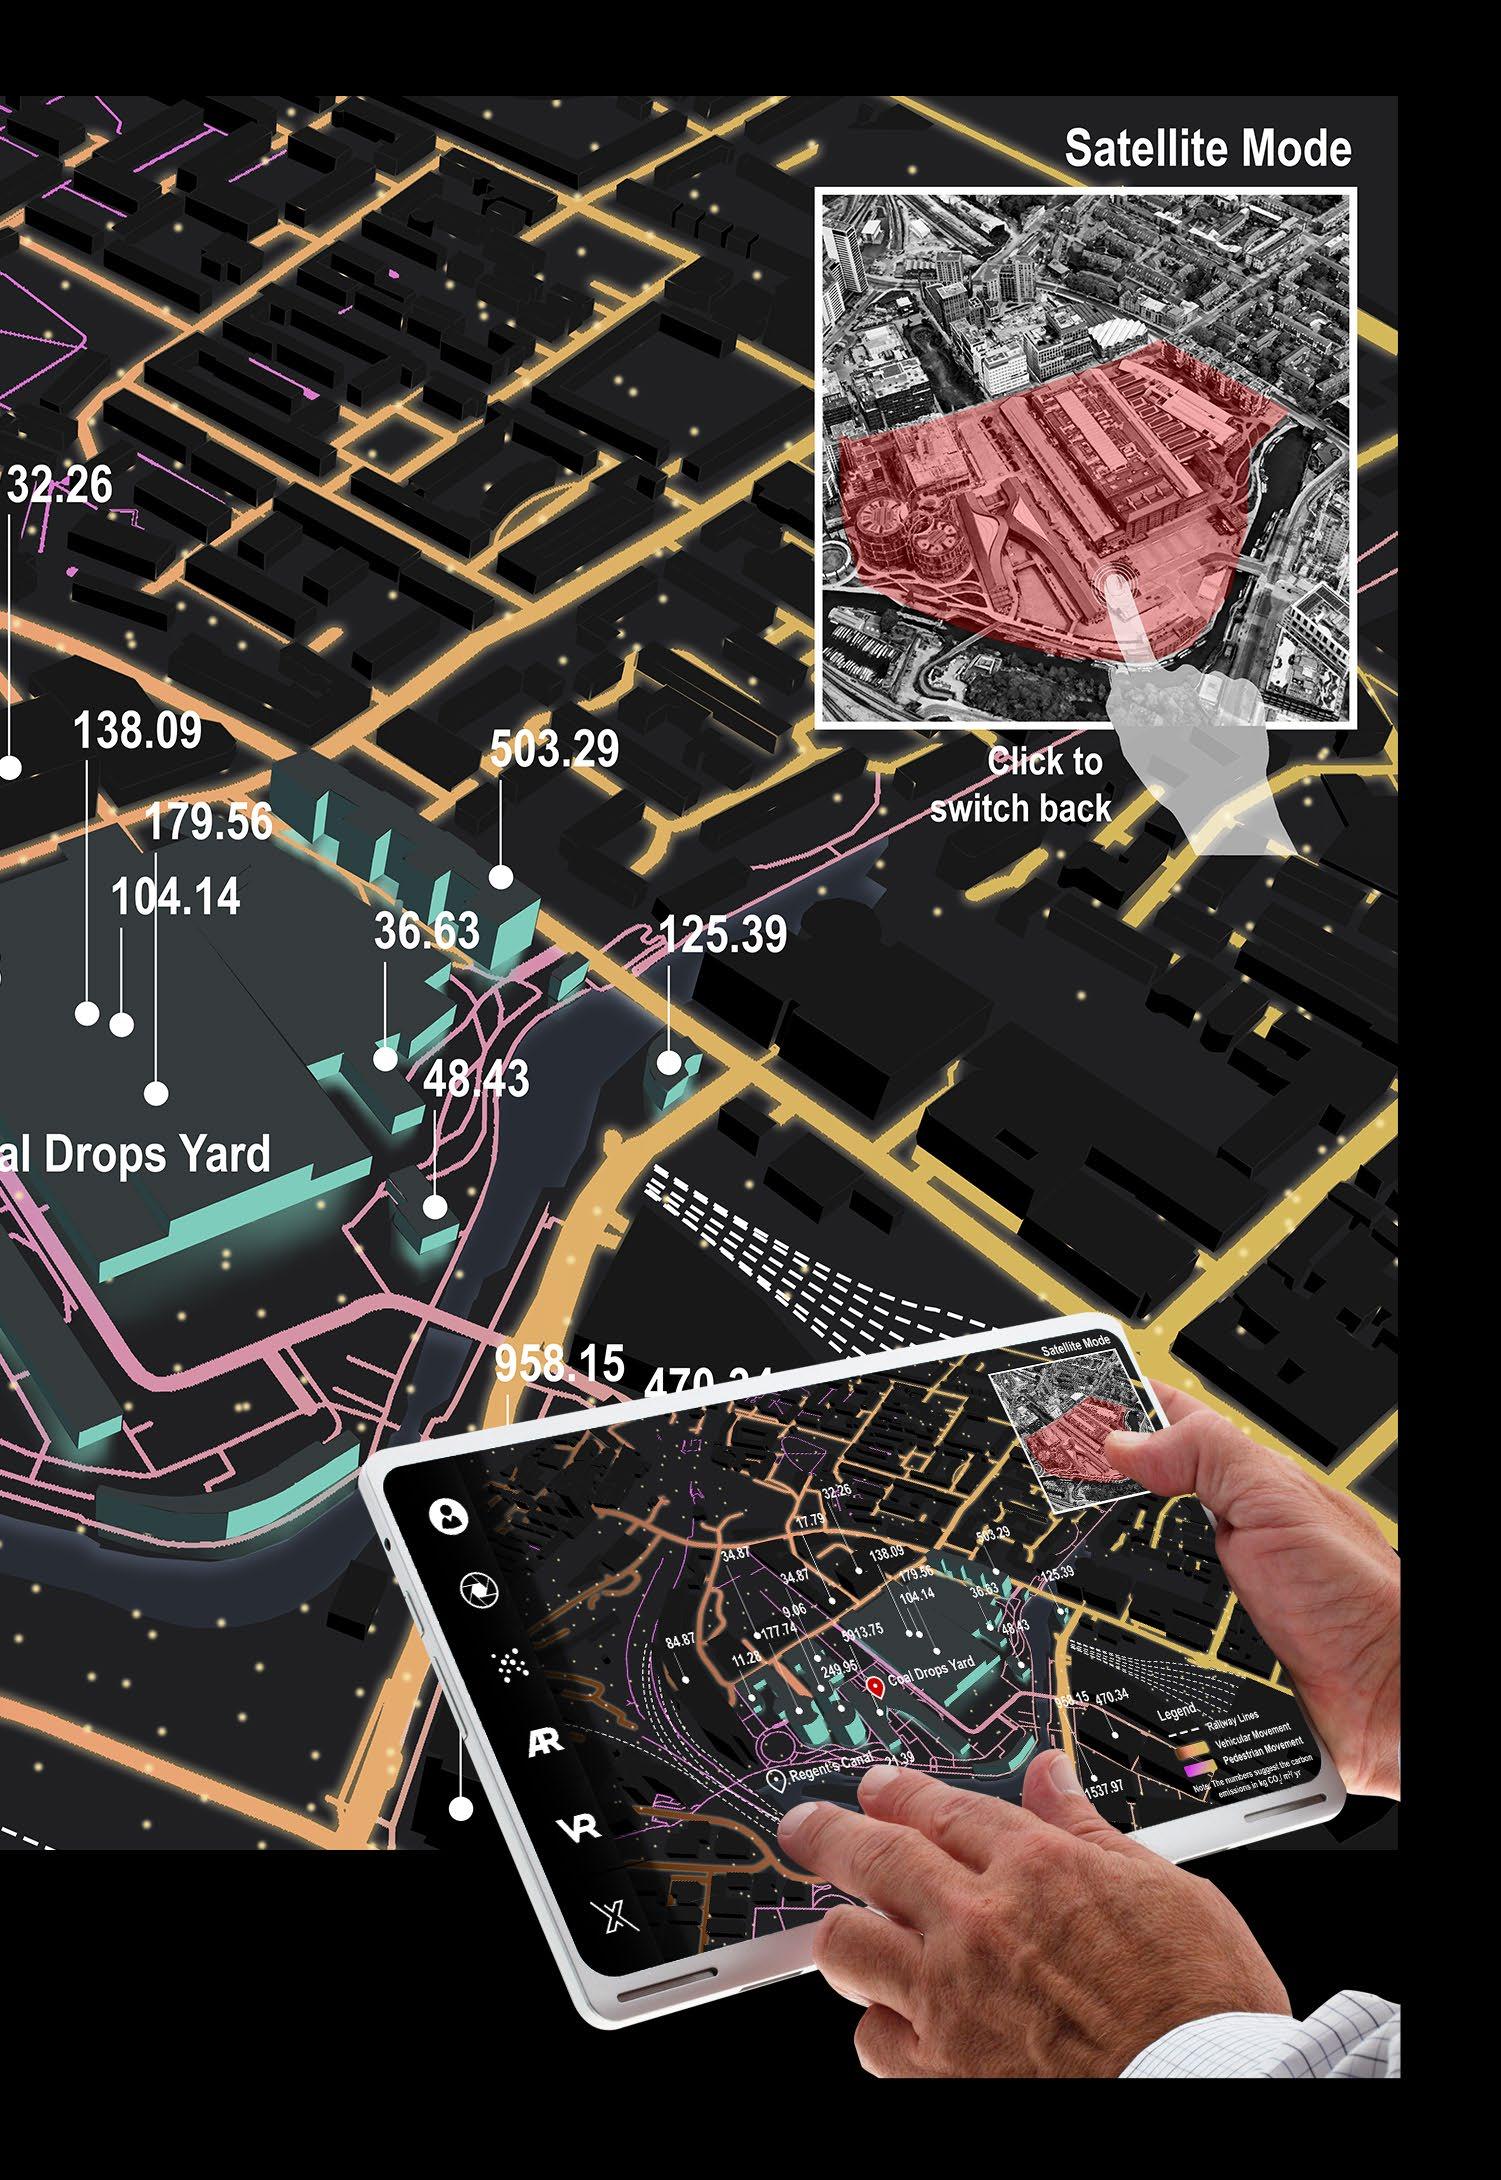
Once the user as created the profile, they officially are ready to explore Carbon X. The first aspect they get to explore is the digitized urban environment. But how? Carbon X uses AR (Augmented Reality) to digitize the urban environment. AR will play a crucial role in visually educating the users about their urban environment as this technology combines virtual in formation with the real world which means it uses Multimedia, 3D-Modelling, Real-time Tracking and Registration, Intelligent Interaction, Sensing and more to digitize the urban environment.
How the technology is integrated in Carbon X? In Carbon X, AR will be used to represent carbon data. The users can visually experience data through AR which means they would be aware about the se questration data and emission data. This would help them to become conscious about their environment. All the carbon data about the urban environment will be in the fingertips of the users by just clicking on the buildings or landscape. To experience all the data at once, the users can see it in the AR mode which is one of the main modes of Carbon X.
61 04 CARBON X AS A MEDIA INTERFACE
Digitized EnvironmentUrban
62 DIGITIZING URBAN The above graphic depicts as to how the urban environment is digitized So when the user clicks on the buildings or landscape the carbon data

ENVIRONMENT
63 04 CARBON X AS A MEDIA INTERFACE
URBAN digitized by using AR technology to represent carbon data in Carbon X. data will appear as AR (Augmented Reality).

64

65 05 CARBON X- THE CARBON DATA BANK Carbon05 X- The Carbon Data Bank - Carbon X Data Bank - Sequestration Data - Emission Data - Envisage through the Carbon Lens - Creating assets
66

67 05
Carbon X Data Bank
This one of the most important aspects of Carbon X is to archive carbon data with which the global car bon emissions can be monitored. The archiving of carbon data will help in tracking the emission which will eventually be a guide to reduce the impact on Antarctica. All the data will be securely archived in the carbon data bank. But how? Carbon X will show carbon data through the integration of google lens, the plantation database of the city and the energy ratings of the buildings database of every city. Note: Since the project is situated in Coal Drops Yard- London to explain Carbon X, RHS (Royal Horticulture Society and EPC (Energy Performance Certificate database by UK government) data is shown. How carbon data is integrated in Carbon X? Carbon X is all about carbon data. The carbon data will be categorized into sequestration data and emis sion data. Since Carbon X is also built on the con cept of sequestrations, the sequestration data will play a very important role in updating the users about the sequestration capacity of the sequesters in their urban environment. The emission data will help the users to understand has to how much car bon emission is happening around them with which they can increase the sequestration to sequester the atmospheric carbon.
CARBON X- THE CARBON DATA BANK
68

The primary foundation of the interface is to in crease the sequestrations in an urban setting and digitally overlay it so as to make the users more aware about the presence of carbon around them. We propose to integrate Google Lens which is an image recognition technology with the al ready existing databases on plantation spe cies created by various cities across the globe such as RHS (Royal Horticulture Society) in our case since the project proposal is in London. This data not only helps users to know about the se questration data around but also aids when the play ers create assets in the following photogrammetry mode. By using these users will not only digitize the their surroundings around them but also create a new database altogether.
69 05 CARBON X- THE CARBON DATA BANK Sequestration Data
70

71 05 CARBON X- THE CARBON DATA BANK Emission Data In addition to the sequestration data of the sur rounding plants, buildings also have their own carbon emissions data which needs to be under stood in order to increase the urban sequestration. We propose to integrate the EPC (Energy Per formance Certificate) database created by vari ous countries across the globe with our interface. This database not only grades the buildings based on their energy usage but also provides the data about the carbon that a particular building emits. This integration along with the sequestration data would help in knowing about the carbon balance status of an urban space.
72

How the technology is integrated in Carbon X? In Carbon X, point cloud will used to categorize car bon into 5 different colors based on its sequestration locations and as to how it is generated. This will be done on the concept of colors of carbon. All the car bon data will be represented in the form of colors of carbon indicator which will depict the quantity of colors of carbon in the environment. Using the indi cator, the analysis of carbon in the environment can be done, based on which the urban sequestration can be increased to sequester more atmospheric carbon and balance the colors of carbon in the environment.
73 05 CARBON X- THE CARBON DATA BANK
Once the user as experienced carbon visually through AR, they can experience the carbon in their surrounding environment in form of colors. The car bon is given identity through colors and points in the point cloud mode. But how? Carbon X uses point cloud technology to give iden tity to carbon. Point cloud will play a crucial role in the analysis of carbon content in the urban environment in Carbon X. Point clouds are used for many purposes, including quantifying carbon data, archiving carbon data and at last giving visual iden tification to carbon through points and color. All this will be achieved through the output of 3D scanning processes.
Envisage through the carbon lens
74 CARBON DATA QUNTIFICATION-1
The above graphic depicts as to how the urban environment is turned is represented in point cloud which is categorised into different colours

QUNTIFICATION-1 turned into point cloud to perceive and quantify carbon. The carbon data colours which is based on the colours of carbon concept.
75 05 CARBON X- THE CARBON DATA BANK

The above graphic depicts as to how the urban environment is turned is represented in point cloud which is categorised into different colours
76 CARBON DATA QUNTIFICATION-2

77 05 CARBON X- THE CARBON DATA BANK
QUNTIFICATION-2 turned into point cloud to perceive and quantify carbon. The carbon data colours which is based on the colours of carbon concept.

78

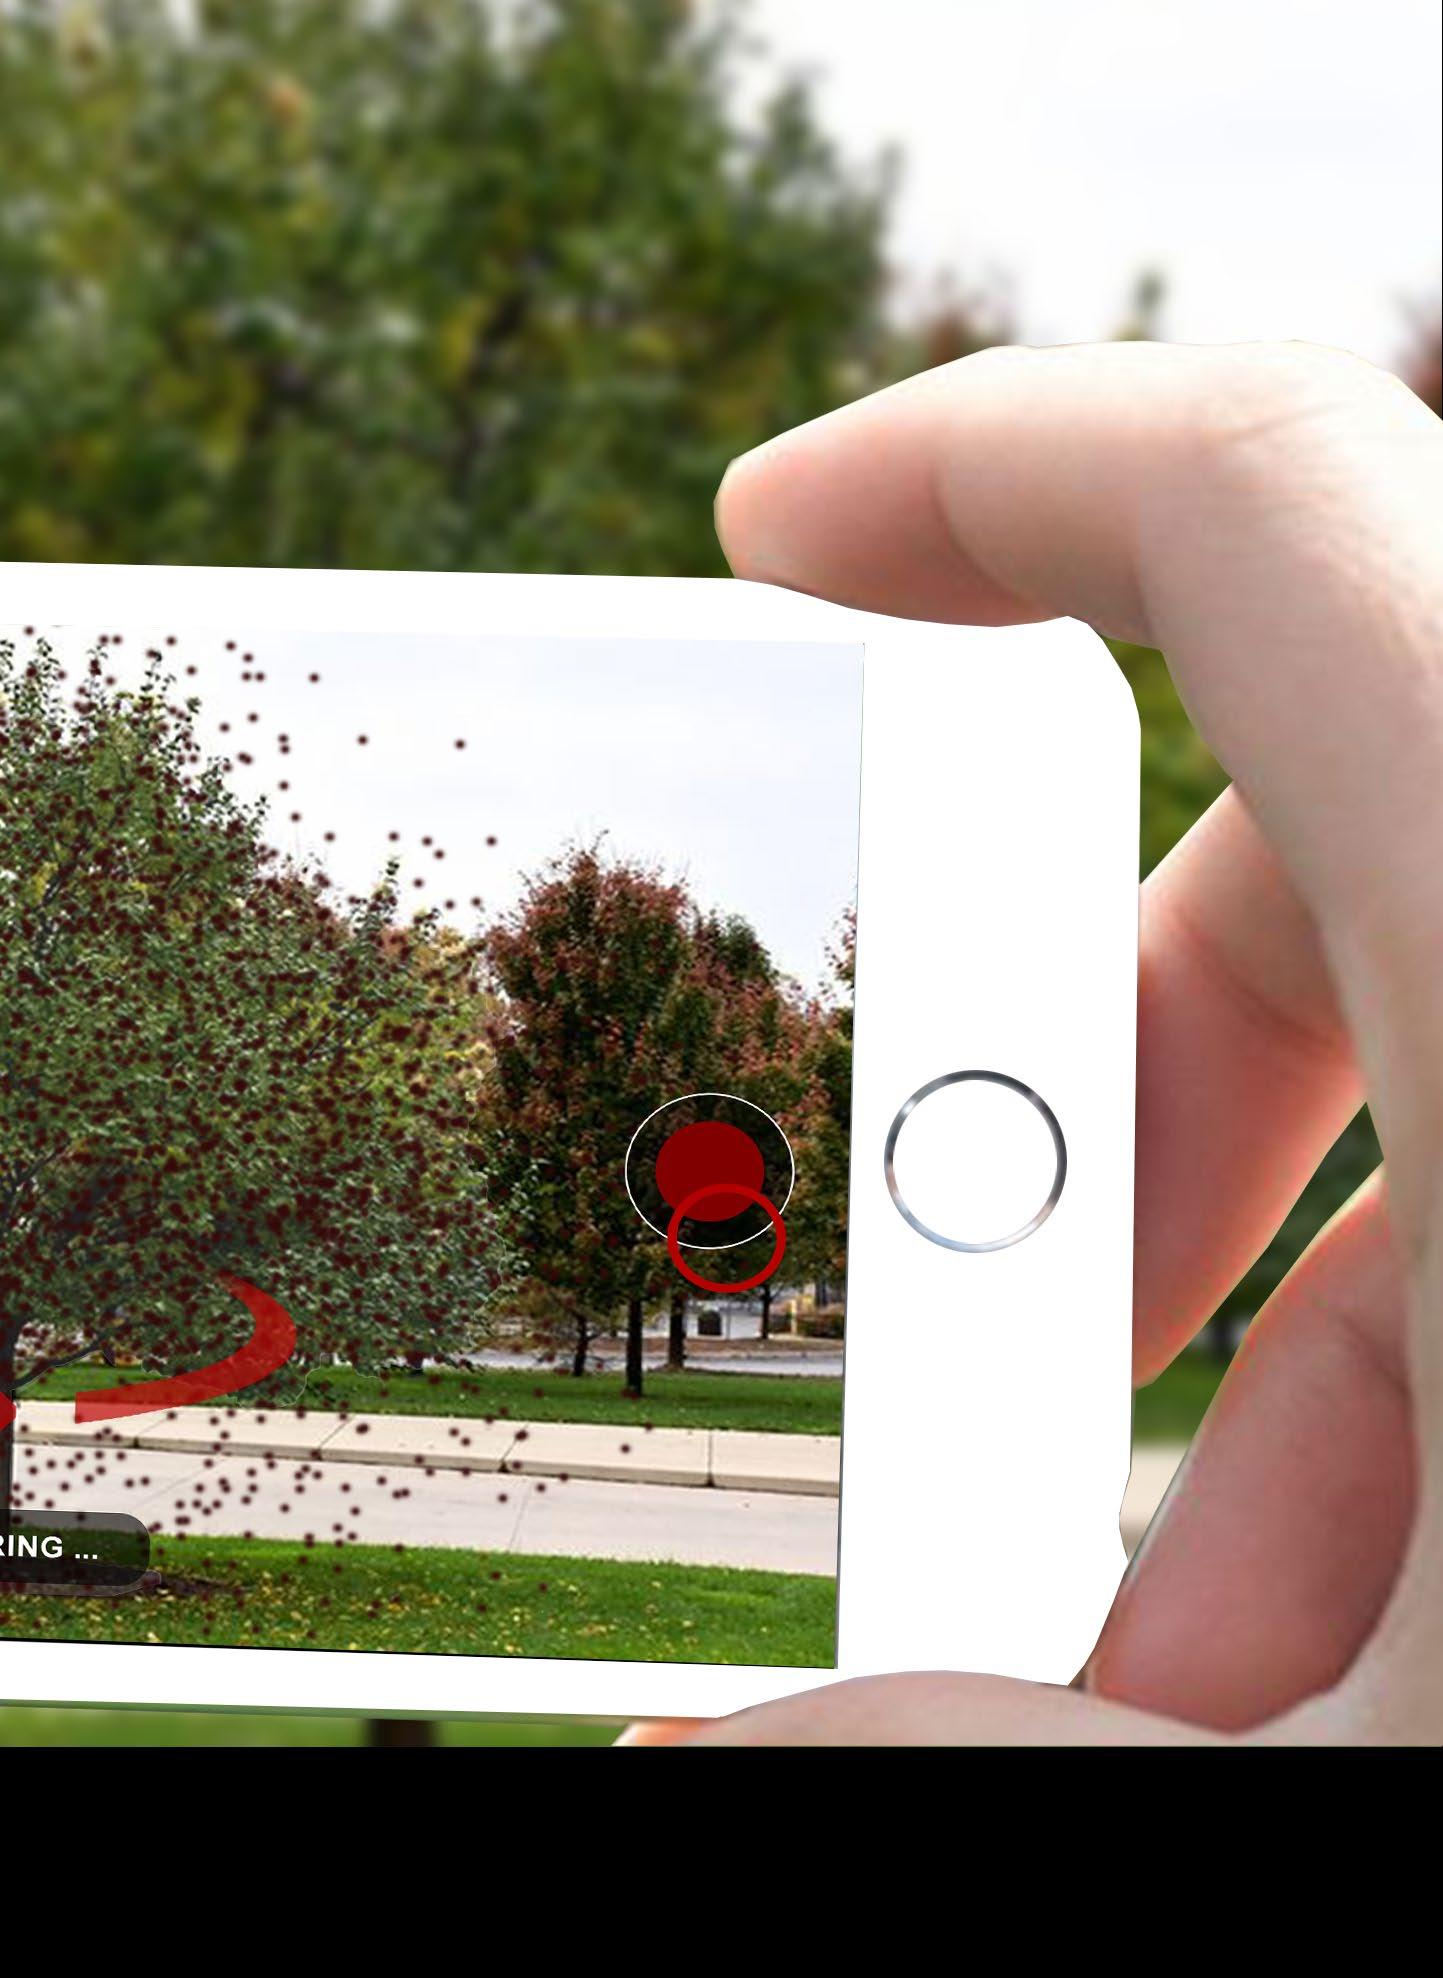
Once the carbon content in the environment is an alysed through the colours of carbon indicator in Carbon X. The next crucial step is to find a way to balance colours of carbon in the environment. This can be done through increase of sequestrations. This step is executed in the photogrammetry mode. But how? Carbon X uses the concept of creating assets to in crease urban sequestrations in the environment. This is implemented in Carbon X through photogrammetry technology. In Carbon X, Photogrammetry will use photos to make measurements between assets and create a geometric representation of the assets themselves, while LIDAR technology will also be used as lasers to detect the position and geometric shape of an object by generating point clouds based on laser shots. How the technology is integrated in Carbon X? In Carbon X, the photogrammetry will be used to create assets. These assets will be saved in the pho togrammetry asset library. The users can select dif ferent kinds of urban sequesters from the library to place in the AR to see as to how to increase urban sequestrations. The assets in the library can be con verted to point clouds to analyse its sequestration capacity. The carbon data collected through these assets will be archived in the carbon data bank and it can be accessed through the google lens technology which is integrated in Carbon X. The asset library will be region sensitive as the library will be cus tomised according to the location of the city keeping its climate and geographic conditions in mind.
CARBON X- THE CARBON DATA BANK
79 05
Creating Assets
80
The above graphic depicts as to how the user can capture the tree using along the arrow to capture the tree.
TO
CAPTURING

81 05 CARBON X- THE CARBON DATA BANK CREATE ASSETS using photogrammetry in Carbon X. In this image the user is guided
The above graphic depicts as to how the captured tree is analysed into
82 POINT CLOUD ANALYSIS

proposed interface.
ANALYSIS clouds using the
83 05 CARBON X- THE CARBON DATA BANK
OF ASSETS into point

84 ASSET IS CREATED AND CONVERTED
The above graphic depicts as to how the captured asset along with its

85 05 CARBON X- THE CARBON DATA BANK
CONVERTED TO POINT CLOUD its point cloud is archived in the photogrammetry asset library

86 PHOTOGRAMMETRY The above graphic depicts the carbon data of various captured assets data which has been collected through asset creations is archived in the carbon data that is attached to various assets uses the databases from

87 05 CARBON X- THE CARBON DATA BANK
PHOTOGRAMMETRY ASSET LIBRARY assets which is archived in the photogrammetry library. All the carbon in the carbon data bank for monitoring the global carbon content. All from the Carbon X data bank.

88

89 06 CARBON X IN THE REAL WORLD Carbon06 X in the real world - Digitised Urban Environment - When augmented reality becomes reality
90
Digitising the urban environment
CARBON X IN THE REAL WORLD
91 06
Once the users have created assets, they can place them in the AR (Augmented reality) to see how to increase urban sequestrations. They have an option to choose from photogrammetry asset library among all the different varieties available. Basically, the us ers will be working in a digitized urban environment. But how? Carbon X uses AR (Augmented Reality) to digitize the urban environment. AR will play a crucial role in visualizing the placing of urban sequestration in the urban environment as this technology combines virtual information with the real world which means it uses Multimedia, 3D-Modelling, Real-time Track ing and Registration, Intelligent Interaction, Sensing and more to digitize the urban environment.
How the technology is integrated in Carbon X? In Carbon X, AR will be used to represent urban sequesters which is the assets. The users can visual ly experience data through AR which means they would be aware about the sequestration data and emission data so based on that; they can according ly place the sequesters. All the carbon data about the urban environment will be in the fingertips of the users by just clicking on the assets. AR will also guide the users to place the sequesters in the right location by showing prohibited signs to places were assets cannot be placed. To experience all the data at once, the users can see it in the AR mode which is one of the main modes of Carbon X.
MICRO-INTERVENTIONS The above graphic depicts as to how the assets in the photogrammetry (Augmented Reality). This is done to see as to how different kinds the urban setting.
92

93 06 CARBON X IN THE REAL WORLD
asset library can be placed in an urban setting through AR of micro- interventions can be done to increase the sequestration in
THROUGH AR
MICRO-INTERVENTIONS photogrammetry

94 AUGMENTED The above graphic depicts as to how the urban setting has been augmented

95 06 CARBON X IN THE REAL WORLD AUGMENTED REALITY augmented by the users through Carbon X.

96

97
06 CARBON X IN THE REAL WORLD
Once the user as placed their assets, they have cre ated in the urban environment in the AR mode. The next step the users can take is to physically place the urban sequesters in the urban environment to increase the urban sequestration to balance the colors of carbon in the environment. But how? Carbon X uses AR (Augmented Reality) to digitize the urban environment through this Carbon X also guides the users as to where and how to place the urban sequesters. This will be governed by the gov ernment or authorities as their databases will also be linked to Carbon X. Once the users get the approv al to place their asset through Carbon X, they can place the urban sequester.
When augmented reality becomes reality
How it is integrated in Carbon X? Carbon X will monitor the placing of the assets in reality through their carbon data bank. Once the assets are placed it will be updated in Carbon X. Af ter which the colors of carbon indicator will also be automatically updated. Like this when the urban se questers are increased, the balance will be achieved in the neighborhood through which they can unlock neighborhoods in Antarctica. And as the neighbor hoods of the city keep getting unlocked, the city will be very close to winning 100 million dollars reward.
98

99 07 CARBON X AS A GAMING INTERFACE Carbon07 X as a gaming interface - Immerse into the virtual world - Discover the global indicator of climate- ‘‘Antarctica’’
100

Discover the global indicator of ‘‘Antarctica’’climate-
101 07 CARBON X AS A GAMING INTERFACE
Once urban sequestrations are increased as seen when augmented reality starts becoming reality, so does the balance in colours of carbon also hap pens. When the complete balance in a particular neighbourhood is achieved, it gets unlocked which was earlier shown as locked in the Locate Your self step. These locked neighbourhoods which are present in different colours such as blue, green, red and black let the users discover the global in dicator of climate from a different perspective. But how? As mentioned previously in the portfolio games are a fun and a collaborative method that have the po tential to tackle global problems by providing varied and unique solutions across all age groups. Carbon X uses avatars, leaderboards, gaming map etc. in or der to make the task of rebalancing carbon globally a fun and not a tedious job. How the technology is integrated in Carbon X? Carbon X bases the project around Antarctica which is the originator of colours of carbon. It brings closer an environment that is too distant for city dwell ers. Carbon X uses Antarctica and its environments as a medium to rebalance the global carbon cycle, a landscape that people have to save from disappear ing in order to win the ultimate prize.
102 COLOURS OF CARBON TOWERS
The above graphic is a three-dimensional representation of the neighbourhoods indicating the percentage of the balance of colours of carbon in context

TOWERS IN ANTARCTICA neighbourhoods in the user’s city with the numbers above the towers context of the neighbourhood.
103 07 CARBON X AS A GAMING INTERFACE

104 ANTARCTICA The above graphic depicts the neighbourhoods of the user’s city and

105 07 CARBON X AS A GAMING INTERFACE GAMING MAP and also highlights as to how many of them have been unlocked.

106 LEADER The above image depicts as to how these maps would act as a leader closer to achieving balance in colours of carbon and being rewarded

107 LEADER BOARD leader board amongst different cities across the world to see which city is rewarded 100 million dollars.

108

109 07 CARBON X AS A GAMING INTERFACE Immerse into the virtual world Antarctica remains quite mysterious to us. Carbon X brings to users the stories and environments of this global indicator which they can experience vir tually, each time they achieve balance in colors of carbon in their neighborhood. But how? Virtual Reality or VR through VR headsets such as Oculus and Pico can help people experience this un explored landscape by creating a digital twin that is experienced using Carbon X VR mode. How the technology is integrated in Carbon X? In Carbon X, the users can experience Antarctica through different environments which are the blue, red, green and black. Each environment as a special characteristic or feature to be discovered. Anoth er interesting aspect is that each environment will be experienced from the perspective of different avatars. The avatars are phytoplankton, krill, pen guin and James Cook. The experience of each en vironment will be at different scales depending on the size of the avatar. With the VR, the history and unexplored parts of Antarctica can be experienced. All the experiences is purely dependent on, how many neighbourhoods are unlocked in the city so this where collaboration plays a very crucial role be cause until everyone contributes, unlocking cannot be achieved.
IMMERSE INTO THE BLUE ENVIRONMENT
110
The above graphic depicts shows the snippet of the blue environment in Antarctica when viewed through

111 07 CARBON X AS A GAMING INTERFACE through VR mode in Carbon X.

VIEW FROM THE
112
The above graphic is giving a glimpse land can be viewed from the comfort

113
THE VR GLASS glimpse has to how Antarctica, a far of comfort of your home.

114

115 08 PLANETARY COLLOBORATION THROUGH CARBON X Planetary08 collaboration through Carbon X - Think local act global
116

Think local and act global Once the users get into the groove of using Carbon X in all aspects including making augmented reality to reality, they can start to share their experiences and micro-interventions to inspire others. But how? This can be done through a social media platform which is one of the modes in Carbon X. This mode is based on the technology used in Facebook and In stagram. The interface will be very similar to them. The main idea of this platform is to ensure the us ers can collaborate globally to see what’s happening around them starting from their neighborhoods to everything happening globally.
117 08 PLANETARY COLLOBORATION THROUGH CARBON X
How the technology is integrated in Carbon X? In Carbon X, social media platform will give op portunities to users to get inspired and also to inspire others. This can be done by sharing liking commenting on the photos and information shared by different users. Through this platform friends can be made; these friends will be termed as followers. Media platform will help users to keep track of the activities happening in their neighbourhood and in the neighbourhoods around them. This platform will also help the users to motivate one and other and this is where they will collaborate together to bring in change.
118
COLLABORATION THROUGH SOCIAL MEDIA
The above graphic depicts as to how social media plays a crucial role in collaborating different users of Carbon where users can communicate, share and inspire each other.

119 08 PLANETARY COLLOBORATION THROUGH CARBON X Carbon X. The media mode is a platform

The graphic shows
above
as to how share the micro-interventions by various
120 SHARING OF MICRO-INTERVENTIONS

121 08 PLANETARY COLLOBORATION THROUGH CARBON X MICRO-INTERVENTIONS how Carbon X uses media platform to various users across the globe.

122 SHARING OF MICRO-INTERVENTIONS
above
The graphic shows
as to how share the micro-interventions by various

how Carbon X uses media platform to various users across the globe.
MICRO-INTERVENTIONS
123 08 PLANETARY COLLOBORATION THROUGH CARBON X

The above graphic depicts has to how the media mode in Carbon X ultimately connects all the users globally.
GLOBAL CONNECTIVITY
124
125 08 PLANETARY COLLOBORATION THROUGH CARBON X globally.

126 HYPOTHEZING CONCEPT OF COLOURS OF CARBON.....
127 09 APPENDIX APPENDIX09 - Formation of Antarctica - Anthropogenic dilemma - Discovery of Colours of Carbon - Global representation of Colours of Carbon - Experimentation of urban sequesters in an urban setting - Immersive Environments
128 FORMATION OF
129 09 APPENDIX OF ANTARCTICA
130

Formation of world’s largest sequester.... 270 million years ago... Supercontinent South America, Africa, Arabia, Madagascar, India, Australia, and Antarctica. Gondwana and Laurasia formed the Pangaea supercontinent during the Car boniferous era. Pangaea began to break up in the Mid-Jurassic when the Central Atlantic opened. The formation of Pangaea and its mountains had a tre mendous impact on global climate and sea levels, which resulted in glaciations and continent-wide Initially,sedimentation.thecarbon sequestration was found in the sea beds of the “Supercontinent Antarctica” which split into Australia and Antarctica. Formation of Antarctica led to the formation of the world’s largest carbon sequester. As the world was formed and started evolving, car bon sequestration spread its wings and started se questering in various oceans, forests and ice sheets.
131 09 APPENDIX

132 ANTHROPOGENIC
133 09 APPENDIX ANTHROPOGENIC DILEMMA
134

Carbon’s initial presence and production on Earth all happened through natural processes before humans showed up. The evolution of humans and the Indus trial Revolution increased the harmful atmospheric carbon concentration which the existing carbon se questers found it difficult to sequester, the effects of which are drastic climate change. In the 19th century persons on sealing expedition were among the earliest to go closer to the Antarctic landmass. In the 20th century during the Nimrod expedition led by Shackleton in 1907, parties led by Edgeworth David became the first to climb Mount Erebus and to reach the South Magnetic Pole. From the late 18th to the mid-20th century, whalers and sealers plied the rich seas that surround the conti nent. In addition, krill harvesting and other types of commercial fishing in the Southern Ocean expanded from the 1960s onwards. The new millennium saw tourism and biological prospects which became the major sectors of the Antarctic economic landscape which also contributes to global economy.
135 09 APPENDIX
DilemmaAnthropogenic
136 Early Exploration The Antropogenic Dilemma ANTHONY DE LA(1675)ROCHE BELLINHAUSEN(1819-21) BELLINHAUSEN(1819-21) DURMONTD’URVILE(1839-40)CHARLESWILKES(1839JAMES ROSS (1840 - 41) JAMES WILLIAM(1823WEDDEL-24)SMITH(1819)JAMESCOOK(1772-74) JAMES COOK (1772 - 74)

137 09 APPENDIX CHARLESWILKES-42) 1773 Captain James Cook “I make bold to declare that the world will derive no benefit from it” 1819 - 1909 Expeditions to reach Antarctica ExpeditionsEarlyTheHeroicEra 1909 Douglas Mawson (Australian) Reached South Magnetic Pole 1912 Captain Falcon Scott (Britain) 1915 - 1917 Ernest Shackelton 1923 Beginning of large scale factory shipping whaling in Ross Sea 1956 US photographs Antarctica for mapping


138 AUSTRALIA AUSTRALIA NEW ZEALAND CHILE NORWAY NORWAY ARGENTINABRAZIL UK MARIELANDBYRD FRANCE Territorial Claims The Antropogenic Dilemma Resarch Bases by various countries

139 09 APPENDIX AUSTRALIA Historical Claims To Antarctica 1840- presentFrance 1908- present United AustralianNew1923-presentKingdomZealand1931-presentNorway1933-presentAntarcticTerritory1940-presentChile1943-presentArgentina1969-presentBritishAntarcticTerritory 1840Argentina1943-presentTerritoryChilean1940-presentQueen1939-presentAustralia1933-presentPeter1931-presentRoss1923-presentAdeliepresentLanddependencyIslandMaudLandAntarcticAntarctica
140 Marine Protected Areas The Antropogenic Dilemma CCAMLRExisting MPA CCAMLR MPA proposals under CCAMLRdiscussionMPA proposals in MPAdevelopmentinthecamIt convention area outside Antarctic Treaty area

141 09 APPENDIX Krill Fishery 2019 - 2020 1,235,000,000 3,600,000 11,000 1,200 Whales Seals Penguins Krills per day 100,000200,000300,000400,000500,000 1973 1980 1990 2000 2005 2010 2020 0 CommissionCCAMLRfortheConservationofAntarcticMarineLivingResourcessince1982


142 DISCOVERY OF COLOURS
143 09 APPENDIX COLOURS OF CARBON
144 Coordinate system - South Pole Orthographic 3m(mg/Chlorophyll) 200.150.01

145 09 APPENDIX Green Carbon Origin: Antarctica Identified as: Green Carbon Sequestration Zone: Phytoplankton in oceans and forests on land. Type: Natural Source: Carbon sequestered by vegetation and forest ecosystem. Global Impact: Positive Impact Projection - Orthographic -SourcesData Laboratory)PropulsionJetNASA(DEMMapGlobal- Survey)Antarctic(BritishDEMAntarctica- Observatory)Earth(NASAProductivityPrimaryNet- Observatory)Earth(NASAConcentrationChlorophyll-

146 Coordinate system - South Pole Orthographic 3m(mg/Chlorophyll) 200.150.01

147 09 APPENDIX Blue Carbon Origin: Antarctica Identified as: Blue carbon Sequestration Zone: Oceans Type: Natural Source: Carbon sequestered by marine ecosystem and sea beds. Global Impact: Positive Impact Projection - Orthographic -SourcesData Laboratory)PropulsionJetNASA(DEMMapGlobal- Survey)Antarctic(BritishDEMAntarctica- Observatory)Earth(NASAConcentrationChlorophyll-

148 Coordinate system - South Pole Orthographic 3m(mg/Chlorophyll) 200.150.01

149 09 APPENDIX Red Carbon Origin: Antarctica Identified as: Red Carbon Sequestration zone / Generator: Snow, Ice caps and cryosphere. Type: Natural Source: Carbon sequestered and generated by Chlamydomonas during melting. Global Impact: Positive/ Negative Im pact Projection - Orthographic -SourcesData Laboratory)PropulsionJetNASA(DEMMapGlobal- Survey)Antarctic(BritishDEMAntarctica- Observatory)Earth(NASAConcentrationIceSea-

150 Coordinate system - South Pole Orthographic 3m(mg/Chlorophyll) 200.150.01

151 09 APPENDIX Brown Carbon Origin: Urban Cities Identified as: Brown Carbon Generators: Aerosols Type: Man-made Source: Carbon generated by combus tion of organic matter. Global Impact: Negative Impact Projection - Orthographic -SourcesData Laboratory)PropulsionJetNASA(DEMMapGlobal- Survey)Antarctic(BritishDEMAntarctica- Observatory)Earth(NASAAerosol-

152 Coordinate system - South Pole Orthographic 3m(mg/Chlorophyll) 200.150.01

153 09 APPENDIX Black Carbon Origin: Urban Cities Identified as: Black Carbon Generators: Carbon Monoxide Type: Man-made Source: Carbon generated by incom plete combustion of fossil fuels and bio-mass. Global Impact: Negative Impact Projection - Orthographic -SourcesData Laboratory)PropulsionJetNASA(DEMMapGlobal- Survey)Antarctic(BritishDEMAntarctica- Observatory)Earth(NASAMonoxideCarbon-

GLOBAL REPRESENTATION
154
REPRESENTATION
155 09 APPENDIX
OF COLOURS OF CARBON
156 Blue ColoursCarbonofCarbon

157 09 APPENDIX SeptemberSeptemberSeptember200220052010


158 Green ColoursCarbonofCarbon

159 09 APPENDIX SeptemberSeptemberSeptember200520072010


160 Black ColoursCarbonofCarbon

161 09 APPENDIX SeptemberSeptemberSeptember200520072010


162 Green ColoursCarbonofCarbon

163 09 APPENDIX SeptemberSeptemberSeptember201020122015


164 Brown ColoursCarbonofCarbon

165 09 APPENDIX SeptemberSeptemberSeptember200520072010


166 EXPERIMENTATION OF IN URBAN SETTING...........
167 09 APPENDIX OF URBAN SETTING...........SEQUESTERS
168 InputAntarcticaimage B InputLondonimage A Training Set A (300 (300TrainingImages)SetBImages) Cycle GAN process Urban Sequesters


169 09 APPENDIX Generated A Generated B Discriminator B Discriminator AGeneratorGeneratorA-BB-ACyclicACyclicB G (200OutputinSequestrationUrbanSettingEpochs)D G D


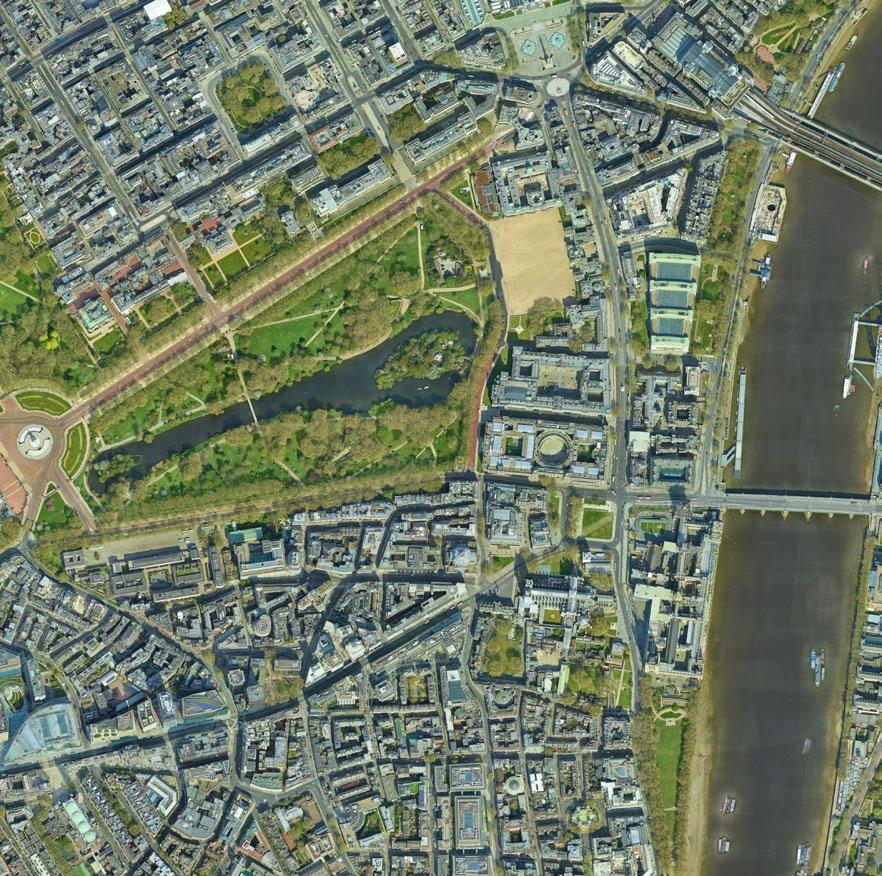
Site: Hyde Park Site Selection Criteria Selected an area where the green spac es and urban settlement are in equal propotion with a small strip of water body.
170 Cycle GAN process Urban Sequesters
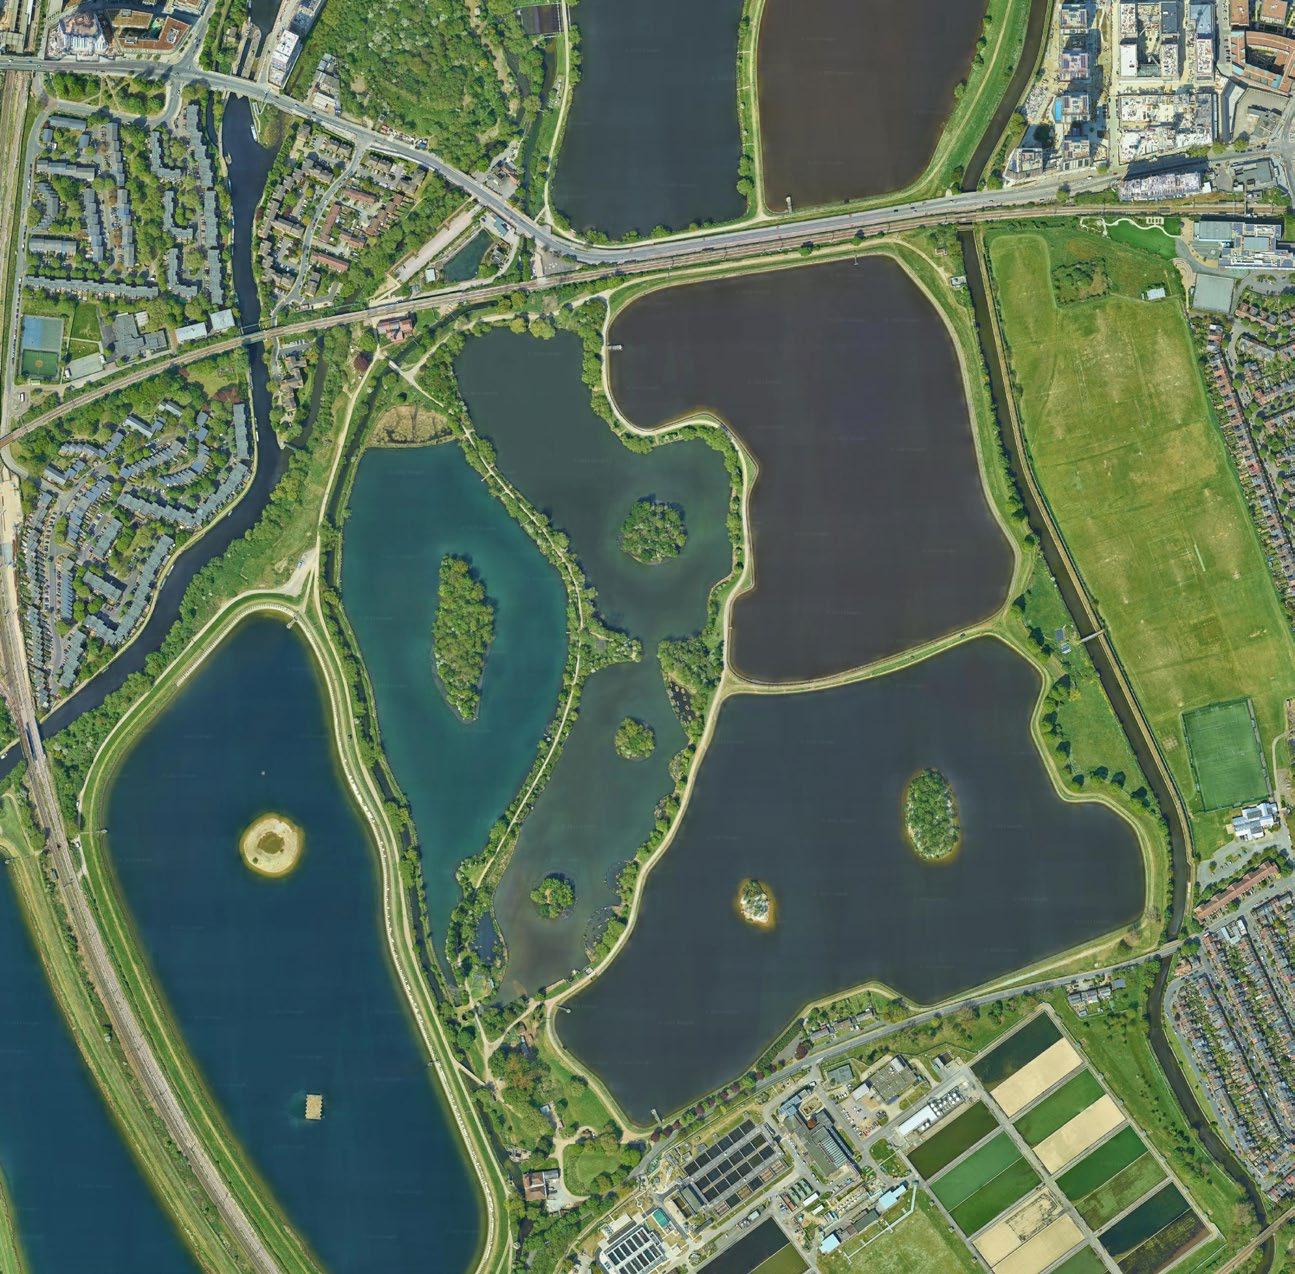
Site: Tottenam Hale Site Selection Criteria Selected an area where there is maxi mum water bodies embedded in patch es of green spaces with minimum urban settlement.
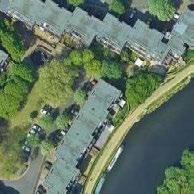
Site: Canary Wharf Site Selection Criteria Selected an area where there is mix of water body,green spaces and urban settlements.


171 09 APPENDIX
Site: Victoria Park Site Selection Criteria Selected an area where there is maximum urban settlement and minimum green spaces.
Site: St James Park Site Selection Criteria Selected an area where there is pre dominant area of urban settlement with large strips of water bodies and mini mum green spaces. Site: Russell Square Site Selection Criteria Selected an area where there is maxi mum urban settlement with pockets of green spaces.


172 Input Image A Urban Setting-Canary Wharf-London Input Image B Carbon Sequesteration Input Image A Urban Setting-Tottenam Hale-London Input Image B Carbon Sequestration in


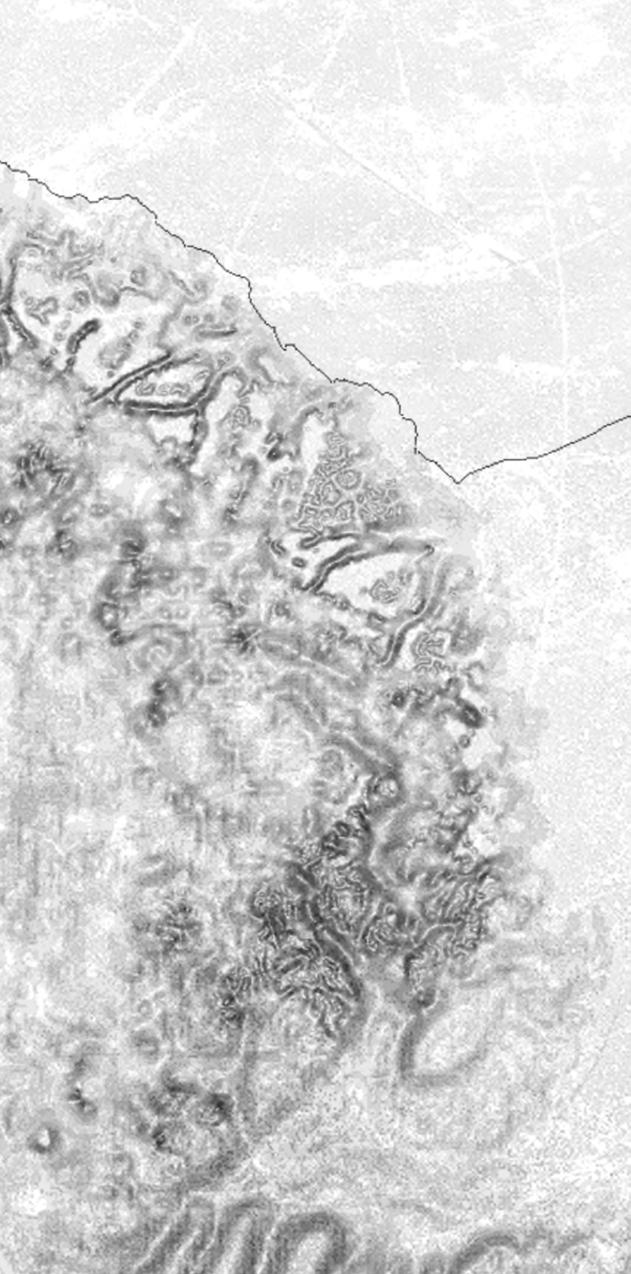
173 09 APPENDIX in Antarctica in Antarctica Predicted SequestrationOutputinUrban Setting Predicted SequestrationOutputinUrban Setting


174 Input Image A Urban Setting-Hyde Park-London Input Image B Carbon Sequestration in Input Image A Urban Setting-Victoria Park-London Input Image B Carbon Sequestration in


175 09 APPENDIX in Antarctica in Antarctica Predicted SequestrationOutputinUrban Setting Predicted SequestrationOutputinUrban Setting


176 Input Image A Urban Setting-St James Park-London Input Image B Carbon Sequesteration in Input Image A Urban Setting-Russell Square-London Input Image B Carbon Sequestration in


177 09 APPENDIX in Antarctica in Antarctica Predicted SequestrationOutputinUrban Setting Predicted SequestrationOutputinUrban Setting


178 Dataset 1 London Landscape (256 x 256 px) Cycle GAN- Training Database Urban Sequesters


179 09 APPENDIX Dataset Antarctica2 Landscape (256 x 256 px)


180 IMMERSIVE ENVIRONMENTS
181 09 APPENDIX ENVIRONMENTS
182

183

184

185

186
187 10 BIBLIOGRAPHY BIBLIOGRAPHY10
188 MAPPING DATA COLLECTION – ANTARCTICA 2022. [online] Available at: <https://www.soosmap.aq/> David Herbert, B., 2022. [online] Add.scar.org. Available uary Scar.org.2022].2022. [online] Available at: <https://www.scar.org/library/scar-meeting-papers/xxxvi-scar-dele gates-2021-online/sub-group-reports-2021/5648-geomap/file/> GitHub. 2022. Releases · aryDavid23treaty.maps.arcgis.com/apps/webappviewer/index.html?id=967e09935fae4cb891bcc193a2957357>Antarctictreaty.maps.arcgis.com.<https://scar.org/science/cpr/so-cpr/>Nash,e74543c0-4c4e-4b41-aa33-5bb2f67df389/>Data.bas.ac.uk.ucts/AntarcData>Usicecenter.gov.project/bedmap-2>Britishncpor.res.in/>Quantarctica.ncpor.res.in.github.com/PolarGeospatialCenter/comnap-antarctic-facilities/releases>PolarGeospatialCenter/comnap-antarctic-facilities.2022.Indexof/quantarctica.[Accessed20January2022].AntarcticSurvey.2022.Bedmap2-BritishAntarctic[Accessed20January2022].2022.AntarcticDataSupportFiles.[online][Accessed20January2022].2022.BASDataCatalogue.[online]Available[Accessed21R.,2022.SouthernOceanContinuousPlankton[Accessed23January2022.ArcGISWebApplication.January2022].Herbert,B.,2022.[online]Gis.ccamlr.org.Available2022].
189 10
BIBLIOGRAPHY
ANTARCTICA <https://www.soosmap.aq/> [Accessed 20 January 2022]. Available at: <https://www.add.scar.org/> [Accessed 20 <https://www.scar.org/library/scar-meeting-papers/xxxvi-scar-deleJan-gates-2021-online/sub-group-reports-2021/5648-geomap/file/> [Accessed 20 January 2022]. PolarGeospatialCenter/comnap-antarctic-facilities. [online] Available at: <https:// github.com/PolarGeospatialCenter/comnap-antarctic-facilities/releases> [Accessed 20 January 2022]. /quantarctica. [online] Available at: <http://www.quantarctica. Antarctic Survey. [online] Available at: <https://bas.ac.uk/ [online] Available at: <https://usicecenter.gov/ProdAvailable at: <https://data.bas.ac.uk/collections/ 21 January 2022]. Plankton Recorder Database. [online] SCAR. Available at: JanuaryApplication.2022].[online] Available at: treaty.maps.arcgis.com/apps/webappviewer/index.html?id=967e09935fae4cb891bcc193a2957357><https://antarctic-[AccessedAvailableat:<https://gis.ccamlr.org/>[Accessed22Janu-
190 MAPPING DATA COLLECTION – GLOBAL Earthobservatory.nasa.gov. 2022. Snow Cover. [online] global-maps/MOD10C1_M_SNOW> [Accessed 20 January Earthobservatory.nasa.gov. 2022. Water Vapor. [online] global-maps/MYDAL2_M_SKY_WV> [Accessed 20 January Earthobservatory.nasa.gov. 2022. Chlorophyll. [online] global-maps/MY1DMM_CHLORA> [Accessed 20 January Earthobservatory.nasa.gov. 2022. Aerosol Size. [online] global-maps/MODAL2_M_AER_RA> [Accessed 20 January Earthobservatory.nasa.gov. 2022. Carbon Monoxide nasa.gov/global-maps/MOD17A2_M_PSN>Earthobservatory.nasa.gov.nasa.gov/global-maps/MOP_CO_M/MOD14A1_M_FIRE>&2022.NetPrimaryProductivity.[Accessed
191 10 BIBLIOGRAPHY
GLOBAL [online] Available at: <https://earthobservatory.nasa.gov/ January 2022]. [online] Available at: <https://earthobservatory.nasa.gov/ January 2022]. [online] Available at: <https://earthobservatory.nasa.gov/ January 2022]. [online] Available at: <https://earthobservatory.nasa.gov/ January 2022]. & Fire. [online] Available at: <https://earthobservatory. nasa.gov/global-maps/MOP_CO_M/MOD14A1_M_FIRE> [Accessed 20 January 2022]. Productivity. [online] Available at: <https://earthobservatory. [Accessed 20 January 2022].
192 DATA COLLECTION – GENERAL Zinke, L., 2022. The colours of carbon. Change, N., 2022. Carbon Dioxide Concentration | NASA Change: Vital Signs of the Planet. Available at: <https://climate.nasa.gov/vital-signs/carbon-dioxide/> cessed 01 February 2022]. Change, N., 2022. Carbon Dioxide Concentration | NASA Change: Vital Signs of the Planet. Available at: <https://climate.nasa.gov/vital-signs/carbon-dioxide/> cessed 12 April 2022]. Zimmer, K., 2020. The daring plan to save the Arctic pollutionday,Kang,www.zsl.org/global-biodiversity-monitoring>ZoologicalRemoteGray,arywww.bbc.com/future/article/20200923-could-geoengineering-save-the-arctic-sea-ice>ice2022].A.,Krolikowski,M.,Fretwell,P.,Convey,P.,Peck,sensingrevealsAntarcticgreensnowalgaeasSocietyofLondon(ZSL).2022.Globalbiodiversity[AccessedS.,Zhang,Q.,Qian,Y.,Ji,Z.,Li,C.,Cong,Z.,Zhang,A.,Rupakheti,M.,Chen,D.,Gustafsson,Ö.,Thiemens,tocryosphericchangeintheThirdPoleregion:
BIBLIOGRAPHY
NASA Global Climate Change. [online] <https://climate.nasa.gov/vital-signs/carbon-dioxide/>Climate [AcNASA Global Climate Change. [online] <https://climate.nasa.gov/vital-signs/carbon-dioxide/>Climate [Acice with glass. [online] Bbc.com. Available at: <https:// www.bbc.com/future/article/20200923-could-geoengineering-save-the-arctic-sea-ice> [Accessed 12 FebruPeck, L., Mendelova, M., Smith, A. and Davey, M., 2022. important terrestrial carbon sink. biodiversity monitoring. [online] Available at: <https:// [Accessed 17 January 2022]. Zhang, Y., Guo, J., Du, W., Huang, J., You, Q., PanThiemens, M. and Qin, D., 2022. Linking atmospheric region: current progress and future prospects.
193 10