October report.


To create a place where we can facilitate our people’s growth.


Family. Our colleagues are our broader family, assist when needed and when in need.
Mutuality. Respect our colleagues and our clients as you would like to be respected.

Realising potential. Unlock your full potential, encourage and support your colleagues.
Embrace change. Strive for excellence; be open minded and willing to embrace change.
Health and energy. Work towards being well balanced within yourself.


Dear Readers,
I’m very excited to let you know that as our company has grown over the last 12 years we have now invested further in the future of our team and our customers.
OBrien Real Estate is proud to announce that Mr Mitch Armstrong has been selected as its new Chief Executive Officer (CEO). Mitch’s appointment follows an extensive and competitive selection process.

Before joining OBrien Mitch has held a variety of executive, operational and project leadership roles. Most recently, he held the position of Chief Commercial Officer (CCO) for Kay & Burton. Previously, Mitch served as Sales Director for Domain and Chief Operating Officer (COO) for The Royal Australian College of General Practitioners (RACGP) and is seen as an outstanding industry thought leader.
Reporting to the Corporate Directors; Dean O’Brien, Darren Hutchins and Stavros Ambatzidis, Mitch will transition into the responsibility of all Corporate operations and strategy. This new CEO role will allow the corporate team to work more closely with existing offices and assist with the brand’s continued growth.

Here is what Darren Hutchins, Corporate Director had to say about Mitch’s appointment:
“ThisappointmentmarksanexcitingnewchapterforOBrien RealEstate,wearelookingforwardtoworkingwithMitchto ensureOBrienRealEstatecontinuestodeliveronits purpose,tocreateaplacewherewecanfacilitatepeople’s’ growth.WebelieveheisagreatfitforOBrienRealEstate,with thecombinationofskillsandexperiencetoleadthe businessthroughitsnextstrategicphase.”
Here is what Dean O’Brien, Corporate Director had to say about Mitch’s appointment:
“Mitchbringsuniqueperspectivesonthenationalbusiness environment,havingatruemultifacetedcareerjourney.Iam excitedtoworkwithMitchaswecontinuetomakesignificant inroadsinbecomingVictoria’smostsuccessful,progressive, andinnovativerealestatebrand.Mitchhasalreadybeen impressedbythequalityofourpeople,thestrengthofour cultureandourclientrelationships.Webelievewehavean excitingfutureinfrontofusaswecapturegrowth opportunities.”
Here is what Stavros Ambatzidis, Corporate Director had to say about Mitch’s appointment:
Here is what Mitch had to say about his appointment:
“IamhonouredtohavebeenselectedasOBrienReal Estate’sfirstCEO.Itisaprivilegetobepartofan organisationthatdelivershighqualityservicesand innovativesolutionstothebestclients,developsthemost talentedprofessionalsintoleadersanddoesitspartto improvethesocietiesinwhichweoperate,”saidMitch.
“Weareanorganisationledbyapurpose–tomakea positive,meaningfulimpactthatmatterstoeveryone OBrientouches.Iwilldomybesttoservethenetworkby helpingenableourleadersandpeopletofulfilltheir passiontomakeadifference.Mylongtermgoalistosee OBriengrowtothelargest,mostexcitingRealEstate brandinVictoriaandbeyond”
“Mitchwillbringawealthofindustryexperienceand excellentstrategicandleadershipskillstoOBrienReal Estate,andIamdelightedthathewillbeournewChief ExecutiveOfficer.Hehasimpresseduswithhisclarity, structureandfocus,andastrongclient-centricmindsettothe role,andbyhisdrivetoleadthedevelopmentofOBrienReal Estate’sfuturestrategy.”
This is a very exciting time at OBrien Real Estate as we strive to provide the highest quality of service and create the best customer experience here. This is a new stage for our team to deliver even more effective and efficient processes to you our valuable customers.
 Dean O’Brien

Ballina/ByronBay lllawarra Burnie/DevenportLaunceston CoffsHarbour Lismore Geelong Melbourne


Canberra SouthernHighlands Sydney
Ballina/ByronBay Burnie/Devonport CoffsHarbour Geelong GoldCoast

Brisbane Ipswich
ll!awarra Launceston Lismore Melbourne SouthernHighlands Sydney
SuburbAddress
Edinburgh Road
Bayswater Road
Manuka Road
Lindeman Street
Sittella Drive
Millwood Avenue
Filante Grove
Ibis Court
Royalden Close

Lyell Road
Valerie Street
Tulip Crescent
Castlewood Drive
Stradbroke Road
Greenwood Drive
Buller Avenue
Pablo Drive
Fernlea Street
Circuit
Duff Street
Snead Boulevard
Lesdon Avenue
Bayswater Bayswater North Berwick Berwick Berwick Berwick Berwick Blind Bight Boronia Boronia Boronia Boronia Boronia Boronia Carrum Downs Clyde Clyde North Clyde North Clyde North Cranbourne Cranbourne Cranbourne
$820,000 $445,000 $783,000 $735,000 $1,200,000 $650,000 $800,000 $710,000 $675,000 $887,000 $750,000 $445,000 $927,500 $670,000 $480,000 $745,000 $1,125,000 $685,000 $680,000 $645,000 $860,000 $620,000

Mountainview Boulevard
Chantenay Parade
Valentine Lane
Yorkshire Drive
Lancashire Drive
Alamanda Way
Elizabeth Street 17 Cassius Circuit 1 Wisteria Court 16 Michaelia Close 15 Megan Close
Emma Close 12 Loretto Avenue
Wilbraham Court
Huntingdale Road 86 Albatross Road
Blackburn Mews
Newcastle Way
Roselea Place
Lansell Close
Bungalow Lane
Pioneer Way
Hamilton Court
Apple Street
Taverner Court
Copelands Road
Cranbourne North Cranbourne North Cranbourne North Cranbourne North Cranbourne North Cranbourne North Cranbourne North Cranbourne North Cranbourne North Cranbourne West Cranbourne West Drouin
Ferntree Gully Frankston
Huntingdale Kalimna Langwarrin
Langwarrin
Narre Warren North Narre Warren South Narre Warren South Officer Pearcedale Pearcedale Scoresby Warragul
$860,000 $700,000 $645,000 $840,000 $820,000 $662,500 $510,000 $525,000 $570,000 $726,868 $620,000 $650,000 $700,000 $720,000 $410,000 $465,000 $545,000 $600,000 $1,820,000 $1,855,000 $610,000 $620,000 $1,740,000 $820,000 $1,000,000 $600,000
Beilby Street
Court
Railway
$480 $550 $430 $480 $505 $500 $375 $470 $590
Street
$530 $490 $450 $400 $450
$450
$2,302 $2,085 $2,389 $1,868 $2,085 $2,194 $2,172 $1,629 $2,042 $2,563 $1,955 $2,389 $1,825 $2,997 $2,172 $2,172 $1,651 $2,302 $2,129 $1,955 $1,738 $1,955 $1,890 $1,955 $1,520 $1,994

28 Hikari Avenue
Eminence Drive
Gladesville Court
Freshfields Drive
Olive Road
Unit 305/264 Waterdale Road
Sybella Avenue
Daniel Drive
Windsor Drive 32 Meadow Wood Walk
Springfield Drive 22 Pallidus Way
Pioneer Way 14 Stanley Drive
Whiteside Road
Calvert Street
Griffith Mews
Bluehill Boulevard
Queens Road

Kallay Drive
Heathmont Road
Belle Vue Avenue
Sovereign
Carol Street
Barry Street
3/1 McLeod
Harewood Street
Walmac Close
Stud Road Road
Kirrum Close
Leased
Cranbourne South Cranbourne West Dandenong North Devon Meadows Devon Meadows Ivanhoe Koo Wee Rup Langwarrin Lysterfield Narre Warren Narre Warren Narre Warren Officer Officer Officer Officer South Pakenham Pakenham
$625 $520 $440 $800 $850 $360 $520 $400 $850 $550 $480 $480 $470 $550 $480 $500 $400 $420 $1,600 $345 $460 $430 $510 $550 $580 $400 $550 $500 $650
$2,259 $1,911 $3,475 $3,693 $1,564 $2,259 $1,738 $3,693 $2,389 $2,085 $2,085 $2,042 $2,389 $2,085 $2,172 $1,738 $1,825 $6,951 $1,499 $1,998 $1,868 $2,216 $2,389 $2,520 $1,738 $2,389 $2,172 $2,824 $3,258
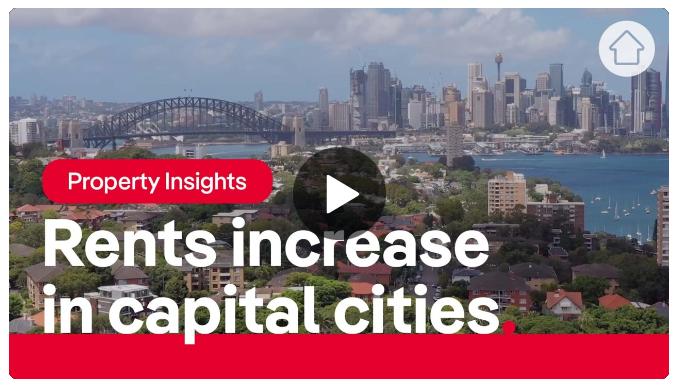
Rent prices just rose at the fastest quarterly rate on record, making the market even harder to crack
A combination of low rental stock and high demand continues to drive prices up across the country and experts say there's no relief in sight, especially for tenants in capital cities.
City-based tenants most impacted
As tenants return to cities post-Covid, the impacts of low stock and rising prices are being felt most acutely across the capitals.
In the combined capital cities, rents increased by 3.2% over the quarter, while rents were unchanged in regional areas.

The biggest year-on-year declines in total listings were seen in Sydney, down 24.2%, Melbourne, down 32,8%, and Brisbane, down 22.7%.
At the same time, these cities experienced the strongest increases in demand per listing, with Melbourne up 45.8%, Sydney up 26.8%, and Brisbane up 25.9%.
"The growth and tightness in the rental market appears to be shifting from regional areas back to the capital cities," Mr Kusher said.
PropTrack's latest Rental Report for the September quarter shows rental prices have increased at the fastest quarterly rate on record, surging by 4.3% in the past three months to reach a national median of $480 per week.
"Australia’s rental market remains extremely tight, with vacancy rates and supply reducing further over the September 2022 quarter," PropTrack's director of economic research Cameron Kusher said.
"As a result, rental prices nationally continued to climb."
The higher rental prices are partly driven by low levels of available stock, with the total number of rental listings on realestate.com.au having decreased by 20.5% year-on-year, which is the lowest level since mid-2003.
That limited stock has coincided with an 18.8% surge in demand over the past year. As a result, the rental vacancy rate is just 1.6% nationally.
New properties tend to be snapped up quickly, Mr Kusher said, prompting tenants to pounce with a rental application ready to go.
In September, properties spent a median of just 19 days on realestate.com.au before being leased.
Download the full PropTrack Rental Report - September 2022 quarter

Low rental stock is largely caused by the lack of investors active within the market, with mortgage lending trending down. New lending to investors in August 2022 was $8.9 billion, which is the lowest it's been since June 2021.
"While there is some supply coming via build-to-rent, any additions are likely to be well and truly outweighed by the increase in demand from the re-opening of international borders and the ongoing decline in purchasing by firsthome buyers," Mr Kusher said.
"With fewer investors purchasing homes to rent out, the limited supply of stock, coupled with strong demand, is leading to heightened increases in advertised rental prices."
"This is being driven by the return of many people who migrated regionally during the pandemic back to capital cities and the lift in overseas migration. This is especially the case in our two biggest rental markets, Sydney and Melbourne.
"Most overseas migrants to Australia settle in these cities with few purchasing a property before arrival, which is likely to keep demand for rentals heightened as the supply of rentals is expected to continue to recede, pushing prices higher."
The future is not so bright
Without investors, and with large numbers of renters descending on the market, there's no easy solution to the current rental crunch in sight, Mr Kusher said.
It's likely tenants will see prices continue to rise, especially in the cities.
“These demand and supply issues can be addressed but none of these factors appear set to change in the near term, which means a further tightening of rental supply and increases in rental costs seems likely over the coming year."
offices
The
of
service
from the importance
people behind
network.
A multiple REIV award winning company Foundation
Scan to view our in-depth suburb reports