Note: Rates are levied on land value. The rating year is 1 July to 30 June. Rates are payable for four quarterly instalments. If property situations change, rates may no longer meet remission requirements.
2. Valuation Land value: $ 475,000
Value: $ 740,000 (Current 01/10/2023)
Planning
Zoning
Operative District Plan: Main Residential
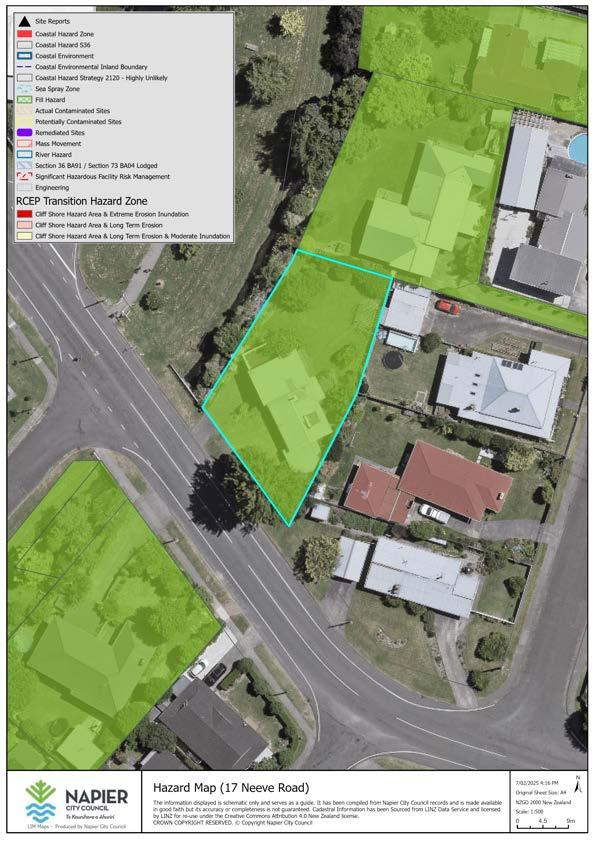
Refer to site specific maps – attached ‘A’.
Proposed District Plan: Medium Density Residential
Any Resource Consent No
Designation/Scheduled sites No
Precincts and Overlays No
Heritage New Zealand Inventory No
Areas/sites of significance to Maori (Group 4 heritage item) No
Notable Trees and Special Character No
HB Hazard Portal:
Hawkes Bay Regional Council and Napier City Council have a shared service hazard information portal. A report has been generated from this and is attached – ‘C’.
Other
Refer to Interests on Record of Title – attached ‘B’
Property is located on or adjacent to ‘Neeve Road’, a designated Collector Road – Attached ‘F’.
Infrastructure
Geotechnic Report Held
Filled/Excavated Areas
Potential Subsidence
Potential Slippage
Stormwater Catchment Study
Flood Study
Potential Inundation
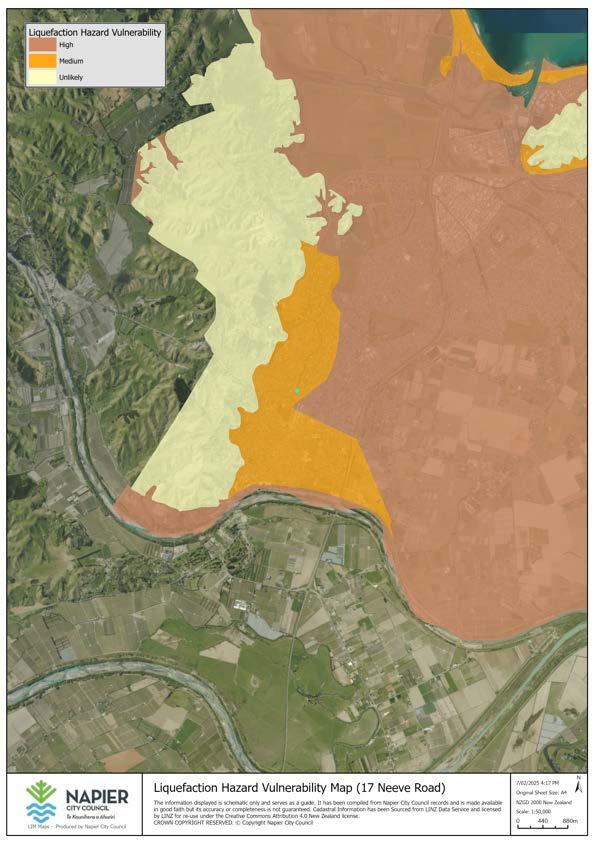
No records held. Map showing areas of potential liquefaction, see – attached ‘A6-8’.
No records held
No records held.
No records held
Yes. Subject to ongoing investigation.
Yes. Subject to ongoing investigation.
Inundation Advice Note
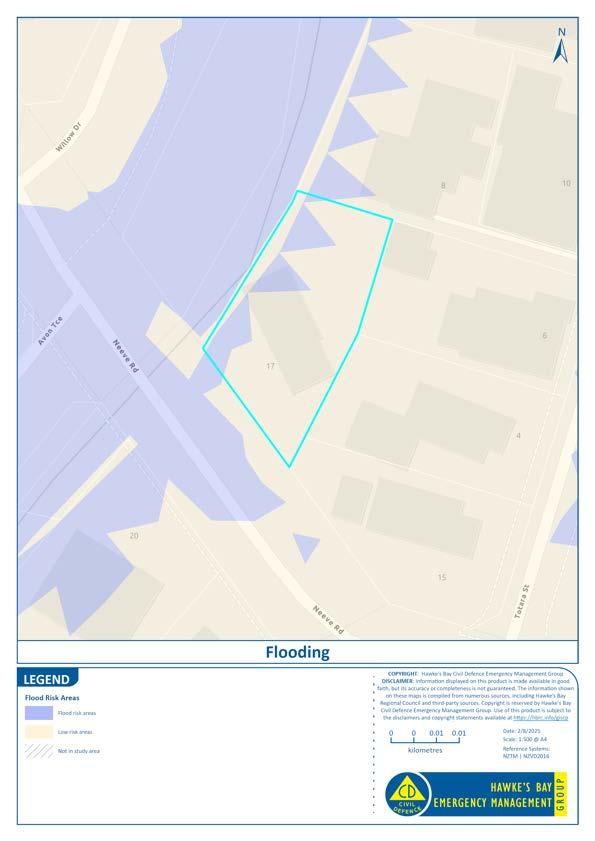
Flood modelling assessments undertaken for Council suggest that this property is subject to inundation in a 50-year return period. The modelling is district wide. Further investigation may be required to confirm the likely extent of flooding. Any habitable buildings erected on this property shall be subject to a minimum floor level. Please contact Council infrastructure team for further information. A section 73 notice under the Building Act may apply for all new works.
Potential Erosion
Coastal Inundation: Tangoio to Clifton 2023 Report
Connection to Council Services available:
Stormwater
Sewer
Water ----------
Council Services through property
Artesian Well ----------
No records held.
Not applicable.
Other
Yes, see utilities plan – attached ‘A13’.
Yes, see utilities plan – attached ‘A13’. Connected to septic tank. See attached drainage plan D.
Yes, see utilities plan – attached ‘A13’.
No.
No records held.
Suspect Fill
This property is subject to suspect fill and is located on a closed landfill site – see attached ‘A6-A9’.
This property/site has not received an Infiltration Inspection.
Please note: Any repairs found during council inspection on private pipe work will be the responsibility and the cost of the property owner.
Drainage Inspector
Septic Tank
On-site Stormwater Drainage
On-site Water Reticulation
On-Site Sewer Drainage
All effluent from septic tanks may at some time be required to meet Hawkes Bay Regional Councils’ Regional Water Resources plan, and may also require a Discharge Consent.
No records held.
No records held.
Yes, see attached ‘D’
Building Inspector
Land Hazards ----------
Code Compliance Certificates
Building Consents/Permits
Low Wind Zone. Fill Hazard.
No records held.
Yes, see attached ‘E’
Building constructed under Government control, therefore no records held. NA
Seismic Assessment ---------- No records held.
Compliance Schedule No records held.
Building Warrant of Fitness ---------- No records held.
Other
Yes. Napier soil generally does not have the 100KPA ground bearing required by the NZ Building Code.
Swimming Pool No records held.
Cyclone Gabrielle 2023 No records held.
Note: If there is a pool on site it is the owner’s responsibility to ensure that it is fenced according to the Act and registered with the Council.
Environmental Health
Requisitions No
Currently licensed in terms of any other Enactment No
Other No Trade Waste
Consent/Approval No records held.
Note: If you wish to discuss the Trade Waste activity, please contact our Environmental Solutions Team on 06 835 7579 or tradewaste@napier.govt.nz.
Please Note:
This report has been prepared from Council records to meet the requirements of S44 A of the Local Government Official Information and Meetings Act.
The absence of any content or certificate does not necessarily mean that such a consent or certificate is not required. If you have any doubts about specific requirements please contact the appropriate staff member on (06) 835-7579. Should a site inspection be necessary to answer a question, the Council reserves the right to charge for this service.
Users of this information should also be aware that some categories of information are based on records supplied to Council by property owners, developers and others and that the accuracy of that information cannot be guaranteed.
Council reserves the right to serve requisitions whenever found necessary.
No Significant Hazardous Facility Risk on property
Wind Hazard 2011
Label Low Wind Zone
Wind Speed Maximum ultimate wind speed limit of 32m/s
Liquefaction Hazard Vulnerability
schematic
and
Hazard Description
Hazard Information
17 Neeve Road
Liquefaction damage is possible - Medium liquefaction vulnerability
Liquefaction Source GNS Science Report 2015/186 October 2017
Amplification Potential (GNS, 1998)
Label High Amplification Potential Source Institute of Geological & Nuclear Sciences (June 1998)
The information display is schematic only and serves as a guide. It has been compiled from Napier City Council records and is made available in good faith but its accuracy or completeness is not guaranteed.
DISCLAIMER: Information displayed on this product is made available in good faith, but its accuracy or completeness is not guaranteed. The information shown on these maps is compiled from numerous sources, including Hawke’s Bay Regional Council and third-party sources. Copyright is reserved by Hawke’s Bay Regional Council. Use of this product is subject to the disclaimers and copyright statements available at https://hbrc.info/giscp
17 Neeve Road, Napier District
Lot 1 DP 10549
1004023400
This report summarises the known hazards intersecting this property, based on research reports commissioned to assess regional risk – these are summarised below. The hazard assessment methodologies, information compilation and presentation techniques used for these assessments include certain qualifications and limitations on the use, noting:
a. The hazard information provided is based on the best information available at the time of the studies and was supplied under specific contract arrangements including financial and time constraints.
b. The hazard information may be liable to change or review if new information is made available.
c. Councils and other organisations may hold more detailed hazard information than provided here. This Natural Hazard Property Report is not a substitute for a Land Information Memorandum (LIM).
d. The precision and accuracy of the data varies, therefore it is important that you obtain expert advice to help to interpret the information.
The hazard maps in this report are based on the following referenced research reports. Online HBRC Natural Hazards Report Database contains a register of the hazard research reports and publications from either the Council or external organisations and this database may contain other pertinent information related to this area. Go to www.hbrc.govt.nz and search #hazards: The referenced reports are:
1. Earthquake Fault lines
o Earthquake hazards in Hawke's Bay Initial assessment
o Earthquake hazard analysis - Stage 1. Recurrence of large earthquakes determined from geological and seismological studies in the Hawke's Bay area
o Active Fault Mapping and Fault Avoidance Zones for Central Hawkes Bay District: 2013 Update Active Fault Mapping and Fault Avoidance Zones for Hastings District and environs
o Fault Avoidance Zone Mapping for Wairoa District, Napier City and surrounds
2. Earthquake Liquefaction
o Assessment of liquefaction risk in the Hawke`s Bay: Volume 1: The liquefaction hazard model
o Assessment of liquefaction risk in the Hawke`s Bay: Appendices for Volume 1
3. Earthquake Amplification
o Hawke's Bay Regional Council earthquake hazard analysis program, Stage III : evaluation of ground shaking amplification potential Volume 1
o Hawke's Bay Regional Council earthquake hazard analysis program, Stage III : evaluation of ground shakingamplification potential Volume 2: Appendices
4. Tsunami Inundation Extents
o Hawkes BayTsunami Inundation by Attenuation Rule
o Review of Tsunami Hazard in New Zealand
o CR2022-58 Level 3 Tsunami Modelling for Hawke's Bay_FINAL
5. Flooding Extents
o Wairoa River Flood Hazard Study
o TeNgaru Catchment Flood Hazard Study
o Waipatiki Catchment Flood Hazard Analysis
o Kopuawhara Opoutama Flood Hazard Analysis
6. Coastal Hazard
o Regional Coastal Environmental Plan
o Clifton to Tangoio Coastal Hazards Strategy 2120 - Coastal Hazard Assessment
o Clifton to Tangoio Coastal Hazards Strategy 2120 - Coastal Risk Assessment
o Other Coastal Hazard Reports
o Cliff Hazard Zone Delineation
o Coastal Hazard Zone in Napier District Plan
7. Landslide Risk
Hazards Report
COPYRIGHT: Hawkes Bay Regional Council
DISCLAIMER: Information displayed on this product is made available in good faith, but its accuracy or completeness is not guaranteed. The information shown on these maps is compiled from numerous sources, including Hawke’s Bay Regional Council and third-party sources. Copyright is reserved by Hawke’s Bay Regional Council. Use of this product is subject to the disclaimers and copyright statements available at https://hbrc.info/giscp
o Roll out of Erosion Models for Regional Councils: Landcare Research Limited
o Earthquake-Induced Landslide Forecast and Hazard Assessment, Hawke’s Bay Region.
o Earthquake-Induced Landslide Forecast and Hazard Assessment, Bluff Hill, Napier.
8. Quaternary Geology
o Hawke's Bay Regional Council earthquake hazard analysis program, Stage III : evaluation of ground shaking amplification potential Volume 2: Appendices
9. Wairoa River Bank Stability Zones
o Wairoa River Bank Stability Assessment
Online Mapping Conditions of Use
1.Use of these maps is subject to these disclaimers and exclusions. By using these maps, the user is signifying his or her agreement to be bound by these exclusions and disclaimers.
2.Hawke's Bay Regional Council's Hazard maps use the best information available to the council. The maps indicate the extent of the hazard from analysis of information only. They do not necessarily reflect the greatest extent of the hazard suffered in the past, or likely to be suffered in the future.
3.The hazard information provided does not imply any actual level of damage to any particular structure, utility service or other infrastructure.
4.These maps should not be relied upon as the sole basis for making any decision in relation to potential risk.
5.Additional information for specific hazards may be available from sources external to the Hazard Portal via links provided on Hazard pages.
6.The hazard information provided is regional in scope and cannot be substituted for a site-specific investigation. A suitably qualified and experienced practitioner should be engaged if a site specific investigation is required.
7.Hawke's Bay Regional Council makes no representations, warranties or undertakings about any of the information in these maps and / or electronic files including, without limitation, their accuracy, completeness, quality or fitness for any particular purpose.
8.The Hawke's Bay Regional Council shall not be liable for any loss or damage arising out of, or in connection with, the use of the information contained in these maps and/or electronic files.
9.Hawke's Bay Regional Council reserves the right to change the content and/or presentation of any of the information contained in these maps at its sole discretion, including these notes and disclaimer.
10.These disclaimers and exclusions shall be governed by, and construed in accordance with, the laws of New Zealand. If any provision of these disclaimers and exclusions is unlawful, void or for any reason unenforceable, that provision shall be deemed severable and shall not affect the validity and enforceability of the remaining provisions.
New
11.The active fault data displayed here are from the New Zealand Active Faults Database (Database), prepared by the Institute of Geological and Nuclear Sciences Limited (GNS Science). The Database includes two sets of active faults (1:250,000 scale and higher resolution) and Fault Avoidance Zones. If the Fault Avoidance Zones are used to assist future land use planning, this should be done in accordance to the Ministry for the Environment 'Planning for Development on or Close to Active Faults' (Kerr et al. 2003).
12.GNS Science does not warrant or represent that the Database is accurate, complete or fit for any particular purpose. GNS Science shall not be liable to any person who uses or relies on the Database, on any ground for any loss, damage or expense arising from such use or reliance. It is made available here for non-commercial use only. GNS Science must be acknowledged as the source of the Database in any publication or other public disclosure where you use the Database.
Zealand Active Faults Database
Hazards Report
COPYRIGHT: Hawkes Bay Regional Council
DISCLAIMER: Information displayed on this product is made available in good faith, but its accuracy or completeness is not guaranteed. The information shown on these maps is compiled from numerous sources, including Hawke’s Bay Regional Council and third-party sources. Copyright is reserved by Hawke’s Bay Regional Council. Use of this product is subject to the disclaimers and copyright statements available at https://hbrc.info/giscp
LIQUEFACTION
Hazards Report
COPYRIGHT: Hawkes Bay Regional Council
DISCLAIMER: Information displayed on this product is made available in good faith, but its accuracy or completeness is not guaranteed. The information shown on these maps is compiled from numerous sources, including Hawke’s Bay Regional Council and third-party sources. Copyright is reserved by Hawke’s Bay Regional Council. Use of this product is subject to the disclaimers and copyright statements available at https://hbrc.info/giscp
Low (cream) means there might be ‘none to minor’ liquefaction for 500 year earthquake shaking (typically larger than magnitude 6), medium (orange) means there might be ‘minor’ to moderate damage, and ‘high’ (brown) might be moderate to severe damage.
In Wairoa District, Central Hawke’s Bay District and the wider Hastings District (outside the Heretaunga Plains) due to the limited data available to assess vulnerabilities, buffer zones have been added to liquefaction hazard areas. The width of this buffer zone is 500 m (+/- 250 m) and allows for the differences between the accuracy of lines on a geological map at a scale of 1:250 000 (+/250m) and the greater accuracy of property boundaries on cadastral maps to be reconciled. If a property is located wholly or partially within the buffer zone this indicates that there is uncertainty about the level of liquefaction hazard. Site specific assessments (ranging from visual inspection through to ground investigations) will be needed to determine the level of liquefaction hazard. If a buffer zone boundary line falls across a property it should initially be treated as being part of the higher hazard class when interpreting the map.
Liquefaction occurs when waterlogged sediments are agitated by an earthquake. As a result, the soil behaves like a liquid, has an inability to support weight and can flow down very gentle slopes. This condition is usually temporary, but buildings can sink and underground pipes may rise to the surface. When the shaking stops, groundwater is squeezed out of the ground causing flooding, leaving areas covered in mud.
Liquefaction effects have been reported in the Hawke's Bay region during four historical earthquakes since 1840 at Modified Mercalli (MM)shaking intensities between MM7 and MM10, including in 1931. Low-lying areas in the region, especially these near the coast, and reclaimed land are particularly susceptible.
What can you do?
If building, it is recommended you reference the Ministry of Business, Innovation & Employment (MBIE) and the Ministry for the Environment document "Planning and engineering guidance for potentially liquefaction-prone land" and if necessary obtain expert advice from a qualified and experienced geotechnical engineer.
Important to note that having land included in a particular zone does not unequivocally mean that the land is "good", "medium" or "bad." The maps indicate what is a strong possibility across those areas. The best areas (cream) have a very low probability of having a liquefaction problem, but there may still be some localised places where the hazard exists. The only sure way of showing whether a specific site has low or high vulnerability is a site specific geotechnical investigation.
On a property already developed, there are options to mitigate the risk of liquefaction, but the easiest way to mitigate liquefaction risk is to ensure your insurance sum-insured is sufficient to rebuild with heavier duty foundations in the event of total loss (noting this could be fire or flood - not just earthquake).
AMPLIFICATION
Hazards Report
COPYRIGHT: Hawkes Bay Regional Council
DISCLAIMER: Information displayed on this product is made available in good faith, but its accuracy or completeness is not guaranteed. The information shown on these maps is compiled from numerous sources, including Hawke’s Bay Regional Council and third-party sources. Copyright is reserved by Hawke’s Bay Regional Council. Use of this product is subject to the disclaimers and copyright statements available at https://hbrc.info/giscp
This amplification map shows areas susceptible to ground shaking in an earthquake. Most of the damage during an earthquake is caused by ground shaking. Seismic waves, travelling through the earth at different speeds and amplitudes because of a fault rupture, cause the ground to vibrate and shake in an earthquake. The intensity of ground shaking at any location is affected by the magnitude of the earthquake, proximity to the source of the earthquake, and the geological material underneath that location. Larger earthquakes generally produce greater shaking and shaking is usually more intense nearer the source of the earthquake.
Different frequencies of shaking also affect buildings differently - in general, low frequency motions affect taller buildings more, while high frequencies affect shorter buildings. The type of material underlying the site can have a great effect on the nature and intensity of the shaking. Sites underlain by hard, stiff material such as bedrock or old compacted sediments usually experience much less shaking than sites located on young, loosely consolidated sediment, which tends to amplify shaking.
What can you do?
Most people in Hawke's Bay will survive a large earthquake with some loss, but some people will be severely affected. If you are developing land in a susceptible area, it is recommended owners/developers obtain expert advice from a qualified and experienced geotechnical engineer before progressing plans.
On a property already developed, the easiest way to mitigate earthquake risk is to ensure your insurance sum-insured is sufficient to rebuild with heavier duty foundations in the event of total loss (noting this could be fire or flood - not just earthquake).
FLOODING
Hazards Report
COPYRIGHT: Hawkes Bay Regional Council
DISCLAIMER: Information displayed on this product is made available in good faith, but its accuracy or completeness is not guaranteed. The information shown on these maps is compiled from numerous sources, including Hawke’s Bay Regional Council and third-party sources. Copyright is reserved by Hawke’s Bay Regional Council. Use of this product is subject to the disclaimers and copyright statements available at https://hbrc.info/giscp
The map shows general details about flooding patterns and areas at risk. There are 3 coloured zones; Blue (flood risk areas), cream (low risk areas) and cross-hatch blue (areas not included in the flood study and which may or may not be susceptible to flooding).
The maps have been produced using computer models using verification with actual events where possible. Flood extents shown in the maps are not meant to show specific flooding details on each property.
These maps should not be relied upon as the sole basis for making any decision in relation to potential flood risk. If further information is required with regards to a specific property, contact:
In the Napier City Council area, that Council has provided modelling results that consider the pipe and street network (pluvial flood model) and its interaction with the open drain network and pumping stations. The results from this assessment are shown for flooding that has a depth of 100mm or more and an area exceeding 100m2. Details of this modelling can be found in the following link to Napier City Council Flood Information web page: https://www.napier.govt.nz/our-council/natural-hazards/flooding
Flood modelling is based on 100-year return period events (1% annual exceedance probability) for major river flood risk areas, and 50-year return period events (2% annual exceedance probability) for urban and floodplain flood risk areas.
The effects of climate change have not been included in this flood modelling, apart from climate adjusted rainfall (RCP8.5, year 2100) in the Napier urban areas.
In some flood risk areas, houses and other structures may be elevated above the ground and would be considered not floodable. These cases are not identified in this flood modelling.
Fluvial vs. Pluvial Flooding
Fluvial flooding happens when the capacity of a river, stream or drain is exceeded, and the water spills on to the adjacent floodplain. Pluvial flooding is associated with heavy localised rainfall which causes ponding to occur in areas where water cannot get to the stream through the normal paths of overland flow, regardless of whether the streams are in flood. The rural flood hazard studies do not consider pluvial type of localised ponding in detail.
Learn more about our flood risks https://www.hbemergency.govt.nz/hazards/storms-and-floods/
What can you do?
If you are thinking about buying a property which is subject to flooding:
1.Get a Land Information Memorandum (LIM) report from the city or district council.
2.Find out about the history of the area. Ask local people who have lived in the area for a long time about events in the past.
3.Check out your potential purchase during a storm.
4.Be aware a resource consent may be required for any new building or additions or extensions to existing buildings on the property.
If you already own a property at risk from flooding, or are near a flood zone, then:
1.Organise a household emergency plan and be prepared to evacuate quickly if necessary.
2.Check the weather forecast regularly as severe weather watches and warning are issued by the MetService and are available via email alerts.
3.If a flood is imminent, lift valuable household items and chemicals as high above the floor as possible. Consider using sandbags to protect your home.
DETENTION DAMS
Hazards Report
COPYRIGHT: Hawkes Bay Regional Council
DISCLAIMER: Information displayed on this product is made available in good faith, but its accuracy or completeness is not guaranteed. The information shown on these maps is compiled from numerous sources, including Hawke’s Bay Regional Council and third-party sources. Copyright is reserved by Hawke’s Bay Regional Council. Use of this product is subject to the disclaimers and copyright statements available at https://hbrc.info/giscp
This map shows zones at risk of damage from water from detention dams. A detention dam is a dam built to catch surface runoff and stream water flow in order to regulate the water flow in areas below the dam. Detention dams are used to reduce the damage caused by flooding and to manage the flow rate through the downstream channels. The reservoir behind the dam is normally dry, and will only fill during severe rainfall.
Failure of a detention dam usually occurs from overtopping or piping:
1. Overtopping of a detention dam occurs when the water level behind the dam exceeds the dam crest height. The dam crest is the top edge of the dam. Overtopping is caused by extreme flooding or severe waves. The severe waves can be a result of high winds, landslides, and earthquakes. If overtopping occurs, the dam may fail due to the erosion caused by the overtopping waters.
2. Piping occurs when seepage through the body of the dam becomes so great that the material that makes up the dam itself is washed away, and the dam can no longer hold the water behind it.
In both failure modes, water, silt and debris would flow down the channel, causing widespread destruction to anything in the flow path.
Most failures of dams occur quite rapidly, and as such there is unlikely to be any substantial warning time for those in the immediate downstream vicinity. However, since the detention dams only fill during times of heavy rain, (and thus these times are the only times the dam is likely to fail) most people are already aware of flooding hazards.
What can you do?
Avoidance of floodable areas is the most effective way to stay safe from the dangers associated with detention dam failures. If you have assets at risk from detention dams, then check the weather forecast regularly as severe weather watches and warning are issued by the MetService and are available via email alerts.
ROAD HIERACHY LIM INFORMATION
Please note: Appendix 22 of the District Plan provides classification of the Napier City Roading Hierarchy.
Arterial Road
Means a road providing interconnections between major sectors of a large area and a link with external areas and which distributes traffic from the motorway and major City links. Traffic volumes are typically greater than 7,000 vehicles per day on urban roads with a significant number of heavy vehicles.
Principle Road
Means a road providing access to Arterial Roads and motorways and having a dominant through vehicular movement. Traffic volumes are typically 3,000 to 7,000 per day on urban roads.
Collector Road
Means a road providing circulation between and within local areas and links to primary roads. Traffic volumes are typically less than 3,000 vehicles per day on urban roads
Local Road
Means a road providing access to adjacent residential, industrial, or commercial areas and typical traffic volumes are less than 1,000 vehicles per day on urban roads.
Contact our Customer Services Team for assistance: info@napier.govt.nz 06 835 7579