13 minute read
4. Assessment of climate change’s impacts on energy system
[ Table 5.5 ] Annual average temperature changes (°C) in comparison with the 2017 baseline
2025 2030 2035 2040 2045 2050 2055
RCP4.5
RCP8.5 0.18 0.29 0.41 0.52 0.63 0.75 0.84
0.31 0.51 0.72 0.93 1.15 1.39 1.62
Source: Authors’ estimations based on RCPs 4.5 & 8.5 scenarios.
Basic energy and environmental data In the generation module, data on power capacity, process efficiencies, capital cost, and operations and maintenance (O&M) costs were taken from Viet Nam’s Nationally Determined Contributions for Energy and Transport Sectors and PDP VIII of Viet Nam.
In other modules (such as natural gas production, oil refining, crude oil production, and coal production), the capacity data and other data on process efficiencies, capital costs, O&M costs, and others were referred to the PDP VIII and other studies or overseas data.
The environmental externality costs are also included in this study. As yet, Viet Nam has not officially carried out any study on the external costs associated with electricity generation. Due to a lack of sufficient data and specific evaluations to calculate externality costs in the power sector, external cost factors are extrapolated from other relevant studies in China, including nitrogen oxides (NOx), sulphur dioxide (SO2), and particulate matter (PM10). The average cost of CO2 control is referred from studies in China and Europe [ H.A Nguyen-Trinh and M. Ha-Duong, 2015 ].
Warming climate data To generate climate change scenarios for Viet Nam, we rely on a national climate dataset (downscaled from outputs of global climate models) that was developed by the Laboratory for REmote sensing and MOdelling of Surface and ATmosphere (REMOSAT) in chapter 1. Specifically, the bias-correction and spatial disaggregation technique [ BCSD; Wood et al., 2002 ] is used to disaggregate global simulations of 31 models contributing to the CMIP5 experiment under emission scenarios RCP4.5 and RCP8.5 to a 0.1 arc-degree resolution. We then estimate daily temperature for Viet Nam (from 1980 to 2005 for the historical simulation and from 2006 to 2100 for future simulations) by averaging daily mean temperature across all grid cells within Viet Nam. The daily time series is then aggregated by calendar year to get an annual time series of temperature over Viet Nam (from 1980 to 2100). This procedure is applied for each of the models available through this project.
Relationship between electricity demand and temperature changes Changes in temperature will result in changes of electricity demand. The relationship between changes in temperature and changes in electricity demand is defined as the proportionate increase in the quantity of demand per 1°C increase in temperature.
Table 5.5 provides an overview of changes in annual average temperature using the 2017
[ Table 5.6 ] The increase rate of electricity demand due to climate change up to 2050
In comparison with 2017 2025 2030 2035 2040 2045 2050
RCP4.5 Residential 0.87% 1.41% 1.99% 2.53% 3.06% 3.65% Industrial 0.78% 1.25% 1.77% 2.24% 2.72% 3.23%
RCP8.5 Residential 1.51% 2.48% 3.50% 4.52% 5.59% 6.76% Industrial 1.34% 2.20% 3.10% 4.01% 4.96% 5.99%
Source: Authors’ estimations.
baseline. We note that each year (as shown in these exhibitions) was used as the notation to represent a specific 20-year period. For instance, “2017 temperature” was averaged using annual temperature for Viet Nam from 2008 to 2027. Similarly, future temperatures were also calculated for each of the 20-year periods (e.g. the 2025 temperature was calculated from annual temperature from 2016 to 2035).
The increase of average temperatures in climate change scenarios compared to those in 2017 is the basis for assessing the impacts of temperature changes on electricity demand in the period 2017–2050. The evaluative results on the impacts of climate change on residential and industrial electricity consumption (as indicate in Section 2.2) indicate that average ambient temperature has significant impacts on electricity consumption. An increase of 1°C in the temperature will result in an increase of 4.86% and 4.31% in residential and industrial electricity consumption, respectively. With these evaluative results, by 2050, the additional increase rate of residential and industrial electricity demand due to climate change will be 3.65% and 3.23% according to RCP4.5 and 6.76% and 5.99% according to RCP8.5 (see Table 5.6). Relationship between hydropower production and rainfall changes The amount of electricity that can be generated from hydropower plants depends not only on the installed generation capacity, but also on the variation in water inflows to the plants reservoirs. Higher precipitation could increase seasonal river flows and water storage in the reservoir. Thus, rainfall changes can directly affect hydropower output.
According to the RCP4.5 scenario, at the beginning of the century, annual rainfall will tend to increase by 5–10% in most of the country. By the mid-century, the rainfall will likely increase by 5–15% in general. Some coastal provinces in the Red River Delta, the North Central Coast and Central Coast may have rainfall rise by above 20%. As in the RCP8.5 scenario, annual rainfall will likely increase in most of the country at the beginning of the century, by 3–10% in general. By the mid-century, the increase trend of annual rainfall will likely be similar to the increase trend of the RCP4.5 scenario.
The evaluative results on the impacts of climate change on hydropower production indicate that hydropower production for all the river basins is projected to increase under
both RCP4.5 and RCP8.5. As shown in Section 3.3, the annual production change could be estimated ranging from -3.5% to +25.7% with RCP4.5 and from -3.3% to +23.1% with RCP8.5 over the future periods in the six main basins.
4.3 Climate change’s impacts on the energy system
The results of modelling the impacts of climate change suggest that, given the assumptions we have made above, climate change’s impacts on electricity demand in both the residential and industrial sectors could result in a significant increase in electricity demand. However, climate change impact on hydropower production suggests that climate change has little or even a positive impact on hydropower generation. Under the climate change scenarios (RCP4.5 and RCP8.5), the additional increase in electricity demand (from BAU scenario) is much higher than the additional increase in hydropower generation, resulting in increased fuels and costs for power generation, as well as primary energy supply and GHG emissions.
Increase in primary energy supply
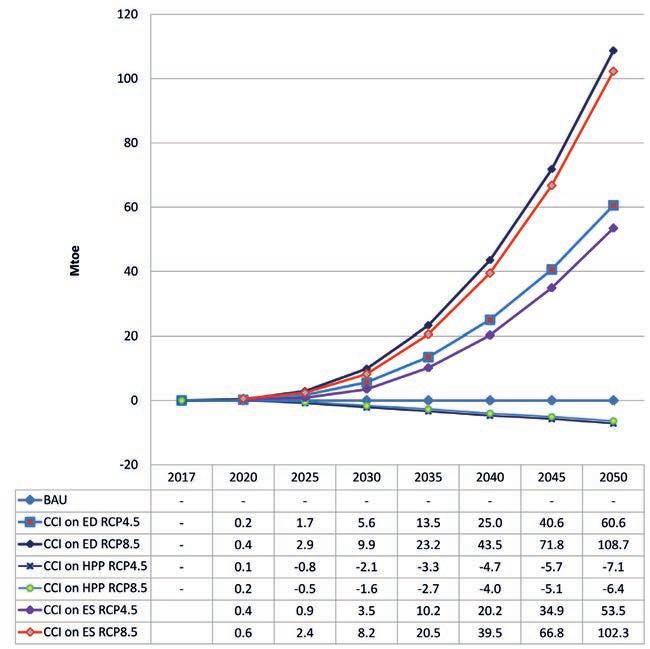
Electricity demand significantly increases from the BAU scenario, due to the increase of temperature, ranging from 2.8% to 5.2% by 2050 under RCP4.5 and RCP8.5 scenarios, respectively. These increases result in corresponding increases of primary energy supply (due to the increase of input fuels for power generation) of 1.3% and 2.4% under RCP4.5 and RCP8.5, respectively. If the whole period from 2017 to 2050 is examined, the total cumulative additional increase of primary energy demand will show a large and rapid increase, from 1.7 Mtoe and 2.9 Mtoe by 2025 to 60.6 Mtoe and 108.7 Mtoe by 2050 under RCP4.5 and RCP8.5, respectively. These additional increases are mostly fuels used for power generation, to meet the additional increase of electricity demand due to climate change.
Contrary to the electricity demand due side, the increase in precipitation due to climate change will drive an increase in electricity generation output from hydropower. However, this increase is negligible and similar in both scenarios RCP4.5 and RCP8.5, ranging from 0.04% to 0.13% of BAU’s electricity generation output during the period 2017–2050. This increase in electricity generation output results in the decrease of other substitute fuels used for power generation, and thus decreases the appropriate primary energy supply demand. The total cumulative decrease of other substitute fuels will be modest, with 7.1 Mtoe and 6.4 Mtoe by 2050 under RCP4.5 and RCP8.5, respectively. This decrease of primary energy supply is smaller than the additional increase in primary energy supply due to the impacts of climate change on electricity demand. On the energy system aspect, the impacts of climate change on the energy system will cause a significant and rapid increase of primary energy demand, with a cumulative additional increase from 0.9 Mtoe and 2.4 Mtoe by 2020 to 53.5 Mtoe and 102.3 Mtoe by 2050 under RCP4.5 and RCP8.5, respectively [ Figure 5.6 ].
As a result of the impact of climate change on electricity demand, the additional increase in fuels for power generation results in additional emissions increases from the power sector from 1.9% to 3.6% by 2050 under RCP4.5
[ Figure 5.6 ] Cumulative total primary energy supply demand up to 2050, CCI scenarios v.s BAU
BAU: Business-As-Usual / CCI on ED = climate change impacts on electricity demand. CCI on HPP = climate change impacts on hydropower production. CCI on ES = climate change impacts on the energy system. Source: Authors’ calculations.
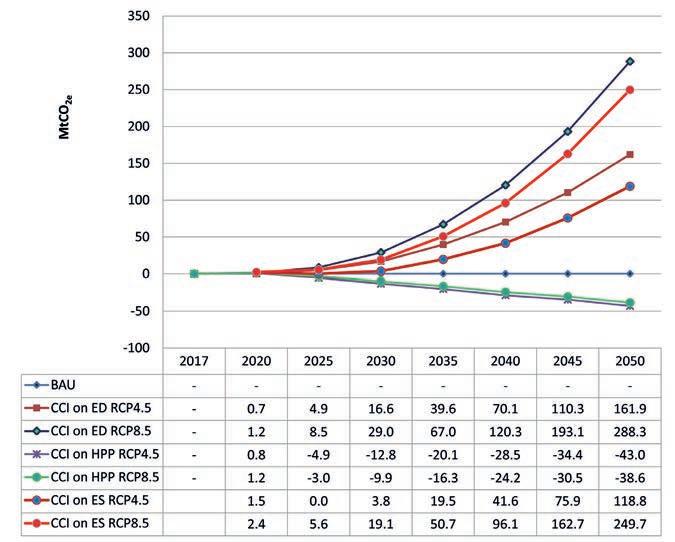
and RCP8.5, respectively. For the whole period 2017–2050, the total cumulative additional increase of emissions in the power sector will be significant, with 161.9 MtCO2e and 288.3 MtCO2e by 2050 under RCP4.5 and RCP8.5, respectively.
Contrary to electricity demand, the decrease of other substitute fuels used for power generation due to the increase in electricity generation output from hydropower under climate change scenarios results in the decrease of CO2 emissions from the power sector. The total cumulative decrease of CO2 emissions from hydropower production will be modest with 43.0 MtCO2e and 38.6 MtCO2e by 2050 under RCP4.5 and RCP8.5, respectively. This decrease in emissions from hydropower is smaller than the additional increase in CO2 emissions due to the impacts of climate change on electricity demand, and with respect to the energy system aspect, the impacts of climate change on the
[ Figure 5.7 ] Cumulative increase emissions in power sector, CCI scenarios v.s BAU

BAU: Business-As-Usual / CCI on ED = climate change impacts on electricity demand. CCI on HPP = climate change impacts on hydropower production. CCI on ES = climate change impacts on the energy system. Source: Authors’ calculations.
energy system will cause a significant increase in CO2 emissions, with a cumulative additional increase of 118.8 MtCO2e and 249.7 MtCO2e by 2050 under RCP4.5 and RCP8.5, respectively [ Figure 5.7 ].
Social cost impact of CCI scenarios
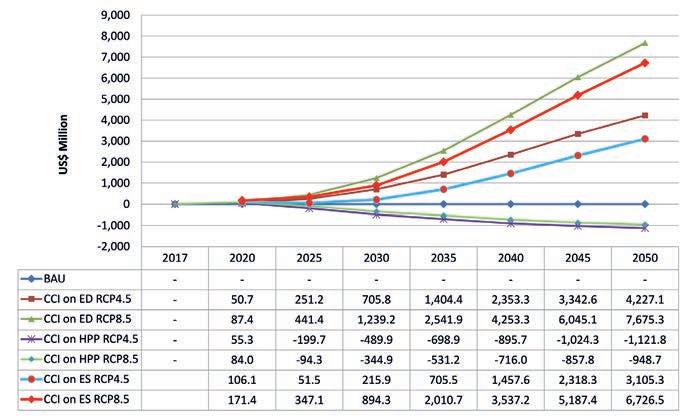
The increase in electricity demand as a result of climate change scenarios results in an increase in the costs for power production, including fuel costs and O&M costs, as well as additional external costs of GHG emissions. The calculation results [ Figure 5.8 ] show that the total cumulative costs of CCIs on electricity demand under RCP4.5 and RCP8.5 in the 2017–2050 period (discounted at 10.0%) are approximately US$ 4,227.1 million and US$ 7,675.3 million, respectively: imported fuel costs account for most of that (at least 80%) in both CCIs, while the remainder represents external costs of GHG (around 10%), and operation and management costs for power generation (see Table 5.7 for more details). On the other hand, the increase in electricity production for hydropower due to CCI scenarios results in a decrease in other input fuels and thus in the costs of power generation, including costs for fuels and O&M costs, as well as additional external costs of GHG emissions.
[ Figure 5.8 ] The results of social-economic impact of climate change on energy system

BAU: Business-As-Usual / CCI on ED = climate change impacts on electricity demand CCI on HPP = climate change impacts on hydropower production CCI on ES = climate change impacts on the energy system. Source: Authors’ calculations.
The calculation results [ Figure 5.8 ] show that total cumulative decreased costs of CCIs on hydropower production under RCP4.5 and RCP8.5 in the 2017–2050 period (discounted at 10.0%) are approximately US$ 1,121.8 million and US$ 948.7 million, respectively: imported fuel costs account for most of that (at least 80%) in both CCIs, while the remainder represents external costs of GHG (around 10%), and operation and management costs for power generation.
The decrease in hydropower’s social costs is smaller than the additional increase in social costs due to the impacts of climate change on electricity demand, and with respect to the energy system, the impacts of climate change on the energy system will cause a significant increase in social costs, with a cumulative additional increase of US$ 3,105.3 million and US$ 6,726.5 million by 2050 under RCP4.5 and RCP8.5, respectively. In both RCP4.5 and RCP8.5, the additional fuels are mostly imported fuels for power generation, which increases dependency on fuel imports and is thus a threat to national energy security.
As analysed above, the impacts of climate change on the energy system can raise electricity demand, mostly for cooling uses, which is likely to lead to an increase in fuel consumption, costs and GHG emissions in power generation. The decreased use of electricity for cooling uses through the promotion of more efficient air conditioners and other electricity-efficient devices may mitigate these impacts of climate change on electricity demand. Similarly, the development of other alternative renewable electricity sources to reduce GHG emissions could be potential measures to respond to climate change.
The proposed adaptation measures responding to climate change are based on a cost-benefit analysis of the technological responses to climate change that are selected, including: Residential energy efficiency air conditioning (EE-AC), residential high efficiency refrigerators (EE-R), residential energy efficiency lighting (EE-L), solar photovoltaic power plants and wind power plants.
This section focuses on the cost-benefit analysis of EE and renewable energy (RE) technologies, based on basic assumptions and input data.
5.1 Basic assumptions
On the demand side, it is assumed that EE technologies such as residential air conditioning, residential refrigerators and residential lighting will penetrate at high rate — at least 75% in rural areas and 90% in urban areas – and that EE technologies in the industrial sector will help save around 5.0% and 6.5% of energy demand by 2030 and 2050, respectively.
On power generation, solar PV and wind technologies are expected to achieve 50,000 MW and 40,000 MW respectively in 2050, replacing imported coal power plants (as referred from PDPVIII-Base case scenario).
Data on the economic and technical specifications of each EE and RE technology option are taken from WB’s study and Viet Nam’s Nationally Determined Contributions for Energy and Transport Sectors.
5.2. Social costs and benefits of proposed adaptation measures
Table 5.7 presents a summary of the results of the social-economic impact of climate change and adaptation measures in response to climate change, including costs and benefits of the impacts implemented in the 2017–2050 period (discounted at 10% ), GHG emission reduction potentials and cost of avoiding GHGs.
From the calculation results [ Table 5.7 ], some comments can be drawn, as follows:
uThe calculations show that the total additional investment costs for wind power plants is US$14,368.6 million, while it can save US$ 13,150.4 million by economising fuel for power generation and reduce 1,521.5 MtCO2e at an abatement cost of US$ 0.8/tCO2e. As for the economic aspect, the total investment cost is slightly higher than benefits, but this option is a good mitigation option with great GHG
savings and low GHG abatement costs: wind power could thus be one of options for adaptation measures. Other remaining measures are feasible because of high economic return and low GHG abatement costs, and could be good solutions in response to the impacts of climate change.
uUnder climate change scenarios, the increase in electricity demand results in an increase in costs for power production and GHG emissions. The total cumulative costs of CCIs in the 2017–2050 period range from US$ 4,227.5 million to US$ 7,675.3 million (including the external costs of GHG emissions), with cumulative additional emissions of 161.9 MtCO2e and 288.3 MtCO2e under RCP4.5 and RCP8.5 respectively.
uThe total costs (including investment costs and O&M costs) of adaptation measures for energy demand in residential and industrial sectors and renewable electricity development are approximately US$ 21,239.7 million, resulting in social benefits of almost US$ 31,770.7 million, with the majority accounted for inreduced fuel imports (US$ 22,948.8 million), while it can also in reduced 2,837.7 MtCO2e at an abatement cost of US$ -3.7/tCO2e. Thus, the implementation of these technology measures can save US$ 10,531.1 million, which is higher than the costs of CCIs on electricity demand in the 2017–2050 period under RCP8.5, by US$ 7,675.3 million at the discount rate of 10%. However, there is uncertainty over the discount rate, which could have a significant impact on the viability on benefits of the proposed measures. With a higher discount rate of 12%, these technology measures can save US$ 5,559.1 million, which is still higher than the costs of CCIs on electricity demand under RCP8.5, by US$ 5,205.0 million. Therefore, implementing these technology measures not only completely eliminates the impacts of climate change, but also significantly contributes to GHG reduction and sustainable economic development. In the case of a higher discount rate of 13%, these technology measures can save only US$ 3,854.7 million, which is lower than the costs of CCIs on electricity demand under RCP8.5, by US$ 4,327.6 million, and become unfeasible.


