5 minute read
3. Salt intrusion
derhoud et al., 2017 ]. While there was little extraction-induced compaction in the 1990s, the rates of aquifer-system compaction increased steadily in the following decades to a delta-average subsidence rate of 11 mm/year, locally exceeding 25 mm/year in 2015 [ Figure 9.7 ]. The accelerating trend in subsidence suggested by the model was confirmed by recent InSAR observations, compared with earlier observations [ Figure 9.5 ].
Subsidence processes in deltas can be distinguished between the larger, regional scale — which causes general landscape lowering — and local events, often causing infrastructural damage and local differential subsidence. In the VMD, two main processes are currently generating high subsidence rates at the regional scale, leading to elevation loss of up to several cm per year: 1 ] natural compaction of shallow sediments, and 2 ] groundwater extraction-induced aquifer-system compaction. Natural shallow compaction rates are highest along the coastline where young fine-grained deposits are present — e.g. (former) mangrove forests in the southern part of the delta — and may reach up to 20–30 mm/year, which can be amplified by anthropogenic land-use change and drainage. Aquifer-system compaction following excessive groundwater extraction has been accelerating in the last decades and may locally reach rates of ~30–40 mm/year, depending on local hydro-geological settings and extraction schemes. Other large-scale processes, such as tectonics, isostacy and hydrocarbon-reservoir compaction, generally cause much lower subsidence rates [ Frederick et al., 2019; Kooi et al., 1998 ], and there is no solid evidence suggesting the VMD is an exception to this. At local scale (e.g., in cities), loading by infrastructure and buildings is an additional significant driver of subsidence. Variable surface loading can cause differential subsidence at small spatial scales, and can cause damage to buildings and infrastructure [ de Wit et al., 2021 ]. Furthermore, other drivers, such as groundwater extraction and drainage, also tend to be larger in urban areas, causing additional subsidence. This explains the subsidence hotspots in Can Tho and other large cities in the VMD.
3.1 Salinity in deltas
Salt intrusion in deltaic surface and groundwater systems is a natural process [ Bierkens and Wada, 2019; Mac Cready and Geyer, 2010; Jay and Dungan Smith, 1990; Monismith et al., 2002; Werner and Simmons, 2009 ]. While fresh-saline dynamics in the groundwater system follow timescales in the order of decades, the dynamics of salt intrusion in the surface waters vary at timescales in the order of hours, influenced by numerous natural and anthropogenic drivers [ Box 9.3 ]. Among the exposures and vulnerabilities, increased salt intrusion is a major threat to livelihoods in deltas. Considering its impact on water supply, food, and job security, agri-/aqua-cultural activities and the ripple effects on the human geography of deltas and beyond, recovery from — or adaptation to — increased salinity can take generations. As in several other deltas worldwide [ Bucx et al., 2014; Echezuría et al., 2002; Gong and Shen, 2011; Hoep-
pner et al., 2008; Kashef, 1983; Nguyen et al., 2017; Rabbani et al., 2013; Ralston and Geyer, 2019; Takeda et al., 2016; Zia et al., 2017 ], the Mekong delta [ Khang et al., 2008; Smajgl et al., 2015 ], is experiencing increased salt intrusion. The trends are observed both in the groundwater and surface water systems, but here we focus on the surface water systems. Many academic or policy documents associate salt intrusion with global sea level rise and more significant drought events [ Mekong Delta Plan, 2013; Khang et al., 2008; Smajgl et al., 2015 ]. Nevertheless, in itself, salt intrusion is a sophisticated three-dimensional phenomenon [ Box 9.3 ] that is highly sensitive to the “local drivers of exposure and vulnerability” [ Oppenheimer et al., 2019 ]. The VMD is exemplar of a system that is stressed under all climatic and anthropogenic drivers. Therefore, a comprehensive process-understanding of the VMD calls for assessing a wider range of geophysical drivers (e.g., See Box 9.3).
3.2 Systems Observations
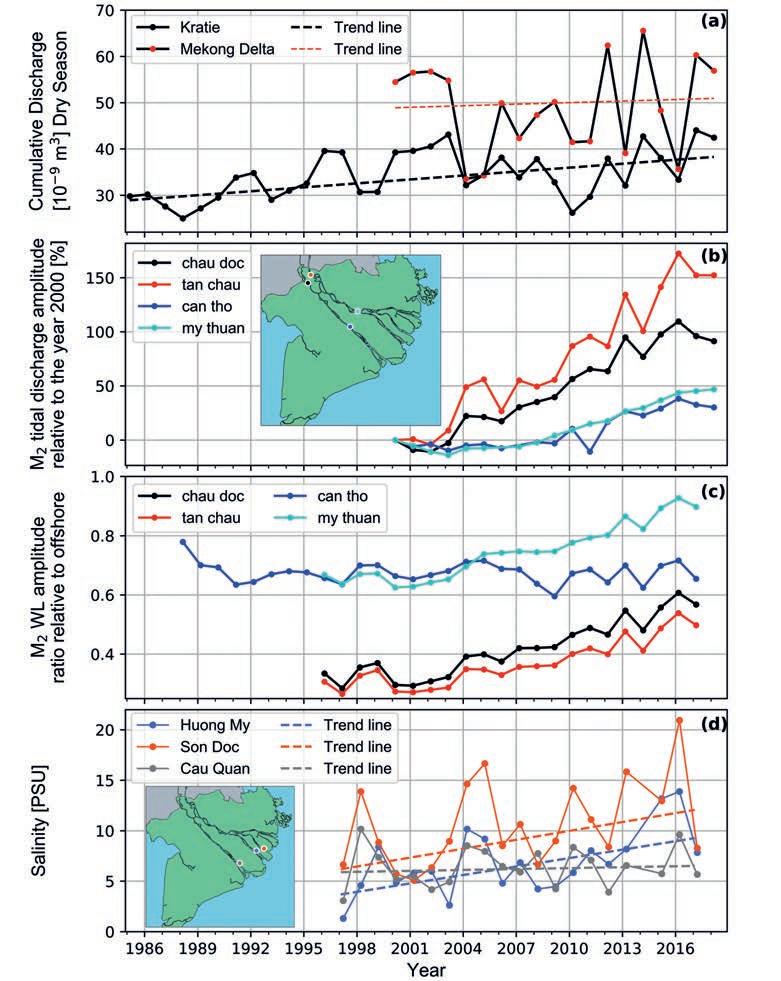
Trends for the highest 5% (P95) observed salinity during the dry season show an average 0.2 PPT/year increase over the last two decades [ Eslami et al., 2019b ] at multiple stations along the main VMD channels [ Figures 9.2 and 9.9d ]. They show a spatial asymmetry: except for the Dinh An distributary of Hau River, all channels show a temporal increase in salt intrusion. In principle, salt intrusion is the outcome of competition between fluvial (discharge) and marine (tidal mixing) forces within a given geometry/bathymetry [ Box 9.3 ]. Figure 9.9.a shows that dry season cumulative discharge of the Mekong River at Kratie, Cambodia, as well as at the stations within the VMD, does not exhibit any declining trend in the last two decades. In fact, cumulative dry season discharge in Kratie has been increasing [ Hoang et al., 2019; Lauri et al., 2012; Li et al., 2017; Hoang et al., 2016; Thompson et al., 2013 ]. While Mekong River discharge has followed an increasing trend, due to the declining role of the Lake Tonle Sap [ chapter 7 ], freshwater supply to the delta has not increased. However, the fact that there is no clear decline in total discharge implies that increased salt intrusion is driven by other environmental drivers.
On the contrary, the tidal discharge amplitude (horizontal tide, Figure 9.9b) relative to the year 2000 shows a consistent and significant increasing trend at all stations, varying from 40% in Can Tho and My Thuan with larger tidal discharge, to 150% in Tan Chau with smaller tidal discharge. At the same time, tidal water level amplitude (vertical tide, Figure 9.9c) relative to offshore shows a substantial increase, except in Can Tho. While offshore tidal amplitude has increased by ~1.2–2 mm/year due to sea level rise [ Nhan, 2016 ], vertical tidal amplification within the VMD has followed an approximately 15–20 mm/year trend. Significant tidal amplification, along with increasing trends of tidal propagation speed [ Eslami et al., 2019b ], provides solid evidence of a substantial increase in river depths, which explains the adaptation of the salinity structure to the new condition. The tidal dynamics [ Eslami et al., 2019b ], validated by hydrographic observations [ Binh et al., 2020; Eslami et al., 2019b; Vasilopoulos et al., 2020 ], imply an average 2–3 m riverbed incision over the past two decades. When two (ocean forces and bathymetry) out of the three main determinants of salt intrusion change, this results in a new estuarine salinity balance that is characterized by further intrusion.
[ Figure 9.9 ] Hydrological and hydrodynamic changes over the last decades
Dry season cumulative discharge of the Mekong River and cumulative fluvial discharge to the delta and its trends (a); tidal discharge variation relative to the year 2000 (b); changes in tidal amplitude relative to offshore indicating tidal amplification in the delta (c); trends of salinity (P95) variations at three different stations along the estuaries of the delta.

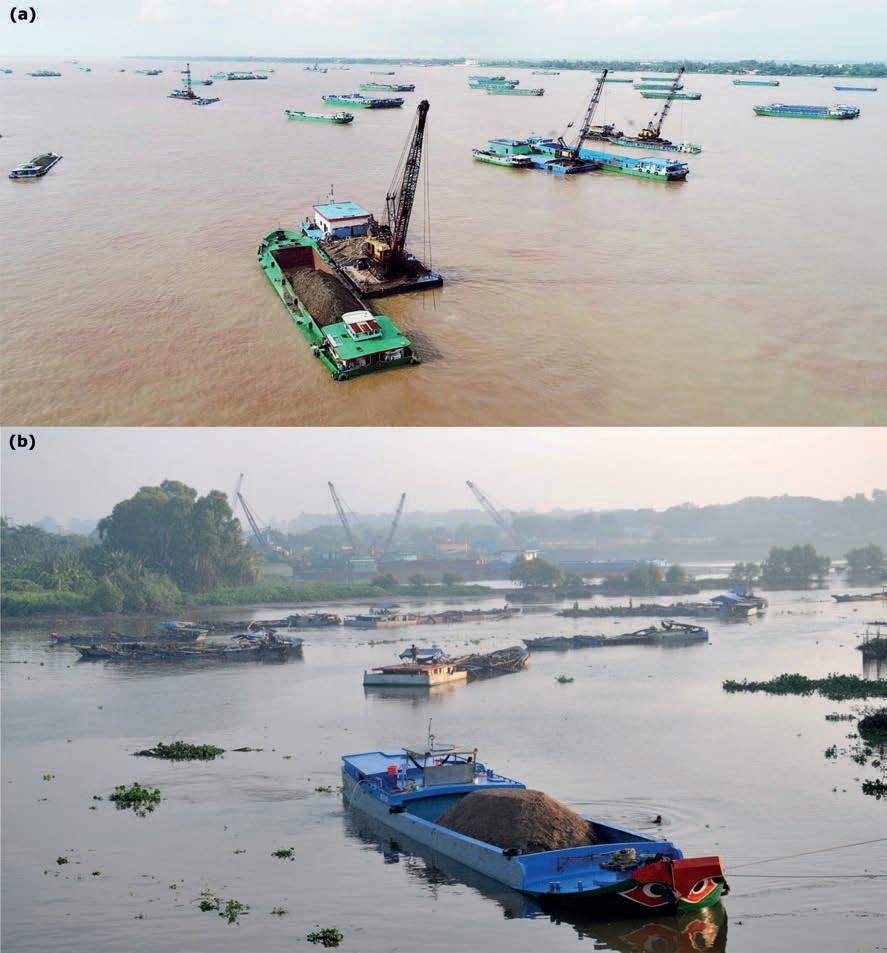
[ Figure 9.10 ] Sand mining in the delta Sand mining and sand barges in An Giang (a) and Tien Giang (b) provinces, Viet Nam. Pictures: Courtesy of Huynh Buu Dau / Tuoi Tre News.


